
 Open Access Article
 This Open Access Article is licensed under a
 Creative Commons Attribution 3.0 Unported Licence
Comparing the microstructure and photovoltaic performance of 3 perylene imide acceptors with similar energy levels but different packing tendencies†
Rana
Adel‡
 a,
Elena
Gala‡
bc,
Matías J.
Alonso-Navarro
bc,
Edgar
Gutierrez-Fernandez
d,
Jaime
Martín
def,
Marco
Stella
g,
Eugenia
Martinez-Ferrero
g,
Alejandro
de la Peña
bc,
Alexandra
Harbuzaru
h,
M. Mar
Ramos
c,
Rocío Ponce
Ortiz
h,
José L.
Segura
*b and
Mariano
Campoy-Quiles
*a
a,
Elena
Gala‡
bc,
Matías J.
Alonso-Navarro
bc,
Edgar
Gutierrez-Fernandez
d,
Jaime
Martín
def,
Marco
Stella
g,
Eugenia
Martinez-Ferrero
g,
Alejandro
de la Peña
bc,
Alexandra
Harbuzaru
h,
M. Mar
Ramos
c,
Rocío Ponce
Ortiz
h,
José L.
Segura
*b and
Mariano
Campoy-Quiles
*a
aInstitut de Ciència de Materials de Barcelona, ICMAB-CSIC, Campus UAB, 08193, Bellaterra, Spain. E-mail: m.campoy@csic.es; mcampoy@icmab.es
bDepartamento Química Orgánica I, Facultad Ciencias Químicas, Universidad Complutense de Madrid, E-28040, Madrid, Spain. E-mail: segura@ucm.es
cDepartamento de Tecnología Química y Ambiental, Univ. Rey Juan Carlos, Móstoles, 28933, Spain
dPOLYMAT, University of the Basque Country UPV/EHU Av. de Tolosa 72, 20018, San Sebastián, Spain
eIkerbasque Basque Foundation for Science, Bilbao 48013, Spain
fUniversidade da Coruña, Grupo de Polímeros, Centro de Investigacións Tecnolóxicas (CIT), Esteiro, 15471 Ferrol, Spain
gEurecat Centre Tecnológic de Catalunya, Unit of Printed Electronics & Embedded Devices, 08302, Mataró, Spain
hDepartmento de Química Física, Universidad de Málaga, Málaga, 29071, Spain
First published on 7th January 2022
Abstract
While it is widely recognized that microstructure plays an important role in the performance of organic photovoltaics (OPV), systematic studies are often challenging, as varying the molecular packing through typical chemical means (such as sidechain tuning) often affects the molecular energy levels, thus preventing a clear correlation. In this work we present the synthesis of three perylene imide (PI) based electron acceptors with almost identical energy levels, but distinct packing tendencies. We confirm our initial hypothesis by measuring solution and solid-state absorption, and cyclic voltammetry as well as characterizing the films by grazing incidence wide angle X-ray scattering (GIWAXS). In a second step, we repeat the characterization of the three materials in blends with two polymer donors, namely PCDTBT or PBDBT, whose energy levels are well aligned with those of the PI acceptors, and which, additionally, exhibit different degrees of structural order. We show how the initial strong difference between acceptors is partially blurred in blends, but still critical. Finally, we correlate our structural data with OPV devices made with the corresponding six blends. Our data suggest that a good donor acceptor marriage should ensure good energy alignment but also exhibit complementary crystallization tendencies of the two components.
Introduction
Efficient, stable and low cost organic photovoltaic (OPV) devices are gaining attention due to their high potential for sustainable, large-scale production via solution deposition methods resulting in light-weight, high-flexibility systems.1 Much of the progress has been associated with the synthesis of improved materials following several criteria.2 Fullerene based acceptors have been widely used in OPV devices due to their high charge mobilities, deep LUMO level and efficient exciton separation that make them good electron conductors.1 However, their poor absorption limits their capability to harvest the solar spectrum. OPV device efficiencies have boosted beyond the 18%3 milestone thanks to the rapid development of non-fullerene molecular acceptors (NFAs). The development of efficient electron acceptors has, indeed, been a persistent attempt to develop large-area flexible OPV devices.4,5Rylene imides such as perylene imides (PI)6 and naphthalene imide5–9 are among the most studied n-type materials in organic (opto)electronics because of their inherent electron deficient character which provides unique opportunities to conjugate electron-withdrawing moieties at different regions of a variety of π-scaffolds. Certainly, PIs are gaining great interest as non-fullerene acceptors in OPV devices and the photoconversion efficiencies (PCEs) of PI-based OPV systems have reached 9–10%.2,10–18 PIs are interesting materials not only because they absorb light in the visible region improving the light harvesting,19 but also because of their high photostability, low cost synthesis20 and adaptability to solution-processing. However, PI molecules have a high tendency to aggregate due to the π–π interactions between perylene cores, often leading to highly ordered column-like structures. The aggregation of the PI molecules has also an impact on their (opto)electronic properties.21 Thus, the formation of aggregates is considered as a source of charge carrier trapping,22 while changing morphology may affect the electrical conductivity in solid state films.23
The control of the morphology in OPVs based on PI molecules has been addressed by means of three different strategies:22 (i) by using block copolymers with inherent nanophase separation such as those reported by Laju Bu and co-workers with PCE of up to 1.5% that are based on monodisperse co-oligomers of electron donors with PIs;24 (ii) by precisely tuning the molecular architecture of perylene diimides (PDIs) as demonstrated by Rajaram and co-workers that obtained PCE values of 2.77% through combination of a hole-transporting polymer and a nonplanar PI derivative;25 (iii) by educated guesses aimed at controlling the crystallization in thin films of PI-based materials through variations in the processing conditions and partner polymers to achieve good compatibility between components. Unfortunately, rational guidelines to control the crystallization of PI derivatives in OPV blend films have not been established yet.
In this article, we report on the synthesis of a family of perylene imide-based electron acceptors with almost identical energy levels, but distinct molecular geometries and packing tendencies. The structure of the molecules can be finely tuned by using a common synthetic route starting from a functionalized perylene-imide derivative by reactions with different cores to yield PIPB which is planar molecule with monoatomic thickness, 3PIPT with a planar structure with monomolecular thickness based on the triptycene moiety, and 4PIPM with a three-dimensional structure based on the tetraphenylmethane core (Fig. 1). A combined study of their solid-state absorption and emission, together with the characterization of their electrochemical properties and the characterization of films by grazing incident wide angle X-rays (GIWAXs) is presented. In addition, blends based on the novel acceptors together with two polymer donors were also investigated. The two polymers, namely poly[N-9′-heptadecanyl-2,7-carbazole-alt-5,5-(4′,7′-di-2-thienyl-2′,1′,3′-benzothiadiazole)] (PCDTBT) and poly[(2,6-(4,8-bis(5-(2-ethylhexyl)thiophen-2-yl)-benzo[1,2-b![[thin space (1/6-em)]](https://www.rsc.org/images/entities/char_2009.gif) :4,5-b′]dithiophene))-alt-(5,5-(1′,3′-di-2-thienyl-5′,7′-bis(2-ethylhexyl)benzo[1′,2′-c:4′,5′-c′]dithiophene-4,8-dione))] (PBDBT) (Fig. 1), have energy levels well aligned with those of the PI acceptors, and, additionally, exhibit different degree of structural order.26 The characterization of the three electron acceptor materials in blends with the two polymer donors allows us to analyse the impact of the different initial molecular stacking tendency on the resulting blend microstructure, and how the latter affects photovoltaic performance. While final device efficiencies are modest, we can still establish interesting connections between single component microstructure and that of the corresponding blend, as well as ideas on how to choose blend partner in terms of microstructure compatibility.
:4,5-b′]dithiophene))-alt-(5,5-(1′,3′-di-2-thienyl-5′,7′-bis(2-ethylhexyl)benzo[1′,2′-c:4′,5′-c′]dithiophene-4,8-dione))] (PBDBT) (Fig. 1), have energy levels well aligned with those of the PI acceptors, and, additionally, exhibit different degree of structural order.26 The characterization of the three electron acceptor materials in blends with the two polymer donors allows us to analyse the impact of the different initial molecular stacking tendency on the resulting blend microstructure, and how the latter affects photovoltaic performance. While final device efficiencies are modest, we can still establish interesting connections between single component microstructure and that of the corresponding blend, as well as ideas on how to choose blend partner in terms of microstructure compatibility.
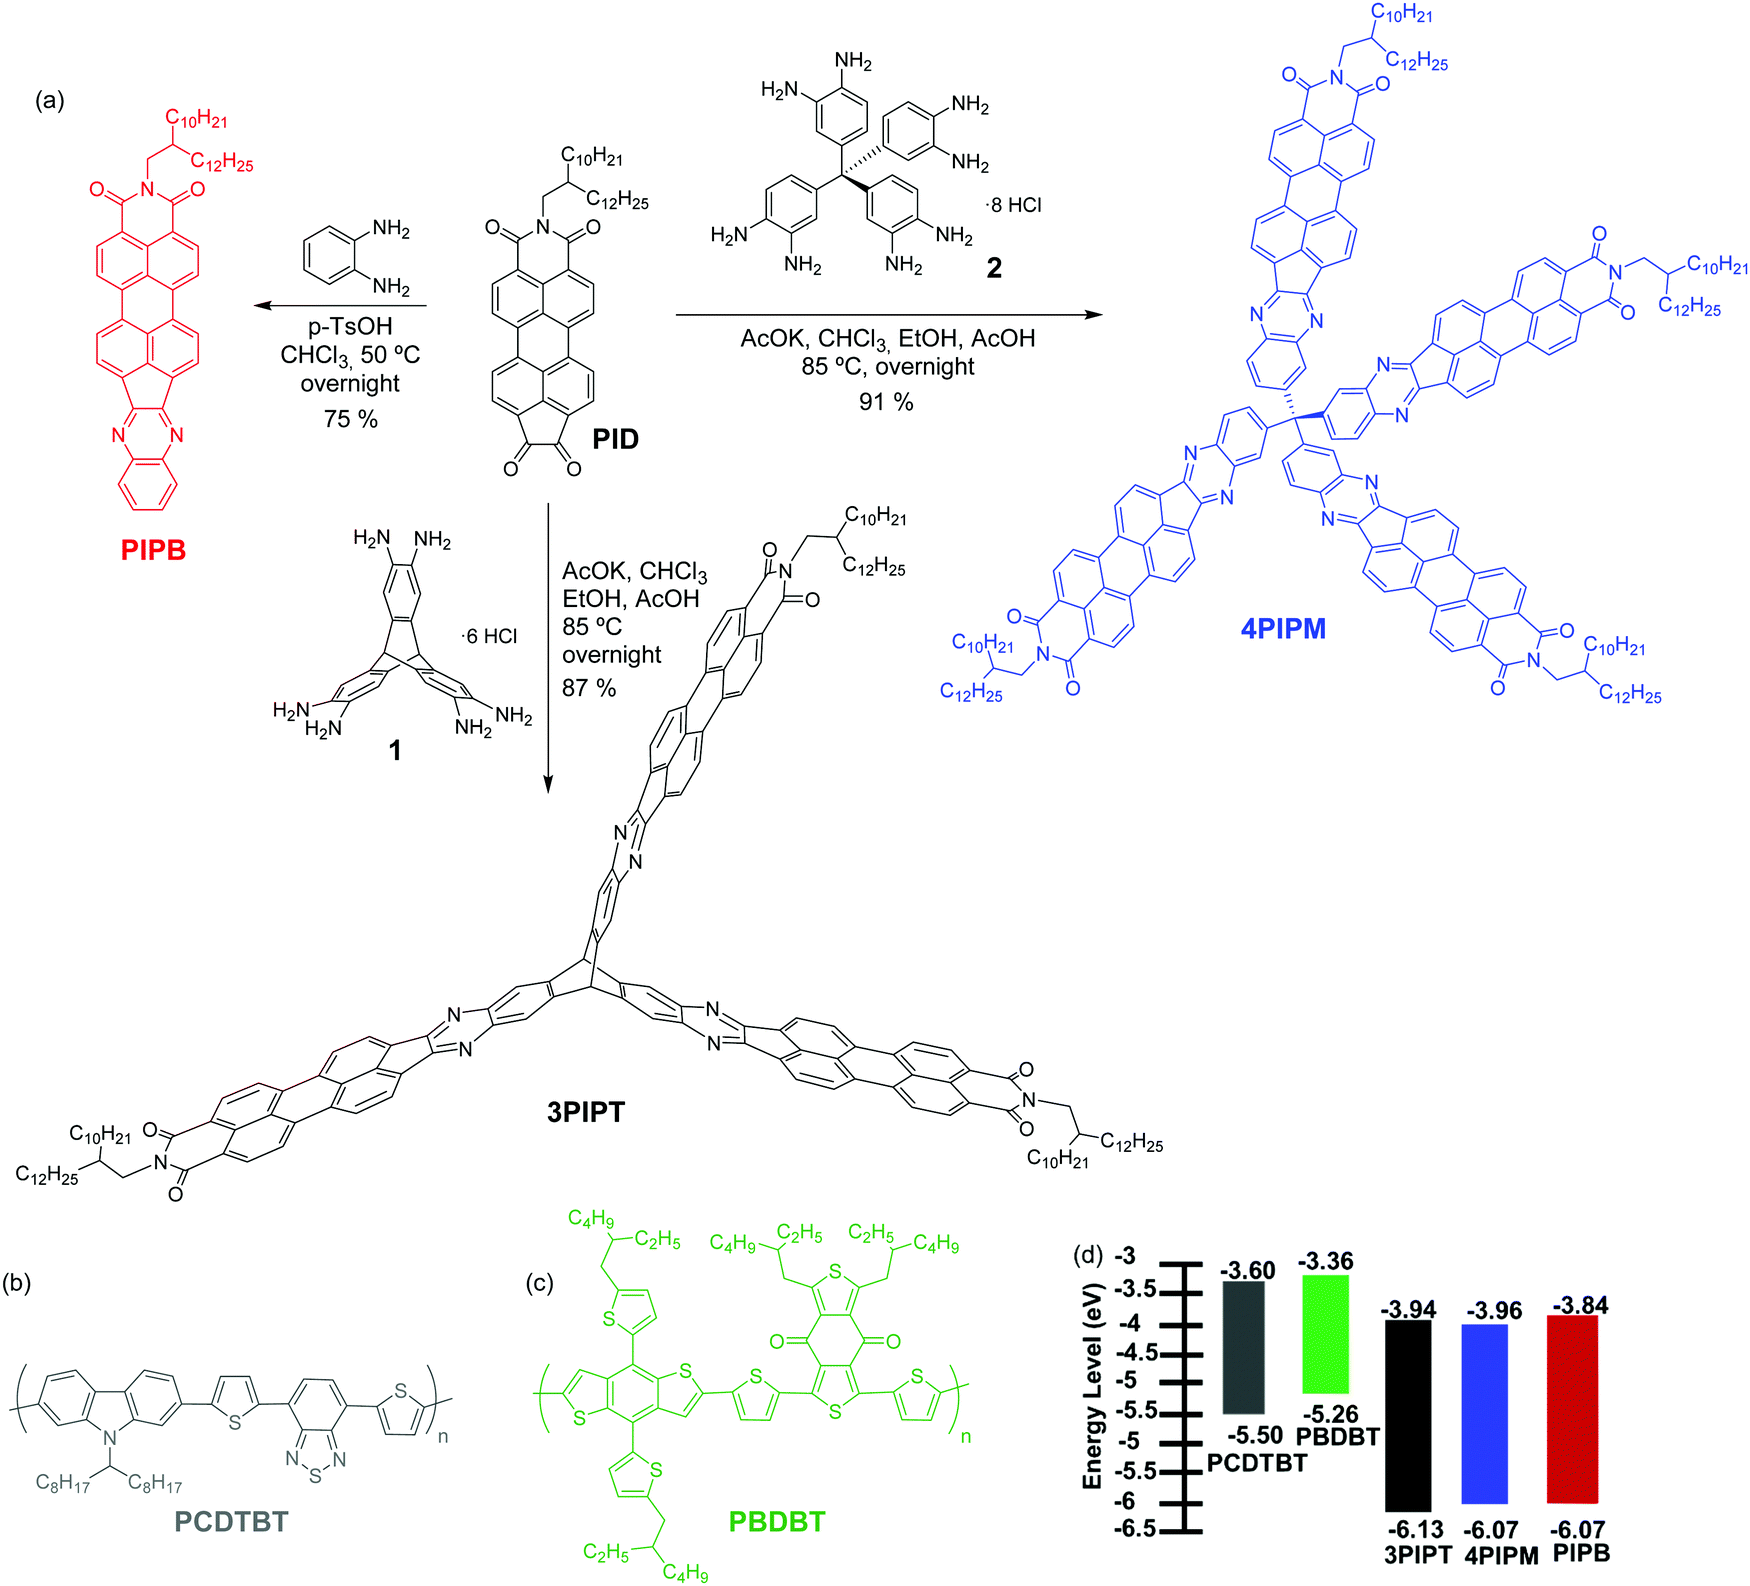 | ||
| Fig. 1 (a) Synthesis of PIPB, 3PIPT and 4PIPM; the molecular structure of (b) PCDTBT, (c) PBDBT and (d) the energy levels of all the molecules deduced from cyclic voltammetry and UV-Visible. | ||
Results and discussion
Synthesis and characterization of new acceptor materials PIPB, 3PIPT and 4PIPM
Three novel non-fullerene acceptors (NFA), PIPB, 3PIPT and 4PIPM were designed and obtained by condensation reactions between building blocks with different dimensionality endowed with o-phenylenediamine functionalities and a perylenimide diketone PID, obtained by a five step synthetic route previously developed in our research group (Fig. 1 and Scheme S2, ESI†).27 The three novel compounds were easily purified by medium pressure liquid chromatography and have relatively good solubilities in chlorinated solvents such as chloroform, dichloromethane and chlorobenzene.The optimization of the lowest energy molecular structures of the novel NFAs was accomplished by using the DFT exchange correlation functional B3LYP/6-31* level. Long branched alkyl chains at the imide groups are replaced by methyl groups to simplify the calculations. For the linear compound PIPB, the frontier molecular HOMO and LUMO orbitals are spread all over the molecule, as it has already been observed for other similar compounds.28 In the case of 3PIPT, the HOMO is spread over the three perylene cores whereas, the LUMO/LUMO+1 orbitals are found to be degenerated due to molecular symmetry. As a consequence, the combination of the two degenerated orbitals also shows wave function delocalization over the three branches.29,30 Note, however, that minimal contribution of the triptycene central unit to the frontier molecular orbitals is observed (Fig. 2). The absence of the triptycene contribution to the frontier molecular orbitals precludes the homoconjugation effect already observed in other iptycene derivatives.31,32 For 4PIPM, a similar scenario is found, where the tetraphenylmethane core minimally contributes to the frontier molecular orbitals.
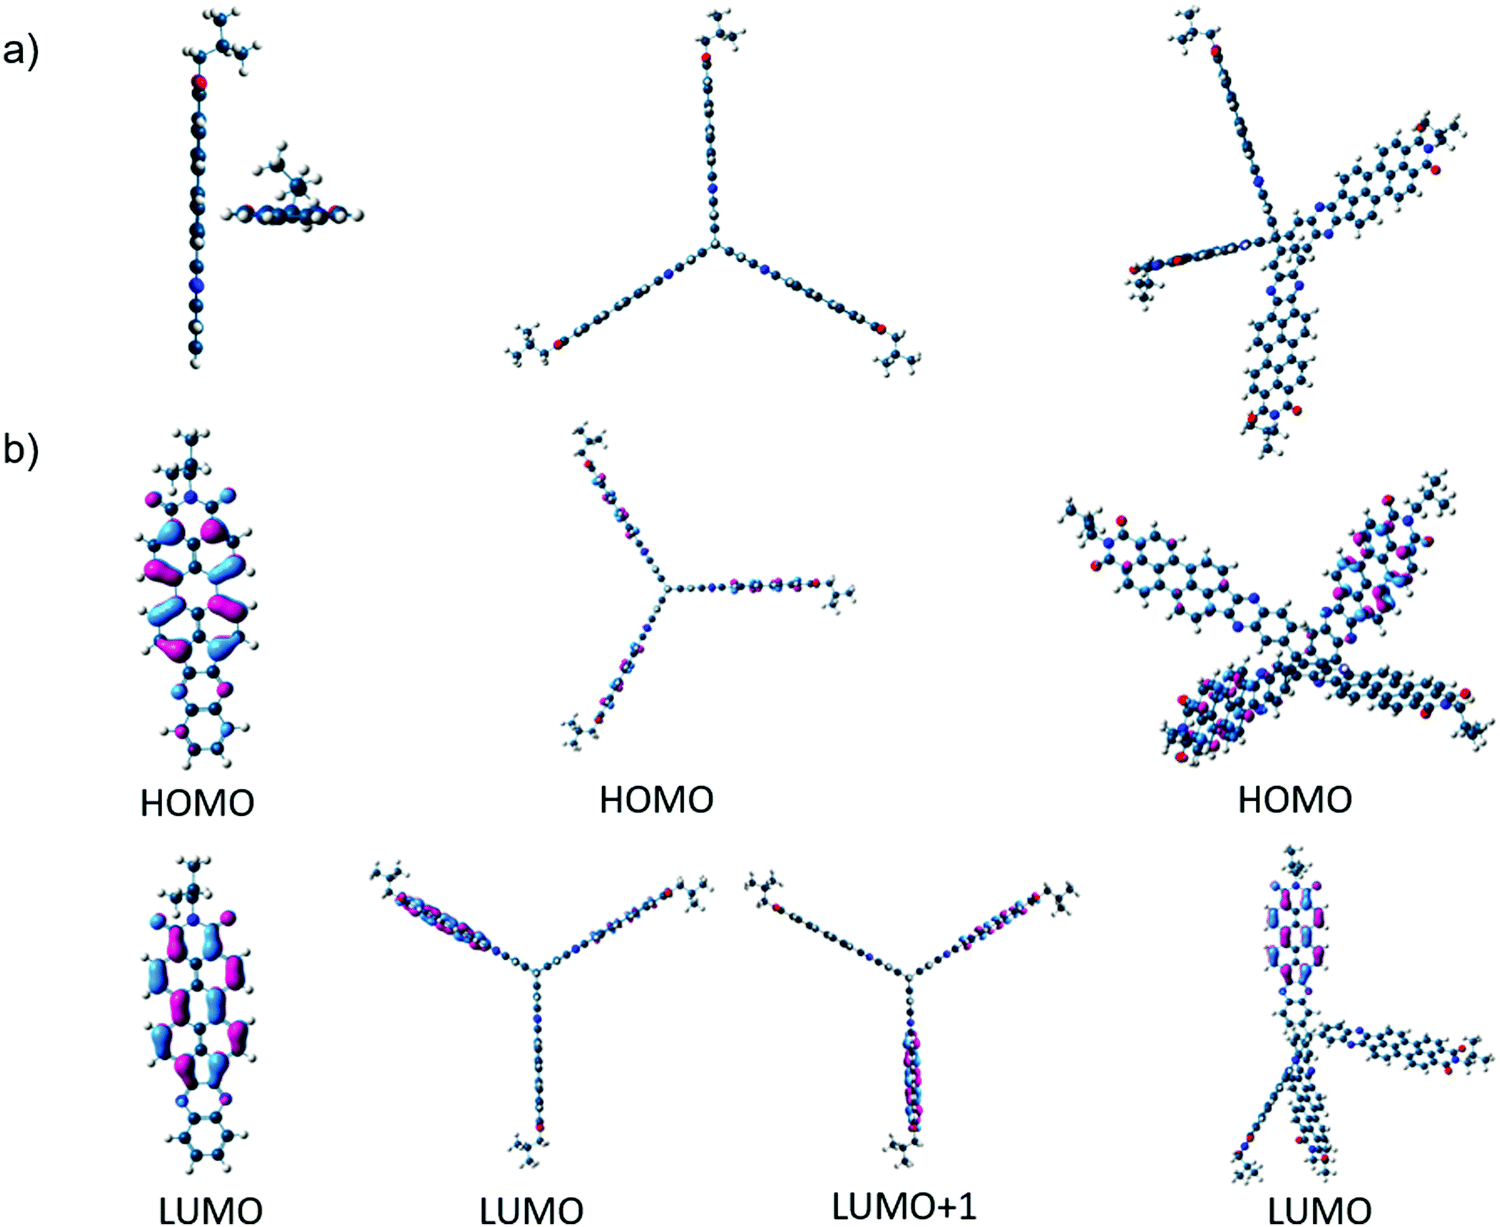 | ||
| Fig. 2 (a) G16 DFT/B3LYP/6-31* optimized molecular structures for the semiconductors under study and (b) molecular orbital topologies of PIPB (left), 3PIPT (middle) and 4PIPM (right). | ||
To gain some insight into the electrochemical and optical properties of the three NFAs, they were characterized by cyclic voltammetry and UV-Visible and fluorescence spectroscopies. Table 1 summarizes all the relevant data, including the experimental LUMO and HOMO energies obtained from the electrochemical and optical studies.
| Acceptor | λ abs | ε | λ onset | E g | λ em |
E
1/2redIe |
E 1/2redII | E LUMO | E HOMO |
|---|---|---|---|---|---|---|---|---|---|
| a Wavelength in nm in CHCl3 solution. Maxima italicized. b Shoulder. c Molar extinction coefficient in M−1 cm−1 at λmax in solution. d Energy band gap (in eV) derived from the low-energy absorption edge. e Values in V estimated from cyclic voltammetry in DCM/TBAPF6 (0.1 M) at a scan rate of 0.15 V s−1 using Pt as working and the counter electrode and Fc/Fc+ as reference. f Values in eV, estimated from ELUMO = −5.1 eV − E1/2redI. g Values in eV, estimated from EHOMO = ELUMO − Eoptg. | |||||||||
| PIPB | 323, 364, 379, 463, 496, 534 | 1.67 × 10⁵ | 555 | 2.23 | 545, 588, 637b | −1.26 | −1.44 | −3.84 | −6.07 |
| 3PIPT | 337, 395, 470, 501, 540 | 3.26 × 10⁵ | 566 | 2.19 | 548, 592, 640b | −1.16 | −1.38 | −3.94 | −6.13 |
| 4PIPM | 331, 368b, 388, 471b, 503, 541 | 3.14 × 10⁵ | 587 | 2.11 | 546, 590, 638b | −1.14 | −1.39 | −3.96 | −6.07 |
Redox potentials were determined as the midpoints of the forward and reverse scans in cyclic voltammograms (Fig. 3b) carried out in dichloromethane solutions in a standard electrochemical cell where platinum electrode, platinum–wire electrode and Ag/Ag+ electrode were used as working electrode, auxiliary electrode and reference electrode, respectively. Tetrabutylammonium hexafluorophosphate (0.1 M) was used as the electrolyte and potentials were recorded versus Fc/Fc+. The fingerprint of the cyclic voltammetry characterization of peryleneimides involves the presence two sequential one-electron cathodic waves, corresponding to the formation of the radical anion and the dianion, respectively.33 For systems bearing more than one ryleneimide moiety, the number of redox processes observed is related to the electronic communication or lack of electronic communication between the rylenemimide moieties. Thus, the splitting of the reduction potentials is indicative of electronic communication between ryleneimide redox centers.34 In contrast, only two distinct reversible waves are observed in assemblies with several ryleneimide moieties without electronic communication between the ryleneimide redox centers.35 For PIPB, 3PIPT and 4PIPM, only two sequential reduction processes (Fig. 3b) are observed in their cyclic voltammetry measurements thus indicating that the peryleneimide moieties reduce simultaneously to the corresponding radical anions and dianions due to the lack of significant electronic communication between the peryleneimide moieties in the multichromophoric systems (3PIPT and 4PIPM). The potential values obtained for these processes lie in the range of those observed for good n-type semiconducting materials.36
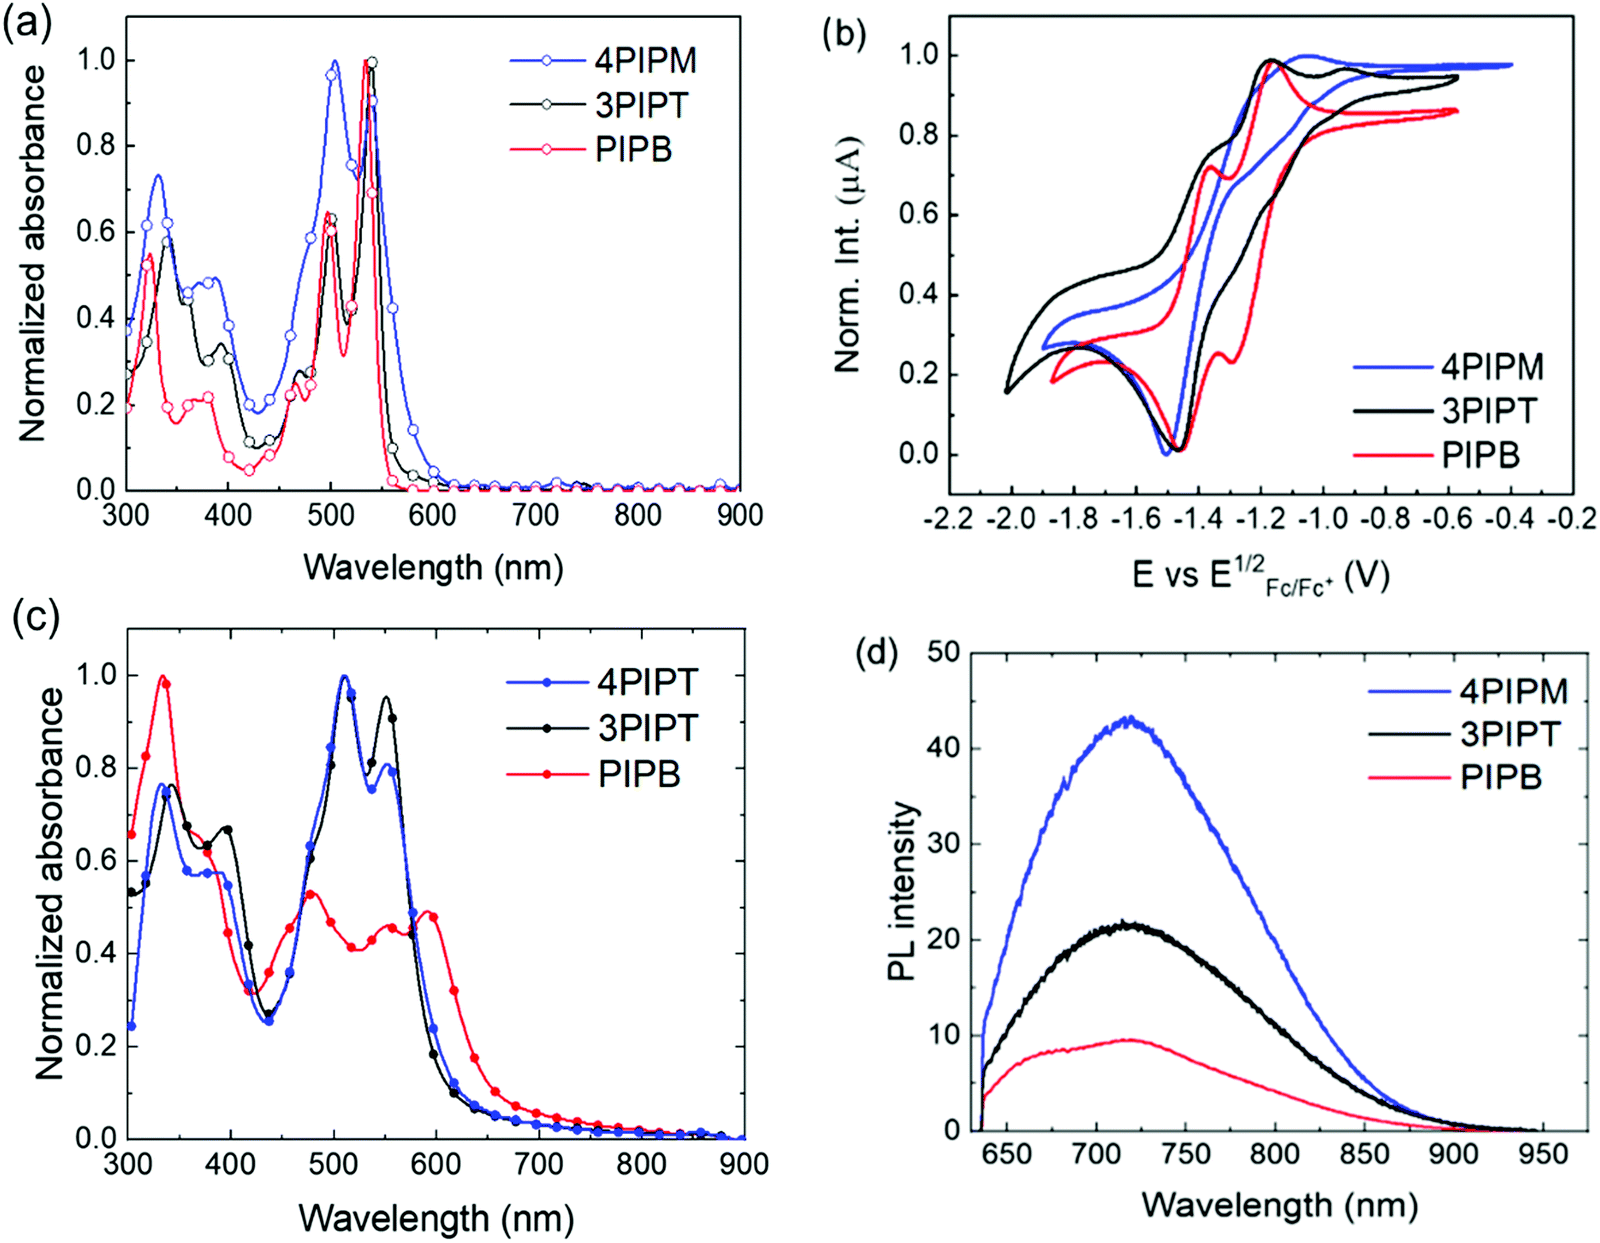 | ||
| Fig. 3 (a) Normalized optical absorption of 5 × 10⁻⁶ M solutions in chloroform, (b) cyclic voltammograms measured in dichloromethane, (c) normalized solid state UV-Vis absorption spectra and (d) photoluminescence spectra of PIPB (red), 3PIPT (black) and 4PIPM (blue) films. | ||
From the first reduction potentials obtained by the cyclic voltammetry measurements it is possible to estimate the LUMO energies of the novel arylenimide assemblies by using standard approximations.37,38 Because no oxidation processes could be detected within the solvent/electrolyte window (Fig. S25, ESI†), it is not possible to estimate the HOMO energies from the oxidation potentials. However, they can be estimated by using the LUMO energies and the optical band gaps by using the equation EHOMO = Eoptg + ELUMO.39 Accordingly, for these three new systems, the estimation of the lowest unoccupied molecular orbital (LUMO) energies are −3.84 eV, −3.94 eV and −3.96 eV for PIPB, 3PIPT and 4PIPM and the values estimated for the highest occupied molecular orbital (HOMO) energies are −6.07 eV, −6.13 eV and −6.07 eV for PIPB, 3PIPT and 4PIPM (Table 1).
UV-Vis and fluorescence spectra were recorded in chloroform solutions and the data obtained are summarized in Table 1. Characteristic absorption bands of perylenimide derivatives were observed for the three novel NFAs. For PIPB, the peaks with the highest intensities can be observed at 497 nm and 535 nm corresponding to the 0–0 and 0–1 vibronic bands of the S0–S1 transition. On the other hand, the band with a maximum at 465 nm can be ascribed to the electronic S0–S2 transition (Fig. 3a). A similar pattern but slightly red shifted can be observed in the UV-vis spectra of systems with higher dimensionality 3PIPT and 4PIPM. The concentration-dependent UV-vis absorption spectra of these compounds in chloroform shows a bathochromic shift and the (0,1) vibronic band shows an increase relative to the (0,0) transition (Fig. S21–S23, ESI†). This is a typical behaviour of aggregated perylenimide chromophores. Strong vibronic coupling in the aggregates results in an enhanced (0,1) vibronic band compared to non-aggregated PDI molecules. Thus, upon aggregation of PDI derivatives, the ratio of the intensities of the (0,0) and the (0,1) transitions decreases, which is often used as an indication of aggregation40–44 that can be rationalized by the molecular exciton model.45–47 This behaviour is especially remarkable for 4PIPM for which the effect of self-aggregation could be observed even at concentrations as low as 10−7 M. The molar extinction coefficient (ε) estimated for PIPB was 167197 M−1 cm−1, almost half of that observed for the derivatives with higher dimensionality: 326029 M−1 cm−1 for 3PIPT and 313757 M−1 cm−1 for 4PIPM (Table 1). Emission spectra were also recorded in chloroform solutions and the bands observed correspond to the emission from the lowest energy transitions described for the absorption spectra (Fig. S24, ESI†).
The optical properties of the novel semiconductors were also investigated in the solid state by UV-vis and fluorescence spectroscopies. Thin films of PIPB, 3PIPT and 4PIPM were prepared by blade coating from chloroform:chlorobenzene (CF:CB 3:1 VR) solutions. (This mixture of solvents was found to lead to the highest efficiencies in OPVs based on these materials, as we will explain below). Solid-state UV-Vis spectra confirmed the high tendency of the new acceptors to form aggregates. For PIPB, a bathochromic shift of 55 nm and an inversion of the relative intensities of the absorption signals corresponding to the (0,0) and (0,1) transitions were observed in comparison with that observed in the solution spectrum (Fig. 3c). On the other hand, for the three-dimensional derivatives, 3PIPT and 4PIPM, the only noticeable change observed was the inversion of the relative intensity of the aforementioned bands (Fig. 3c). The thin film photoluminescence spectra of PIPB, 3PIPT and 4PIPM are shown in Fig. 3d. After laser excitation at 633 nm, the three systems show emission up to 900 nm, with emission maxima at 721 nm for the three systems. An additional relative maximum peaking at 673 nm was observed only for PIPB.
The solid-state molecular packing of PIPB, 3PIPT and 4PIPM was studied by grazing-incidence wide-angle X-ray scattering (GIWAXS). Shown in Fig. 4 are the 2D patterns obtained and their corresponding intensity profiles along the out-of-plane (OOP, z) and in plane (IP, r) directions. The pattern for the mono-adduct PIPB shows distinctive oriented and well-defined Bragg peaks, denoting a significant degree of crystallinity. Because the peak showing up at qr = 18 nm−1 (d ∼ 0.35 nm) along the in-plane direction is presumably associated with the π–π stacked planes, we argue that molecules in this sample are oriented edge-on with respect to the substrate. For the higher dimensionality adducts, i.e.3PIPT and 4PIPM, the formation of well-ordered structures seems to be hindered. Thus, the GIWAXS pattern for 3PIPT exhibits broad, isotropic reflections, characteristic of an eminently disordered packing. Interestingly, the compound with four perylenimide units, 4PIPM, features some degree of regular packing, as suggested by the presence of a weak peak at qz = 3.5 nm−1 and a noticeable bump at qz = qr = 17.5 nm−1. Hence, our analysis reveals a different degree of lamellar packing in the neat films of the 3 compounds, ranging from an amorphous and isotropic structure for 3PIPT to highly crystalline films for PIPB films. The above packing behaviour can be rationalized by considering that the planar structure of PIPB allows for the formation of well-ordered films through π–π stacking. On the other hand, 4PIPM has four branches linked to the tetraphenylmethane core by single bonds, and thus are relatively free for rotations around several planes, which we propose that helps the molecule to induce a certain lamellar packing and a weak π–π stacking. Finally, in 3PIPT the three branches are fixed perpendicular to the main plane of the molecule, which hinders molecular motion during solidification, thus leading to an overall amorphous structure.
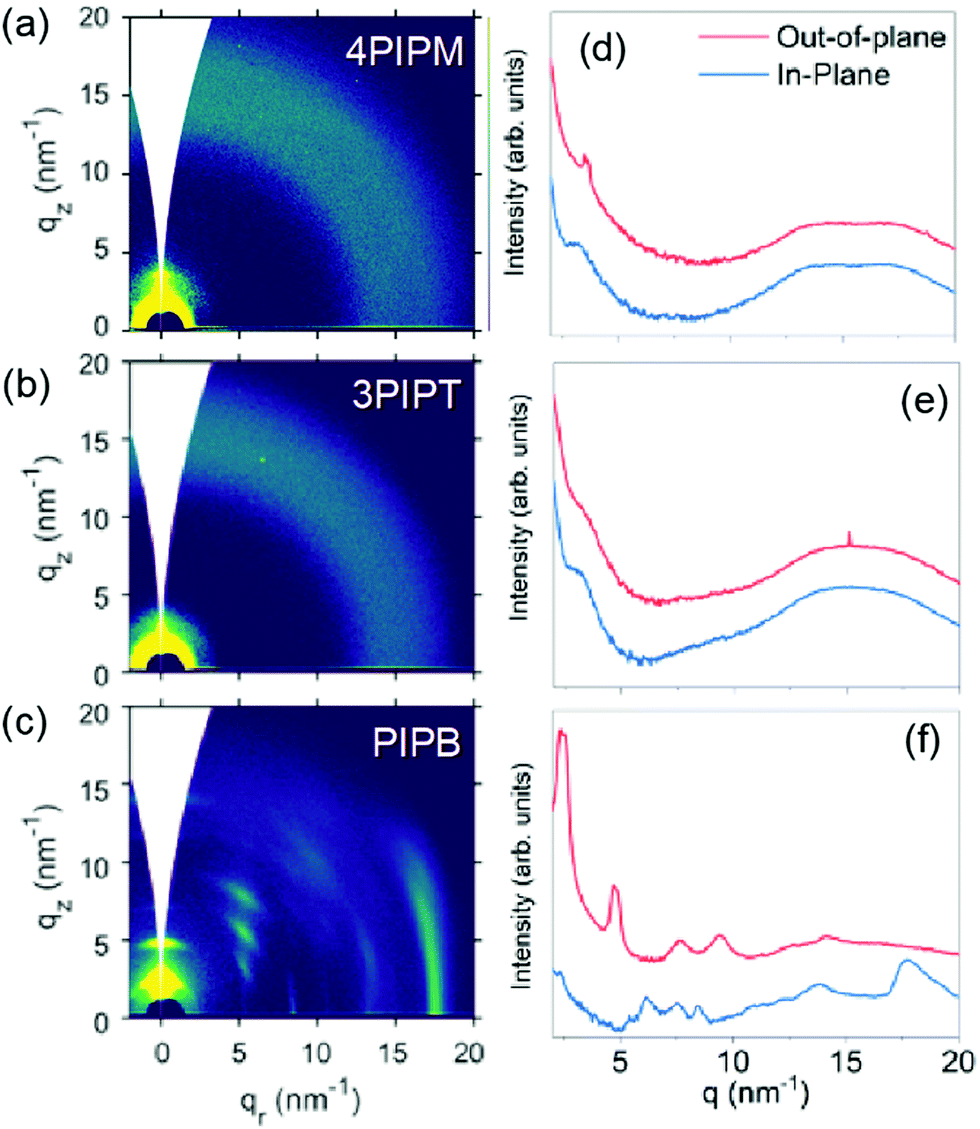 | ||
| Fig. 4 2D GIWAXS patterns and the out-of-plane (OOP, red line) and in-plane (IP, blue line) cuts of the corresponding 2D-GIWAXS patterns of the three acceptors 4PIPM (a and d), 3PIPT (b and e) and PIPB (c and f). | ||
Preparation and characterization of combined donor–acceptor blends
Having stablished the structural characteristics of the neat perylenimide-based NFA films, we endeavoured to investigate donor:acceptors binary blends. For this purpose, PCDTBT and PBDBT polymers were chosen as donor materials because (i) both exhibit good alignment between their NTO energy levels and those of the NFAs (Fig. 1), (ii) they tend to arrange into different solid-state microstructures (PCDTBT films are typically amorphous while PBDBT films exhibit a certain degree of paracrystalline order)48 and (iii) they exhibit high molar extinction coefficients (1.593 × 106 cm−1 M−1 for PCDTBT and 1.990 × 10⁶ for PBDBT), as determined from UV-Vis absorption spectra recorded in chloroform solutions (Fig. S26, ESI†). Prior to the characterization of the blends, the neat polymer films, cast from CF:CB solutions (3:1 VR), were analysed by UV-Vis absorption spectroscopy, photoluminescence spectroscopy and GIWAXS (Fig. 5 and 6). These results clearly demonstrate that PBDBT has a stronger tendency than PCDTBT to arrange in domains with a certain degree of structural order.
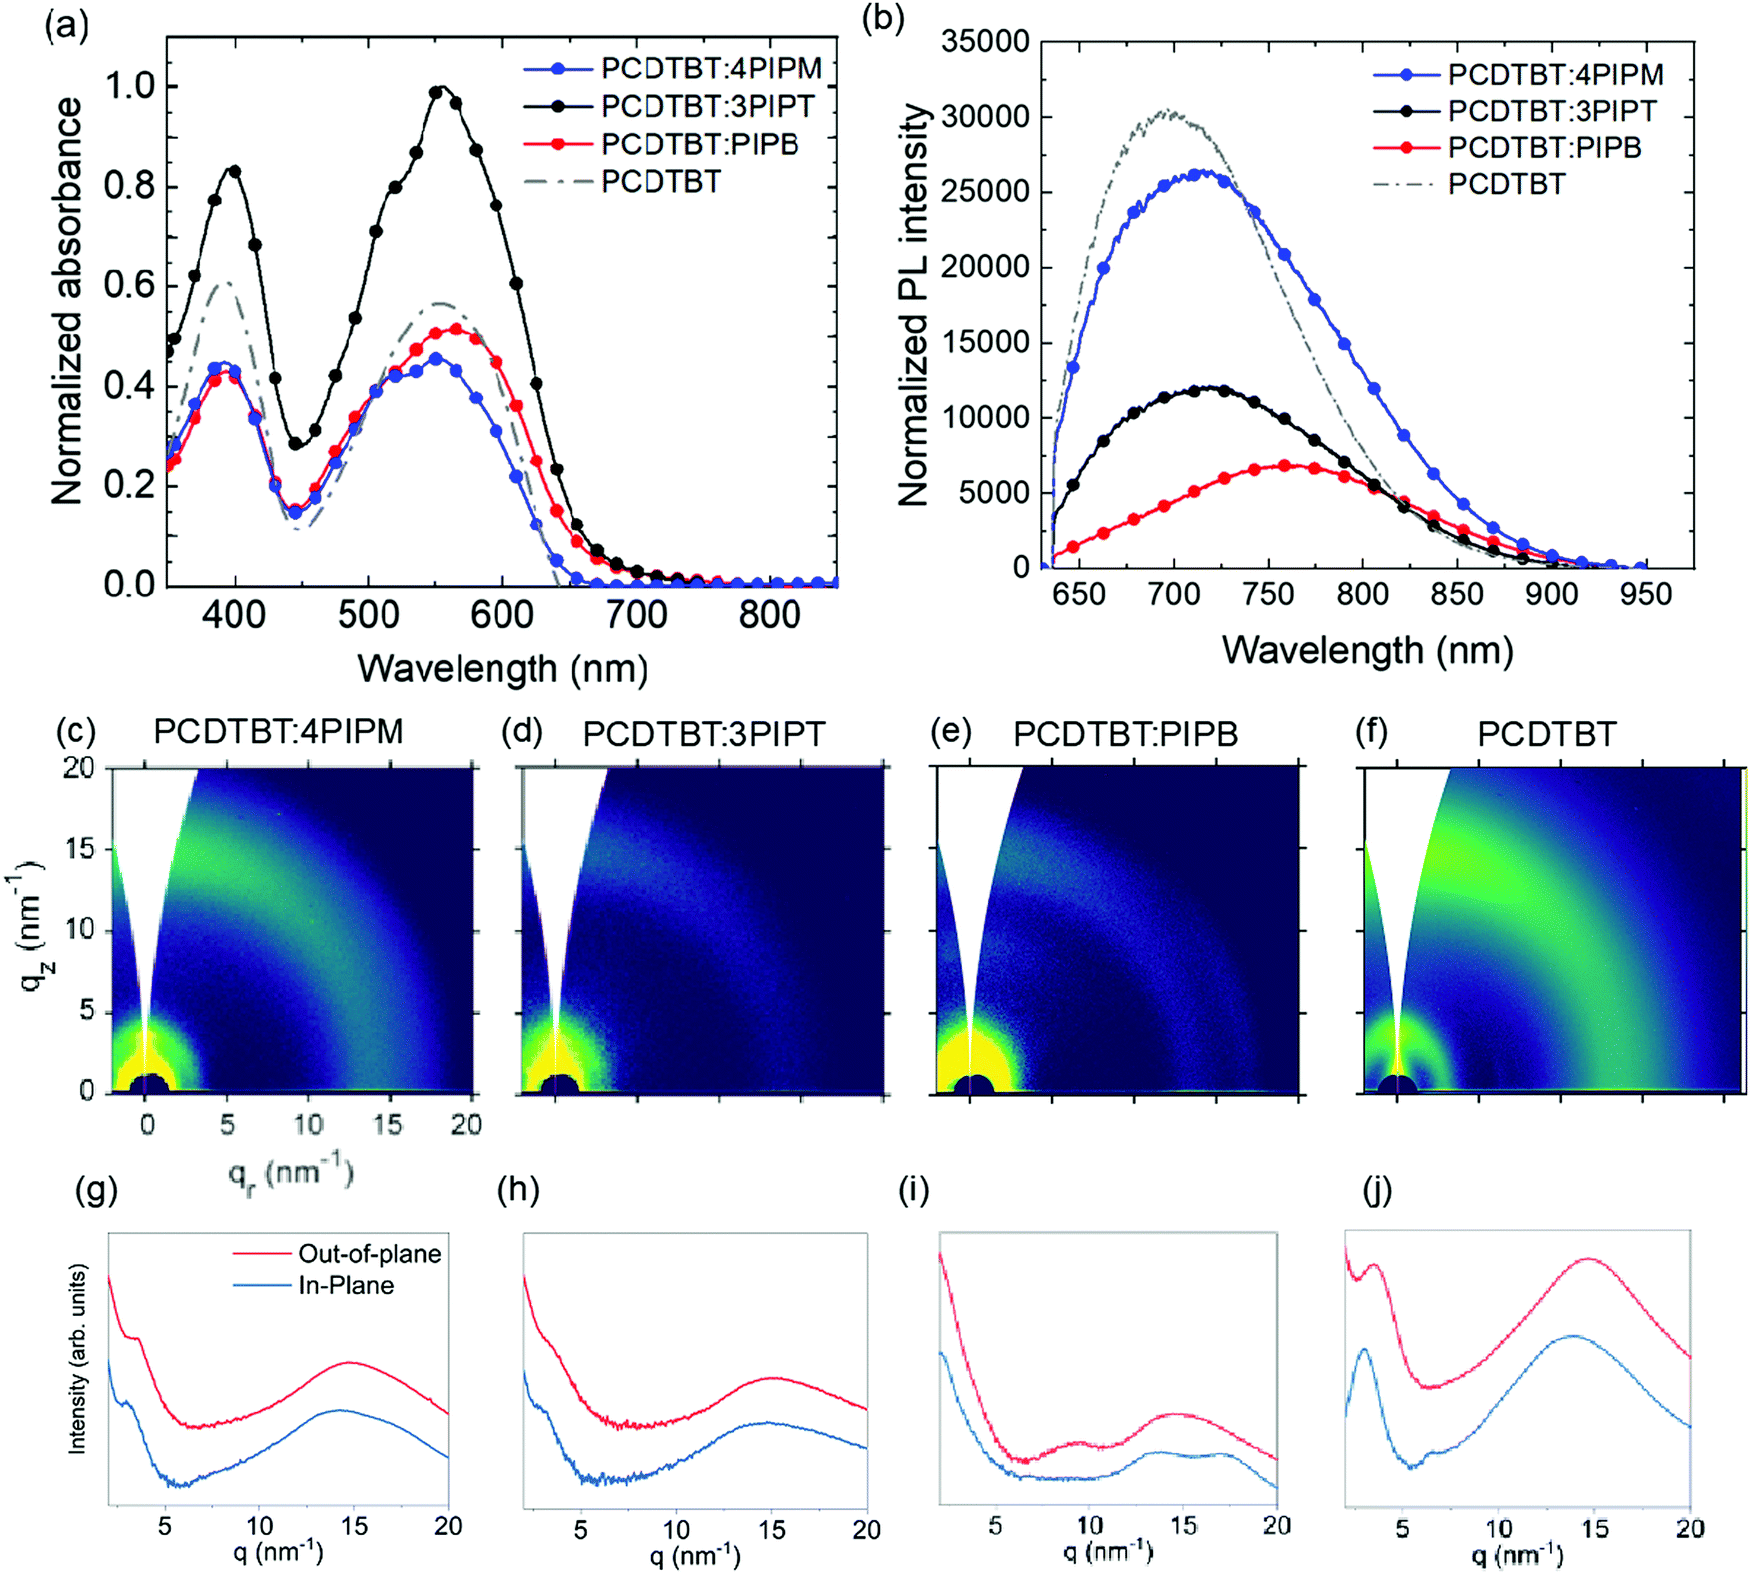 | ||
| Fig. 5 Solid state (a) UV-vis absorption normalized by film thickness and (b) photoluminescence spectra of PCDTBT:PIPB (red), PCDTBT:3PIPT (black), PCDTBT:4PIPM (blue) and PCDTBT (gray). 2D GIWAXS patterns and the out-of-plane (OOP) and in-plane (IP) cuts of the corresponding 2D-GIWAXS patterns of PCDTBT:4PIPM (c and g), PCDTBT:3PIPT (d and h), PCDTBT:3PIPB (e and i) and PCDTBT (f and j). | ||
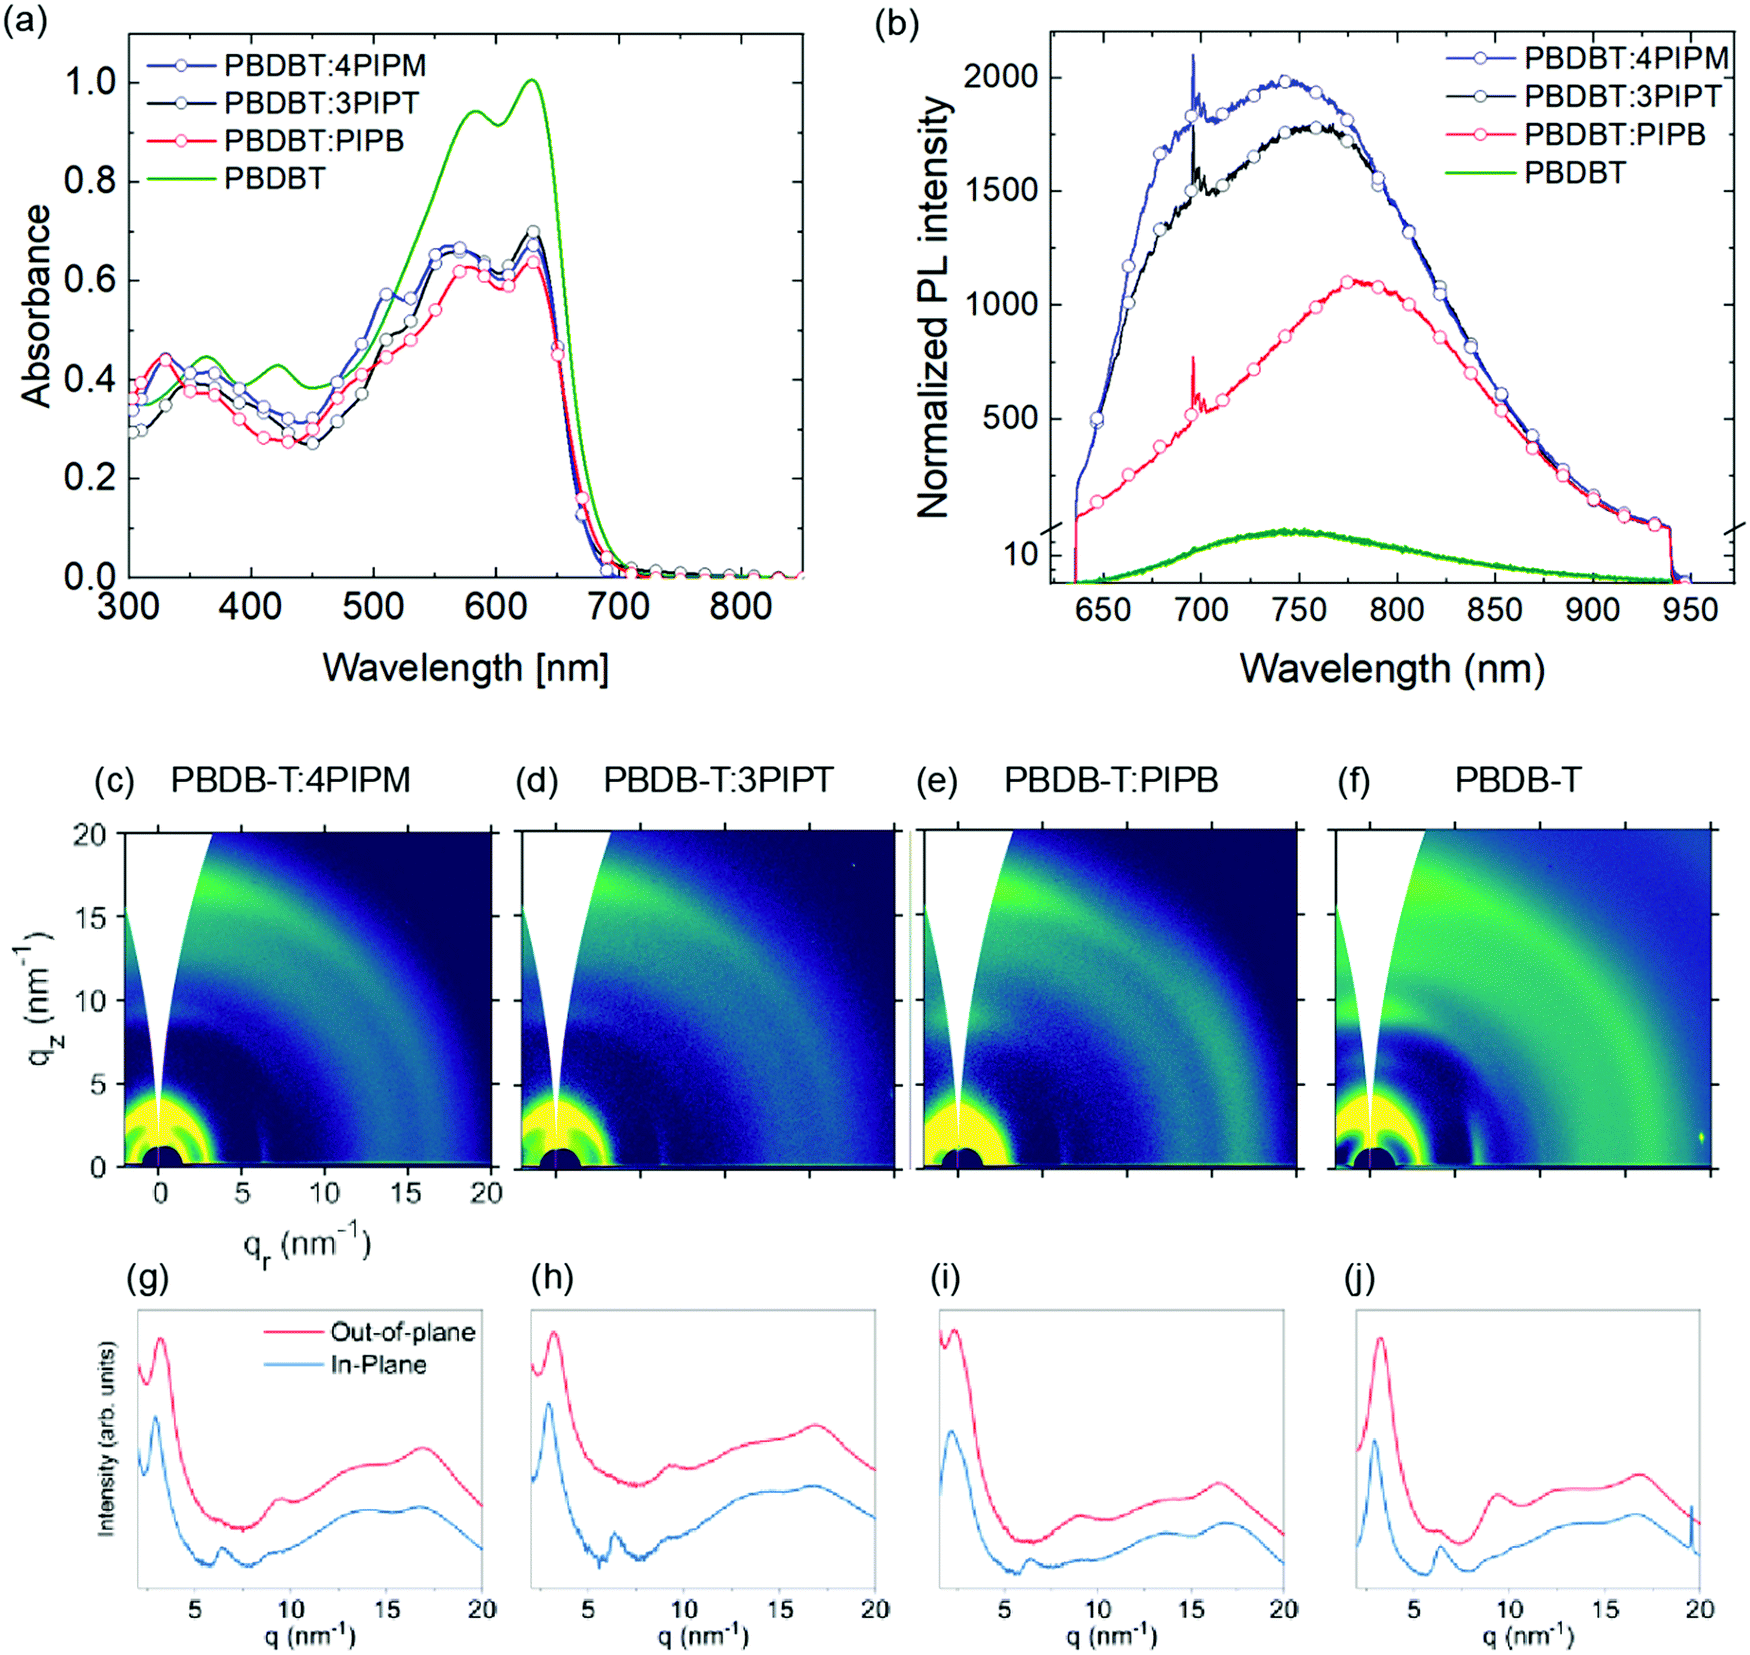 | ||
| Fig. 6 Solid state (a) UV-vis absorption normalized by the film thickness and (b) photoluminescence spectra normalized by the absorption at 633 nm for PBDBT:PIPB (red), PBDBT:3PIPT (black), PBDBT:4PIPM (blue) and PBDBT (green). 2D GIWAXS patterns and the out-of-plane (OOP) and in-plane (IP) cuts of the corresponding 2D-GIWAXS patterns of PBDBT:4PIPM (c and g), PBDBT:3PIPT (d and h), PBDBT:3PIPB (e and i) and PBDBT (f and j). | ||
1:1 (weight ratio) polymer:NFA films were prepared from CF:CB (3:1 VR) solutions. The UV-Vis absorption spectra of these films were normalized to the film thickness and showed absorption bands in the same range as those observed for the pure donor polymer and the NFAs (Fig. 5a and 6a). For PCDTBT, two absorption bands can be observed (Fig. 5a). A high energy band that is ascribed to the N-(1-octylnonyl)-2,7-di(thien-2-yl) carbazole unit and a low-energy band (LEB) which has intramolecular charge transfer (CT) character. As the three NFAs also exhibit two absorption bands in approximately the same spectral regions, the absorption of the blends is relatively similar to that of the polymer alone. For mixtures containing PIPB and 3PIPT, a small red shift can be, however, detected. Moreover, the thickness normalized absorption data suggest that PCDTBT:3PIPT blends exhibit a stronger absorption compared to the other systems.
Photoluminescence spectra of blend films containing the PCDTBT were registered under illumination with a 633 nm laser source. PL intensity was normalized to the corresponding optical absorption at the excitation wavelength (Fig. 5b). The interaction between the NFAs and the PCDTBT polymer resulted in a shift of the emission band, which peaked at 715 nm for the pristine NFAs films (Fig. 3), and peaked at 720, 713 and 759 nm for PCDTBT:4PIPM, PCDTBT:3PIPT and PCDTBT:PIPB, respectively (Fig. 5b). On the other hand, a PL emission maxima of 697 nm was observed for the pristine PCDTBT polymer film. Interestingly, the extend of red shift correlates with the crystallization tendency of the three systems. Indeed, the above results can be rationalized in terms of (i) small-molecule intermolecular aggregation and (ii) polymer-small-molecule interactions. The most significant bathochromic shift observed for the PCDTBT:PIPB films could be understood as the result of an efficient aggregation of the planar acceptor molecules by π–π stacking, promoted by the dilution effect granted by the polymer matrix. For PCDTBT:3PIPT films, even an effective slight hypsochromic effect is observed, which can be related to a better acceptor–donor interconnection likely due to the reduced tendency of 3PIPT towards aggregation (Fig. 4). The effect is, however, very small, and it could be also explained by the overlap of the donor and acceptor PL spectra. The slight red shift observed in the spectrum of the PCDTBT:4PIPM film reveals an intermediate degree of PL shifting, also correlating with a less significant aggregation tendency of this three-dimensional acceptor molecules by π–π stacking compared to PIPB. At this stage, we cannot fully rule out another potential explanation for the observed trend, which would be reabsorption by the crystalline domains, preferentially absorbing the lowest energy photons emitted.
The GIWAXS shows that the three donor:acceptor pairs, i.e.PCDTBT:4PIPM, PCDTBT:3PIPT and PCDTBT:PIPB, exhibit low degrees of structural order. We conclude the above from both the 2D patterns in Fig. 5c–f and the corresponding OOP and IP line cuts in Fig. 5g–j, which, in general, display broad and isotropic diffraction maxima. Neat PCDTBT, 4PIPM and 3PIPT have little tendency to arrange into structurally ordered structures as demonstrated above, hence, it is reasonable that they retain this behaviour also in blends. More striking is, however, the strong vitrification of the PIPB compound after blending with PBDBT, which is likely due to thermodynamic reasons.49 Nevertheless, a detailed inspection of the pattern of the PBDBT:PIPB blend reveals weak peaks at qz = ∼9 nm−1 and qr = 17.5 nm−1 that likely originate from the presence of fractions of some structurally ordered NFAs in this blend.
The polymer PBDBT, which exhibits a higher degree of structural order than PCDTBT, was also used to prepare blend films with the three novel NFAs acceptors. These blends were also prepared from 1:1 polymer:NFA solutions in CF:CB (3:1 VR) solutions. As before, optical properties of the films were studied by UV-Vis and PL spectroscopy (Fig. 6a and b). In contrast to the PCDTBT:NFA blend films, no major differences can be observed in the different NFAs.
Photoluminescence spectra of blends containing PBDBT resulted in a general red shift and broadening of the emission band centred at 715 nm for the NFAs films (Fig. 3) and that at 736 nm for the pristine PBDBT polymer film (Fig. 6). Thus, emission bands were observed at 767, 772 and 773 nm for PBDBT:4PIPM, PBDBT:3PIPT and PBDBT:PIPB, respectively (Fig. 6). The PL spectra of PBDBT is clearly of low intensity indicating the high order presents in the polymer as a result of the aggregation caused quenching (ACQ) phenomena. In ACQ, non-radiative relaxation resulted in planar molecule that arises from the short π–π stacking.50–52 The observed red shift and broadening of the bands suggest the formation of aggregated structures. The higher degree of structural order of PBDBT in comparison with PCDTBT can favour the formation of phase separation due to the formation of microstructure islands in PBDBT-based films which may be responsible for the reduced photoluminescence intensity observed for PBDBT-based films in comparison with the PCDTBT analogues. Alternatively, the absorption of the polymer itself, which goes well down 700 nm, could introduce some degree of self-absorption in all films. Strong emission from a charge transfer at the donor/acceptor interface is, however, unlikely due to the degree of phase separation (vide infra).
In good agreement with PL data, GIWAXS patterns for all the blends show essentially the reflections observed in neat PBDBT films (Fig. 6c–h), which suggests, again, that NFAs arrange in disordered domains also in these blends. However, similarly to the PCDBTB:PIPB blends discussed, a close view of the pattern for PBDBT:PIPB reveals some weak signals at qr = 3.5 nm−1 and qr = 17.5 nm−1 along the in-plane direction that can originate from crystalline NFA domains. The presence of distinctive diffraction peaks and PL peaks associated with both the NFA and the polymer indicates the existence of a phase separated nanomorphology in the PBDBT:PIPB blend. This blend seems to include, likely among other phases, structurally ordered polymeric domains and crystalline NFA domains. For PBDBT:4PIPM and PBDBT:3PIPT binary blends, phase separated domains can be also presumed according to PL data, but NFA domains seem to be amorphous in these cases, according to GIWAXS results.
Raman spectroscopy was used to further investigate the microstructure and to address any chemical change that might be produced during the processing of the PCDTBT:NFA blend films. Comparison between the Raman spectra of the small acceptor molecules, PCDTBT and PCDTBT:NFA blend films strongly suggests that the structure of the NFAs and PCDTBT remain unaltered after the film processing (see Fig. 7 and Table S1, ESI†). However, the shifts and splitting of peaks observed in the blend films (Table S1, ESI†) indicate a strong interaction between the polymer and the small molecules in agreement with that previously observed in the photoluminescence study. While a full theoretical assignments of peaks has not been carried out, we would like to point out a few observations. For blends including PCDTBT as the polymer, the polymer peaks related to the backbone (between 1300 and 1700 cm−1) tend to shift to higher wavenumbers. For instance, the 1348 cm−1 and 1541 cm−1 peaks of the polymer go to 1352 cm−1 and 1543 cm−1, respectively, when mixed with 3PIPT. This vibration hardening is typically resulting from the polymer reducing its degree of order and is typical of conjugated polymers upon blending.53,54 In the case of PBDBT, it is interesting to notice that many of the peaks cannot be properly resolved upon blending. On the other hand, the peaks of the NFAs that can be independently resolved from those of the polymers seem to be less affected by blending with PCPTBT than with PBDBT. Blending with PBDBT has, indeed, a stronger effect on the peaks associated to the NFAs, shifting them, in most cases, to lowers wavenumbers. This would suggest that, at a single molecule level, the dielectric environment of the molecules is very much affected by the degree of order of the polymer matrix, having a greater effect with increased order.
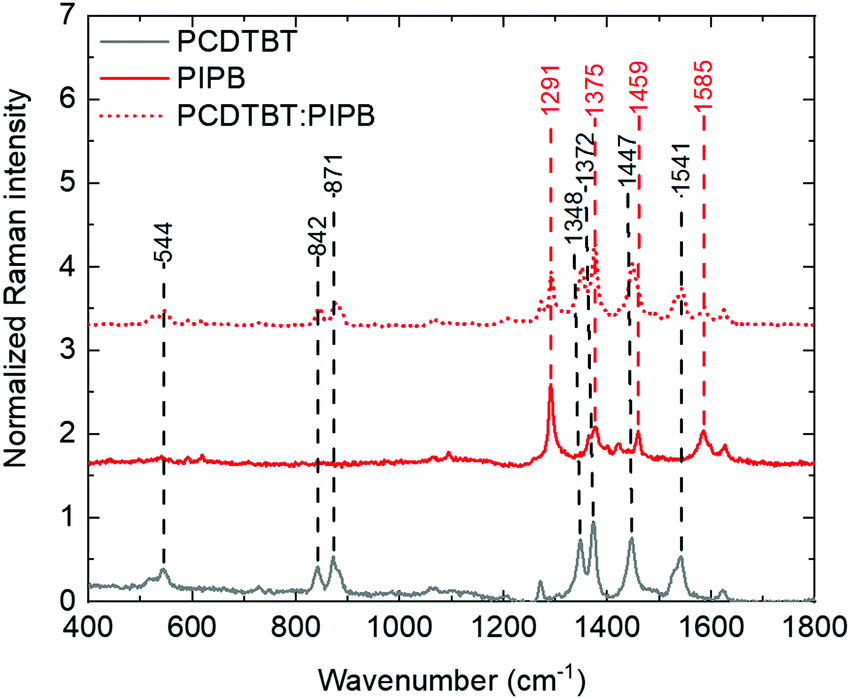 | ||
| Fig. 7 Raman spectra of PCDTBT (grey), PIPB (red) and PCDTBT:PIPB (dotted red). | ||
Photovoltaic devices
Following the above results concerning the molecular packing of three novel NFAs with different dimensionalities in pristine form and in blends with electron donor polymers, the different systems were also explored as heterojunctions in organic photovoltaic (OPV) devices, with the aim to correlate their performance with the obtained structural information. For this purpose, a series of devices were fabricated using PCDTBT or PBDBT as electron donor and PIPB, 3PIPT or 4PIPM as the electron acceptor. These active layers where embedded within photovoltaic devices with inverted structure (glass coated indium tin oxide (ITO)/aluminium doped zinc oxide (AZO)/active layer/molybdenum trioxide/silver). The active layer and ETL were blade coated, while MoO3 and the silver electrode were evaporated. Full details about the device fabrication are provided in the Experimental section. The current density–voltage (J–V) curves of the champion cells are illustrated in Fig. 8. Table 2 summarizes the photovoltaic parameters of these devices.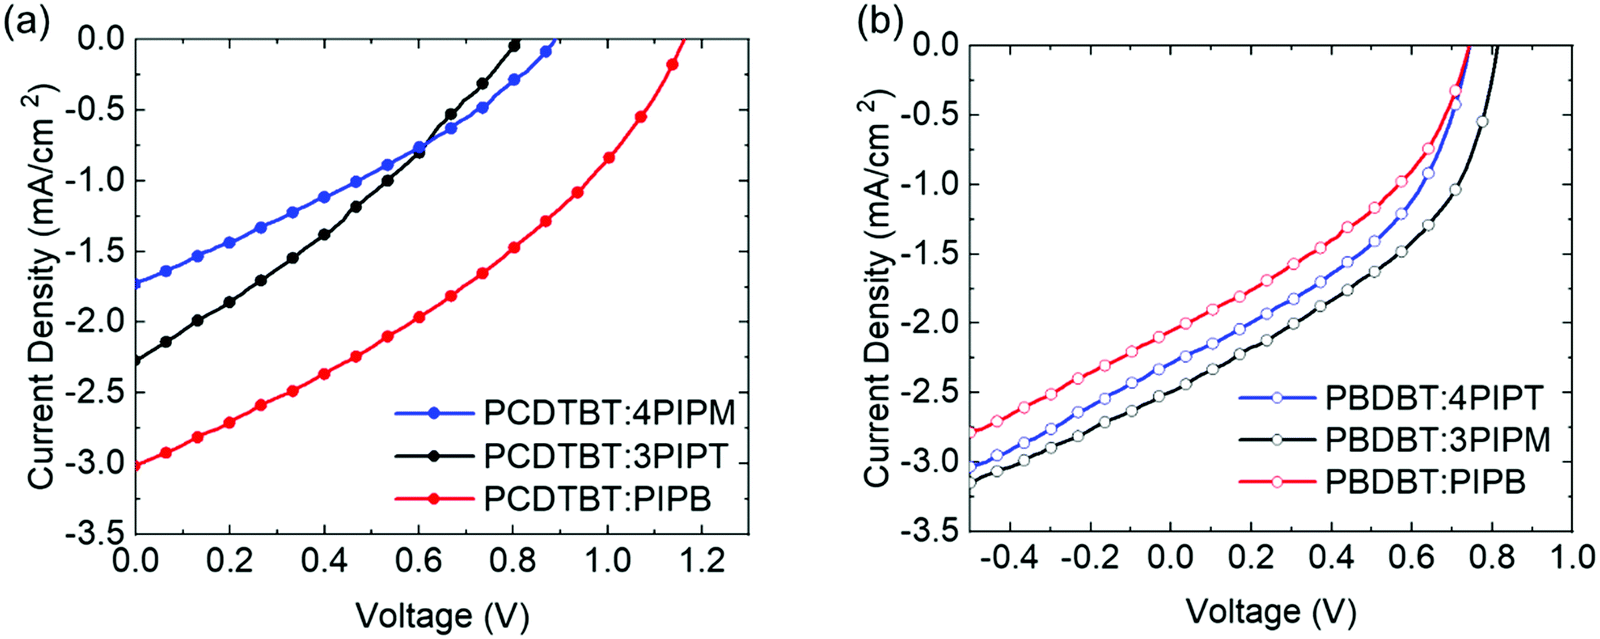 | ||
| Fig. 8 (a) The J–V curves of the champion PV devices with PCDTBT donor polymer and (b) the J–V curves of the champion PV devices with PBDBT donor polymer. | ||
| Heterojunctions | V oc (V) | J sc (mA cm−2) | FF (%) | PCE (%) |
|---|---|---|---|---|
| PCDTBT:4PIPM | 0.88 ± 0.06 (0.92) | 1.46 ± 0.03 (1.44) | 32 ± 2 (33) | 0.41 ± 0.04 (0.44) |
| PCDTBT:3PIPT | 0.7 ± 0.2 (0.8) | 2.2 ± 0.1 (2.3) | 33 ± 3 (30) | 0.49 ± 0.11 (0.56) |
| PCDTBT:PIPB | 1.16 ± 0.01 (1.16) | 3.02 ± 0.01 (3.02) | 32 ± 4 (35) | 1.12 ± 0.14 (1.22) |
| PBDBT:4PIPM | 0.75 ± 0.01 (0.75) | 2.3 ± 0.1 (2.4) | 41 ± 1 (41) | 0.73 ± 0.01 (0.74) |
| PBDBT:3PIPT | 0.79 ± 0.04 (0.82) | 2.45 ± 0.08 (2.5) | 40 ± 4 (42) | 0.76 ± 0.13 (0.85) |
| PBDBT:PIPB | 0.88 ± 0.01 (0.87) | 2.0 ± 0.2 (2.2) | 25 ± 1 (26) | 0.43 ± 0.07 (0.48) |
First, the devices were fabricated blending the small molecules with the less crystalline polymer donor, PCDTBT. The device performance varied depending on the nature of the acceptor used (Fig. 8 and Table 2). The best PCE value obtained was 1.22% for the device based on the PCDTBT:PIPB blend. Lower performances were obtained for devices fabricated with PCDTBT:4PIPM (0.44%) and PCDTBT:3PIPT (0.56%) blends after a thickness, ratio and annealing optimization process. We have used the high throughput method for screening the thickness following the previous work (see Tables S2 and S3, ESI†).55 For the three devices the overall values of the fill factors (FF) were in the 29–33% range. These very low values can be the result of the low packing order in the blend films that prevents a good charge transport. Furthermore, considering the energy level of the three acceptor molecules and the low fill factor of the devices, the analysis of the open circuit voltages (Voc) values (Fig. S27, ESI†) indicates the existence of microstructure-related recombination. This observation is consistent with previously reported studies that show an increase in the charge carrier mobility when crystalline electron donors are mixed with less crystalline acceptors thus enhancing the FF and photoconversion efficiency (PCE) in the device.56 In blends containing electron donor polymers and PDI derivatives as electron acceptor units the trap assisted charge recombination loss is likely enhanced,21 and in the blends with PCDTBT electron donor polymer the formation of trapping sites cannot be avoided independently of the three-dimensional orientation of the PDI acceptor units. In the particular case of PCDTBT:PIPB, an enhancement on the electron transport can be expected as a consequence of the intermolecular π–π stacking of the PIPB moieties in the polymeric matrix.
Blend films containing the PDI-based electron acceptors and the more structurally ordered polymer, PBDBT, as donor, have also been evaluated as active layers in OPV devices. The efficiency of the devices built with the PBDBT:PIPB blend film were lower in comparison with that measured for the analogous device built with a PCDTBT:PIPB film (0.48% vs. 1.2%). Slightly higher efficiencies were found for the devices fabricated with the PBDBT:4PIPM (0.74%) and PBDBT:3PIPT (0.85%) heterojunctions (see Table 2). The average fill factors determined for devices built with PBDBT:4PIPM (41%) and PBDBT:3PIPT (42%) blend films were higher than those obtained with the partner blends based on the less crystalline PCDTBT polymer (PCDTBT:4PIPM (33%) and PCDTBT:3PIPT (30%)). In contrast, the FF values of devices built with PBDBT:PIPB (26%) were similar to those obtained for devices fabricated with PCDTBT:PIPB blend films (35%) (Table 2). Eventually the 4PIPM and 3PIPT behave similarly in the devices unlike the PIPB that shows a clear change in the device performance when combined with the two polymer donors. The device parameter trends obtained correlate relatively well with the structural information extracted from the combined study of the UV-vis absorption, fluorescence and GIWAXS data outlined above and highlight the importance of the microstructure of the heterojunctions. More specifically, our data shows that PIPB has a stronger tendency to pack into ordered structures when blended with PBDBT, which likely results in a more phase separated morphology that encompasses isolated, non-percolated microislands that penalize charge transport and, hence, the device efficiency.57
The results summarized above have focused on films and OSC devices prepared from solutions of the components in CF:CB 3:1 VR mixtures. In order to investigate the origin of the relatively low efficiencies, we studied the effect of the solvent on the performance of the systems under consideration. By using chloroform, chlorobenzene and their mixtures in different proportions, we observed that the solubility of the small molecules is a crucial parameter to be considered (Fig. S27 and S28, ESI†). Despite the lower solubility of the NFAs in chloroform (CF), the use of CF as co-solvent together with dichlorobenzene (CB) improves the performance of the devices in comparison with the use of pure CB. This behaviour can be ascribed to the drying time since the low boiling temperature of CF leads to faster drying and partially prevents large scale phase separation in comparison with processing only with CB. Further investigation of the solvent influence on performances of the devices based on the six different heterojunctions (PCDTBT:4PIPM, PCDTBT:3PIPT, PCDTBT:PIPB, PBDBT:4PIPM, PBDBT:3PIPT and PBDBT:PIPB) was also accomplished in connection with the Hansen solubility parameters (polarity, hydrogen bond and dispersion) by ANOVA statistical analysis (Table S4, ESI†).52,58–63 We find that the polarity has F factor of 71.4, hydrogen bonds and the dispersion coefficients have the same value of 114.8. Since the Hansen parameters shows high dispersion of the efficiency of the devices, the surface map of photovoltaic device efficiencies to Hansen solubility parameters for different solvents used for the active layer formation TCE: tetrachloroethane, DCM: dichloromethane, CB: chlorobenzene and CF: chloroform is shown in Fig. S29 (ESI†). These findings indicate that a polar solvent like chloroform improves the solubility of the active layer components and results in better performance than CB. DCM and TCE result in less efficient device performance than the combination between chloroform and chlorobenzene (3:1) VR.
These findings increase the awareness of future investigations toward the benefits of optimizing the π–π intermolecular stacking for enhancing the efficiency of the charge separation and hence improving the photogenerated current in heterojunctions. This can be addressed by increasing the density of grain boundaries of the small PDI crystallites while the generated electrons travels through the interconnected small PDI aggregates to reach the electrode.64
Conclusion
This study explores the importance of the molecular geometry of non-fullerene acceptors for an efficient tuning of their tendency toward aggregation/packing, with severe implications in the donor:acceptor morphology and ultimately, in the device operation. Three novel peryleneimide adducts, namely PIPB (mono-adduct), 3PIPT (tris-adduct) and 4PIPM (tetra-adduct), have been designed and synthesized. These NFAs exhibit almost identical energy levels, but different molecular geometries, which results in distinct packing tendencies. The highest degree of crystallinity was observed for the planar PIPB monoadduct. When PIPB is combined with a polymer with a low degree of structural order, e.g.PCDTBT, the best PCE of the series (1.2%) was obtained. In contrast, when PIPB is combined with a more ordered polymer, like PBDBT, significantly lower PCE values are measured due to an excessive donor:acceptor phase separation. 3PIPT and 4PIPM exhibit a poor tendency to crystallize and work better when blended with the more ordered polymer PBDBT. Thus, our study suggests the benefits of selecting donor and acceptor systems with complementary tendency to arrange into ordered structures. Most likely, introducing some disorder in the intermolecular stacking improves mixing and enhances the photogenerated carriers by reducing charge carrier trapping.Experimental section
Synthesis of PIPB, 3PIPT and 4PIPM
General remarks: all reagents were purchased from commercial suppliers and used without further purification. Synthesis of the novel diketone PID is detailed in detailed in the complementary material. Polyamines 1 and 2 were obtained as previously described.65,66 Solvents were dried distillation over sodium or benzophenone under argon before use. TLC analyses were performed using silica gel (Kieselgel 60 F254, Macherey–Nagel) and spots were visualized under UV light. Column chromatography was carried out with silica gel 60 (0.04–0.06 mm, Scharlau) columns, using the eluent reported in each case. IR spectra are reported in wavenumbers (cm−1). 1H and 13C NMR spectra were recorded using Bruker DPX 300 MHz or Bruker AVIIII 300 MHz BACS-60 systems at room temperature. Chemical shifts are given in ppm (δ) and referenced to the residual nondeuterated solvent frequencies (CDCl3: δ 7.26 ppm for 1H, δ 77 ppm for 13C). Coupling constants (J) are in Hertz [Hz] and signals are described as follows: s, singlet; d, doublet; t, triplet; m, multiplet; br, broad; app, apparent. High resolution mass spectra were recorded using MALDI-TOF techniques. UV-vis absorption spectra of the compounds in HPLC chloroform solutions at 20 °C were recorded on a Varian Cary 50 UV-vis spectrophotometer. Cyclic voltammetry experiments were performed with a computed controlled potentiostat in a three-electrode single-compartment cell (5 mL). The platinum working electrode consisted of a platinum wire with a surface of A = 0.785 mm2, which was polished down to 0.5 μm with polishing paste prior to use in order to obtain reproducible surfaces. The counter electrode consisted of a platinum wire, and the reference electrode was a Ag/AgCl secondary electrode. An electrolyte solution of 0.1 M TBAPF6 in freshly distilled and degassed CH2Cl2 (HPLC) was used in all experiments.:5) to give PIPB as a dark red solid (59.1 mg, 75%). 1H NMR (300 MHz, CDCl3): δ = 8.36 (2H, d, J = 7.9 Hz, H4(17)), 8.18 (4H, m, H5(16) and H6(15)), 8.01(2H, d, J = 7.4 Hz, H7(14)), 7.87 (2H, m, H9(12)), 7.58 (2H, m, H10(11)), 4.00 (2H, d, J = 7.2 Hz, N-CH2), 1.96 (1H, m, CH), 1.25 (40H, m, 20 CH2), 0.84 (6H, m, 2 CH3). Numbering employed in NMR analysis is described in the Fig. S10 (ESI†). 13C NMR (75 MHz, CDCl3): δ = 163.0, 151.9, 139.9, 135.3, 133.5, 131.5, 130.5, 130.4, 129.1, 128.9, 128.6, 125.2, 123.2, 123.1, 121.9, 121.7, 121.0, 44.4, 36.8, 31.9, 36.1, 30.2, 29.7, 29.4, 26.4, 22.7, 14.1 (some aliphatic signals overlap). FTIR (ATR, CH2Cl2): νmax = 2955, 2923, 2852, 1693, 1651, 1584, 1385, 1358, 1241, 1091, 821, 760, 752. HRMS (MALDI-TOF) calculated for C54H61N3O2 [M+] 783.4764, found [M+] 783.4785.
:1) to give 3PIPT as a dark red solid (42.2 mg, 87%). 1H NMR (300 MHz, CDCl3/TFA): δ = 8.84 (30H, m, HAromatic), 6.83 (2H, s, CHBicicle), 4.19 (6H, m, N-CH2), 2.05 (3H, m, CHAlkyl), 1.37–1.21 (120H, m, 60 CH2), 0.85 (18H, m, 6 CH3). FTIR (ATR, CH2Cl2): νmax = 3000, 2924, 2853, 1698, 1657, 1585, 1417, 1357, 1320, 1091. HRMS (MALDI-TOF) calculated for C164H179N9O6 [M+] 2371.4012, found [M + H]+ 2372.4014.
:1) to give 4PIPM as a dark red solid (77.9 mg, 91%). 1H NMR (300 MHz, CDCl3/TFA): δ = 8.97–8.64 (40H, m, HAromatic), 8.19 (4H, m, HAromatic), 4.20 (8H, d, J = 6.6 Hz, N-CH2), 2.02 (4H, m, CHAlkyl), 1.24 (160H, m, 80 CH2), 0.85 (24H, m, 8 CH3). FTIR (ATR, CH2Cl2): νmax = 3014, 2996, 2955, 2853, 1698, 1659, 1585, 1386, 1357, 1094. HRMS (MALDI-TOF) calculated for C217H240N12O8 [M+] 3143.8809, found [M + H]+ 3144.8609.
OPV devices preparation and characterization
The devices were prepared with inverted structure: glass coated indium tin oxide (ITO)/Al doped zinc oxide (AZO)/active layer/molybdenum trioxide (MoO3)/silver (Ag). Patterned ITO coated glass (25 × 75 mm) provided by Ossila with sheet resistance 20 Ω □−1 and thickness of 100 nm. ITO coated glass substrates were cleaned by Sonication bath in acetone for 5 minutes, in 10% vol. Helmanex in H2O solution for 5 minutes, in isopropanol for 5 minutes, in acetone for 5 minutes and in 10% w/v NaOH in water solution for 20 minutes. For preparing the active layer: the donor to acceptor ratio was 1:1 (w/w) in all the devices. Co-solvent of chloroform: chlorobenzene (3:1) VR was used as a solvent for preparing the active layer of the devices. The thickness of silver electrode was 100 nm and that of MoO3 was 10 nm. The evaporation rate 3 Å m−1 and 1 Å m−1, for silver and MoO3, respectively. The active area was set to 5 mm2 by means of a shadow mask. In all cases, a high substrate rotation speed was set in order to minimize border shadowing effects. All the active layer films were blade coated by the blade coater of model (ZUA 2300, Zehntner). This blade coater was modified by a home-made electronic board to allow the coating using variable blade speed, which results in a thickness gradient within the same substrate. This enables the thickness optimization within a single substrate, which has the advantage of using less material. The J–V characteristics were measured using a Keithley 4200 power source meter under AM 1.5 G illumination at an intensity of 100 mW cm−2. The solar simulator was calibrated with a certified silicon solar cell (Oriel, Newport).
Raman and PL spectra of the blend films, prepared by blade coating on glass substrate, were measured using a Witec alpha300RA. For Raman, the scanned area was 0.25 mm2 with scanning resolution of 10 points per line, 10 line per image, scan speed 2 s/line and integration time of 0.23 s. As excitation, we used a 488 nm solid state laser source with a power of 1 mW for Raman, and a 633 nm HeNe laser for PL. The gratings were 1200 g m−1 and 300 g m−1 for Raman and PL, respectively.
GIWAXS experimental section
Grazing-Incidence Wide-Angle X-ray Scattering (GIWAXS) experiments were conducted using synchrotron light at the NCD-SWEET beamline (ALBA Synchrotron, Barcelona, Spain). A collimated, monochromatic beam (λ = 0.1 nm, E = 12.4 KeV) interacts with these film samples with an incident angle of 0.12° to maximize the scattered signal. The diffraction patterns were collected using a WAXS LX255-HS detector (Rayonix), which was placed at 220 millimeters from the sample. Exposition times no longer than 5 s were used.Conflicts of interest
There are no conflicts to declare.Acknowledgements
The authors acknowledge financial support from the Spanish Ministry of Science and Innovation through the Severo Ochoa Program for Centers of Excellence in R&D (No. CEX2019-000917-S), and projects PGC2018-095411-B-I00, PID2019-106268GB-C33 and PID2019-110305GB-I00, as well as the European Commission through the Horizon 2020 Marie Sklodowska-Curie ITN Programme, SEPOMO, Grant Number: 722651, and the UCM (INV.GR.00.1819.10759). E. G. specially acknowledges Comunidad de Madrid and Universidad Complutense de Madrid for a post-doctoral contract (CT20/19-CT21/19/PEJD-2018-POST/IND-8661PAI). M. J. A. N. acknowledges URJC for a post-doctoral contract. R. P. O. and A. H. also acknowledge support from Junta de Andalucía (project UMA18-FEDERJA-080). We acknowledge support of the publication fee by the CSIC Open Access Publication Support Initiative through its Unit of Information Resources for Research (URICI).Dedicated to the memory of our friend and colleague Prof. Alasdair Campbell.
References
- B. C. Thompson and J. M. J. Fréchet, Angew. Chem., Int. Ed., 2008, 47, 58–77 CrossRef CAS PubMed.
- M. C. Scharber, D. Mühlbacher, M. Koppe, P. Denk, C. Waldauf, A. J. Heeger and C. J. Brabec, Adv. Mater., 2006, 18, 789–794 CrossRef CAS.
- Q. Liu, Y. Jiang, K. Jin, J. Qin, J. Xu, W. Li, J. Xiong, J. Liu, Z. Xiao, K. Sun, S. Yang, X. Zhang and L. Ding, Sci. Bull., 2020, 65, 272–275 CrossRef CAS.
- M. Stolar and T. Baumgartner, Phys. Chem. Chem. Phys., 2013, 15, 9007–9024 RSC.
- Q. Liu, S. E. Bottle and P. Sonar, Adv. Mater., 2020, 32, 1–46 Search PubMed.
- X. Guo, A. Fachetti and T. J. Marks, Chem. Rev., 2014, 114(18), 8943–9021 CrossRef CAS PubMed.
- S. G. Higgins, B. V. O. Muir, G. Dell’Erba, A. Perinot, M. Caironi and A. J. Campbell, Appl. Phys. Lett., 2016, 108, 1–6 CrossRef.
- N. L. Vaklev, J. H. G. Steinke and A. J. Campbell, Adv. Mater. Interfaces, 2019, 6, 1–6 Search PubMed.
- M. Al Kobaisi, S. V. Bhosale, K. Latham, A. M. Raynor and S. V. Bhosale, Chem. Rev., 2016, 116, 11685–11796 CrossRef PubMed.
- F. Tintori, A. Laventure, R. El-Berjawi, E. Cieplechowicz, L. Umer, P. Hudhomme and G. C. Welch, Nano Sel., 2020, 1, 388–394 CrossRef.
- E. Zhou, J. Cong, Q. Wei, K. Tajima, C. Yang and K. Hashimoto, Angew. Chem., Int. Ed., 2011, 50, 2799–2803 CrossRef CAS PubMed.
- X. Zhang, Z. Lu, L. Ye, C. Zhan, J. Hou, S. Zhang, B. Jiang, Y. Zhao, J. Huang, S. Zhang, Y. Liu, Q. Shi, Y. Liu and J. Yao, Adv. Mater., 2013, 25, 5791–5797 CrossRef CAS PubMed.
- K. Fujimoto, M. Takahashi, S. Izawa and M. Hiramoto, Materials, 2020, 13(9), 2148 CrossRef CAS PubMed.
- M. A. Bassi, M. A. Lopez, L. Confalone, R. M. Gaudio, L. Lombardo and D. Lauritano, Nature, 2020, 388, 539–547 Search PubMed.
- P. J. Brown, D. S. Thomas, A. Köhler, J. S. Wilson, J. S. Kim, C. M. Ramsdale, H. Sirringhaus and R. H. Friend, Phys. Rev. B: Condens. Matter Mater. Phys., 2003, 67, 1–16 CAS.
- V. Sharma, J. D. B. Koenig and G. C. Welch, J. Mater. Chem. A, 2021, 9, 6775–6789 RSC.
- R. K. Gupta and A. A. Sudhakar, Langmuir, 2019, 35, 2455–2479 CrossRef CAS PubMed.
- M. A. Mattson, T. D. Green, P. T. Lake, M. McCullagh and A. T. Krummel, J. Phys. Chem. B, 2018, 122, 4891–4900 CrossRef CAS PubMed.
- C. B. Nielsen, S. Holliday, H. Y. Chen, S. J. Cryer and I. McCulloch, Acc. Chem. Res., 2015, 48, 2803–2812 CrossRef CAS PubMed.
- R. Singh, E. Aluicio-Sarduy, Z. Kan, T. Ye, R. C. I. Mackenzie and P. E. Keivanidis, J. Mater. Chem. A, 2014, 2, 14348–14353 RSC.
- L. Zang, Y. Che and J. S. Moore, Acc. Chem. Res., 2008, 41, 1596–1608 CrossRef CAS PubMed.
- T. Ye, R. Singh, H. J. Butt, G. Floudas and P. E. Keivanidis, ACS Appl. Mater. Interfaces, 2013, 5, 11844–11857 CrossRef CAS PubMed.
- B. Russ, M. J. Robb, F. G. Brunetti, P. L. Miller, E. E. Perry, S. N. Patel, V. Ho, W. B. Chang, J. J. Urban, M. L. Chabinyc, C. J. Hawker and R. A. Segalman, Adv. Mater., 2014, 26, 3473–3477 CrossRef CAS PubMed.
- L. Bu, X. Guo, B. Yu, Y. Qu, Z. Xie, D. Yan, Y. Geng and F. Wang, J. Am. Chem. Soc., 2009, 131, 13242–13243 CrossRef CAS PubMed.
- S. Rajaram, R. Shivanna, S. K. Kandappa and K. S. Narayan, J. Phys. Chem. Lett., 2012, 3, 2405–2408 CrossRef CAS PubMed.
- H. Fu, Z. Wang and Y. Sun, Angew. Chem., Int. Ed., 2019, 58, 4442–4453 CrossRef CAS PubMed.
- P. De Echegaray, M. J. Mancheño, I. Arrechea-Marcos, R. Juárez, G. López-Espejo, J. T. López Navarrete, M. M. Ramos, C. Seoane, R. P. Ortiz and J. L. Segura, J. Org. Chem., 2016, 81, 11256–11267 CrossRef CAS PubMed.
- H. Herrera, P. De Echegaray, M. Urdanpilleta, M. J. Mancheño, E. Mena-Osteritz, P. Bäuerle and J. L. Segura, Chem. Commun., 2013, 49, 713–715 RSC.
- M. M. Oliva, A. Riano, I. Arrechea-Marcos, M. M. Ramos, R. Gómez, M. Algarra, R. P. Ortiz, J. T. López Navarrete, J. L. Segura and J. Casado, J. Phys. Chem. C, 2016, 120, 23276–23285 CrossRef CAS.
- R. Juárez, M. M. Oliva, M. Ramos, J. L. Segura, C. Alemán, F. Rodríguez-Ropero, D. Curcó, F. Montilla, V. Coropceanu, J. L. Brédas, Y. Qi, A. Kahn, M. C. Ruiz Delgado, J. Casado and J. T. López Navarrete, Chem. – Eur. J., 2011, 17, 10312–10322 CrossRef PubMed.
- T. Kobayashi, T. Kubota and K. Ezumi, J. Am. Chem. Soc., 1983, 105, 2172–2174 CrossRef CAS.
- S. Montanaro, D. G. Congrave, M. K. Etherington and I. A. Wright, J. Mater. Chem. C, 2019, 7, 12886–12890 RSC.
- S. Kumar, J. Shukla, Y. Kumar and P. Mukhopadhyay, Org. Chem. Front., 2018, 5, 2254–2276 RSC.
- Y. Wu, M. Frasconi, D. M. Gardner, P. R. McGonigal, S. T. Schneebeli, M. R. Wasielewski and J. F. Stoddart, Angew. Chem., Int. Ed., 2014, 53, 9476–9481 CrossRef CAS PubMed.
- Y. Zhang, B. Kan, X. Ke, Y. Wang, H. Feng, H. Zhang, C. Li, X. Wan and Y. Chen, Org. Electron., 2017, 50, 458–465 CrossRef CAS.
- K. Ding, Y. Wang, T. Shan, J. Xu, Q. Bao, F. Liu and H. Zhong, Org. Electron., 2020, 78, 105569 CrossRef CAS.
- T. Hodsden, K. J. Thorley, J. Panidi, A. Basu, A. V. Marsh, H. Dai, A. J. P. White, C. Wang, W. Mitchell, F. Glöcklhofer, T. D. Anthopoulos and M. Heeney, Adv. Funct. Mater., 2020, 30, 1–12 CrossRef.
- E. M. Espinoza, J. A. Clark, J. Soliman, J. B. Derr, M. Morales and V. I. Vullev, J. Electrochem. Soc., 2019, 166, H3175–H3187 CrossRef CAS.
- G. Li, S. Wang, D. Li, T. Liu, C. Yan, J. Li, W. Yang, Z. Luo, R. Ma, X. Wang, G. Cui, Y. Wang, W. Ma, L. Huo, K. Chen, H. Yan and B. Tang, Sol. RRL, 2020, 4, 1–9 Search PubMed.
- X. Li, L. E. Sinks, B. Rybtchinski and M. R. Wasielewski, J. Am. Chem. Soc., 2004, 126, 10810–10811 CrossRef CAS PubMed.
- M. H. Hennessy, Z. G. Soos, R. A. Pascal and A. Girlando, Chem. Phys., 1999, 245, 199–212 CrossRef CAS.
- F. F. So and S. R. Forrest, Phys. Rev. Lett., 1991, 66, 2649–2652 CrossRef CAS PubMed.
- F. Würthner, C. Thalacker, A. Sautter, W. Schärtl, W. Ibach and O. Hollricher, Chem. – Eur. J., 2000, 6, 3871–3886 CrossRef.
- A. D. Q. Li, W. Wang and L. Q. Wang, Chem. – Eur. J., 2003, 9, 4594–4601 CrossRef CAS PubMed.
- W. Wang, L. S. Li, G. Helms, H. H. Zhou and A. D. Q. Li, J. Am. Chem. Soc., 2003, 125, 1120–1121 CrossRef CAS PubMed.
- H. Langhals and R. Ismael, Eur. J. Org. Chem., 1998, 1915–1917 CrossRef CAS.
- T. Van der Boom, R. T. Hayes, Y. Zhao, P. J. Bushard, E. A. Weiss and M. R. Wasielewski, J. Am. Chem. Soc., 2002, 124, 9582–9590 CrossRef CAS PubMed.
- S. Marina, E. Gutierrez-Fernandez, J. Gutierrez, M. Gobbi, E. Solano, J. Rech, W. You, L. Hueso, A. Tercjak, H. Ade and J. Martin, Mater. Horiz., 2021, 1–24 Search PubMed.
- P. Westacott, N. D. Treat, J. Martin, J. H. Bannock, J. C. De Mello, M. Chabinyc, A. B. Sieval, J. J. Michels and N. Stingelin, J. Mater. Chem. A, 2017, 5, 2689–2700 RSC.
- L. Le Bras, K. Chaitou, S. Aloïse, C. Adamo and A. Perrier, Phys. Chem. Chem. Phys., 2019, 21, 46–56 RSC.
- W. Z. Yuan, P. Lu, S. Chen, J. W. Y. Lam, Z. Wang, Y. Liu, H. S. Kwok, M. Yuguang and B. Z. Tang, Adv. Mater., 2010, 22, 2159–2163 CrossRef CAS PubMed.
- M. Pope and C. E. Swenberg, Electronic Processes in Organic Crystals and Polymers, Oxford University Press, USA, 2nd ed., 1999, p. 1328 Search PubMed.
- W. C. Tsoi, D. T. James, J. S. Kim, P. G. Nicholson, C. E. Murphy, D. D. C. Bradley, J. Nelson and J. S. Kim, J. Am. Chem. Soc., 2011, 133, 9834–9843 CrossRef CAS PubMed.
- X. Rodríguez-Martínez, E. Pascual-San-José, Z. Fei, M. Heeney, R. Guimerà and M. Campoy-Quiles, Energy Environ. Sci., 2021, 14, 986–994 RSC.
- E. Pascual-San-José, X. Rodríguez-Martínez, R. Adel-Abdelaleim, M. Stella, E. Martínez-Ferrero and M. Campoy-Quiles, J.’Mater. Chem. A, 2019, 7(35), 20369–20382 RSC.
- Y. Wang, H. Zhong, Y. Hong, T. Shan, K. Ding, L. Zhu, F. Liu, H. Wei, C. Yu and H. Zhong, J. Mater. Chem. C, 2020, 8, 8224–8233 RSC.
- S. Marina, N. P. Kaufmann, A. Karki, E. Gutiérrez-Meza, E. Gutiérrez-Fernández, J. Vollbrecht, E. Solano, B. Walker, J. H. Bannock, J. de Mello, C. Silva, T. Q. Nguyen, D. Cangialosi, N. Stingelin and J. Martín, Adv. Mater., 2020, 32, 1–7 CrossRef PubMed.
- W. C. O. Ribeiro, V. Lobosco and P. F. M. Martinez, BioResources, 2020, 15, 8577–8600 CAS.
- F. A. Ogliari, C. Ely, C. H. Zanchi, C. B. B. Fortes, S. M. W. Samuel, F. F. Demarco, C. L. Petzhold and E. Piva, Dent. Mater., 2008, 24, 165–171 CrossRef CAS PubMed.
- D. Fairhurst, R. Sharma, S. Ichi Takeda, T. Cosgrove and S. W. Prescott, Powder Technol., 2021, 377, 545–552 CrossRef CAS.
- M. Hosseini, M. S. Roberts, R. Aboofazeli and H. R. Moghimi, Burns, 2021, 1–12 Search PubMed.
- M. S. Hossain, N. A. Rahim, M. M. Aman and J. Selvaraj, Int. J. Hydrogen Energy, 2019, 44, 14571–14579 CrossRef CAS.
- M. M. Crowley, A. Fredersdorf, B. Schroeder, S. Kucera, S. Prodduturi, M. A. Repka and J. W. McGinity, Eur. J. Pharm. Sci., 2004, 22, 409–418 CrossRef CAS PubMed.
- P. E. Keivanidis, I. A. Howard and R. H. Friend, Adv. Funct. Mater., 2008, 18, 3189–3202 CrossRef CAS.
- N. G. White and M. J. MacLachlan, J. Org. Chem., 2015, 80, 8390–8397 CrossRef CAS PubMed.
- I. Ahmad, J. Mahmood and J. B. Baek, Eur. J. Org. Chem., 2019, 2335–2338 CrossRef CAS.
Footnotes |
| † Electronic supplementary information (ESI) available. See DOI: 10.1039/d1tc05037k |
| ‡ These authors contributed equally to this work. |
| This journal is © The Royal Society of Chemistry 2022 |