Self-assembly of carbon nanodots induced by liquid–liquid phase separation in a surface microdroplet†
Miaosi
Li
 ,
Xiaotian
Wei
and
Lei
Bao
 *
*
School of Engineering, STEM College, RMIT University, Australia. E-mail: lei.bao@rmit.edu.au
First published on 4th July 2022
Abstract
Evaporating a sessile drop of ternary solutions containing one hydrotrope (such as ethanol) and two immiscible fluids exhibiting fascinating phase separation behaviours, has opened up a new pathway for controlled nanomaterial assembly. In this work, we studied the influence of liquid–liquid phase separation (LLPS) on the assembly of carbon nanodots (C-dots), 2 nm fluorescent carbon-based nanomaterials with high water solubility. Through self-evaporation of a micro-sized droplet containing ethanol, C-dot-water solution and different oils on a hydrophobic surface, C-dots rearranged into film, porous and granular structures by controlling the properties of oil component in the tenary droplet. Vapour pressure, solubility, surface tension and compositions of the oil components were investigated systematically for their impacts on the evaporation process of C-dot-laden droplets. By using confocal microscopy, we clearly revealed that C-dot assembly was triggered by LLPS in these four oil–water–ethanol ternary systems. The corresponding evaporation and assembly processes were unravelled to be determined by how the ternary solutions pass through the liquid–liquid equilibrium curves in the phase diagrams during evaporation. Our findings deepen the understanding of phase-separation behaviours for nanomaterial assembly as well as provide a novel, simple, and well-controlled approach for depositing different C-dot based nanostructures onto surfaces, which will benefit a wide range of practical applications in the fields of energy, environment and health.
Introduction
Carbon dots (C-dots) are a new class of fluorescent carbon nanomaterials defined by their characteristic size range of 2–10 nm.1,2 C-dots have sparked enormous research interest due to their advanced physical and chemical properties, including ultra-small size, excellent solvent solubility, biocompatibility, continuous and broad absorption spectra, high luminescent activity, significantly improved photostability, and environmental friendliness.3–8 As the alternative to metal and semiconductor based luminescent nanomaterials, C-dots with their pronounced and tuneable photophysical properties9–11 have been widely used for bioimaging,12–14 drug delivery,14–16 sensing,17–19 catalysis20–22 and optoelectronic applications.3,23–27 The functionalities of C-dots are connected with their structures. This is particularly critical when applying C-dots for solid-state applications, such as fabrication for sensing, electrochemical and optoelectronic devices. The absence of robust techniques for integrating C-dots into devices and the inherent luminescence quenching behaviour of C-dots in solid-state due to uncontrolled aggregation continue to be significant obstacles.3,10,23 To overcome this, current research indicates that incorporating C-dots into polymers,28,29 hard films with organic–inorganic matrices,30–32 and inducing C-dot self-assembly with coupling agents33 are the primary strategies for fabricating C-dots based devices. All of these methods necessitate precise control of the induced matrices. Furthermore, the study of controlling C-dot assembled nanostructures in solid forms remain largely unexplored.Evaporating a liquid containing multiple components has revealed intriguing behaviours and attracted many research interests.34–37 Especially evaporation-induced assembly has gained widespread recognition as a promising technique for self-assembling 1D to 3D structures with precisely controlled dimensions and functions.38 This method simply drys a drop of colloidal and particle-containing solution on a solid surface. When the drying takes place on a nonporous surface, such as silicon, edge enrichment (so called “coffee ring” effect) occurs as a result of the interaction of contact line pinning, solvent evaporation, and capillary flow, impeding this potentially beneficial technique.39,40 One feasible method to overcome the coffee ring effect is to use hydrophobic surfaces, where self-lubrication of the ouzo droplet during evaporation can result in a reduced contact area.41–43 The recent research advances indicate that evaporation of a colloidal droplet containing ternary solution with self-lubricating properties is a simple and effective method for controlled supraparticle assembly.44 The droplet is composed of a ternary mixture of ethanol, oil, and water. During evaporation, the fast evaporation rate of ethanol reduces the solubility of oil in the droplet, causing the oil phase to separate and contributing to the formation of porous supraparticles. The oil-to-particle ratio, size and surface properties of the assembled colloidal particles have been demonstrated to influence assembly structures.45,46
Distinguished from previous reported assembled silica colloidal particles in the range of 10 to 1000 nm and graphene-based materials,47,48 C-dots possess peculiar physical and structural features, including ultrasmall lateral dimension, a few layers of graphene sheets in-core structure and abundant surface functional groups. For example, surface oxides, such as carbonyl, carboxyl and hydroxyl groups, are the common species capping the carbon cores, enabling negative surface charge and high water solubility of C-dots.11 The recent report of positively charged nitrogen doped C-dots can assist graphene oxides in stabilising toluene–water emulsions even though C-dots alone showed week surface activity at the interface of toluene–water because of their high hydrophilicity.49 The interactions between C-dots and solvents in ternary solutions are anticipated distinctly but yet to explore. Furthermore, although evaporating ternary droplets has been used in nanomaterial assembly, it is still unclear how the composition and components of ternary solutions affect assembled structures.
Therefore, in this work, we investigated evaporating ternary droplets for C-dot self-assembly. Ternary solutions with different oils were formulated for the systematic studies of C-dot assemblies in evaporating surface microdroplets. Taking the advantage of the intrinsic luminescence of C-dots, different liquid–liquid phase separation (LLPS) processes during the evaporation were in situ visualised by confocal microscopy and correlated with the structural arrangement of C-dots for the first time. Critically, the achieved precise control of C-dot nanostructures on surfaces underpins the revealed LLPS behaviours. The presented cost-effective, robust and controllable approach could benefit various technologies, such as printing, device fabrications and surface modifications that require depositing colloidal nanoparticles onto surfaces.
Experiment section
Materials
The droplet liquids, including 1-octanol (99%), decane (99%), oleic acid (86%) and toluene (98%) were all purchased from Sigma-Aldrich. Ethanol (99%) was purchased from ChemSupply, Pty. Ltd, Australia, and water was obtained from a Milli-Q purification unit (Millipore Corporation, Boston, MA). The substrates were silicon wafers (University wafers) and precision glass slides hydrophobilized with 1H,1H,2H,2H-perfluorodecyltriethoxysilane (PFDTS, 98%, Sigma-Aldrich) by following the reported protocol in previous work.50 The static contact angle of water on PFDTS-Si substrate was 118 ± 3°.Synthesis of C-dots
Following the established procedures,9 fluorescent C-dots were achieved by oxidising carbon fibres (CFs) in nitric acid solution with subsequent ultrafiltration. Briefly, CFs were added to a solution of nitric acid that had been heated to 120 °C and refluxed for 48 hours. At a predetermined time point, the corresponding solution containing C-dots was collected and then neutralised with NaOH. The resulting solution was filtered by first using BIOSHARP membrane filters (0.22 μm) and then ultrafiltered sequentially using Millipore centrifugal filter devices equipped with four different molecular-weight cut-off (MWCO) membranes (i.e., 50, 30, 10, and 3 kDa). As a result, fractions with weights corresponding to 3 kDa were collected for the further investigation. After dialysis to remove salts and lyophilisation, the collected C-dot powders have been redissolved in MillQ water at a specific concentration and are now ready for use.Determination of liquid–liquid equilibrium diagram
To obtain the phase equilibrium diagram of the ternary system, different oil component was first mixed with ethanol in a series of concentration ratios, forming a clear single-phase solution. Water was then added to each solution until it became cloudy. These points were recorded and plotted as the binodal curve in the phase diagram. The critical points on the binodal curve was determined based on the amount of the added solvent into the ternary system when stable droplets formed. The location of the spinodal curve in the two-phase region was estimated based on the critical points.51Formulation of the ternary solution system
The ternary solutions studied in this work are composed of ethanol, water, and one of the following oils: toluene, decane, octanol and oleic acid. Formulations of the ternary solutions are listed in Table 1. Basically, for each oil condition, we formulated two compositions, one with high water content and the other with high oil content, referredas water-rich composition and oil-rich composition, respectively. The initial contact angles of the 0.5 μL droplets with these compositions on PFDTS-Si substrate are listed in Table S1 in the ESI.†| Oil component | Water rich | Oil rich | ||||
|---|---|---|---|---|---|---|
| Ethanol (%) | Water (%) | Oil (%) | Ethanol (%) | Water (%) | Oil (%) | |
| Toluene | 50 | 49 | 1 | 59 | 1 | 40 |
| Decane | 84 | 15 | 1 | 79 | 1 | 20 |
| Octanol | 50 | 49 | 1 | 50 | 15 | 35 |
| Oleic acid | 76 | 19 | 5 | 76 | 5 | 19 |
C-dot self-assembly through microdroplet evaporation on surface
The droplet solutions were prepared by mixing C-dot aqueous solution with prepared ternary solution, containing ethanol, water and one of the oils at certain ratios to generate a clear single-phase solution. The concentration of C-dots in final solution was fixed at 10 mg L−1. 0.5 μL aliquot of the mixed solution was deposited onto the PFDTS-Si surface and allow to dry at ambient environment. The evaporation of the solution component occurs spontaneously. All the droplets were evaporated at ambient environment in a chamber, with the average temperature at 22.5 ± 0.5 °C and the relative humidity at 40 ± 4%. The droplet deposited substrates were placed overnight before further processing to ensure the completely evaporation of the volatile components.Characterization of C-dots and assembled C-dot structures
For the characterization of the original C-dots, the crystallization information of C-dots was measured by an X-ray diffractometer (XRD, Bruker); the fluorescence and absorption spectra were obtained by a fluorescent spectrometer (PerkinElmer Fluorimeter) and a UV-vis spectrometer (Shimadzu UV), respectively. The JEOL 2100F transmission electron microscope (TEM) was used to collect the morphology and diffraction of individual C-dot. Fig. S1 in ESI† contains the C-dots’ characteristics, including their size, surface, diffraction pattern, crystallization, absorbance, and fluorescence. Briefly, the size of C-dots is 2.7 ± 0.5 nm. The XRD patterns are consistent with the diffraction patterns of TEM images, indicating the existence of 100 and 002 facets of graphite crystalline structure. Large peak of the D-band at 1300 cm−1 in Raman spectrum represents the high contents of surface oxides in the obtained C-dots. In terms of optical properties, the as-prepared C-dots emit green luminescence peaking at 520 nm.The optical images of the droplets and assembled C-dots were captured by an upright Nikon fluorescent microscope. The evaporation process was monitored by Nikon confocal microscopy. Scanning electron microscopy (SEM, FEI Verios 460L) was used to characterize the morphology of the C-dot-based nanostructures under extra high resolution. Atomic force microscopy (AFM, Dimension Icon, Bruker) was used to obtain the 3D packing profiles of the C-dot assemblies.
Results and discussion
Process of ternary droplet evaporation
The physical properties of the oil components that can critically affect droplet evaporation behaviours are summarised in Table 2. More precisely, the vapour pressure dictates the evaporation sequence of the components in the mixture. Within these solvents, due to its highest vapour pressure, ethanol will evaporate first, triggering the phase separation of the immiscible components, oil and water. Toluene was chosen as a representative case that oil evaporates faster than water. The remaining three oils, decane, octanol and oleic acid, which have lower vapour pressure than water, represented the scenario of oil evaporation after the water evaporation. Of note, decane and octanol are volatile compounds that will eventually leave the system after 24 hours while non-volatile oleic acid will remain in the system for the investigation period.| Substance | Vapour pressure (kPa) | Surface tension (in water, mN m−1) | Water solubility |
|---|---|---|---|
| a The data are obtained from NICB Pubchem database. | |||
| Water | 3.2 | 72.0 (in air) | |
| Ethanol | 7.9 | 22.4 (in air) | Miscible |
| Toluene | 3.8 | 36.1 | 526 mg L−1 |
| Decane | 0.17 | 51.1 | 0.009 mg L−1 |
| Octanol | 0.0087 | 7.92 | 540 mg L−1 |
| Oleic acid | 7.2 × 10⁻⁸ | 12.0 | Insoluble |
The evaporation process of each surface microdroplet was tracked in situ by the robust confocal microscopy, as shown in Fig. 1. As C-dots of green fluorescence and high hydrophilicity can only exist in the water phase out of the ternary mixture, the green section in confocal images indicates the water phase, while the dark liquid indicates the oil phase. Firstly, the evaporation processes of droplets containing toluene exhibit striking similarities for both water-rich and oil-rich cases (Fig. 1(a)). There was no phase separation observed and the liquid evaporated within the droplet contact area. As for the ternay droplets with decane as the oil (Fig. 1(b)), the water-rich composition also shows a similar process to that of toluene case. While in the case of oil-rich composition, dispersed droplets are observed immediately at the commencement of evaporation, they also coalesce rapidly within 15 seconds, followed by decane–water phase separation.
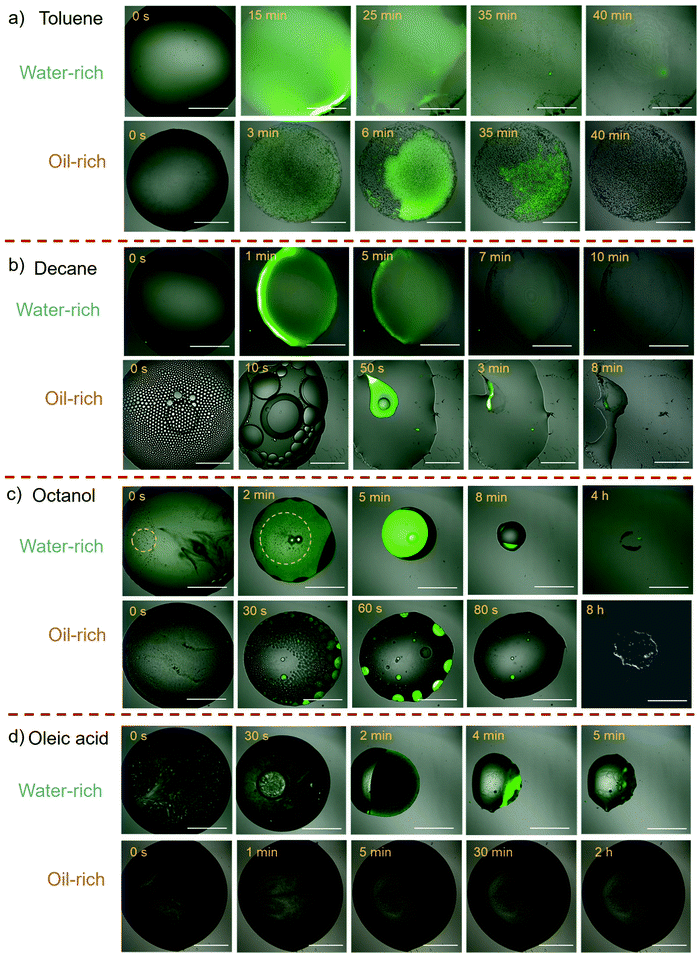 | ||
| Fig. 1 Confocal time-lapse images of the evaporation process of a C-dot ternary droplet containing toluene (a), decane (b), octanol (c) and oleic acid (d). Scale bar: 100 μm. | ||
In comparison, the octanol composed ternary droplet exhibits a significantly different evaporation pattern (Fig. 1(c)). For the water-rich composition, when ethanol was rapidly evaporated from the ternary solution, we observed stable emulsification (as highlighted by the yellow circulated area), followed by separation of the oil and water phases during the droplet evaporation (0–8 min). Water was then evaporated along the pinning edge of the oil, followed by final oil evaporation in the same location after 4 hours. For the oil-rich composition, there is no continuous phase of water observed; rather, water is generated as small droplets lightened by green fluorescence from the start to the end of evaporation and dissipated rapidly after 80 seconds.
The same emulsification and oil–water phase separation occurred in the oleic acid case with water-rich droplet composition (Fig. 1(d)). As oleic acid does not evaporate, the final pattern retains liquid. For its oil-rich composition, similarly no continuous phase of water has been observed, and the fluorescence of the water component is obscured by the huge amount of oil, making it difficult to monitor the evaporation process.
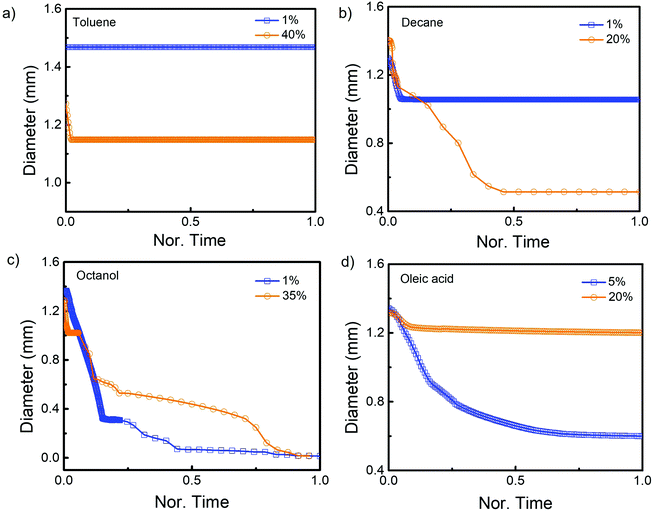
The evaporation of droplets over time was examined in detail. The plots in Fig. 2 illustrate the change in the droplet lateral diameter as a function of evaporation time in various systems. Due to the fact that different components and compositions result in varied droplet evaporation time, the evaporation time in each case was normalised by the maximum duration in this study. In the case of ternary droplets with toluene, the droplet diameters remained nearly constant during evaporation for both water-rich (1% toluene) and oil-rich (40% toluene) compositions (Fig. 2(a)). This phenomenon was also observed in the decane contained ternary droplets with water-rich composition (1% decane, Fig. 2(b)). However, when the decane content was increased to 20%, the contacting diameter decreased significantly during the first half of the evaporation duration but remained constant during the second half. Interestingly, during the evaporation of ternary droplet with octanol, the diameters of the droplets decreased monotonically in both the water- and oil-rich compositions (Fig. 2(c)). For the oleic acid composed ternary droplets (Fig. 2(d)), the droplet (5% oleic acid) showed steady retraction with time, the unchanged diameter of the droplets at very late stage represents the un-evaporated oleic acid component in the droplets. However, the ternary droplet with 20% oleic acid had a quick shrank in the beginning and for the rest of the time, its diamter remained constant.
Water evaporation rate of ternary droplet
As C-dots are only soluble in water, the water evaporation in ternary systems controls the rate of C-dots assembly. The droplet evaporation rate has been reported dependent on temperature, relative humidity, surface wettability, droplet composition, nanoparticle properties, etc.52 In our case, to verify the role of ternary composition on the evaporation rate, the temperature, relative humidity, droplet volume and are fixed for all the cases. Also, as listed in Table S1 (ESI†), the intial contact angles of all the ternary droplets didn’t show significance difference. The impact of surface wettability is considered equivalent for all the cases.The evaporation rate of water component in the different volatile ternary solutions was calculated based on the real-time confocal images. The results are summarised in Table 3. For comparison, the evaporation rate of C-dots in pure water solution and in 50% ethanol–water binary solution were also studied under the same conditions including temperature, humidity, substrate and droplet volume. Overall, the results indicate that the evaporate rate of water τwater is reduced in the binary and ternary system, when volatile components are introduced. Specifically, in the same oil system, τwater decreases as the increase of oil content. Moreover, when the content of oil is fixed in different systems, τwater increases with the decrease of vapour pressure of the oil. For example, in 1% oil content system of toluene, decane and octanol, τwater is 0.454, 0.106 and 0.074 nL s−1, respectively. In a multicomponent evaporation system, the relation between liquid composition and vapor composition is expressed by Raoults law:43
| p = pαxα + pβxβ+… | (1) |
C-dots assembly pattern based on droplet evaporation mode
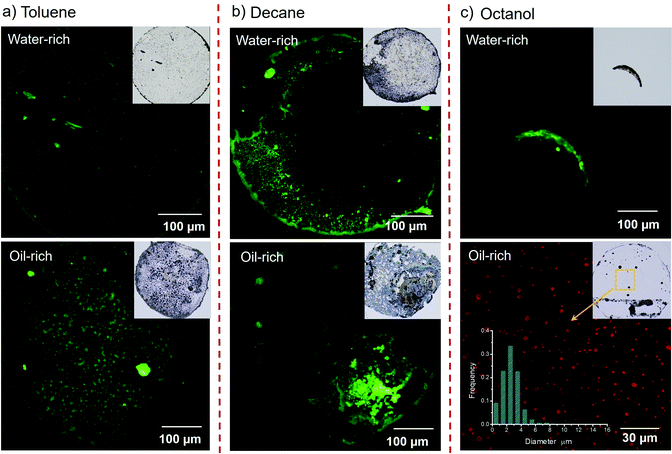
After all volatile components in the droplets have evaporated completely, the typical drying patterns and solid-state fluorescence of C-dot assemblies from various ternary systems are shown in Fig. 3. For toluene and decane cases, their dry patterns retain a circular shape with the original droplet contacting area with the presence of C-dot assemly strcutrues (Fig. 3(a) and (b)). In remarkable contrast, the drying patterns of the droplet in the octanol water-rich case exhibits an asymmetric “crescent moon” shape while dotty pattern was observed in the octanol oil-rich case (Fig. 3(c)). It is anticipated that the C-dot assemblies were confined within these spots. Notably, when compared to other patterns showing green luminescence under the observation through a reflective fluorescent microscope, the light emission of C-dots assembled from the octanol oil-rich case was found to be very dim in green but strong in red, indicating a redshift of the corresponding fluorecent spectrum.It is noticed that the internal flows of the evaporating droplets can have an effect on their dry patterns. In the case of toluene and decane-composed droplets, the coffee-ring effect is more pronounced in their watch-rich compositions. Due to the fast evaporation of ethanol and oil, the flow directs the C-dots to the pinning edge. Meanwhile, the surface tension gradient is enhanced due to the increase of oil content (i.e., in oil-rich compositions), which facilitates Marangoni flow. The Marangoni flow assists in re-circulating the C-dots and suppressing the coffee-ring effect, resulting in a more uniform pattern. In the case of octanol-composed droplets, however, phase separation plays a more dominant role in affecting the pattern due to the low surface tension of octanol, leading to very different dry patterns based on the content.
As to the droplet evaporation modes, it has been reported that the evaporation of a multicomponent sessile droplet on a hydrophobic surface proceeds in two main stages: a pinning stage during which the droplet contact angle decreases while the contact area remains constant, and a shrinking stage during which both the droplet diameter and contact angle decrease.40 The pinning stage is typically observed during the evaporation of ethanol and water binary droplets and has been identified as a result of the ethanol being concentrated on the liquid–vapour interface.53 Moreover, continuous droplet shrinkage is frequently observed during the evaporation of ethanol–water–oil ternary ouzo droplets,43–45 referred to as self-lubrication. In this work, although all of the droplets are formulated by ternary ethanol–water–oil systems, we can observe several distinct droplet evaporation patterns (Fig. 2). Accordingly, three evaporation modes were identified from all the cases (Fig. 4).
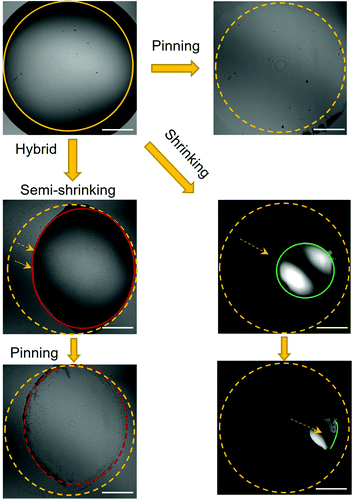 | ||
| Fig. 4 Representative optical images illustrating three typical droplet evaporation modes observed in this work. | ||
In the toluene case, the pinning process is favoured due to the faster evaporation rate of toluenethan that of water, leading to concentrated toluene at the liquid–vapour interface. Therefore plateau plots are obtained for the time-dependence of ternary droplet lateral diameter in the toluene system (Fig. 2(a)). When the oil component is replaced by octanol or oleic acid, which evaporates at a much slower rate than water, the shrinking or lubricating stage takes precedence. Following ethanol evaporation, the oil phase separates and forms a lubricating ring at the periphery of the evaporating drop, subsequently wets the hydrophobic substrate and prevents the contact line from being pinched.43 This is evidenced by the continuously reduction of droplet diameter plotted in Fig. 2(d). Besides these two cases, a hybrid evaporation mode is noticed for the ternary droplets containing decane. Once ethanol evaporated, the stick-slip mode, in which decane contained ternary droplet shrinkage, followed by the pinning was observed. When the decane concentration in the droplet increased (20% decane), the pinning effect was suppressed and the droplet shrinking became more pronounced (Fig. 2(b)). These different evaporation modes, ascribed to the variation of component evaporation sequence and content in the ternary droplet solutions, have resulted in varied drying patterns of C-dots showing in Fig. 3. Therefore, it is feasible to control the confined assembly of C-dots for designated applications via modulation of component evaporation sequence and content in the evaporating droplets.
Liquid–liquid equilibrium of the ternary droplet solution
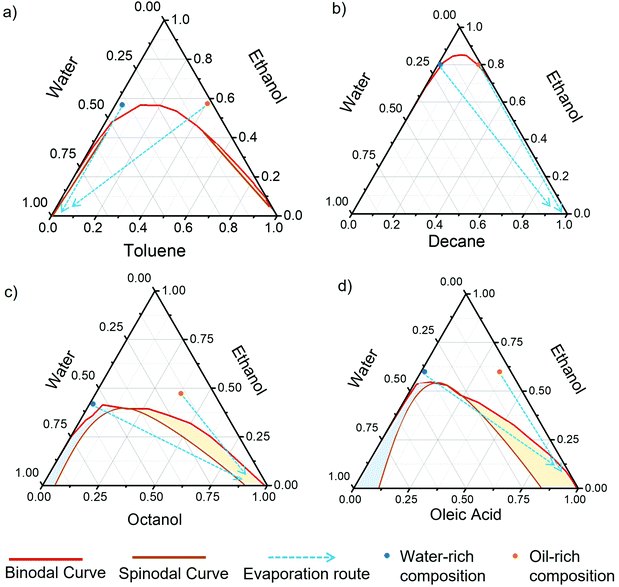
The component and composition of ternary solution not only play significantly role in influencing their evaporation mode, but also lead to a variety of LLPS behaviours during the evaporation. The LLPS associated with droplet composition change during evaporation can be traced out through the understanding of the phase equilibrium between ethanol, water and oil. The ternary phase diagrams of ethanol–water–oil for toluene, decane, octanol, and oleic acid are shown in Fig. 5. The binodal curve (miscibility–limit curve) denotes the areas of continuous phase (one-phase) and separated phase (two-phase), whereas the coloured region between the binodal and spinodal curve (stability–limit curve) denotes the two-phase dispersion area where micro/nanodroplets spontaneously form due to the “ouzo effect”.54 The “ouzo region” is composed of dispersed oil droplets formed in a water-rich continuous phase (blue coloured area). For certain oils, there is another region in the phase diagram where dispersed water droplets form in an oil-rich continuous phase (yellow coloured area), dubbed the “reverse ouzo region”. The ouzo effect, also known as spontaneous emulsification, occurs as a result of thermodynamic minima in the Gibbs free energy of a system.54 Therefore, dispersed droplets can stay very stable for a long time in this “metastable region”. All the listed physical parameters in Table 2 show great influence of the LLPS in droplet evaporation, which will eventually affect the C-dots assembly.LLPS triggered C-dot assembly
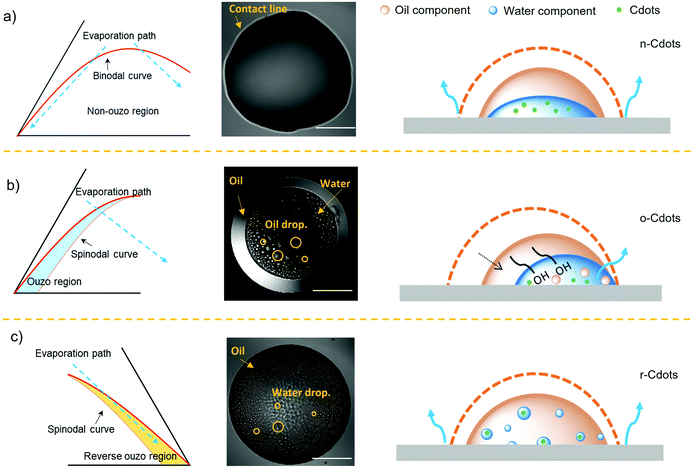
The phase equilibrium diagrams above clearly demonstrate how the LLPS behaviours alter during the evaporation of each ternary solution. As mentioned, the phase separation, in particular, can be classified into three primary scenarios, as illustrated in Fig. 6. The first is that only massive phase separation occurs during the evaporation of ternary solutions, which in this study is represented by the toluene and decane systems (Fig. 6(a)). Due to the high surface tension of these two oils in water, an unstable or non-emulsification effect (non-ouzo effect) takes place. Throughout the evaporation process, C-dots remain in a continuous water phase and are eventually assembled as a circular film due to the strong pinning effect in this senario. In the second scenario, when the phase separation occurs for octanol and oleic acid based ternary solution with water-rich composition (Fig. 6(b)), the ouzo effect takes place during the evaporation, resulting in dispersed oil droplets in water. These tiny oil droplets then collide to big oil droplet followed by the oil–water phase separation. The evaporation of this type of droplet is under continuous shrinkage because of self-lubrication effect.43 Specifically, due to the low surface tension and amphiphilic property of octanol, the oil–water phase boundary is not significant, leading to retraction of droplet contact line and forming a crescent moon shape. The last scenario involves the evaporation of octanol/oleic acid based droplet solutions with oil-rich componsition, which passes through reverse ouzo region. It means that dispersed water droplets will genearated in the oil phase, as illustrated in Fig. 6(c). C-dots will therefore be confined in these tiny water droplets rather than in continuous water phase as other cases. As such, the dry pattern of C-dot assemblies will follow the footprints of these water droplets after evaporation completes. Based on these phenomena, the structures of assembled C-dots have been defined as n-Cdots (non-ouzo), o-Cdots (ouzo) and r-Cdots (reverse ouzo). The understanding of the LLPS associated with the evaporation routes provide a rational guideline to control the assembly of C-dots during ternary droplet evaporation.Morphology and mechanism of C-dots assembly structures
SEM and AFM were used to characterise the fine morphology of different assembled C-dots following droplet evaporation. Fig. 7(a) summarises the SEM and AFM images of n-Cdots, o-Cdots, and r-Cdots at different resolutions. In comparison to C-dots evaporated from pure water droplet (see Fig. S2 in ESI†), all three types of C-dots from ternary droplets exhibit significantly different self-assembly structures. In particular, the n-Cdots are embedded as a flat carbon film confined in the droplet contacting area. The thickness of the film is about 70–300 nm. The o-Cdots have been assembled into a mesoporous structure, with nanoscale pores of 0.2 to 2 μm. The r-Cdots have been observed as nanoparticles, with the average size ranging from 60–100 nm. These structures are also uniform within the assembled area (see more images in Fig. S3, ESI†). The influence of C-dot concentration has also been studied. With 5-fold increase of the C-dot concentration, the morphology in each case remains the same (Fig. S4, ESI†).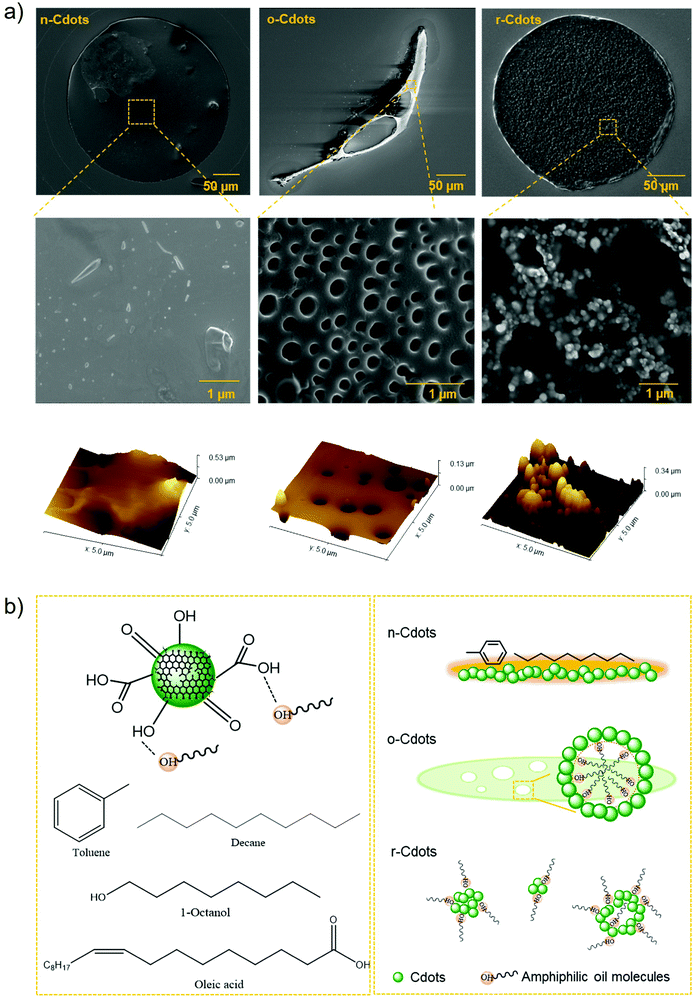 | ||
| Fig. 7 SEM and AFM imagesof C-dot structures derived from various LLPS conditions (a) and schematic illustration of the oil effect on C-dot assembly under various LLPS conditions (b). | ||
The different fine morphology of C-dot assembled structures is also attributed to the interactions of C-dots with oil molecules during LLPS. The chemical structures of C-dots and the four types of oils studied in this work are illustrated in Fig. 7(b). C-dots contain a variety of functional groups at the surface, including the –COOH, –OH, and C![[double bond, length as m-dash]](https://www.rsc.org/images/entities/char_e001.gif) O groups. When they come into contact with oil molecules, hydrogen bonding, π–π stacking, and intermolecular van de vales force can all contribute to the interactions between C-dots and the oil component at the oil–water interface. LLPS during ternary droplet evaporation, therefore, may significantly strengthen such interactions by generating the distinct oil–water interface.
O groups. When they come into contact with oil molecules, hydrogen bonding, π–π stacking, and intermolecular van de vales force can all contribute to the interactions between C-dots and the oil component at the oil–water interface. LLPS during ternary droplet evaporation, therefore, may significantly strengthen such interactions by generating the distinct oil–water interface.
The absence of ouzo or reverse ouzo effect results in n-Cdots with morphology similar to those formed by pure water evaporation. The more uniform carbon thin film on the other hand, indicate that the interaction of C-dots with the oil (toluene or decane) is in effect (Fig. 7(b), n-Cdots). For the C-dots assembled from amphiphilic oil systems (e.g., octanol), their surface can be more strongly bonded by the oil molecules, influencing their property significantly. When the ouzo effect is dominated during LLPS, oil droplets disperse in the continuous phase of water. C-dots absorb at the surface of oil micro/nanodroplets and stabilizes them,46 leading to the formation of nanopores in the final carbon film (Fig. 7(b), o-Cdots). In contrast, when reverse ouzo is in-effect, water droplets are formed and surrounded by oil. The enhanced oil–water interface results in a greater number of oil molecules attaching to the C-dots surface, creating larger size of C-dot particles and a shift in the fluorescence emission (Fig. 7(b), r-Cdots). The results of this work are very comparable to the reported work that demonstrates how the surface properties of colloidal particles influence their self-assembly patterns during ternary droplet evaporation.46 That is, hydration and surface modification of silica particles altered their interactions with oil droplets, adjusting the structures from flat film to supraparticles. In our work, the unique properties of C-dots, such as their exceptional water solubility, surface activity, and fluorescence, when combined with a variety of LLPS behaviours, significantly complement and extend the study and knowledge in this research area.
Conclusion
In conclusion, we investigated the LLPS induced self-assembly of C-dots confined on solid surface as a result of evaporating a ternary droplet. The confocal microscopy was employed to observe the evaporation process in real time while the liquid–liquid equilibrium phase diagram was utilised to trace out phase separation behaviours. For the first time, our studies provided an in-depth knowledge of the C-dots assembly driven by LLPS from multicomponent droplet evaporation. We discovered that the vapour pressure, solubility, surface tension, and composition of the ternary liquid all had substantial effects on the self-assembly of C-dots. In particular, the evaporation sequence controlled by component vapour pressure alters the droplet evaporation mode, which affects the assembly rate and pattern of C-dots. Additionally, our work underpins that the combination of oil evaporation sequence, surface tension, and composition results in three critical LLPS behaviours that affect C-dots assembly: the non-ouzo, the ouzo, and the reverse ouzo effects. The altered oil–water interface caused by these LLPS effects tunes the surface properties of C-dots, resulting in a variety of nanostructures for the assembled C-dots. Consequently, the pattern, property and structure of solid-state C-dots can be fine controlled as a result of the synergistic effect of the parameters discussed above. The findings and knowledge presented in this work open a new door for nanomaterial assembly, and provide a novel, easy, and robust method for generating and manipulating C-dot thin films on the surface, which will benefit a wide range of practical applications.Author contributions
M. L. implemented the main experiments and data analysis, and prepared the draft of the manuscript. X. W. supported the experiments. L. B. initiated and oversee the research, conducted preliminary experiments, organised research resources, reviewed the data and revised manuscript.Conflicts of interest
There are no conflicts to declare.Acknowledgements
The authors acknowledge the support from the Australian Research Council Discovery Early Career Researcher Award (DE190101514), RMIT Research and Innovation Fund and 2022 Career Reignite Fund (PRJ00000005). The authors also acknowledge technique supports from the Micro Nano Research Facility (MNRF), RMIT Microscopy and Microanalysis Facility (RMMF) and the vibrational research laboratory in RMIT University.References
- X. Xu, R. Ray, Y. Gu, H. J. Ploehn, L. Gearheart, K. Raker and W. A. Scrivens, J. Am. Chem. Soc., 2004, 126, 12736–12737 CrossRef CAS PubMed.
- K. Nekoueian, M. Amiri, M. Sillanpää, F. Marken, R. Boukherroub and S. Szunerits, Chem. Soc. Rev., 2019, 48, 4281–4316 RSC.
- S. Baker and G. Baker, Angew. Chem., Int. Ed., 2010, 49, 6726–6744 CrossRef CAS PubMed.
- S. Y. Lim, W. Shen and Z. Gao, Chem. Soc. Rev., 2015, 44, 362–381 RSC.
- H. Li, X. He, Z. Kang, H. Huang, Y. Liu, J. Liu, S. Lian, C. Tsang, X. Yang and S.-T. Lee, Angew. Chem., Int. Ed., 2010, 49, 4430–4434 CrossRef CAS PubMed.
- J. Liu, S. Lu, Q. Tang, K. Zhang, W. Yu, H. Sun and B. Yang, Nanoscale, 2017, 9, 7135–7142 RSC.
- S. Liu, J. Tian, L. Wang, Y. Zhang, X. Qin, Y. Luo, A. M. Asiri, A. O. Al-Youbi and X. Sun, Adv. Mater., 2012, 24, 2037–2041 CrossRef CAS PubMed.
- X. Sun, J. He, Y. Meng, L. Zhang, S. Zhang, X. Ma, S. Dey, J. Zhao and Y. Lei, J. Mater. Chem. A, 2016, 4, 4161–4171 RSC.
- L. Bao, C. Liu, Z.-L. Zhang and D.-W. Pang, Adv. Mater., 2015, 27, 1663–1667 CrossRef CAS PubMed.
- S. Zhu, Y. Song, X. Zhao, J. Shao, J. Zhang and B. Yang, Nano Res., 2015, 8, 355–381 CrossRef CAS.
- L. Bao, Z.-L. Zhang, Z.-Q. Tian, L. Zhang, C. Liu, Y. Lin, B. Qi and D.-W. Pang, Adv. Mater., 2011, 23, 5801–5806 CrossRef CAS PubMed.
- K. Jiang, S. Sun, L. Zhang, Y. Lu, A. Wu, C. Cai and H. Lin, Angew. Chem., Int. Ed., 2015, 54, 5360–5363 CrossRef CAS PubMed.
- J. Liu, D. Li, K. Zhang, M. Yang, H. Sun and B. Yang, Small, 2018, 14, 1703919 CrossRef PubMed.
- Q. Zeng, D. Shao, X. He, Z. Ren, W. Ji, C. Shan, S. Qu, J. Li, L. Chen and Q. Li, J. Mater. Chem. B, 2016, 4, 5119–5126 RSC.
- Q. Wang, X. Huang, Y. Long, X. Wang, H. Zhang, R. Zhu, L. Liang, P. Teng and H. Zheng, Carbon, 2013, 59, 192–199 CrossRef CAS.
- T. Feng, X. Ai, G. An, P. Yang and Y. Zhao, ACS Nano, 2016, 10, 4410–4420 CrossRef CAS PubMed.
- C. Liu, M. Yang, J. Hu, L. Bao, B. Tang, X. Wei, J. L. Zhao, Z. Jin, Q. Y. Luo and D. W. Pang, J. Phys. Chem. Lett., 2021, 12, 2727–2735 CrossRef CAS PubMed.
- Y. Long, L. Bao, J.-Y. Zhao, Z.-L. Zhang and D.-W. Pang, Anal. Chem., 2014, 86, 7224–7228 CrossRef CAS PubMed.
- A. Kalkal, S. Kadian, R. Pradhan, G. Manik and G. Packirisamy, Mater. Adv., 2021, 2, 5513–5541 RSC.
- J. Shen, Y. Zhu, X. Yang and C. Li, Chem. Commun., 2012, 48, 3686–3699 RSC.
- A. Datta, S. Kapri and S. Bhattacharyya, J. Mater. Chem. A, 2016, 4, 14614–14624 RSC.
- W. Liu, M. Li, G. Jiang, G. Li, J. Zhu, M. Xiao, Y. Zhu, R. Gao, A. Yu, M. Feng and Z. Chen, Adv. Energy Mater., 2020, 10, 2001275 CrossRef CAS.
- A. Xu, G. Wang, Y. Li, H. Dong, S. Yang, P. He and G. Ding, Small, 2020, 16, 2004621 CrossRef CAS PubMed.
- F. Yuan, S. Li, Z. Fan, X. Meng, L. Fan and S. Yang, Nano Today, 2016, 11, 565–586 CrossRef CAS.
- F. Rigodanza, M. Burian, F. Arcudi, L. Dordević, H. Amenitsch and M. Prato, Nat. Commun., 2021, 12, 2640 CrossRef CAS PubMed.
- M. Park, H. Yoon, J. Lee, J. Kim, J. Lee, S.-E. Lee, S. Yoo and S. Jeon, Adv. Mater., 2018, 30, 1802951 CrossRef PubMed.
- M. Yavari, M. Mazloum-Ardakani, S. Gholipour, N. Marinova, J. L. Delgado, S.-H. Turren-Cruz, K. Domanski, N. Taghavinia, M. Saliba, M. Grätzel, A. Hagfeldt and W. Tress, Adv. Energy Mater., 2018, 8, 1702719 CrossRef.
- Y. Zhou, S. K. Sharma, Z. Peng and R. M. Leblanc, Polymers, 2017, 9, 67 CrossRef PubMed.
- Y. Song, S. Zhu, J. Shao and B. Yang, J. Polym. Sci., Part A: Polym. Chem., 2017, 55, 610–615 CrossRef CAS.
- D. Bhattacharya, M. K. Mishra and G. De, J. Phys. Chem. C, 2017, 121, 28106–28116 CrossRef CAS.
- J. Ren, L. Malfatti, S. Enzo, C. M. Carbonaro, L. Calvillo, G. Granozzi and P. Innocenzi, J. Colloid Interface Sci., 2020, 560, 398–406 CrossRef CAS PubMed.
- S. Mura, R. Ludmerczki, L. Stagi, S. Garroni, C. M. Carbonaro, P. C. Ricci, M. F. Casula, L. Malfatti and P. Innocenzi, Sci. Rep., 2020, 10, 4770 CrossRef CAS PubMed.
- J. Liu, R. Li and B. Yang, ACS Cent. Sci., 2020, 6, 2179–2195 CrossRef CAS PubMed.
- T. Ozturk and H. Y. Erbil, Langmuir, 2020, 36, 1357–1371 CrossRef CAS PubMed.
- K. Sefiane, Fluid Dyn. Mater. Process., 2005, 1, 267–276 Search PubMed.
- C. Liu, E. Bonaccurso and H.-J. Butt, Phys. Chem. Chem. Phys., 2008, 10, 7150–7157 RSC.
- T. Ozturk and H. Y. Erbil, Colloids Surf., A, 2018, 553, 327–336 CrossRef CAS.
- C. J. Brinker, Y. Lu, A. Sellinger and H. Fan, Adv. Mater., 1999, 11, 579–585 CrossRef CAS.
- O. Deegan, R. Bakajin, T. F. Dupont, G. Huber, S. R. Nagel and T. A. Witten, Nature, 1997, 389, 827–829 CrossRef.
- H. Hu and R. G. Larson, J. Phys. Chem. B, 2002, 106, 1334–1344 CrossRef CAS.
- S. Wooh, H. Huesmann, M. N. Tahir, M. Paven, K. Wichmann, D. Vollmer, W. Tremel, P. Papadopoulos and H.-J. Butt, Adv. Mater., 2015, 27, 7338–7343 CrossRef CAS PubMed.
- Álvaro G. Marín, H. Gelderblom, A. Susarrey-Arce, A. van Houselt, L. Lefferts, J. G. E. Gardeniers, D. Lohse and J. H. Snoeijer, Proc. Natl. Acad. Sci. U. S. A., 2012, 109, 16455–16458 CrossRef PubMed.
- H. Tan, C. Diddens, P. Lv, J. G. M. Kuerten, X. Zhang and D. Lohse, Proc. Natl. Acad. Sci. U. S. A., 2016, 113, 8642–8647 CrossRef CAS PubMed.
- H. Tan, S. Wooh, H.-J. Butt, X. Zhang and D. Lohse, Nat. Commun., 2019, 10, 478 CrossRef CAS PubMed.
- L. Thayyil Raju, O. Koshkina, H. Tan, A. Riedinger, K. Landfester, D. Lohse and X. Zhang, ACS Nano, 2021, 15, 4256–4267 CrossRef CAS PubMed.
- O. Koshkina, L. T. Raju, A. Kaltbeitzel, A. Riedinger, D. Lohse, X. Zhang and K. Landfester, ACS Appl. Mater. Interfaces, 2022, 14, 2275–2290 CrossRef CAS PubMed.
- G. A. Turpin, S. A. Holt, J. M. Scofield, B. M. Teo and R. F. Tabor, Adv. Mater. Interfaces, 2020, 7, 1–9 Search PubMed.
- X. Zhang, Y. Wang, S. Watanabe, M. H. Uddin and D. Li, Soft Matter, 2011, 7, 8745–8748 RSC.
- H. C. Parks, T. M. McCoy and R. F. Tabor, Adv. Mater. Interfaces, 2019, 6, 16 Search PubMed.
- S. Peng and X. Zhang, Chem. – Asian J., 2017, 12, 1538–1544 CrossRef CAS PubMed.
- M. Li, L. Bao, H. Yu and X. Zhang, J. Phys. Chem. C, 2018, 122, 8647–8654 CrossRef CAS.
- M. Parsa, S. Harmand and K. Sefiane, Adv. Colloid Interface Sci., 2018, 254, 22–47 CrossRef CAS PubMed.
- K. Sefiane, L. Tadrist and M. Douglas, Int. J. Heat Mass Transfer, 2003, 46, 4527–4534 CrossRef CAS.
- S. A. Vitale and J. L. Katz, Langmuir, 2003, 19, 4105–4110 CrossRef CAS.
Footnote |
| † Electronic supplementary information (ESI) available. See DOI: https://doi.org/10.1039/d2sm00557c |
| This journal is © The Royal Society of Chemistry 2022 |

