
Quantitative analysis of biomolecule release from polystyrene-block-polyethylene oxide thin films†
Matthew S.
Horrocks‡
ab,
Tarek
Kollmetz‡
 ab,
Padraic
O’Reilly
c,
Derek
Nowak
c and
Jenny
Malmström
*ab
ab,
Padraic
O’Reilly
c,
Derek
Nowak
c and
Jenny
Malmström
*ab
aChemical and Materials Engineering, The University of Auckland, New Zealand. E-mail: j.malmstrom@auckland.ac.nz
bThe MacDiarmid Institute for Advanced Materials and Nanotechnology, Wellington, New Zealand
cMolecular Vista, San Jose, CA, USA
First published on 1st June 2022
Abstract
Block copolymers have garnered recent attention due to their ability to contain molecular cargo within nanoscale domains and release said cargo in aqueous environments. However, the release kinetics of cargo from these thin-films has not yet been reported. Knowledge of the release quantities and release profiles of these systems is paramount for applications of these systems. Here, Polystyrene-block-poly(ethylene oxide) (PS-b-PEO) was co-assembled with fluorescein isothiocyanate isomer I-lysozyme (FITC–LZ) and fluorescein isothiocyanate isomer I–TAT (FITC–TAT), such that these molecular cargos arrange within the PEO domains of the thin films. We show that high loading ratios of cargo/PS-b-PEO do not significantly impact the nanostructure of the films; however, a loading limit appears to be present with aggregates of protein forming at the microscale with higher loading ratios. The presence of lysozyme (LZ) within the films was confirmed qualitatively after aqueous exposure through photo-induced force microscopy (PiFM) imaging at the Amide I characteristic peak (∼1650 cm−1). Furthermore, we demonstrate that LZ maintains activity and structure after exposure to the polymer solvent (benzene/methanol/water mix). Finally, we demonstrate quantitatively 20–80 ng cm−2 of cargo is released from these films, depending on the cargo incorporated. We show that the larger molecule lysozyme is released over a longer time than the smaller TAT peptide. Finally, we demonstrate the ability to tune the quantity of cargo released by altering the thickness of the PS-b-PEO thin-films during fabrication.
Introduction
Interfaces between biomolecules, cells or tissues and natural or synthetic materials are crucial to study and control cell mechanisms in vitro that cannot be studied in vivo. Materials with controlled surface properties, such as stiffness,1–3 topography,4–9 and ligand presentation10–15 have been widely used to study biological processes in vitro. While initial work was mainly focused on the influence of static factors on biological processes, more recently, investigation into biochemical cues has been popularised within the literature, oftentimes in tandem with the aforementioned biophysical cues. Specifically relevant for the present study is the controlled delivery of molecules, which has previously been demonstrated from multilayer assemblies,16–19 biological materials such as ECM proteins,20–24 or polymeric nanocapsules.25–27 Multilayer systems have been suggested for growth factor (GF) storage and release, as they may allow for spatial and temporal control of GF release.28,29 Specifically, layer-by-layer (LbL) assembly has been used to deposit oppositely charged polyelectrolytes and GFs into functional polymer coatings on surfaces.28–31 LbL assemblies could depict a tuneable release of GFs and only minimal burst release depending on the choice of polyions and the overall charge density of the proteins embedded in the film.32,33 ECM-inspired delivery systems occupy a further portion of controlled biomolecule release literature. These systems involve GFs tethered to ECM molecules such as heparin due to their natural bioaffinity.34,35 One study that has been central to the understanding of the importance of GF internalization is the study by Schwab et al.36 In this work, they produced surfaces with patterns (interparticle distance of 36 ± 6, 56 ± 8, and 118 ± 18 nm) presenting a controlled surface density of covalently bound GFs achieving a local and sustained presentation to C2C12 myoblasts. Their work demonstrated that the GF in its immobilized form was more efficient than in its soluble form in stimulating the Smad-transcriptional pathway, the main signal transducer for receptors of the transforming growth factor β (TGF-β) superfamily.37 Block copolymers (BCPs) offer the potential for complex assemblies as well as the incorporation and release of molecules. BCP micelles38 and BCP thin films are commonly used for this purpose. BCP thin films can be self-assembled into several defined morphologies,39–42 and compared to traditional LbL assemblies, the feature sizes and morphologies of BCP thin films are tunable. However, while BCPs have been explored for large-scale surface patterning,43,44 the effective use of BCPs films as engineered biointerfaces remains a challenge. The ability to co-assemble various cargo and block-copolymers has been established in literature.45–47 Co-assembly presents a straightforward and effective way to combine the self-assembly features of block copolymers with the biological activity of the cargo. Polystyrene-block-poly(ethylene oxide) (PS-b-PEO) has been utilized extensively for this biomolecule co-assembly.46–48 Our research group has previously demonstrated the biocompatibility of PS-b-PEO thin films within cell culture in vitro.49 Further, we have explicitly demonstrated the ability for proteins to localise within the PEO domains of PS-b-PEO.47 While it has been shown that biomolecular cargo leaches out of PS-b-PEO films upon exposure to an aqueous environment, the release of cargo and its biological activity has only been analysed qualitatively. Challenges remain to quantify cargo release and activity over time due to the low but biologically relevant amounts of proteins released from such thin films.This study utilizes a relatively recent yet situationally useful technique known as photo-induced force microscopy (PiFM). PiFM is a scanning probe microscopy method that allows for the analysis of chemical specificity at the nanoscale. The combination of chemical and topographical analysis is crucial for the study of complex systems in a variety of fields.50–52 The system was conceptualised in 2010, when Rajapaksa et al.53 demonstrated the mechanical measurement of molecular resonance based on dipole–dipole interactions. Their system allowed for the detection of a force gradient between the interaction of photo-induced dipoles in a sample and the dipoles in a metallic atomic force microscopy (AFM) tip. PiFM combines the strengths of FTIR and AFM. This has potential applicability to protein polymer thin films by elucidating the chemical distinctions between the protein and polymer phases, while also providing topographical information. In this manuscript, PiFM was explored to attempt to locate the protein cargo within the PEO domains of PS-b-PEO and to highlight the presence of protein agglomerates on PS-b-PEO thin films after exposure to water.
A thorough understanding of PS-b-PEO thin-film construction and biomolecule incorporation is paramount to this manuscript. Our research group has previously studied and optimised the solvent composition of PS-b-PEO in a benzene/methanol/water (BMW) solvent mixture.48 In short, the ideal solvent composition was 81/17.9/1.1 vol% BMW, with ratios further from this point either phase separating or producing films with defects. Additionally, our research group has also confirmed the ability of these films to remain microscopically undisturbed with the incorporation of moderate concentrations of biomolecules.47,48 The biomolecules chosen for co-assembly in this study were lysozyme (LZ) and FITC–TAT. LZ was chosen as a model protein for GFs due to its commercial availability, stability, and enzymatic activity. Lysozyme has a molecular weight (14.3 kDa) similar to several common growth factors such as epidermal growth factors (EGF), 6.4 kDa54 or basic fibroblast growth factor 2 (FGF2), ∼18 kDa.55 TAT is a peptide from the HIV-1 virus transactivator of translation, responsible for cellular uptake56 and was also selected as a model molecule for GFs. TAT has a size within the order of magnitude of many GFs (2 kDa), while still being significantly different from the other model molecule, LZ. Furthermore, TAT is a cell penetrating peptide (CPP) known to strongly bind to the anionic cell surface in a receptor-independent manner, allowing it to enter the cell cytoplasm.57 This makes TAT an excellent model peptide as, going forward, it can emulate GFs that also function by being internalised by cells, such as EGF.
This manuscript presents the analysis of co-assembled LZ/PS-b-PEO and FITC–TAT/PS-b-PEO thin films. Firstly, the films were analysed by AFM regarding their morphology and integrity to establish loading limits. Subsequently, the qualitative release characteristics were studied by PiFM, similar to previously shown literature utilising AFM.47 This method provides a qualitative way to analyse the released and subsequently surface adsorbed protein. To use this hybrid system for cell studies and other applications, the structural integrity of the biomolecule cargo mustn't be affected by the fabrication method. Hence, this study presents the analysis of the enzymatic activity of LZ and polyethylene glycol–lysozyme (PEG–LZ) using a lysozyme activity assay, and the structural stability of LZ and PEG–LZ was analysed through CD-spectroscopy. Another crucial characteristic of this system is the release profile in aqueous buffer solutions. Consequently, the release of fluorescently labelled protein (LZ) and peptide (TAT) was studied over time, and pegylated and non-pegylated versions of protein and peptide were compared through fluorometric spectroscopy.
Methods
Materials
4-(2-Hydroxyethyl)-1-piperazineethanesulfonic acid (HEPES), sodium dodecyl-benzene-sulfonate (DBS), benzene (ACS reagent, 99%) and fluorescein isothiocyanate isomer I (FITC) were purchased from Sigma Aldrich (Auckland, New Zealand). Methanol (anhydrous, 99.8%) and lysozyme (from chicken egg white, protein ≥90%, ≥100![[thin space (1/6-em)]](https://www.rsc.org/images/entities/char_2009.gif) 000 units per mg protein, stored at −20 °C) were purchased from Merck (Kenilworth, United States). Phosphate buffered saline (PBS Tablets) was purchased from Gibco, Thermo Fisher Scientific (Auckland, New Zealand), Poly(styrene-block-ethylene oxide) (PS-b-PEO, PS(18 kg mol−1)-b-PEO(7.5 kg mol−1), 25.5 kg mol−1, Đ = 1.08, PS/PEO volume fractions 71/29) was purchased from Polymer Source Inc. (Montreal, Canada). M–PEG–succinimidyl (mPEG–SCM, 2 kg mol−1) was purchased from JenKem Technology USA (Plano, United States). Fluorescein isothiocyanate–PEG–succinimidyl (FITC–PEG–NHS, 2 kg mol−1) was purchased from Assay Matrix Pty (Ivanhoe North, Australia). Float-A-Lyzer G2 Dialysis Device (10 mL, MWCO 8–10 kDa) and Merck Amicon Ultra-4 spin concentrators (NMWL = 10 kg mol−1) were purchased from Lab Supply (Dunedin, New Zealand). Pur-A-Lyzer™ Midi Dialysis Kit (MWCO 1 kDa) and Coomassie Brilliant Blue G250 were purchased from Sigma Aldrich (St. Louis, U.S.). FITC–LC–TAT(47–57) was purchased from AnaSpec (Fremont, California, U.S.), where LC stands for long chain. PageRuler™ unstained low range protein ladder was purchased from Thermo Fisher Scientific (Auckland, New Zealand). The lysozyme activity assay kit (EnzChek, E-22013) was purchased from Life Technologies (Auckland, New Zealand). Gold-sputtered silicon wafers (100 nm Au, 10 nm Ti adhesion on 100, P-type, B-doped) were purchased from University Wafers, Boston, United States. If not stated otherwise, black non-treated 96 well plates with a clear bottom (#265301, Thermo Scientific, New Zealand) were used for experiments in the plate reader. All buffers were made in Type 1 water (18.2 MΩ cm, Milli-Q Direct 8).
000 units per mg protein, stored at −20 °C) were purchased from Merck (Kenilworth, United States). Phosphate buffered saline (PBS Tablets) was purchased from Gibco, Thermo Fisher Scientific (Auckland, New Zealand), Poly(styrene-block-ethylene oxide) (PS-b-PEO, PS(18 kg mol−1)-b-PEO(7.5 kg mol−1), 25.5 kg mol−1, Đ = 1.08, PS/PEO volume fractions 71/29) was purchased from Polymer Source Inc. (Montreal, Canada). M–PEG–succinimidyl (mPEG–SCM, 2 kg mol−1) was purchased from JenKem Technology USA (Plano, United States). Fluorescein isothiocyanate–PEG–succinimidyl (FITC–PEG–NHS, 2 kg mol−1) was purchased from Assay Matrix Pty (Ivanhoe North, Australia). Float-A-Lyzer G2 Dialysis Device (10 mL, MWCO 8–10 kDa) and Merck Amicon Ultra-4 spin concentrators (NMWL = 10 kg mol−1) were purchased from Lab Supply (Dunedin, New Zealand). Pur-A-Lyzer™ Midi Dialysis Kit (MWCO 1 kDa) and Coomassie Brilliant Blue G250 were purchased from Sigma Aldrich (St. Louis, U.S.). FITC–LC–TAT(47–57) was purchased from AnaSpec (Fremont, California, U.S.), where LC stands for long chain. PageRuler™ unstained low range protein ladder was purchased from Thermo Fisher Scientific (Auckland, New Zealand). The lysozyme activity assay kit (EnzChek, E-22013) was purchased from Life Technologies (Auckland, New Zealand). Gold-sputtered silicon wafers (100 nm Au, 10 nm Ti adhesion on 100, P-type, B-doped) were purchased from University Wafers, Boston, United States. If not stated otherwise, black non-treated 96 well plates with a clear bottom (#265301, Thermo Scientific, New Zealand) were used for experiments in the plate reader. All buffers were made in Type 1 water (18.2 MΩ cm, Milli-Q Direct 8).
Biomolecule functionalization
For preparation of FITC–LZ, LZ was dissolved in 10 mM carbonate bicarbonate buffer (pH 9.1) to a concentration of 5 mg mL−1. FITC was dissolved in dimethyl sulfoxide (DMSO) at a concentration of 5 mg mL−1. Subsequently, the DMSO/FITC solution was added to the LZ solution in varying ratios and reacted in the dark at 25 °C with continuous shaking for 2 hours. The final solutions were dialysed (MWCO 10 kg mol−1) against 1× PBS buffer for 10 days. The PBS buffer was changed every second day. Finally, the solutions were dialysed against Type 1 water for 24 hours. Subsequently, 4 mL of solution was transferred into spin concentrators (MWCO 8–10 kg mol−1) and spun in a Heraeus Multifuge X1R (Thermo Scientific, 7500 g, 4 min) until 2 mL of water passed through the membrane. After that, 2 mL of fresh Type 1 water was added to the remaining protein solution. This process was repeated three times. Lastly, the solutions were transferred into a centrifuge tube, frozen at −20 °C, and lyophilised (48 h, −50 °C, 150 mbar).To prepare PEG–FITC–LZ, LZ was dissolved in 10 mM HEPES buffer solution (pH 8.1, no additional salts). Shortly before the reaction, NHS–PEG–FITC was dissolved in 10 mM HEPES buffer (pH 8.1, no additional salts) at 7.5 mg mL−1. The two solutions were mixed at NHS–PEG–FITC/LZ weight ratios of 0.8. Subsequently, the solutions were incubated at 27 °C for 45 min in an Eppendorf ThermoMixer F1.5 (Mediray, Auckland, New Zealand) at 800 rpm.
After the reaction, the solutions were dialysed with a Float-A-Lyzer G2 Dialysis Device against 1.5 L of 1× PBS buffer at room temperature for 14 days with a daily buffer change. In the last dialysis, the solutions were dialysed against Type 1 water. The dialysed solutions were frozen at −20 °C and lyophilised (20 h at around −55 °C and 150 mbar) in a Virtis Benchtop lyophiliser (Biolab Scientific, Scarborough, Canada).
FITC–TAT was dissolved in Type 1 water and NHS–PEG was solubilised in 50 mM HEPES buffer solution (pH 8, no additional salts). The two solutions were combined at a FITC–TAT/NHS–PEG mass ratio of 1:10 and the mixture was incubated at 23 °C and 700 rpm for 1 h in an Eppendorf ThermoMixer F1.5 (Mediray, Auckland, New Zealand).
After the reaction, the solutions were dialysed (MWCO 1 kDa) against Type 1 water for 3 hr at 4 °C. The resulting PEG–FITC–TAT was aliquoted and dried with nitrogen flow for future use.
Thin-film fabrication
Gold-sputtered silicon wafers were used for spin-coating. The wafers were sectioned into ∼1 cm2 squares and cleaned by sonicating in acetone, ethanol, and water (twice each for 15 min) and dried under a stream of nitrogen.All PS-b-PEO thin films were produced by spin-coating solutions with a benzene/methanol/water (BMW) volume ratio of 81/17.9/1.1 vol% and PS-b-PEO (1% w/w) at room temperature onto the gold-sputtered silicon wafers. For loading films with cargo, the protein or peptide was dissolved in the water component of the BMW mixture before adding to methanol, then benzene.
Atomic force microscopy
Atomic force microscopy was conducted on a Cypher ES instrument (Asylum Research, Santa Barbara, United States). The images were recorded in tapping mode in air with a TAP150-G probe (Budget Sensors, Sofia, Bulgaria, nominal resonance frequency f: 100–175 kHz, force constant k: 1.5–15 N m−1). The topography images were analysed regarding the sample height profiles, while the background of the images was flattened in the post-processing by the Histogram filter using the Asylum Research Software AR15 (version 15.09.112, Oxford Instruments, Abingdon, United Kingdom), operating in Igor Pro (version 6.37, WaveMetrics, Lake Oswego, OR, USA).Photo-induced force microscopy
A VistaScope microscope from Molecular Vista Inc. was coupled to a LaserTune QCL product with a wave number resolution of 1 cm−1 and a tuning range from 770 to 1890 cm−1 from Block Engineering. The microscope was operated in dynamic mode, with NCH–Au 300 kHz non-contact cantilevers from Nanosensors.The reference thin film samples of polystyrene, poly(ethylene oxide), PS-b-PEO and LZ were made by fixing solid material on a glass substrate with epoxy glue. Epoxy-free regions were measured.
Circular dichroism spectroscopy
LZ and PEG–LZ were extracted from a BMW mixture by solvent evaporated under a nitrogen stream within 1 h. Subsequently, the proteins were resolubilised in Type 1 water, and the concentration was adjusted between 5 and 10 μM. A denatured PEG–LZ solution acted as a reference solution. The protein was denatured by adding DBS (final concentration 10 mM DBS) and subsequent shaking at 95 °C for 30 min. A quartz cuvette with a path length of 1 mm was used and thoroughly rinsed with water and ethanol before and after each run. The solutions were measured from 180 to 320 nm in 1 nm intervals. The ellipticity of protein solutions was measured for 0.5 s per data point. Five measurements per sample were averaged. The Type 1 water signal was measured five times, and the averaged curve was subtracted from the results accordingly.Lysozyme activity assay
A lysozyme activity assay kit (EnzChek, E-22013) was used to determine the enzymatic activity of PEG–LZ and LZ released from co-assembled thin films. In a typical assay experiment, 50 μL of a standard solution of a known concentration (ranging from 156 to 5000 ng mL−1, prepared in triplicates) and 50 μL of the sample solutions were added to a black clear-bottom 96-well plate. Subsequently, 50 μL of an LZ substrate working suspension were added to each well, and the plate was sealed and incubated at 37 °C for 45 min. The relative fluorescent units were measured in an EnSpire Multimode plate reader (PerkinElmer, New Zealand) at Ex/Em = 495/518 nm. The blank readings containing only buffer and substrate were averaged and subtracted from the standard and sample readings.Quantitative analysis of cargo release
The release rate of FITC–LZ and FITC–TAT, and their PEGylated counterparts, was determined in a Jasco FP-8600 NIR spectrofluorometer in polystyrene cuvettes (SARSTED AG & Co. KG, Nümbrecht, Germany) with a path length of 1 cm. The instrument settings for every measurement were as follows: excitation bandwidth 5 nm, emission bandwidth 5 nm, response time 0.05 s, photomultiplier tube (PMT) voltage 1400 V, and scan speed 2000 nm min−1.In a typical experiment, a substrate with a co-assembled PS-b-PEO/FITC–LZ or PS-b-PEO/FITC–TAT film was placed, film up, on the bottom of the cuvette. Before the first reading, 1.7 mL of filtered PBS buffer was added with a temperature close to room temperature. The relative fluorescence at Ex/Em = 495/510–600 nm was measured three times and averaged. At each timepoint, the relative fluorescent units (RFU) were recorded as a function of the emission wavelength. From each measurement, the RFUs at 518 nm were extracted. Before every reading, the solution was mixed by aspirating twice. The RFUs were converted into a concentration based on the linear fit of a standard curve of known concentrations. The standard curve samples were prepared in triplicates and read in the same instrument with the same instrument settings. Samples were prepared and measured as 6 samples per condition, 4 of which being presented in each dataset.
Statistical analysis
Results are reported as the mean ± standard error. A Student's two-sided t-test was employed to determine statistical significance, with significance accepted at p < 0.05.Results and discussion
Loading limits of biomolecular cargo within PS-b-PEO
Macroscopic inhomogeneity and microscopic defect formation in PS-b-PEO films have been well documented in past literature.47,58 These film defects can arise from an array of parameters, be it the solvent composition, post-treatment such as annealing, or, in this instance, loading with co-assembled material. Here, we investigate the loading limits of FITC–LZ and PEG–FITC–LZ in co-assembled PS-b-PEO films made from a BMW mixture with a composition of 81/17.9/1.1 vol%.AFM (1 × 1 μm) images of PS-b-PEO thin films with FITC–LZ/PS-b-PEO wt% loading ranging from 4–10 wt% are depicted in Fig. 1. Films were not annealed; hence the absence of the signature ordered hexagonally packed pattern of PEO cylinders within the PS matrix. At the sub-micro scale shown in Fig. 1, there appears to be no significant reductions in sub-micrometer film quality between films co-assembled with FITC–LZ at 4 and 10 wt% (Fig. 1A and B, respectively). Furthermore, there also appears to be no sacrifice in sub-micrometer film quality between films co-assembled with PEG–FITC–LZ at 4 and 10 wt% (Fig. 1C and D, respectively) and non-co-assembled films. This implies that at the sub-micron scale, films remain intact despite very high loading ratios. Loading ratios at 5 wt% and 7.5 wt% are also presented (Fig. S1, ESI†), further showing no significant differences in film nanostructure. A film without cargo is also detailed (Fig. S1E, ESI†), which shows no clear differences from any film with cargo. Sacrifices between high loading ratios and film quality are elucidated, however, when analysing the micro-scale quality of the films (Fig. S2, ESI†). For FITC–LZ co-assembled PS-b-PEO films, the light microscopy images at 4 and 5 wt% (Fig. S2A and B, ESI†) closely – but not exactly resembles what is expected from PS-b-PEO films not co-assembled with any cargo (Fig. S2I, ESI†), showing a flat microscopic surface scattered with some degree of defects. These defects appear to contain small dark agglomerates. At 7.5 wt% and 10 wt% loadings, however, while the sub-microscale morphology of the films (Fig. S1D (ESI†) and Fig. 1D) appears to remain unimpaired, the light microscopy images elucidate much larger dark agglomerates which congregate within and around the defects of the films. We believe this to be agglomerates of excess LZ that arrange within the free space of the defects as opposed to the PEO domains, as would be intended. The microscale quality of films loaded at 10 wt% (Fig. S2H, ESI†) seems to begin to be altered as larger undulations of the film can be seen. For PS-b-PEO films co-assembled with PEG–FITC–LZ, these protein agglomerates appear far more pronounced even at 4 wt% (Fig. S2E, ESI†), and the agglomerates, as was the case with non-PEGylated LZ, appear to increase in size at the wt% increases. Overall, these results imply that the reason why the sub-micron scale microstructure appears to remain unhindered could be due to some form of LZ–PEO saturation limit, wherein excess LZ begins to agglomerate within defects rather than the PEO cylinders. For this system, it can be concluded that no more than 5 wt% loading should be used to avoid significant cargo agglomeration.
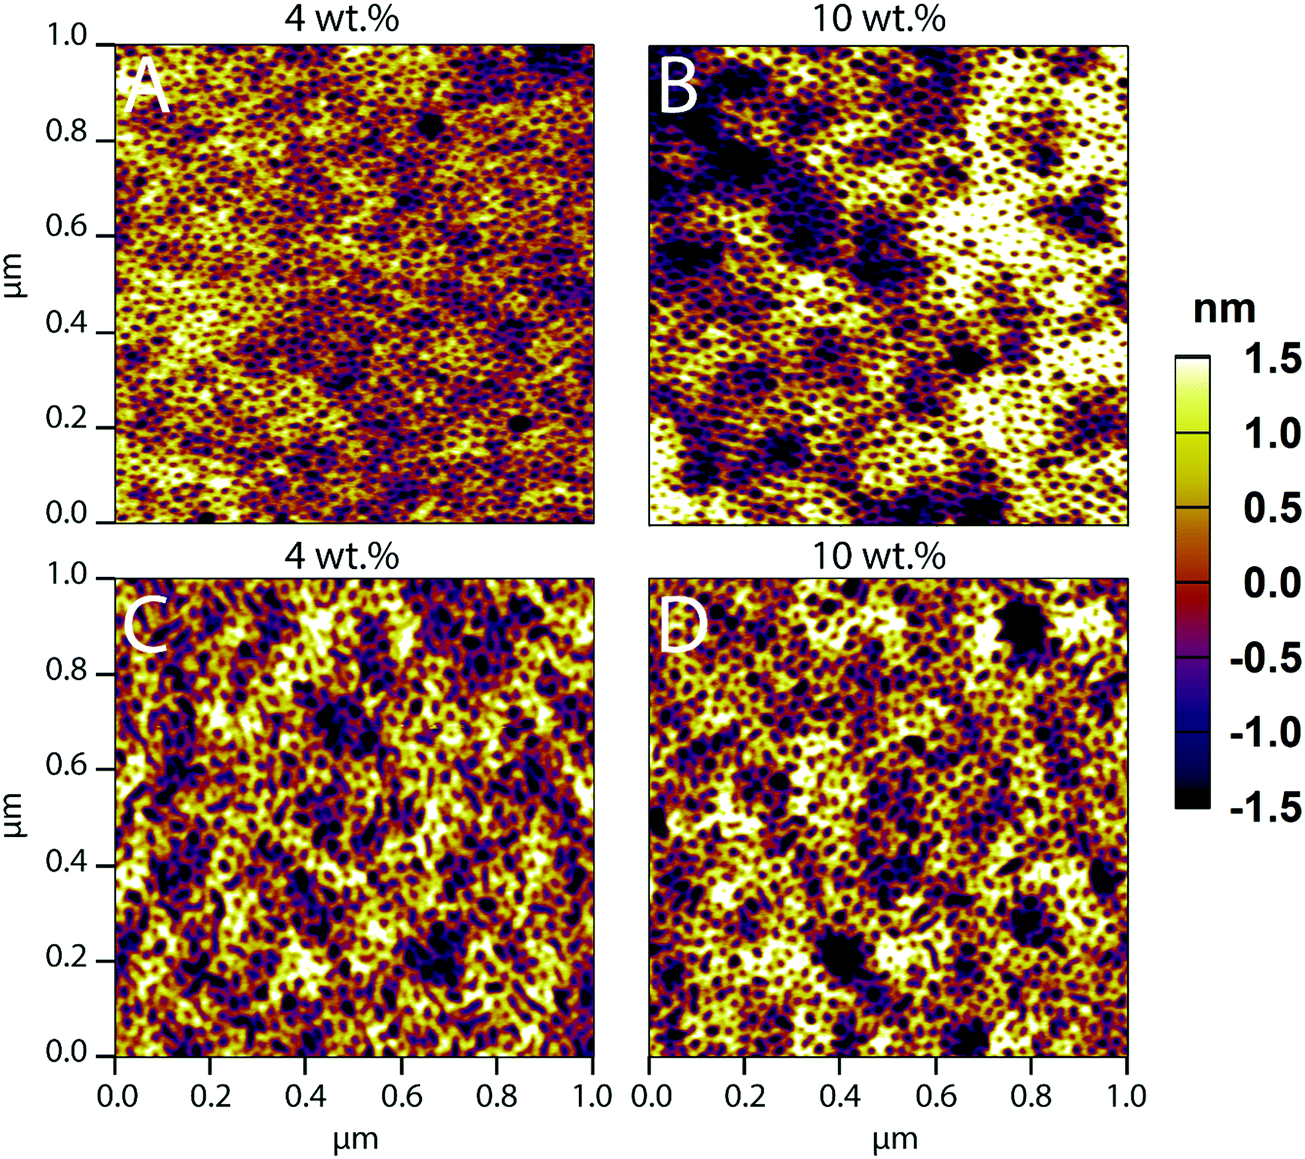 | ||
| Fig. 1 AFM images for (A, B) PS-b-PEO films co-assembled with LZ, (C, D) PS-b-PEO films co-assembled with PEG–LZ, for 4 wt% and 10 wt% loading. Samples were not annealed and were spun at 3000 rpm for 1 minute. | ||
Thin-film analysis through photo-induced force microscopy
Photo-induced force microscopy (PiFM) is a scanning probe microscopy technique that can simultaneously record topographical and chemical information of a surface.52,59 In this study, PiFM was explored as a method to detect biomolecular cargo in co-assembled thin films. PiFM allows for the chemical analysis with a spatial resolution down to around 5 nm, but it was unclear if the method would reveal the co-assembled cargo inside the film. To identify characteristic peaks for polystyrene, poly(ethylene oxide), PS-b-PEO and LZ, these materials were analysed individually through FTIR spectroscopy and PiFM (Fig. S3, ESI†). The comparison between data generated from FTIR spectroscopy and PiFM on bulk materials shows a clear overlap between the characteristic peaks of the individual materials (Table S1, ESI†). While the relative intensity of the peaks varies between bulk (FTIR) and film (PiFM) measurements, the results demonstrate that PiFM is suitable for resolving individual peaks of FTIR spectroscopy.The most intense and separated FTIR peaks of polystyrene, poly(ethylene oxide), PS-b-PEO and LZ align well with the literature. The PS peaks can be assigned to CH2 stretching of the PS backbone (1451 cm−1) and the deformation vibration of the benzene ring (1492 cm−1).60 The characteristic peaks for poly(ethylene oxide) can be assigned to the C–O–C stretch (1117 cm−1) and the C–C stretch (1147 cm−1) of PEO.61 The characteristic peaks for LZ are commonly found in proteins. Amide I (∼1650 cm−1) bands mainly arise due to the C![[double bond, length as m-dash]](https://www.rsc.org/images/entities/char_e001.gif) O stretching vibration in peptide bonds. Amide II (∼1550 cm−1) is associated with C–N stretching vibrations and N–H in-plane bend vibrations.62,63 After identifying relevant wavenumbers for the analysis of PS-b-PEO thin films, the topography of the films and the photo-induced force at different locations were analysed in a surface-sensitive mode (Fig. 2).
O stretching vibration in peptide bonds. Amide II (∼1550 cm−1) is associated with C–N stretching vibrations and N–H in-plane bend vibrations.62,63 After identifying relevant wavenumbers for the analysis of PS-b-PEO thin films, the topography of the films and the photo-induced force at different locations were analysed in a surface-sensitive mode (Fig. 2).
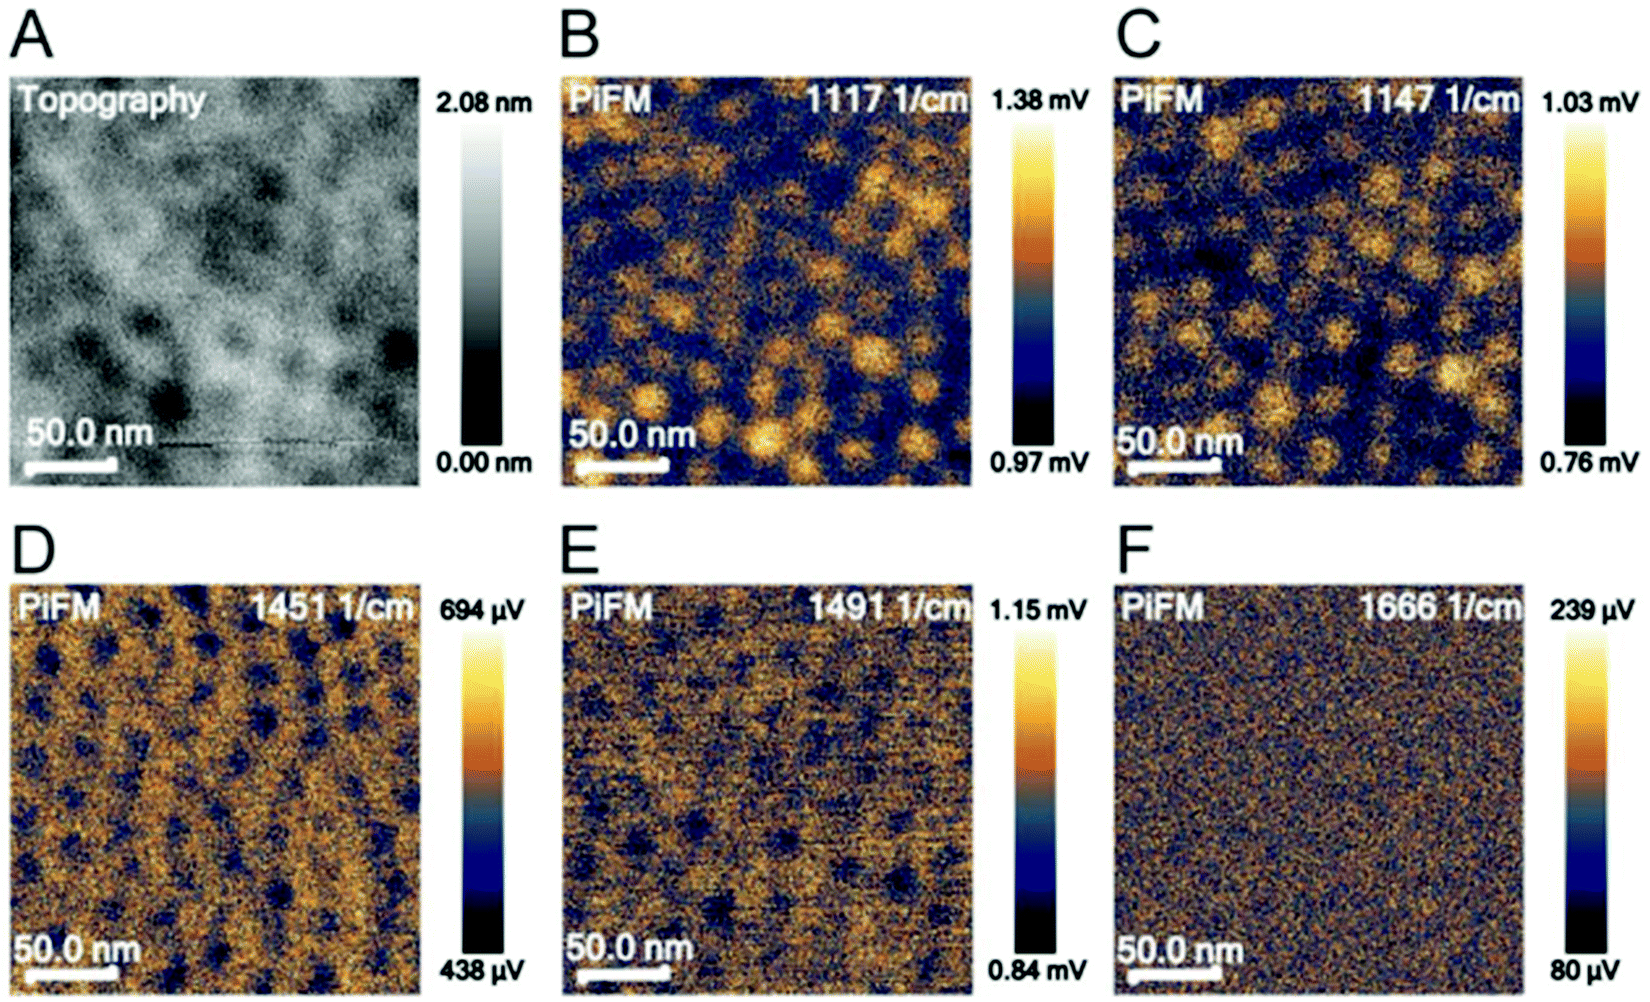 | ||
| Fig. 2 Topography (A) and PiFM images of a PS-b-PEO thin-film not containing protein cargo imaged in surface-sensitive mode at 1117 (B), 1147 (C), 1451 (D), 1491 (E), and 1666 cm−1 (F). 1117 and 1147 cm−1 are attributed to PEO, 1451 and 1491 cm−1 are attributed to PS and 1666 cm−1 is attributed to lysozyme. | ||
PiFM spectroscopy was also performed on films co-assembled with PEG–LZ (Fig. S4, ESI†) and PS-b-PEO films without cargo (Fig. 2). No difference in peak intensities was apparent for films with cargo compared to PS-b-PEO alone, despite an increase in laser intensity to 10% in the range above 1240 cm−1. Both spectra show the same peaks, including the most intense peaks found on the PS and PEO reference spectra. Furthermore, there was no evidence of LZ in the PiFM image shown in Fig. 2F. The PiFM images highlighted the depressions at 1117 and 1147 cm−1. These wavenumbers are associated with PEO. However, unlike in the trials of non-co-assembled films (Fig. 2D and E), the polystyrene matrix could not be clearly highlighted in PiFM images at 1451 (Fig. S4D, ESI†) and 1491 cm−1 (Fig. S4E, ESI†).
Overall, the location of PEG–LZ within the thin film could not be determined using PiFM. This could be explained by the spatial resolution limits and the low amount of LZ within each PEO domain. These findings are in accordance with the literature, which mainly employs PiFM for larger features51,59,64 and predominantly on surfaces due to the steep fall-off of the gradient force (or dipole force) as a function of imaging distance.59,65 Instead of locating PEG–LZ within the film, another approach was chosen to show released PEG–LZ after exposure to water and subsequent drying. This sample exhibited a comparatively rough surface compared to films that were not exposed to water. Two PiFM images at 1451 (PS-associated) and 1666 cm−1 (LZ-associated) are shown in Fig. 3, in which the contrast between the elevations and the flat background can be seen clearly.
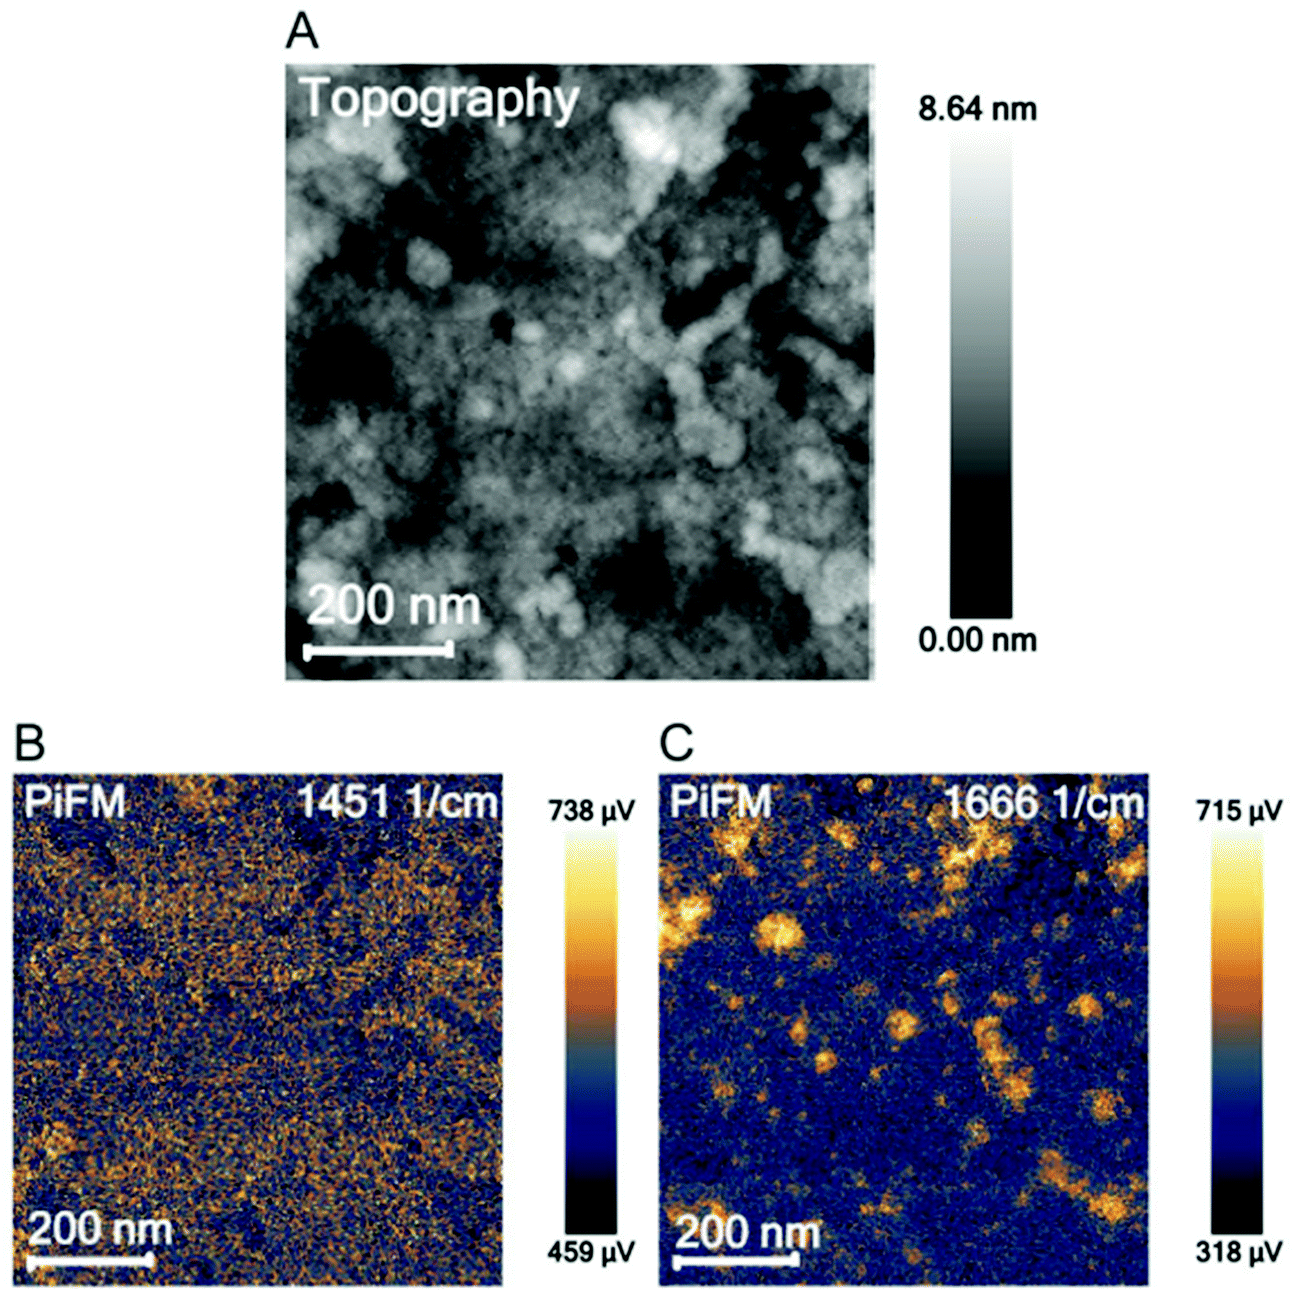 | ||
| Fig. 3 AFM topography image (A), a PiFM image at 1451 cm−1 attributed to polystyrene (B) and at 1666 cm−1 attributed to lysozyme (C). | ||
While PiFM was unsuccessful in locating PEG–LZ cargo in either the cylindrical PEO domains or the PS matrix, protein deposits were found on top of the film in the case of a film exposed to water. Such deposits are associated with released and agglomerated PEG–LZ after exposure to water.
Lysozyme structure and activity after solvent exposure
The effect of PEGylation and exposure to the BMW mixture on the secondary structure was studied through CD spectroscopy (Fig. 4A). The covalent binding of a large polymer chain could potentially lead to a change in protein folding. Furthermore, the exposure of proteins to organic solvents is known to affect the protein secondary structure potentially. To analyse these effects, CD spectra of LZ and PEG–LZ were acquired in a range between 180 and 250 nm before and after exposure to various solvents. Comparing the spectra of the references and the resolubilised samples reveals that they all show the same local minima, maxima and inflection points. The intensities of the peaks vary slightly. However, this may be attributed to slightly different protein concentrations in the solution. The PEGylation neither improved the stability of LZ in this experiment nor impacted the secondary structure negatively. The CD spectra of the denatured LZ exhibit a significantly different profile. Contrary to the expectation, the curve does not show a characteristic random coil shape. Instead, with a local maximum at around 198 nm and a local minimum around 225 nm, the secondary structure appears to have transitioned to a dominantly β-sheet structure.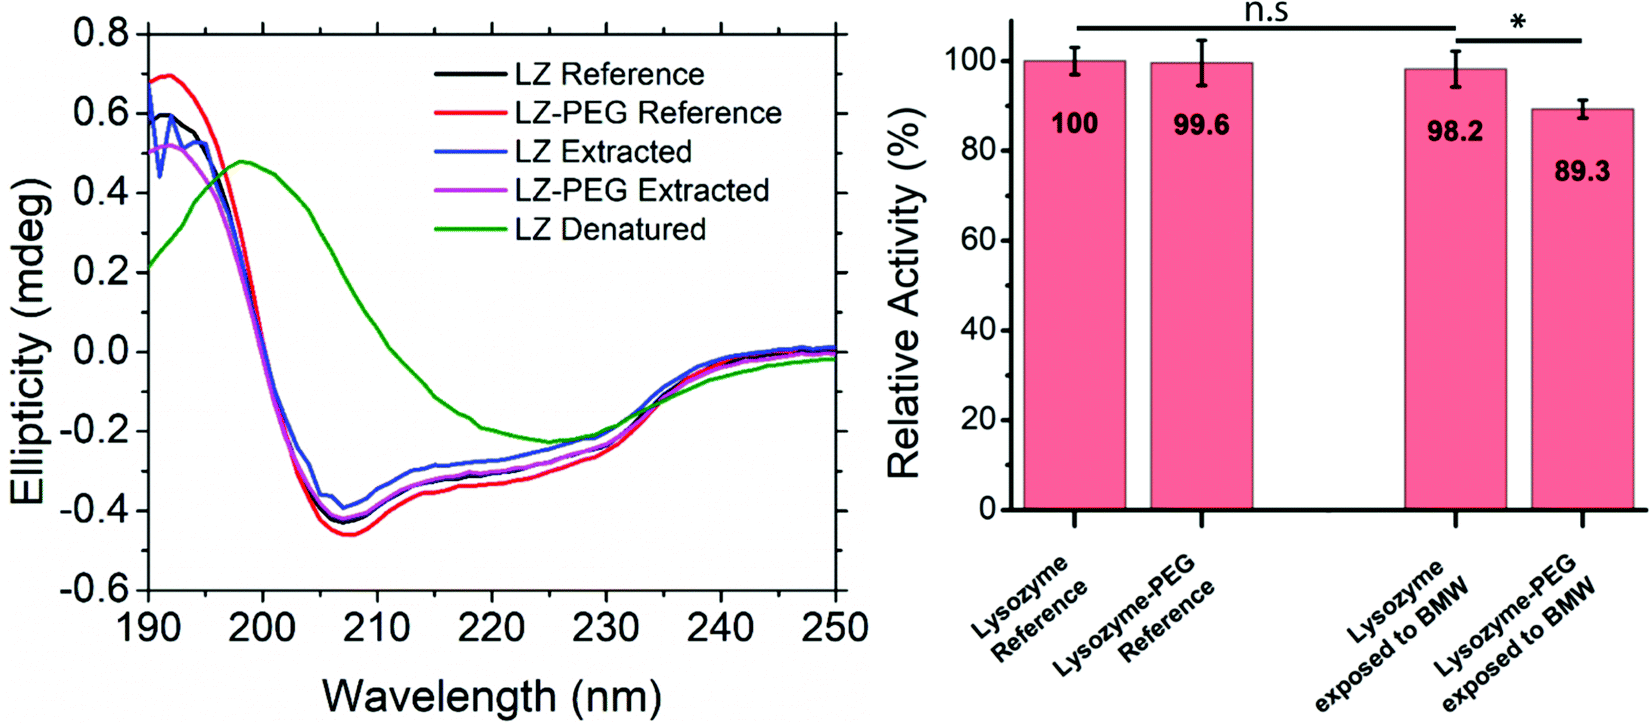 | ||
| Fig. 4 (A) CD spectra of a LZ and PEG–LZ reference compared to LZ and PEG–LZ extracted from a BMW mixture and a solution of denatured LZ. (B) Relative enzymatic activity of LZ and PEG–LZ in 1× PBS buffer compared to LZ and PEG–LZ exposed to the BMW solvent mixture, dried and resolubilised in 1× PBS buffer. The concentration of all samples was 5000 ng mL−1, and each condition was duplicated into 4 wells, measured and averaged. The error bars represent the standard deviation. * is determined using a two-sample t-test, and represents statistical significance at 0.01 < p < 0.05. | ||
An enzyme activity assay (EnzChek) was used to confirm the findings of CD-spectroscopy. The activity of LZ and PEG–LZ in PBS was compared to LZ and a PEG–LZ solubilised in a BMW mixture (81/17.9/1.1 vol%), dried within 1 h under nitrogen stream and resolubilised in PBS buffer. This process of solvent exposure, drying and resolubilisation closely resembles the thin film fabrication through co-assembly. The results of this quantitative comparison are shown in Fig. 4B. Relative fluorescence was compared to a standard curve found in Fig. S5 (ESI†).
LZ in PBS buffer acts as the relative reference for the other solutions. In this experiment, PEGylation of the LZ did not lead to a significant difference in enzymatic activity. The same applied to LZ that was exposed to BMW and resolubilised. Despite very similar activities of LZ and PEG–LZ references, PEG–LZ exposed to BMW showed a small decrease of around 11% activity compared to LZ in PBS. This result is surprising since the PEGylation was expected to stabilise and protect LZ in the solvent mixture. Small concentration differences or pipetting errors cannot be excluded from contributing to this result. The presence of water may explain the stability of LZ and PEG–LZ in the BMW mixture. Even small amounts of water (1%) were found to retain protein secondary structure in nonaqueous solutions.66 It needs to be noted that LZ is known for above-average stability under harsh conditions (such as temperature or heat).67 While the results, shown in Fig. 4, demonstrate that the PEGylation did not enhance stability after exposure to the BMW mixture, PEGylation is expected to be crucial for protecting less stable proteins. Furthermore, the PEGylation may also aid in spatial selective assembly into the PEG domains of the thin films.
Quantitative analysis of cargo release
While co-assembly within and release from PS-b-PEO films have been established, the quantitative release characteristics are crucial for using these films in cell experiments and have not been reported in the literature yet. A quantitative release analysis of cargo within PS-b-PEO under aqueous conditions is paramount in propelling these systems towards in vivo cell culture. To this end, unveiling a viable method when working with such low protein concentrations embedded within a solid matrix is crucial.By coupling a fluorescent molecule such as FITC, which can bind to the amine groups of many peptides, techniques such as microplate reader or fluorometric spectroscopy can be utilised. Spectrofluorometry yielded the most convincing results, wherein samples measured showed clear, replicable peaks, with the peaks maintaining integrity at concentrations corresponding to extremely low loading ranges (<10 ng cm−2).
To measure the release, films were prepared with cargo loading based on the weight ratio of FITC–LZ, PEG–FITC–LZ, FITC–TAT, and PEG–FITC–TAT, with PS-b-PEO, denoted by mFITCLZ/SEO, mPEGFITCLZ/SEO, mFITCTAT/SEO and mPEGFITCTAT/SEO. Unless stated otherwise, films were made with a weight ratio of 4 wt% (FITC–LZ/PS-b-PEO and PEG–FITC–LZ/PS-b-PEO) and 0.57 wt% (FITC–TAT and PEG–FITC–TAT). Hence, the expected total protein or peptide per film (A = 1 cm2) is ∼254 and ∼36 ng, respectively. Other parameters and calculations used can be found in the ESI†.
Fig. 5 depicts the release of non-PEGylated and PEGylated FITC–TAT and FITC–LZ, determined through spectrofluorometry. The release was measured as a function of time on four substrates for each condition. The release profile for these conditions, barring FITC–TAT, can be generally described in three different stages: firstly, the substrates released a significant amount of cargo after the addition of PBS before the first measurement, which took place within seconds. Further, the substrates continued to release considerable amounts of cargo between 1 min and 20 min. Lastly, all curves showed either a characteristic plateau or a gradual slow release after this point up until the end of measurement at 100 min. Fig. 5B, depicting the release of PEG–FITC–TAT, follows this described release profile closely, with 9.39 ± 1.08 ng cm−2 of PEG–FITC–TAT released instantaneously, with a relatively rapid increase over 20 minutes, to 18.97 ± 1.55 ng cm−2. Following this, the release showed a plateau for the rest of the experiment. Interestingly, for FITC–TAT release, shown in Fig. 5A, this expected release profile did not eventuate. Instead, an initial release significantly higher than for PEG–FITC–TAT, at 21.1 ± 7.98 ng cm−2, was observed, followed by a steady decrease over 20 minutes, to 14.06 ± 5.11 ng cm−2. This was followed by a relative plateau, albeit with release rising after 75 minutes and falling again after 100 minutes. The most likely explanation for this is for something to be occurring to the FITC–TAT after it is released, as reabsorption into the films after the initial burst release is implausible. We believe that in its non-PEGylated state, FITC–TAT adheres to the walls of the measuring cuvette over time, therefore decreasing the fluorescence reading and hence the perceived release over time. Considering the total area available for peptide adhesion within the cuvette is ∼9 cm2, and the working peptide concentrations are in the range of ∼20 ng mL−1; this is well within the range for monolayer adsorption to significantly impact the overall concentration within solution. This hypothesis was supported by measuring the fluorescence of a stock solution of known concentration over time, which also decreased (data not shown). The cause of this adsorption is likely due to electrostatic interactions between the peptide and cuvette. Polystyrene is known to possess a slightly negative surface charge,69 while, as with most CCPs, TAT is known to be highly positive under physiological conditions due to the presence of many arginine groups.70 Similar observations were attained when the same experiment was repeated with a quartz cuvette (data not shown), and quartz is also known to carry a negative charge at physiological pH.71 PEGylation of such biomolecules is believed to suppress surface adsorption.
 | ||
| Fig. 5 Release of (A) FITC–TAT, (B) PEG–FITC–TAT, (C) FITC–LZ and (D) PEG–FITC–LZ from PS-b-PEO thin films over time. Release was determined by spectrofluorometry. Hollow shapes represent the release over time of a single sample, while red squares are the mean. Error bars, also in red, represent standard deviation. 4 samples per condition. | ||
The release of FITC–LZ and PEG–FITC–LZ under equivalent conditions to above is depicted in Fig. 5C and D. Both the release profiles of Fig. 5C and D, being the release of FITC–LZ and PEG–FITC–LZ, respectively, show the characteristic 3-stage release profile described earlier. FITC–LZ release showed an initial release of 61.95 ± 9.32 ng cm−2, with an eventual plateau after 30 minutes at 81.01 ± 14.8 ng cm−2. PEG–FITC–LZ was initially released at 37.32 ± 10.92 ng cm−2, with a rapid release stage over 20 minutes to 70.51 ± 9.59, and a gradual release over the remainder of the experiment to 78.86 ± 13.63 nm cm−2. The first observation that can be made is that in its non-PEGylated state, FITC–LZ does not seem to have the same adsorption issues that lead to unreliable readings for FITC–TAT. Although LZ is also known to be positive at physiological pH,72 the extent of this charge is lesser than with TAT, which could be the reason for this observation. Furthermore, PEG–FITC–LZ does not seem to show a true plateau in the latter stages of measurement, indicating that residual cargo could be released subsequent to the initial burst release. We believe that the larger relative size of LZ to TAT could cause this, wherein larger molecules are less prone to total burst release.
Long-term release
To investigate if there is a steady, moderate release of cargo over prolonged periods, the long-term release of both PEG–FITC–TAT and PEG–FITC–LZ was measured over 8 h with spectrofluorometry. The release of PEG–FITC–TAT over 8 h, shown in Fig. 6A, shows a release emulating the short-term release shown in Fig. 5B. After an initial release of 14.86 ± 1.88 ng cm−2, growing to 23.63 ± 2.91 ng cm−2, there was no further significant increase in release over the remaining length of the experiment, indicating that all cargo had been released within the first 20 minutes of measurement. | ||
| Fig. 6 Release over 8 h of (A) PEG–LZ and (B) PEG–FITC–TAT determined using spectrofluorometry. Hollow shapes represent the release over time of a single sample, while red squares are the mean. Error bars, also in red, represent standard deviation. Error bars represent standard deviation. 4 samples per condition. | ||
Long-term release of PEG–FITC–LZ is presented in Fig. 6B. It is evident that there is a release of residual cargo over time. After 20 min, which is the time wherein the bulk release observed in Fig. 5D occurred, a release of 60.41 ± 5.82 ng cm−2 PEG–FITC–LZ was observed. Over the course of measurements, this release increased steadily by 26% across all samples, to 75.91 ± 6.36 ng cm−2. After 6.5 h, a plateau is apparent, indicating that all residual cargo that was not released in bulk initially may have been completely expelled at this point. The difference between this, and PEG–FITC–TAT, which showed a plateau in release, can be attributed to the relative sizes of each cargo, wherein the larger PEG–FITC–LZ releases more slowly.
The Korsmeyer–Peppas model73 for drug release was fitted to the release data for comparative purposes. The Korsmeyer–Peppas model was introduced to pharmaceutical literature in 1983 and is a simple, commonly utilised power-law model that describes drug release from a polymeric system:
| Exponent, n, with release from thin film | Drug release mechanism |
|---|---|
| 0.5 | Fickian diffusion |
| 0.5 <n> 1.0 | Anomalous transport |
| 1.0 | Polymer swelling |
k and n values for data presented in Fig. 5–7 are presented in Table S2. Due to the governing equation being a power law, k is simply a scaling factor corresponding to the total magnitude of release from these films. Considering the variability in total release between batches of samples prepared at different times, inferences from k values are difficult to justify. However, the n value is the exponent that corresponds to the rate of release, with more rapid release generally resulting in a smaller n value and vice versa. While the short release profiles did not show significant differences in the n value, differences emerged from the 8 hours release data. Here, the PEG–FITC–LZ profile exhibited a significantly larger n value (n = 0.083 ± 0.014), compared to the PEG–FITC–TAT (n = 0.040 ± 0.002), corresponding to a slower release over a longer time. It should be noted that all n values measured are significantly lower than the value of 0.5 shown in Table 1, denoting Fickian diffusion. This is likely due to added driving forces, particularly the forced convection introduced through aspiration and the solubility and affinity of the cargo to water.
 | ||
| Fig. 7 Release of PEG–FITC–LZ from films of different thicknesses with time, produced using spectrofluorometry. Each film thickness represents the mean of 4 samples. Error bars represent standard deviation. | ||
Impact of film thickness on cargo release
The thickness of PS-b-PEO thin films can be easily tuned by simply altering the spin speed during the spin coating step, wherein faster spin speeds produce thinner films. By altering the thickness of the thin films, we hypothesised that the amount of cargo within these films, and possibly also the profile at which this cargo is released, could be tuned. Films 58.9 ± 6.9 (2000 rpm), 49 ± 2.7 (2750 rpm), and 44.6 ± 5.2 nm (3500 rpm) thick were produced using 4 wt% loading of PEG–FITC–LZ. For reference, samples in prior sections were spin coated at 3000 rpm with 4 wt% loading. The thicknesses of the thin films along with their corresponding release of PEG–LZ, are presented in Fig. 7.A clear trend can be observed in Fig. 7, relating the thickness of the PS-b-PEO films and the amount of PEG–LZ released. The thinnest films yielded the least cargo release, with a maximum release of 41.4 ± 2.6 ng cm−2, while the films of moderate thickness released 53 ± 7 ng cm−2 of cargo. The thickest films released a maximum cargo of 58.5 ± 10.5 ng cm−2. This confirmed our hypothesis and demonstrated how the amount of cargo released could be easily tuned. Interestingly, the instantaneous release (t = 0 min) for all films was roughly the same. This could be explained by the instantaneous release of cargo acting predominantly on cargo molecules closer to the PS-b-PEO – buffer interface, in which case the thickness, and hence the quantity of cargo residing deeper within the films, would not yet impact release. Quickly after this initial measurement, the thicker films tend to exceed the release of thinner films. Aside from the release from thicker films increasing with a steeper gradient than that of thinner films within the initial minutes, the release profile is very similar between films of varied thicknesses.
Comparative discussion with literature
There has been growing interest in literature in using PS-b-PEO thin films as cell culture substrates due to, for instance, the ability to present cell adhesion ligands with precise spacing.74 There remains an open opportunity to add the release of bioactive molecules, such as growth factors, to such systems. To this end, it is paramount to reach a comprehensive understanding of the ways in which biomolecular cargo assembles within PS-b-PEO thin films and how it is released. The present work demonstrates the loading limits of cargo within these films and cargo release using PiFM. Furthermore, for the first time, we quantify the cargo released from these films and the kinetics in which this occurs.Some of the most common scaffolds utilized within the literature to achieve growth factor release synergistically with the control of cell adhesion include LbL films75–78 and hydrogels.79–81 The use of LZ as a model protein has also been established for these biomimetic scaffolds. For instance, LZ has been incorporated in and released from LbL systems as a model protein for growth factors.82,83 While LZ was seen to show a more gradual release from LbL films, the total release of LZ was in the range of hundreds to thousands of μg mL−1. This is far in excess of both our system and the amount required to elicit a biological response using LbL assemblies when LZ is replaced with growth factors (tens to hundreds of ng mL−1).19,33,84 LZ incorporation and release can also be found in literature using another common biomimetic scaffold – hydrogels.85–87 Similarly, LZ release was orders of magnitude higher than what has been found to elicit cell responses with GF incorporated hydrogels, again being in the range of tens to low hundreds of ng mL−1.79,88
To put the presented system into context with these well-established ones, our system showed a burst release over approximately 20 minutes of ∼60–70 ng mL−1 PEG–LZ and ∼20 ng mL−1 PEG–FITC–TAT. The total release was demonstrated to be tuneable through loading and thickness alterations of the films. This was followed by a slower release over the next several hours for PEG–LZ, wherein the final amount released increased by approximately 25% from the initial burst. This is significantly more rapid than established systems, and a means to cap the polymer layer to control or slow the release is needed. This layer could be, for instance, an enzymatically degradable layer atop the PS-b-PEO surface. Despite the absence of this within the presented work rendering the comparison of release rates difficult, one can still compare the total expected release from this system to the well-established ones mentioned prior. Considering the presented co-assembly concentrations that still maintain structural integrity of the films, the total release of cargo is approximately 20–80 ng cm−2; depending on the mass of the cargo, the amount of cargo released is within the range of the previously referenced hydrogel and LBL systems that have successfully elicited cell responses.
Conclusions
The presented work has harnessed the natural propensity of a PS-b-PEO block copolymer to self-assemble to incorporate biomolecules within the hexagonally packed PEO domains. These ordered thin films were imaged with AFM and PiFM to demonstrate cargo leaching out of the PEO domains under aqueous conditions. CD spectroscopy and an LZ activity assay were utilised to confirm that the solvent mixture did not significantly affect LZ activity and structure. Quantitative release of cargo from these films was demonstrated for the first time using fluorometric spectroscopy, wherein release was confirmed as an initial burst release, followed by a gradual release over several hours for LZ, or a plateau for PEG–FITC–TAT. We demonstrated the ability to tune the quantity of cargo released by altering the thickness of the PS-b-PEO thin films. Future sequestering on release in a controlled, cell-mediated manner, for instance through an enzymatically degradable layer, offers exciting prospects for this system's application in cell culture and mechanotransduction research.Conflicts of interest
There are no conflicts to declare.Acknowledgements
The authors gratefully acknowledge the financial support by the Marsden Fund Council and the Rutherford Discovery Fellowship, from Government funding, managed by Royal Society Te Apārangi. The University of Auckland is acknowledged for providing a doctoral scholarship for TK. Associate Professor Darren Svirskis is acknowledged for help with drug release models, and Paavan Kumar is acknowledged for training and access to the fluorospectrophotometer.References
- K. Haase, Z. Al-Rekabi and A. E. Pelling, Mechanical cues direct focal adhesion dynamics, Elsevier Inc., 1st edn, 2014, vol. 126 Search PubMed.
- A. J. Engler, S. Sen, H. L. Sweeney and D. E. Discher, Matrix Elasticity Directs Stem Cell Lineage Specification, Cell, 2006, 126(4), 677–689, DOI:10.1016/j.cell.2006.06.044.
- H. Lv, et al., Biomaterial stiffness determines stem cell fate, Life Sci., 2017, 178, 42–48, DOI:10.1016/j.lfs.2017.04.014.
- K. Metavarayuth, P. Sitasuwan, X. Zhao, Y. Lin and Q. Wang, Influence of Surface Topographical Cues on the Differentiation of Mesenchymal Stem Cells in Vitro, ACS Biomater. Sci. Eng., 2016, 2(2), 142–151, DOI:10.1021/acsbiomaterials.5b00377.
- R. G. Harrison, On the stereotropism of embryonic cells, Science, 1911, 34(870), 279–281, DOI:10.1126/science.34.870.279.
- P. Weiss, Experiments on cell and axon orientation in vitro, J. Exp. Zool., 1945, 1(1), 353–386 CrossRef PubMed.
- P. Newman, et al., Relationship between nanotopographical alignment and stem cell fate with live imaging and shape analysis, Sci. Rep., 2016, 6(1), 1–11, DOI:10.1038/srep37909.
- L. Song, K. Wang, Y. Li and Y. Yang, Nanotopography promoted neuronal differentiation of human induced pluripotent stem cells, Colloids Surf., B, 2016, 148, 49–58, DOI:10.1016/j.colsurfb.2016.08.041.
- X. Zhang, et al., Piezoelectric Nanotopography Induced Neuron-Like Differentiation of Stem Cells, Adv. Funct. Mater., 2019, 29(22), 1–10, DOI:10.1002/adfm.201900372.
- J. D. Humphries, A. Byron and M. J. Humphries, Integrin ligands at a glance, J. Cell Sci., 2006, 119(19), 3901–3903, DOI:10.1242/jcs.03098.
- K. S. Masters, Covalent Growth Factor Immobilization Strategies for Tissue Repair and Regeneration, Macromol. Biosci., 2011, 11(9), 1149–1163, DOI:10.1002/mabi.201000505.
- A. E. Rodda, L. Meagher, D. R. Nisbet and J. S. Forsythe, Specific control of cell-material interactions: Targeting cell receptors using ligand-functionalized polymer substrates, Prog. Polym. Sci., 2014, 39(7), 1312–1347, DOI:10.1016/j.progpolymsci.2013.11.006.
- M. Théry, Micropatterning as a tool to decipher cell morphogenesis and functions, J. Cell Sci., 2010, 123(24), 4201–4213, DOI:10.1242/jcs.075150.
- X. Wang, T. Nakamoto, I. Dulińska-Molak, N. Kawazoe and G. Chen, Regulating the stemness of mesenchymal stem cells by tuning micropattern features, J. Mater. Chem. B, 2016, 4(1), 37–45, 10.1039/c5tb02215k.
- H. Li, J. Frith and J. J. Cooper-White, Modulation of stem cell adhesion and morphology via facile control over surface presentation of cell adhesion molecules, Biomacromolecules, 2014, 15(1), 43–52, DOI:10.1021/bm4012562.
- A. F. Naves, et al., Layer-by-Layer assembled growth factor reservoirs for steering the response of 3T3-cells, Colloids Surf., B, 2016, 139, 79–86, DOI:10.1016/j.colsurfb.2015.11.019.
- F. F. R. Damanik, et al., Sustained delivery of growth factors with high loading efficiency in a layer by layer assembly, Biomater. Sci., 2020, 8(1), 174–188, 10.1039/c9bm00979e.
- B. K. Kuila, P. Formanek and M. Stamm, Multilayer polymer thin films for fabrication of ordered multifunctional polymer nanocomposites, Nanoscale, 2013, 5(22), 10849–10852, 10.1039/c3nr03607c.
- I. Ding, D. M. Shendi, M. W. Rolle and A. M. Peterson, Growth-Factor-Releasing Polyelectrolyte Multilayer Films to Control the Cell Culture Environment, Langmuir, 2018, 34(3), 1178–1189, DOI:10.1021/acs.langmuir.7b02846.
- J. H. Slater and W. Frey, Nanopatterning of fibronectin and the influence of integrin clustering on endothelial cell spreading and proliferation, J. Biomed. Mater. Res., Part A, 2008, 87(1), 176–195, DOI:10.1002/jbm.a.31725.
- B. Trappmann, et al., Extracellular-matrix tethering regulates stem-cell fate, Nat. Mater., 2012, 11(7), 642–649, DOI:10.1038/nmat3339.
- P. M. Comoglio, C. Boccaccio and L. Trusolino, Interactions between growth factor receptors and adhesion molecules: Breaking the rules, Curr. Opin. Cell Biol., 2003, 15(5), 565–571, DOI:10.1016/S0955-0674(03)00096-6.
- C. J. Huang, P. Y. Tseng and Y. C. Chang, Effects of extracellular matrix protein functionalized fluid membrane on cell adhesion and matrix remodeling, Biomaterials, 2010, 31(27), 7183–7195, DOI:10.1016/j.biomaterials.2010.05.076.
- J. Malmström, et al., Large area protein patterning reveals nanoscale control of focal adhesion development, Nano Lett., 2010, 10(2), 686–694, DOI:10.1021/nl903875r.
- M. Rajam, S. Pulavendran, C. Rose and A. B. Mandal, Chitosan nanoparticles as a dual growth factor delivery system for tissue engineering applications, Int. J. Pharm., 2011, 410(1–2), 145–152, DOI:10.1016/j.ijpharm.2011.02.065.
- Z. Wang, et al., Nanostructured architectures by assembling polysaccharide-coated BSA nanoparticles for biomedical application, Adv. Healthcare Mater., 2015, 4(6), 927–937, DOI:10.1002/adhm.201400684.
- F. Danhier, E. Ansorena, J. M. Silva, R. Coco, A. Le Breton and V. Préat, PLGA-based nanoparticles: An overview of biomedical applications, J. Controlled Release, 2012, 161(2), 505–522, DOI:10.1016/j.jconrel.2012.01.043.
- Y. Wang, A. S. Angelatos and F. Caruso, Template synthesis of nanostructured materials via layer-by-layer assembly, Chem. Mater., 2008, 20(3), 848–858, DOI:10.1021/cm7024813.
- J. J. Richardson, M. Björnmalm and F. Caruso, Technology-driven layer-by-layer assembly of nanofilms, Science, 2015, 348(6233) DOI:10.1126/science.aaa2491.
- P. K. Mandapalli, et al., Layer-by-Layer Thin Films for Co-Delivery of TGF-β siRNA and Epidermal Growth Factor to Improve Excisional Wound Healing, AAPS PharmSciTech, 2017, 18(3), 809–820, DOI:10.1208/s12249-016-0571-6.
- Z. Zhang, Q. Li, L. Han and Y. Zhong, Layer-by-layer films assembled from natural polymers for sustained release of neurotrophin, Biomed. Mater., 2015, 10(5) DOI:10.1088/1748-6041/10/5/055006.
- M. L. Macdonald, R. E. Samuel, N. J. Shah, R. F. Padera, Y. M. Beben and P. T. Hammond, Tissue integration of growth factor-eluting layer-by-layer polyelectrolyte multilayer coated implants, Biomaterials, 2011, 32(5), 1446–1453, DOI:10.1016/j.biomaterials.2010.10.052.
- N. J. Shah, M. L. Macdonald, Y. M. Beben, R. F. Padera, R. E. Samuel and P. T. Hammond, Tunable dual growth factor delivery from polyelectrolyte multilayer films, Biomaterials, 2011, 32(26), 6183–6193, DOI:10.1016/j.biomaterials.2011.04.036.
- M. M. Martino, P. S. Briquez, K. Maruyama and J. A. Hubbell, Extracellular matrix-inspired growth factor delivery systems for bone regeneration, Adv. Drug Delivery Rev., 2015, 94, 41–52, DOI:10.1016/j.addr.2015.04.007.
- I. Capila and R. J. Linhardt, Heparin - Protein interactions, Angew. Chem., Int. Ed., 2002 DOI:10.1002/1521-3773(20020201)41:3<390::AID-ANIE390>3.0.CO;2-B.
- E. H. Schwab, et al., Nanoscale control of surface immobilized BMP-2: Toward a quantitative assessment of BMP-mediated signaling events, Nano Lett., 2015, 15(3), 1526–1534, DOI:10.1021/acs.nanolett.5b00315.
- C. H. Heldin, K. Miyazono and P. Ten Dijke, TGF-β signalling from cell membrane to nucleus through SMAD proteins, Nature, 1997, 360(6659), 465–471, DOI:10.1038/37284.
- K. Kataoka, A. Harada and Y. Nagasaki, Block copolymer micelles for drug delivery: Design, characterization and biological significance, Adv. Drug Delivery Rev., 2012, 64(SUPPL.), 37–48, DOI:10.1016/j.addr.2012.09.013.
- C. M. Bates, M. J. Maher, D. W. Janes, C. J. Ellison and C. G. Willson, Block copolymer lithography, Macromolecules, 2014, 47(1), 2–12, DOI:10.1021/ma401762n.
- Y. Mai and A. Eisenberg, Self-assembly of block copolymers, Chem. Soc. Rev., 2012, 41(18), 5969–5985, 10.1039/c2cs35115c.
- F. S. Bates and G. H. Fredrickson, Block copolymer thermodynamics: Theory and experiment, Annu. Rev. Phys. Chem., 1990, 41(1), 525–557, DOI:10.1146/annurev.pc.41.100190.002521.
- I. W. Hamley, Ordering in thin films of block copolymers: Fundamentals to potential applications, Prog. Polym. Sci., 2009, 34(11), 1161–1210, DOI:10.1016/j.progpolymsci.2009.06.003.
- M. Li and C. K. Ober, Block copolymer patterns and templates, Mater. Today, 2006, 9(9), 30–39, DOI:10.1016/S1369-7021(06)71620-0.
- H.-C. Kim and W. D. Hinsberg, Surface patterns from block copolymer self-assembly, J. Vac. Sci. Technol., A, 2008, 26(6), 1369–1382, DOI:10.1116/1.3000056.
- Y. Lin, et al., Self-directed self-assembly of nanoparticle/copolymer mixtures, Nature, 2005, 434(7029), 55–59, DOI:10.1038/nature03310.
- A. D. Presley, J. J. Chang and T. Xu, Directed co-assembly of heme proteins with amphiphilic block copolymers toward functional biomolecular materials, Soft Matter, 2011, 7(1), 172–179, 10.1039/c0sm00817f.
- J. Malmström, et al., Protein nanorings organized by poly(styrene-block-ethylene oxide) self-assembled thin films, Nanoscale, 2015, 7(47), 19940–19948, 10.1039/c5nr05476a.
- T. Kollmetz, I. Monteiro A, J. A. Gerrard and J. Malmström, Polystyrene- block-poly(ethylene oxide) Thin Films Fabricated from a Solvent Mixture for the Co-Assembly of Polymers and Proteins, ACS Omega, 2020, 5(41), 26365–26373, DOI:10.1021/acsomega.0c02392.
- I. Monteiro A, T. Kollmetz, D. S. Musson, S. R. McGlashan and J. Malmström, Polystyrene- block -polyethylene oxide thin films: In vitro cytocompatibility and protein adsorption testing, Biointerphases, 2020, 15(1), 011003, DOI:10.1116/1.5135062.
- E. K. F. Yim, E. M. Darling, K. Kulangara, F. Guilak and K. W. Leong, Nanotopography-induced changes in focal adhesions, cytoskeletal organization, and mechanical properties of human mesenchymal stem cells, Biomaterials, 2010, 31(6), 1299–1306, DOI:10.1016/j.biomaterials.2009.10.037.
- D. Nowak, et al., Nanoscale chemical imaging by photoinduced force microscopy, Sci. Adv., 2016, 2(3) DOI:10.1126/sciadv.1501571.
- W. Morrison, J. Tao, K. Park, D. Nowak, S. Park and J. De Yoreo, Nanoscale Chemical and Topology Imaging of Collagen with Photo-Induced Force Microscopy, Biophys. J., 2016, 110(3) DOI:10.1016/j.bpj.2015.11.2627.
- I. Rajapaksa, K. Uenal and H. K. Wickramasinghe, Image force microscopy of molecular resonance: A microscope principle, Appl. Phys. Lett., 2010, 97(7) DOI:10.1063/1.3480608.
- J. M. Taylor, S. Cohen and W. M. Mitchell, Epidermal growth factor: high and low molecular weight forms, Proc. Natl. Acad. Sci. U. S. A., 1970, 67(1), 164–171, DOI:10.1073/pnas.67.1.164.
- K. Chlebova, V. Bryja, P. Dvorak, A. Kozubik, W. R. Wilcox and P. Krejci, High molecular weight FGF2: The biology of a nuclear growth factor, Cell. Mol. Life Sci., 2009, 66(2), 225–235, DOI:10.1007/s00018-008-8440-4.
- E. Vivès, P. Brodin and B. Lebleu, A truncated HIV-1 Tat protein basic domain rapidly translocates through the plasma membrane and accumulates in the cell nucleus, J. Biol. Chem., 1997, 272(25), 16010–16017, DOI:10.1074/jbc.272.25.16010.
- I. M. Kaplan, J. S. Wadia and S. F. Dowdy, Cationic TAT peptide transduction domain enters cells by macropinocytosis, J. Controlled Release, 2005, 102(1), 247–253, DOI:10.1016/j.jconrel.2004.10.018.
- A. D. Presley, J. J. Chang and T. Xu, Directed co-assembly of heme proteins with amphiphilic block copolymers toward functional biomolecular materials, in, Soft Matter, 2011, 7(1), 172–179, 10.1039/c0sm00817f.
- R. A. Murdick, W. Morrison, D. Nowak, T. R. Albrecht, J. Jahng and S. Park, Photoinduced force microscopy: A technique for hyperspectral nanochemical mapping, Jpn. J. Appl. Phys., 2017, 56, 08LA04, DOI:10.7567/JJAP.56.08LA04.
- G. Chen, S. Liu, S. Chen and Z. Qi, FTIR spectra, thermal properties, and dispersibility of a polysterene/montmorillonite nanocomposite, Macromol. Chem. Phys., 2001 DOI:10.1002/1521-3935(20010401)202:7<1189::AID-MACP1189>3.0.CO;2-M.
- Y. L. Su, J. Wang and H. Z. Liu, FTIR spectroscopic study on effects of temperature and polymer composition on the structural properties of PEO-PPO-PEO block copolymer micelles, Langmuir, 2002, 18(14), 5370–5374, DOI:10.1021/la020007p.
- A. Barth, Infrared spectroscopy of proteins, Biochim. Biophys. Acta, Bioenerg., 2007, 1767(9), 1073–1101, DOI:10.1016/j.bbabio.2007.06.004.
- R. Arunkumar, C. J. Drummond and T. L. Greaves, FTIR spectroscopic study of the secondary structure of globular proteins in aqueous protic ionic liquids, Front. Chem., 2019, 7, 74, DOI:10.3389/fchem.2019.00074.
- C. Rosu, et al., Polypeptide composite particle-assisted organization of π-conjugated polymers into highly crystalline ‘coffee stains’, ACS Appl. Mater. Interfaces, 2017, 9(39), 34337–34348, DOI:10.1021/acsami.7b10223.
- J. Jahng, et al., Gradient and scattering forces in photoinduced force microscopy, Phys. Rev. B: Condens. Matter Mater. Phys., 2014, 90(15) DOI:10.1103/PhysRevB.90.155417.
- L. Dai and A. M. Klibanov, Striking activation of oxidative enzymes suspended in nonaqueous media, Proc. Natl. Acad. Sci. U. S. A., 1999, 96(17), 9475–9478, DOI:10.1073/pnas.96.17.9475.
- S. Venkataramani, J. Truntzer and D. R. Coleman, Thermal stability of high concentration lysozyme across varying pH: A Fourier Transform Infrared study, J. Pharm. BioAllied Sci., 2013, 5(2), 148–153, DOI:10.4103/0975-7406.111821.
- B. Zagrovic, G. Jayachandran, I. S. Millett, S. Doniach and V. S. Pande, How large is an α-helix? Studies of the radii of gyration of helical peptides by small-angle X-ray scattering and molecular dynamics, J. Mol. Biol., 2005, 353(2), 232–241, DOI:10.1016/j.jmb.2005.08.053.
- M. Lundqvist, J. Stigler, G. Elia, I. Lynch, T. Cedervall and K. A. Dawson, Nanoparticle size and surface properties determine the protein corona with possible implications for biological impacts, Proc. Natl. Acad. Sci. U. S. A., 2008, 105(38), 14265–14270, DOI:10.1073/pnas.0805135105.
- H. Derakhshankhah and S. Jafari, Cell penetrating peptides: A concise review with emphasis on biomedical applications, Biomed. Pharmacother., 2018, 108, 1090–1096, DOI:10.1016/j.biopha.2018.09.097.
- A. Jada, R. Ait Akbour and J. Douch, Surface charge and adsorption from water onto quartz sand of humic acid, Chemosphere, 2006, 64(8), 1287–1295, DOI:10.1016/j.chemosphere.2005.12.063.
- D. E. Kuehner, J. Engmann, F. Fergg, M. Wernick, H. W. Blanch and J. M. Prausnitz, Lysozyme net charge and ion binding in concentrated aqueous electrolyte solutions, J. Phys. Chem. B, 1999, 103(8), 1368–1374, DOI:10.1021/jp983852i.
- R. W. Korsmeyer, R. Gurny, E. Doelker, P. Buri and N. A. Peppas, Mechanisms of solute release from porous hydrophilic polymers, Int. J. Pharm., 1983, 15(1), 25–35, DOI:10.1016/0378-5173(83)90064-9.
- Y. Zhang, P. J. Sun and Z. H. Gan, Biodegradable amphiphilic block copolymers containing functionalized PEO blocks: Controlled synthesis and biomedical potentials, Sci. China: Chem., 2010, 53(3), 519–527, DOI:10.1007/s11426-010-0095-y.
- Y. Hu, et al., TiO 2 nanotubes as drug nanoreservoirs for the regulation of mobility and differentiation of mesenchymal stem cells, Acta Biomater., 2012, 8(1), 439–448, DOI:10.1016/j.actbio.2011.10.021.
- P. Cai, Z. Xue, W. Qi and H. Wang, Adsorbed BMP-2 in polyelectrolyte multilayer films for enhanced early osteogenic differentiation of mesenchymal stem cells, Colloids Surf., A, 2013, 434, 110–117, DOI:10.1016/j.colsurfa.2013.05.041.
- Z. Wang, et al., Self-assembled Biodegradable Nanoparticles and Polysaccharides as Biomimetic ECM Nanostructures for the Synergistic effect of RGD and BMP-2 on Bone Formation, Sci. Rep., 2016, 6(1), 1–12, DOI:10.1038/srep25090.
- H. Chang, et al., Improved Endothelial Function of Endothelial Cell Monolayer on the Soft Polyelectrolyte Multilayer Film with Matrix-Bound Vascular Endothelial Growth Factor, ACS Appl. Mater. Interfaces, 2016, 8(23), 14357–14366, DOI:10.1021/acsami.6b01870.
- S. Metzger, et al., Cell-Mediated Proteolytic Release of Growth Factors from Poly(Ethylene Glycol) Matrices, Macromol. Biosci., 2016, 16(11), 1703–1713, DOI:10.1002/mabi.201600223.
- C. Guo, et al., Bio-orthogonal conjugation and enzymatically triggered release of proteins within multi-layered hydrogels, Acta Biomater., 2017, 56, 80–90, DOI:10.1016/j.actbio.2017.04.002.
- A. H. Zisch and M. Ehrbar, Cell-demanded release of growth factors, Elsevier Ltd., 2011, vol. 4 Search PubMed.
- D. Lynam, et al., Augmenting protein release from layer-by-layer functionalized agarose hydrogels, Carbohydr. Polym., 2014, 103, 377–384, DOI:10.1016/j.carbpol.2013.12.069.
- B. B. Hsu, et al., Multilayer films assembled from naturally-derived materials for controlled protein release, Biomacromolecules, 2014, 15(6), 2049–2057, DOI:10.1021/bm5001839.
- M. L. MacDonald, N. M. Rodriguez, N. J. Shah and P. T. Hammond, Characterization of tunable FGF-2 releasing polyelectrolyte multilayers, Biomacromolecules, 2010, 11(8), 2053–2059, DOI:10.1021/bm100413w.
- K. Nakamae, et al., Lysozyme loading and release from hydrogels carrying pendant phosphate groups, J. Biomater. Sci., Polym. Ed., 1997, 9(1), 43–53, DOI:10.1163/156856297X00254.
- C. Hiemstra, Z. Zhong, M. J. van Steenbergen, W. E. Hennink and J. Feijen, Release of model proteins and basic fibroblast growth factor from in situ forming degradable dextran hydrogels, J. Controlled Release, 2007, 122(1), 71–78, DOI:10.1016/j.jconrel.2007.06.011.
- T. Wu, et al., Formation of hydrogels based on chitosan/alginate for the delivery of lysozyme and their antibacterial activity, Food Chem., 2018, 240, 361–369, DOI:10.1016/j.foodchem.2017.07.052.
- N. D. Leipzig, C. Xu, T. Zahir and M. S. Shoichet, Functional immobilization of interferon-gamma induces neuronal differentiation of neural stem cells, J. Biomed. Mater. Res., Part A, 2010, 93(2), 625–633, DOI:10.1002/jbm.a.32573.
Footnotes |
| † Electronic supplementary information (ESI) available. See DOI: https://doi.org/10.1039/d2sm00383j |
| ‡ These authors contributed equally to the work. |
| This journal is © The Royal Society of Chemistry 2022 |