
 Open Access Article
 This Open Access Article is licensed under a
 Creative Commons Attribution 3.0 Unported Licence
Spontaneously rotating clusters of active droplets†
Babak Vajdi
Hokmabad
 ab,
Akinori
Nishide
ac,
Prashanth
Ramesh
ad,
Carsten
Krüger
a and
Corinna C.
Maass
*abd
ab,
Akinori
Nishide
ac,
Prashanth
Ramesh
ad,
Carsten
Krüger
a and
Corinna C.
Maass
*abd
aMax Planck Institute for Dynamics and Self-Organization, Am Faßberg 17, 37077 Göttingen, Germany. E-mail: c.c.maass@utwente.nl
bInstitute for the Dynamics of Complex Systems, Georg August Universität, Göttingen, Germany
cCenter for Exploratory Research, R&D group, Hitachi Ltd., Higashi-Koigakubo 1-280, Kokubunji-shi, Tokyo 185-8601, Japan
dPhysics of Fluids Group, Max Planck Center for Complex Fluid Dynamics, MESA+ Institute and J. M. Burgers Center for Fluid Dynamics, University of Twente, PO Box 217, 7500AE Enschede, The Netherlands
First published on 17th March 2022
Abstract
We report on the emergence of spontaneously rotating clusters in active emulsions. Ensembles of self-propelling droplets sediment and then self-organise into planar, hexagonally ordered clusters which hover over the container bottom while spinning around the plane normal. This effect exists for symmetric and asymmetric arrangements of isotropic droplets and is therefore not caused by torques due to geometric asymmetries. We found, however, that individual droplets exhibit a helical swimming mode in a small window of intermediate activity in a force-free bulk medium. We show that by forming an ordered cluster, the droplets cooperatively suppress their chaotic dynamics and turn the transient instability into a steady rotational state. We analyse the collective rotational dynamics as a function of droplet activity and cluster size and further propose that the stable collective rotation in the cluster is caused by a cooperative coupling between the rotational modes of individual droplets in the cluster.
1 Introduction
Collective active matter systems comprise individual agents that constantly consume energy and generate mechanical force. These autonomous agents collectively form new functional materials through complex hierarchical self-organisation; a dynamic self-assembly that gives rise to new emergent properties and functionalities.1,2Suspensions of colloidal particles are promising platforms to study the principles of self-assembly and to use the obtained insights to design and engineer smart materials. They exhibit a variety of collective behaviours when they are driven out of equilibrium. Whether driven externally1,3,4 or internally,5–7 the initially disordered suspensions can spontaneously form flocks and vortices8–10 or self-assemble into ordered crystal-like structures in the vicinity of a solid boundary. Another widely studied mechanism is motility-induced phase separation (MIPS), where the particle velocity depends on the local concentration of its counterparts.5,11,12 Usually, MIPS studies do not include hydrodynamic interactions. On the other hand, recent research has investigated collective behaviour in active matter driven mainly by hydrodynamic interactions.13–16 Squirmers confined to a lower boundary by gravity have shown a rich phase behaviour in numerical studies.17 Experimentally, flow-induced self-assembly into ordered two-dimensional crystals near a boundary has been reported in suspensions of Thiovulum majus bacteria,18 in suspensions of starfish Patiria miniata embryos,19 or in spermatozoa forming hexagonal vortex arrays.20 Flow-induced phase separation has also been observed in suspensions of artificial active particles such as bottom-heavy Janus colloids,5,21,22 and active droplets.6,23 For example, Singh and Adhikari16 showed that active hydrodynamic torques tend to destabilise the order inside 2D dynamic crystals. However, order can be restored via built-in asymmetries such as bottom-heaviness5 or chirality.18
The self-propelling ability of particles with built-in asymmetries is easy to intuit – imagine a Janus colloid converting fuel only on one side, leading to a propulsive chemophoretic front-to-back flow. Furthermore, asymmetric clusters of chemophoretic particles have been proposed to self-propel even if the individual particles feature only diffusive chemokinetics.24
Noticeably, it has been shown for swimmers with intrinsic chirality that contributions from individual swimmers can synchronise into global rotation states, both for biological systems and the respective theory models.25–28 Rotating clusters with torques resulting from off-centre propulsion can also be engineered using binary mixtures or Janus swimmers.29–31
However, as we demonstrate in this study, similar individual and collective dynamics may also emerge from systems without any pre-engineered symmetries.
Autophoretic motion has been shown to evolve even from initially isotropic geometries via dynamic instabilities. Here, for a self-propelling sphere, the usual pathway towards motion is by the excitation of multipolar modes in the interfacial flow with increasing Péclet number Pe, driven by a nonlinear coupling between chemical and hydrodynamic fields. These modes have been established both in theory32–34 and in experimental realisations like self-propelling microdroplets.35–38
Such dynamic modes on the individual scale can translate to complex cooperative dynamics in active ensembles:23,39 In the present study, we demonstrate how spontaneous rotational instabilities arising on the individual particle level carry through to synchronised cooperative rotation in aggregates. Our model system is an active oil-in-water emulsion: close to a boundary, nematic droplets cooperatively swim upwards to form ordered two-dimensional clusters mediated by hydrodynamic attraction.6 While investigating the assembly dynamics of isotropic droplets, we recently found that these clusters start to rotate spontaneously and persistently while hovering over the container bottom. To understand the mechanism behind the cooperative rotation, we studied the individual swimming behaviour in force-free bulk conditions and discovered a transient helical swimming mode. However, our experiments show that this mode is limited to a very narrow Pe range before the propulsion becomes chaotic, i.e. with a pronounced rotational noise instead of regular oscillations. We hypothesise that forming an ordered cluster stabilises the chaotic dynamics of individual droplets, thereby extending the range of activity wherein rotational states emerge.
The paper is organised as follows: after a short review of our previous study on static non-rotating clusters, we will first discuss the rotational instabilities in individual droplets, then demonstrate how hydrodynamic interactions lead to aggregation and then investigate in detail under which conditions these aggregates stabilise and rotate. We show that the stability and dynamics of the clusters depend on droplet activity and cluster size and propose symmetry arguments to explain the respective rotation dynamics of liquid crystalline ordered and disordered ensembles.
2 Review of the static clustered case
For illustration, we begin with a short review of our previous study6 on large clusters of nematic self-propelling droplets under variation of buoyancy and confinement (Fig. 1). Fig. 2 shows a schematic of a typical experiment on top of an inverted microscope stage. At the bottom of large reservoirs (≈5 mm compared to a droplet radius Rd = 25 μm), collectives of self-propelling droplets tend to aggregate in flat, hexagonal clusters confined by a toroidal convection roll in the ambient fluid. The cluster size and spacing are determined by fitting these rolls next to each other – i.e., a shallow reservoir promotes larger numbers of small rolls and clusters, while a deep one features fewer and bigger structures. The maximum size of a cluster is limited by the radial outflux under the cluster perimeter – in a crowded system, this limit will eventually force the formation of secondary layers and conical structures, competing against the side-by-side attraction seen between individual droplets (see Section 4). The clustering can be fully suppressed by matching the densities of droplets and bulk fluid and even inverted to create floating clusters by overmatching.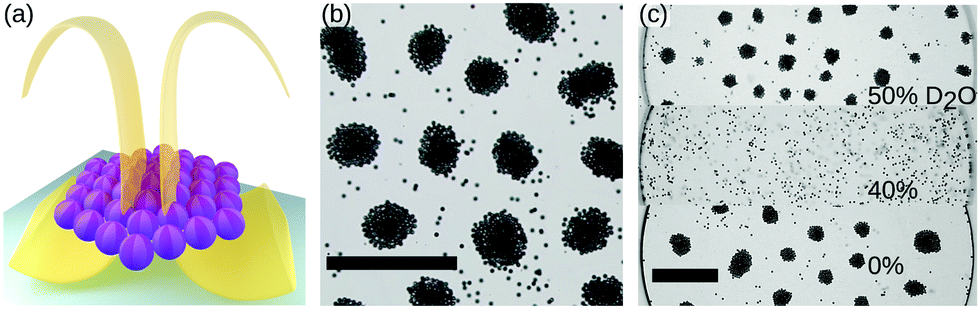 | ||
| Fig. 1 Review of the static clustering case for nematic droplets. (a) Schematic of a flat hexagonal cluster confined by a self-generated convection roll. (b) In overcrowded samples, clusters acquire smaller, secondary layers, here visible through a darker shade in the cluster centre. (c) Clustering requires gravity: clustering at the container bottom for sedimenting, no clustering for density matched, and clustering at the ceiling for floating droplets. The density of the bulk medium is adjusted by D2O admixture. Scale bars 1 mm. Adapted from ref. 6. | ||
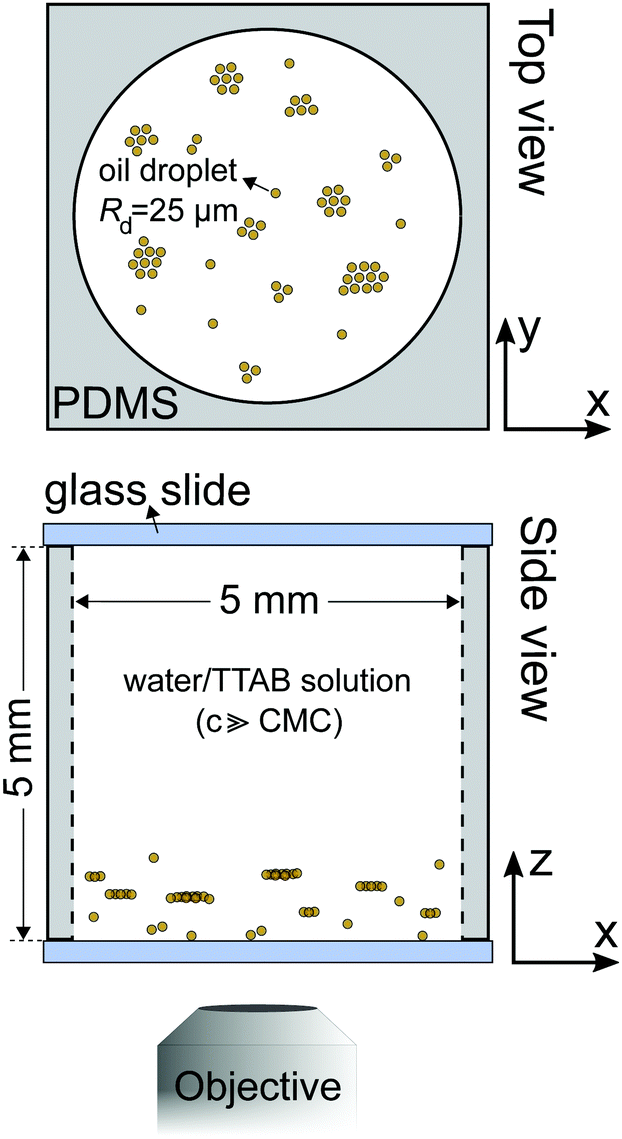 | ||
| Fig. 2 Schematic illustration of the experimental setup for bulk measurements, with an example sketch of a clustered sample. For quasi 2D experiments like PIV flow measurements, we fabricated flat rectangular cells via UV photolithography with a height corresponding to the particle diameter 2Rd. | ||
3 Broken rotational symmetries in individual droplets
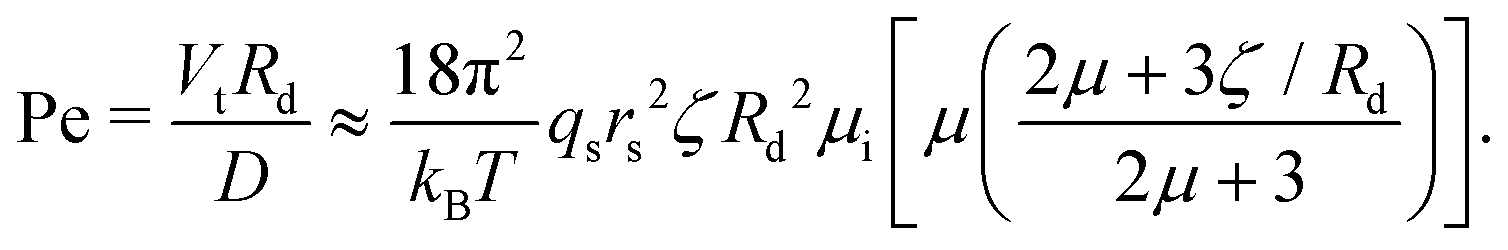
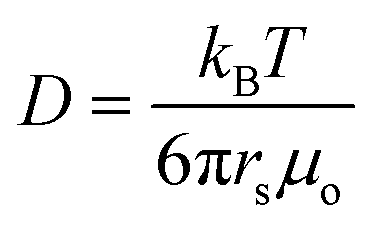
We now continue with a description of rotational instabilities in individual swimmers. The active emulsions we used comprise monodisperse droplets of CB15 oil (radius Rd = 25 μm) in supramicellar aqueous solutions of TTAB surfactant at variable concentration (cTTAB = 6–20 wt%, with the critical micelle concentration at 0.13 wt%). Over a typical time interval of one to several hours, these droplets dissolve slowly by micellar solubilization, which powers the self-propulsion. Thus, we can experiment at steady-state self-propulsion on a time frame of several minutes to approximately half hours, with careful consideration of shrinkage effects. The solubilisation dynamics are characterised by a Péclet number Pe quantifying the relative strength of the advective transport of surfactant molecules to their diffusion.For our specific droplet model, we can estimate Pe via37
 | (1) |
 the diffusion coefficient for the surfactant monomer (length scale rs ∼ 10−10 m), qs the isotropic interfacial surfactant consumption rate per area, ζ ∼ 10 nm the characteristic length scale over which the surfactants interact with the droplet,35,40 and μ = μo/μi, with μo and μi being the viscosities of the outer and inner phases.
Pe increases monotonically with the droplet activity, which here is proportional to qs. We primarily control Pe by varying cTTAB – an increase in cTTAB results in higher qs (cf. Appendix 9).
At supercritical Pe ≳ 4,32 the first, dipolar, mode in the interfacial surfactant coverage arises and leads to spontaneous motion, at typical speeds of V ≈ 25 μm s−1 in quasi-2D confinement.35,36,41
To create force-free bulk conditions for 3D motion, we matched the density of the aqueous TTAB solution with that of the droplets by adding heavy water (D2O). In each experiment, we placed only a small number of droplets in a deep reservoir so that the inter-particle interactions are negligible and focused the microscope on a region well off the container boundaries. In the image series taken at increasing Pe in the top row of Fig. 3 each image shows a multi-frame superposition of individual droplets that visualises their trajectories. At low Pe, the droplets show a persistent and directed motion. At intermediate values (Pe = 6.8 to 8.7), the droplets follow a helical trajectory. Since there is no global chirality, we conclude that the rotational symmetry is spontaneously broken. At Pe ≥ 10.9, the droplets transition to increasingly chaotic swimming.
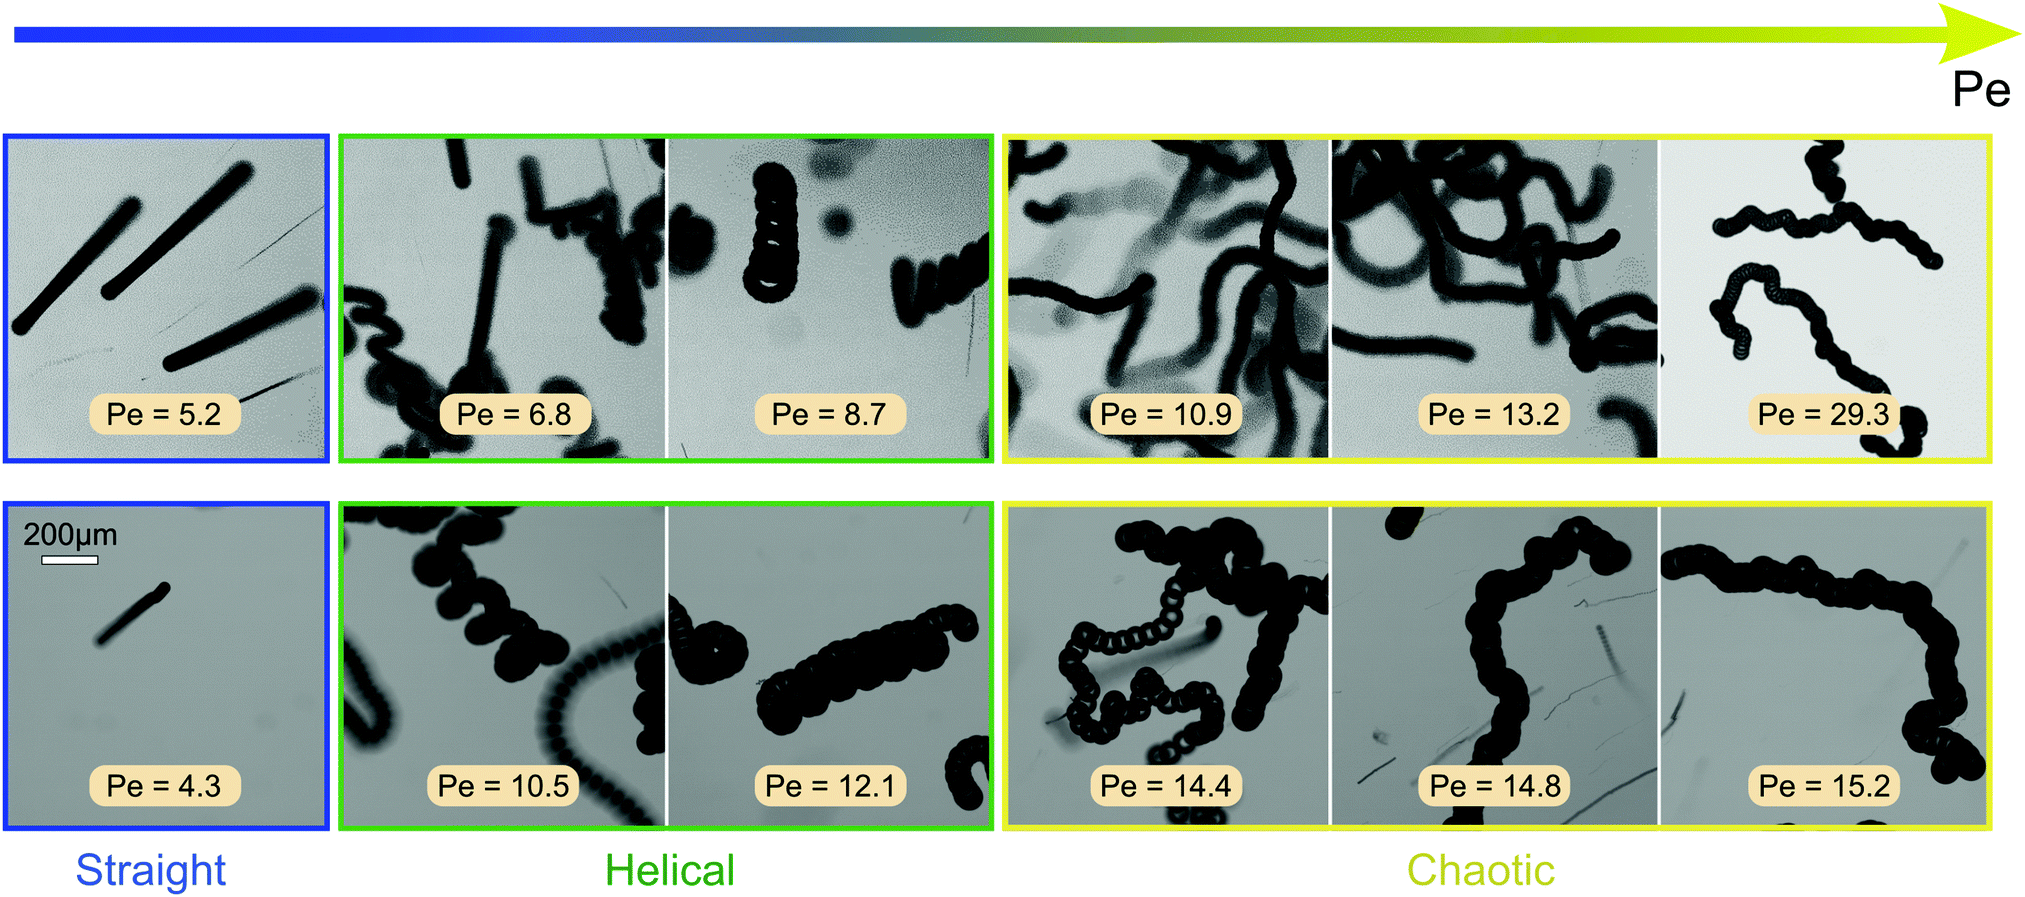 | ||
| Fig. 3 Dynamical behaviour of individual active droplets with varying Pe, transitioning from straight over helical to chaotic swimming. The Pe range for each regime is shown by a different colour. Top row, Pe changed by adjusting cTTAB between 5 and 15 wt% with Rd = 25 μm, bottom row, by varying the droplet size, with Rd between 20 and 50 μm at cTTAB = 5 wt%. Frame superpositions from microvideos of experiments in D2O density matched swimming media. | ||
We were also able to probe these transitions using the droplet size as a parameter to change Pe, while keeping the surfactant concentration constant, as shown in the bottom row of Fig. 3 with the respective Pe estimated from the measured droplet radii Rd using eqn (1) as above. For both variation of size and surfactant concentration, the transition from straight to helical to chaotic swimming occurs in similar Pe ranges.
We note that we have previously found a highly persistent and regular ‘curling’ (in 2D) or helical (in 3D) swimming mode in droplets composed of CB15's nematic isomer 5CB.39,42 Here, the helical instability is due to a nematoelastic torque produced by a self-supporting asymmetric distortion of the director by hydrodynamic interactions. Oscillatory motion can also be generated by shear flow during the interaction of isotropic droplets with no-slip boundaries in Poiseuille flow.43,44
However, none of these mechanisms apply to isotropic droplets in force-free bulk media. While a full understanding of this intermediate helical regime appears unfeasible without extensive numerical modelling, we can speculate about the possible origins based on previous findings for swimming in a quasi-2D environment.33,37,38 For our droplet system, we demonstrated that with increasing Pe the propulsion transitions from steady and persistent to unsteady and chaotic due to non-linear interactions between flow and chemical fields.37
In 2D, for intermediate Pe values, higher hydrodynamic modes are excited momentarily, generating a flow with quadrupolar symmetry. Such flow results in a metastable accumulation of oil-filled micelles (“spent fuel”) at the anterior stagnation point of the droplet. The formation of these accumulates and their advection to the droplet posterior causes quasi-periodic reorientations and a meandering trajectory.
While the dynamics in a Hele-Shaw cell are confined to two dimensions, in a 3D bulk medium the droplet can reorient within the entire angular space, allowing for more complex modes of symmetry breaking which might lead to the more regular helical trajectories shown in Fig. 3.
4 Attractive interaction between droplets
On the way towards cluster assembly, we now proceed to the mutual attraction between two droplets.To experimentally investigate the droplet hydrodynamics, we measured the flow field in the aqueous swimming medium generated by a droplet in a Hele-Shaw cell (height h ≈ 2Rd) by particle image velocimetry (PIV). To model the droplet flow field in confinement, we used an expansion ansatz corresponding to the Brinkman squirmer model45 (see Appendix 9.7 for details). The first two modes of the Brinkman solution were then fitted to the PIV velocity field to determine the coefficients b1 and b2.
Fig. 4(a) shows the flow field generated by the droplet which is in good agreement with the field as calculated using the Brinkman squirmer model (Fig. 4(b)). We extracted the tangential component of the velocity vector uθ at the interface from the theoretical fit (Fig. 4(c)) and observed that uθ does not peak at the equator but closer to the rear stagnation point. Correspondingly, the squirmer parameter b2/b1 = −0.692 is consistent with a weak “pusher” flow in the far-field (see also numerical literature, as in ref. 35 and 32). We can further assume that the Brinkman squirmer in 2D confinement will correspond to a qualitatively similar classical squirmer in 3D.
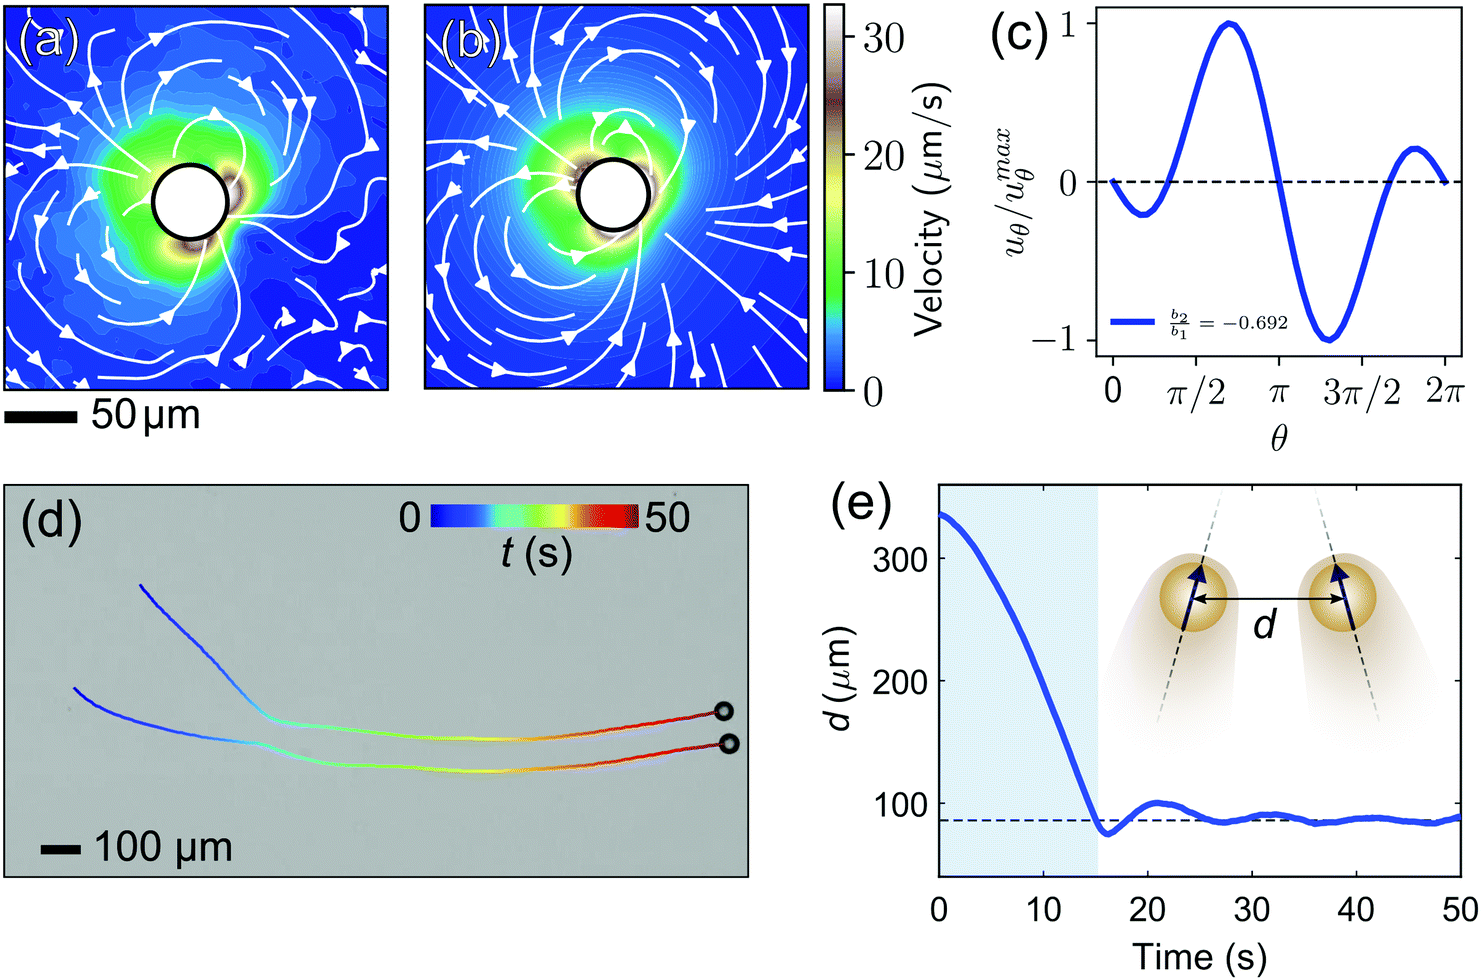 | ||
| Fig. 4 (a) Average flow field generated by a single freely swimming droplet inside a Hele-Shaw cell. The colour map shows the speed. (b) Theoretical flow field obtained from fitting the Brinkman solution to the experimental flow field. (c) Tangential component of the velocity uθ at the vicinity of the interface obtained from the theoretical model. (d) The interaction between two active droplets. We note that the droplets in this data set had shrunk somewhat due to solubilization, to Rd < 25 μm, before we started recording. (e) Variation of the separation distance d between the two droplets in time. The shaded region corresponds to the long-range hydrodynamic interactions leading to the formation of a droplet pair. | ||
Thutupalli et al.23 attributed this pusher-type asymmetry to the balance between viscous and nematic stresses in a liquid crystal droplet. However, since we observe a similar asymmetry in isotropic droplets, nematic anisotropy cannot be the overall determining factor. For isotropic solubilising droplets, it is likely that such asymmetries are mediated by the gradual saturation and slow diffusion of oil-filled micelles, whose distribution will affect the interfacial reactivity and thereby the local Marangoni flows.34,46
To investigate attractive interactions between droplets, we studied two droplets in a Hele-Shaw cell. As shown in Fig. 4(d and e) and Movie S1 (ESI†), the two droplets attracted each other, and continued to swim side-by-side for an extended period. This attraction can be rationalised by the hydrodynamic interaction between two pusher-type squirmers. The flow profile of a single pusher features an influx around the droplet equator.47 Once two droplets swim on a converging course, this influx causes an attractive force,23 such that they reorient each other to swim in parallel.48 In our experiments, it is noteworthy that the droplets never come in contact and the stable parallel swimming happens at a finite interparticle distance larger than 2Rd. This is probably due to the overlap of the two chemorepulsive clouds of oil-filled micelles around the droplets,49 in which case the equilibrium distance would be determined by the interplay of hydrodynamic attraction and phoretic repulsion.
5 Formation of spontaneously rotating and rising clusters
In a 3D system under gravity with higher number densities, the attractive hydrodynamic interactions discussed in the previous section lead to the flow-induced self-assembly of planar hovering clusters.6,23 To study the formation of such clusters, we filled a deep closed reservoir (5 mm in diameter and 5 mm in depth, see Fig. 2) with an active emulsion of monodisperse droplets. Due to their higher mass density, the droplets gradually sedimented to the bottom of the reservoir. There, they started to interact with each other and autonomously assembled into planar clusters (Movie S2). This process takes place in four stages (Fig. 5(a–c)): (i) Sedimentation, due to gravity, (ii) Aggregation, due to the mutual hydrodynamic attractive forces, (iii) Cluster formation, during which the droplets form hexagonally-ordered crystal-like structures and all droplets reorient to swim upwards against gravity, and (iv) Rising and Rotation, where the droplets cooperatively start to hover and rise, while spinning around the cluster axis.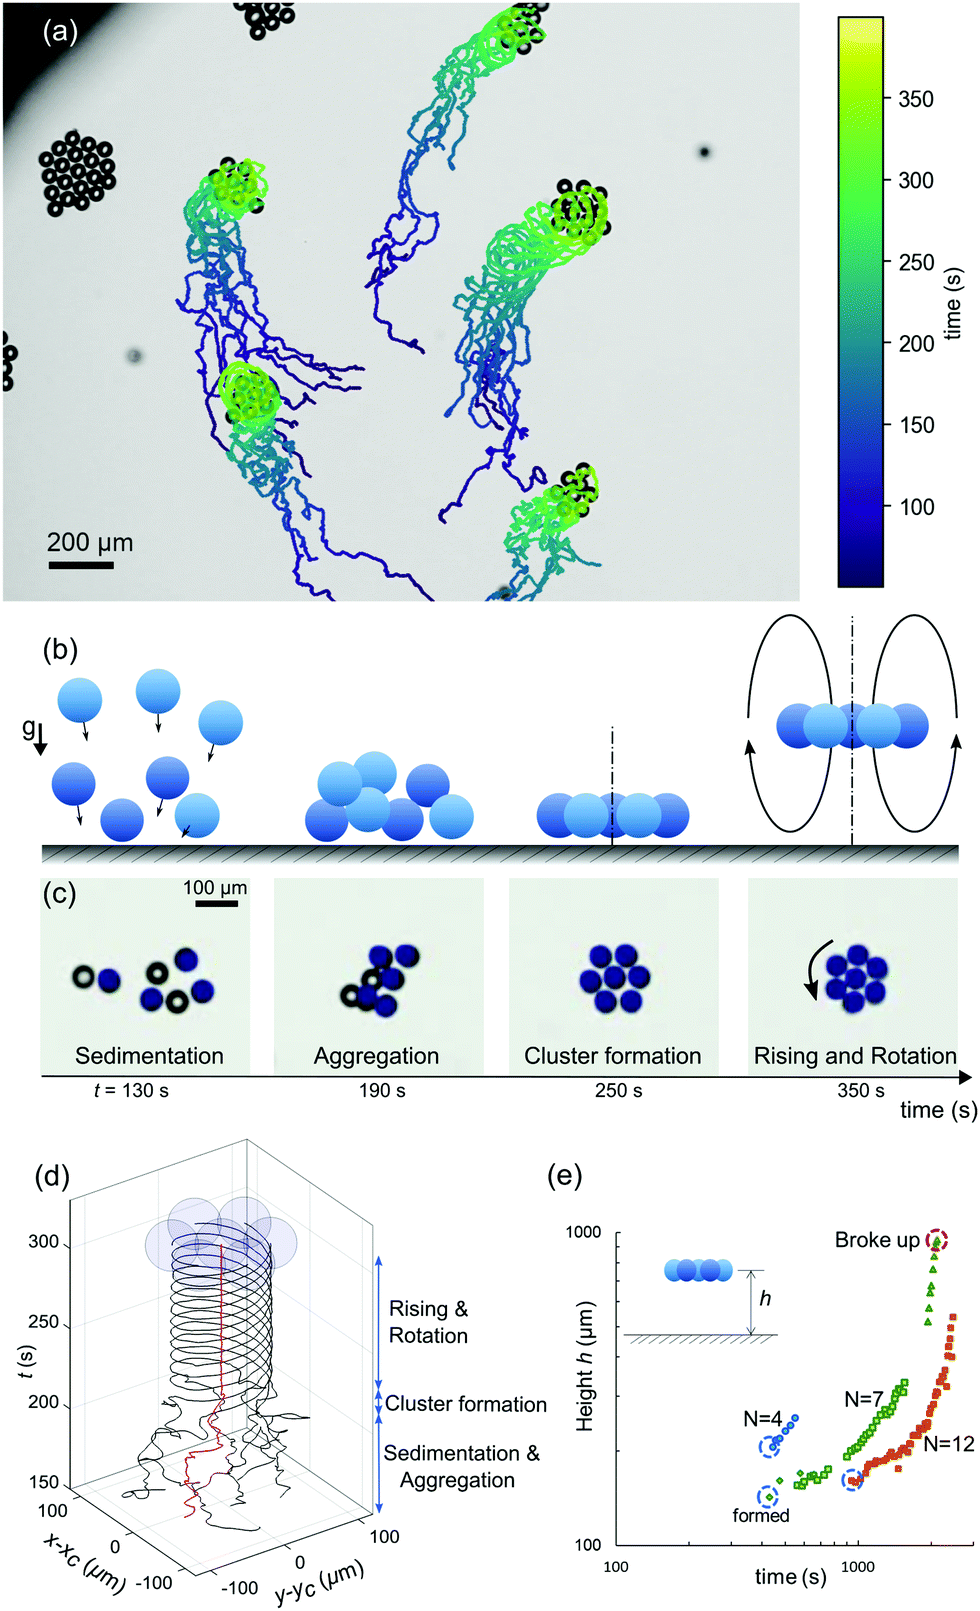 | ||
| Fig. 5 (a) Flow-induced self-assembly of droplets, resulting in spontaneously-rotating clusters, with trajectories of individual droplets colour coded by time. The micrograph is one snapshot from the experiment. (b) and (c): four stages of rotating cluster formation, schematic drawings and video micrographs. The coloured droplets in (c) lie in the focal plane of the objective. (d) Trajectories of droplets forming one cluster. The z-axis marks the elapsed time. (e) Evolution of cluster hovering height with time, for clusters of various size (cTTAB = 8 wt%). | ||
To illustrate the phenomenon, we tracked the xy projection of the motion of seven individual droplets that eventually form a rotationally symmetric cluster. We have plotted the individual droplet trajectories centred around the coordinate of the middle droplet. As shown in Fig. 5d and Movie S3 (ESI†), the droplets initially moved about randomly. However, after aggregation, both the ordered cluster configuration and the rotational dynamics remained steady over long times.
All of the individual droplets in a cluster reoriented to swim upwards against gravity, thereby generating a global convective flow which makes the cluster hover, at a height that slightly decreases with cluster size and increases with cTTAB,6 but which is generally around 200 μm. Here, the in-plane configuration of the cluster is stabilised by the hydrodynamic interaction with the cell bottom.16,50 However, this static hovering destabilises over time as the clusters start to rise. We investigated this behaviour in a manual tracking experiment, where, over a period of 45 min, clusters nucleated, gradually rose at speeds on the order of 1 μm s−1, occasionally grew by attracting free droplets, and finally, after a period of accelerated rising, disintegrated at a height of several hundred micrometres. Clusters can disintegrate for several reasons: the hydrodynamic coupling to the cell bottom plane decreases with height, and the arrangement becomes susceptible to perturbative events, such as destabilising flow fields of adjacent clusters or individual droplets joining the cluster. Bigger clusters appear to be stable for longer times, which is not surprising, as small clusters contain a larger fraction of weakly bound boundary swimmers (see also the wide field view in Movie S3 (ESI†), where clusters move out of focus and finally disintegrate).
Using the calibrated z-drive of the stage of an Olympus IX-83 microscope at 40× magnification, we measured the hovering height of selected clusters with different sizes and plotted their height evolution over time in Fig. 5(e). We can attribute the initial rise of the clusters to the fact that the droplets dissolve and their size decreases accordingly: as argued by Rühle et al.,50 the flotation height of a single squirmer depends on the balance of sedimentation and self-propulsion speeds and is therefore size dependent. However, since the upward motion will also reconfigure the chemical (filled micelle) and flow fields around the cluster, it is quite likely that higher order effects, e.g. autochemotactic drift forces, substantially contribute to the rising dynamics.
We note that this process is not cyclic, i.e., after rising and dissociation we have not observed re-sedimentation and re-formation of clusters. For one, the droplets should now have shrunk to the point that their equilibrium flotation height is too high for a cluster to ‘feel’ the stabilising container bottom; in practice, the entire first cycle typically lasts for an hour which is comparable to the lifetime of these droplet swimmers.
Fig. 6(a–f) shows the flow fields generated by a non-rotating (top row) and a rotating (bottom) cluster in the xy plane at different heights z. Irrespective of rotation, the radial components of the velocity field vr show similar behaviour: outward flow (vr > 0) underneath the cluster and inward flow above the cluster (vr < 0). However, the tangential flow vθ only emerges in the case of the rotating cluster and is strongest in the cluster plane. The visualisation of the convective flows within the droplets in Fig. 6(g and h) and Movie S4 (ESI†) demonstrates the difference between rotating and non-rotating clusters, although the top-down flow mediating flotation is the major contribution in both cases.
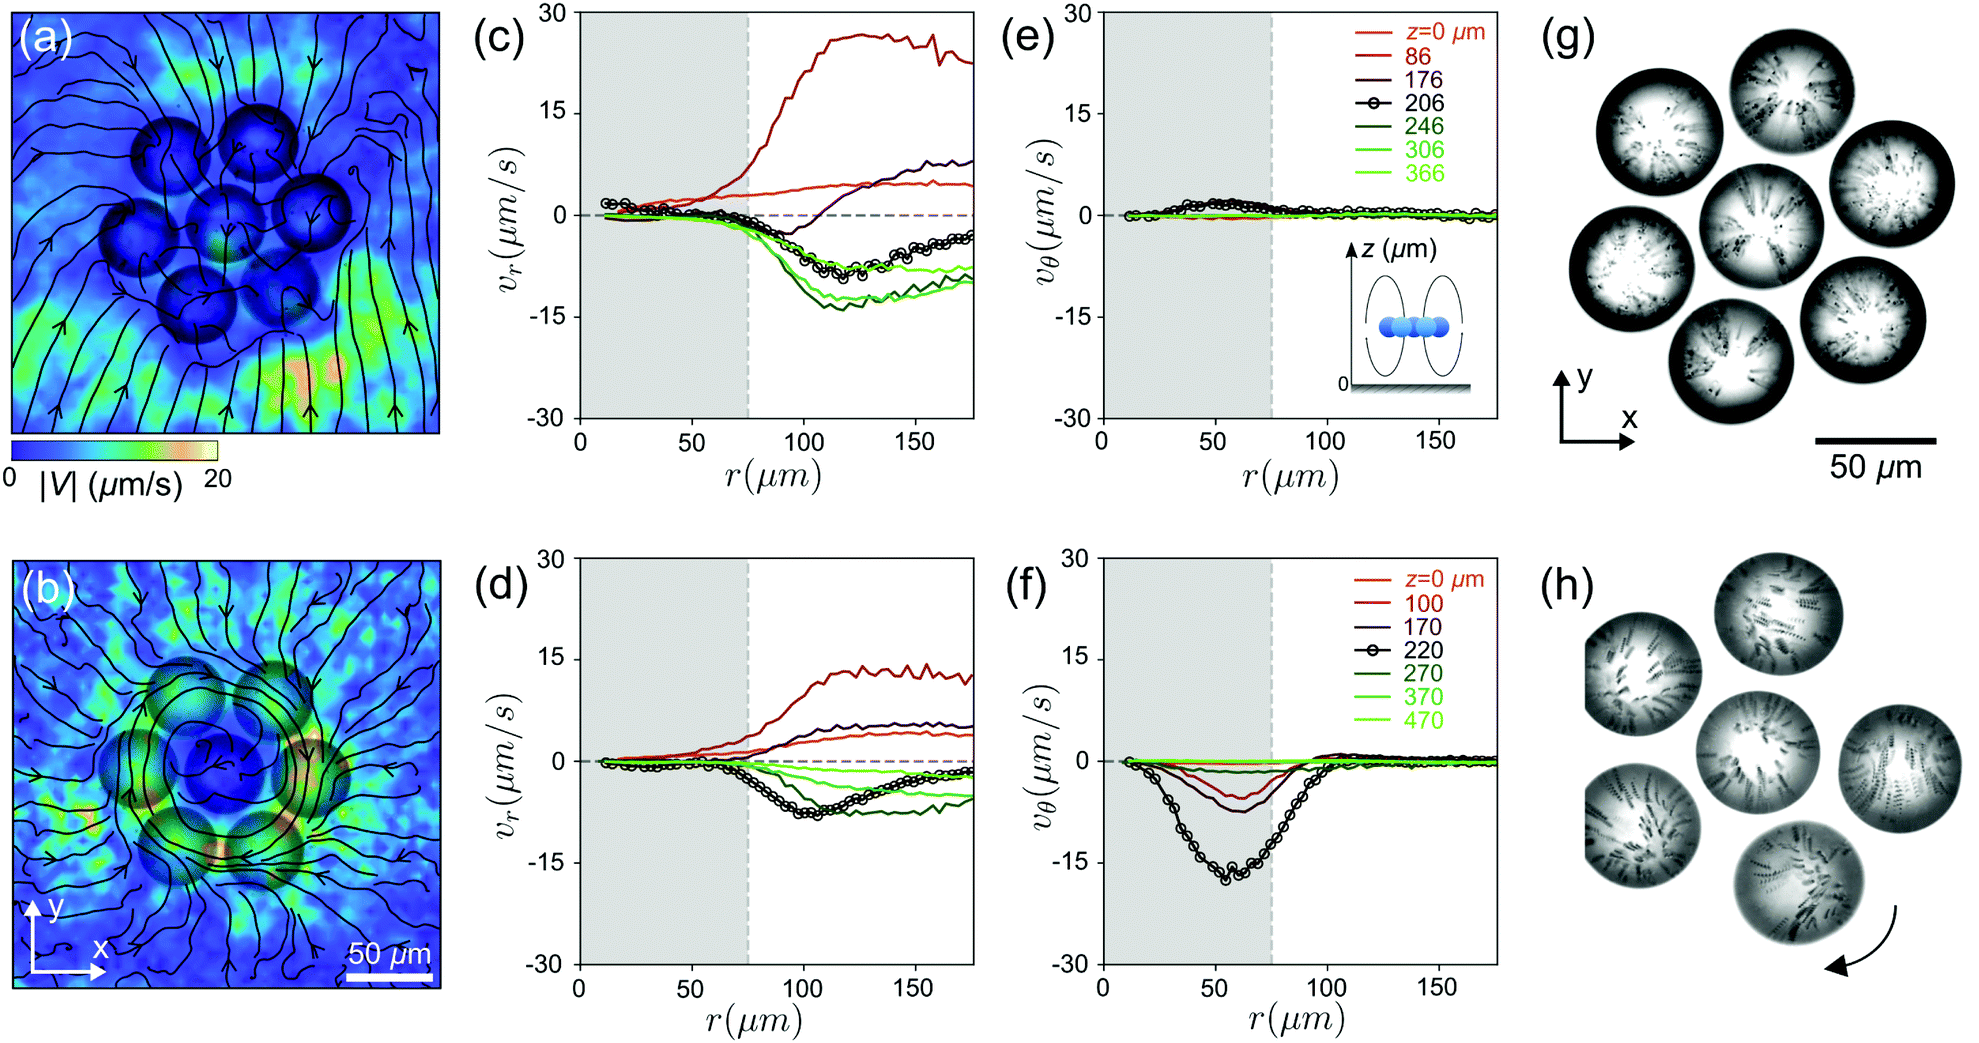 | ||
| Fig. 6 (a) and (b) Flow fields generated by the clusters in the x–y plane, by non-rotating and rotating clusters, respectively. (c) and (e) Radial vr and tangential vθ components of the velocity field at different heights for a non-rotating cluster. The black profile with the circle marker corresponds to the height of the cluster plane. (d) and (f) same for a rotating cluster. (g) and (h) internal convective flows within the droplets visualised by streaklines of tracer colloids during 0.25 seconds, for non-rotating and rotating clusters, respectively. | ||
6 Phase diagram of the cluster dynamics
We now study the phase behaviour of the clusters and characterise their dynamics. The two parameters under investigation are cluster size N and Péclet number (Pe). We chose N as a simple measure of collectivity in the cluster, while Pe, being a measure for oscillatory instabilities in single droplets,37 should also be applicable to classify similar instabilities in clustered states.In a space spanned by droplet activity Pe and cluster size N, we observe four regimes (Fig. 7a and Movie S5, ESI†): (i) no clustering due to insufficient droplet activity, (ii) non-rotating clusters, (iii) rotating clusters, and (iv) unstable clusters due to high activity.
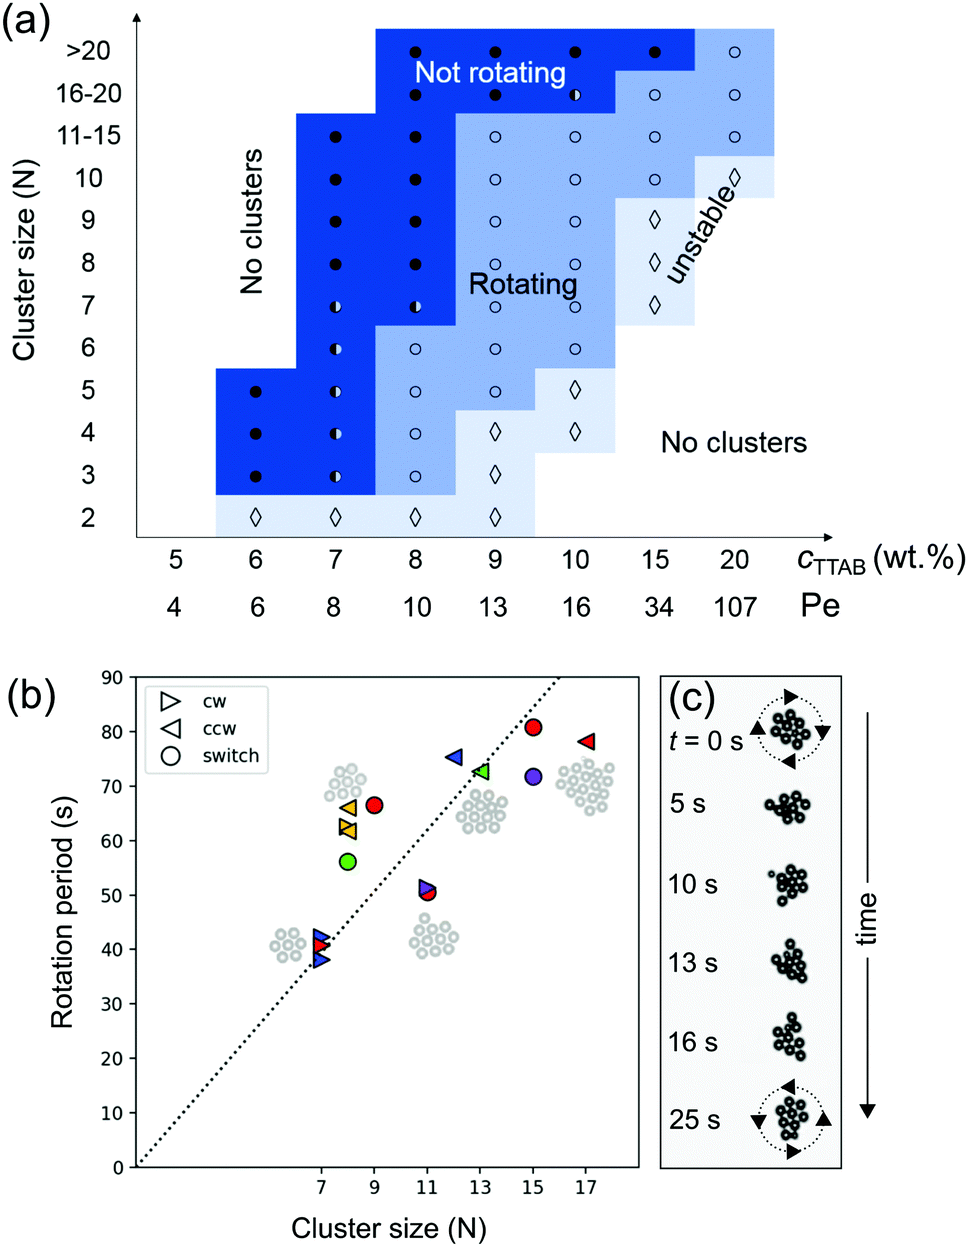 | ||
Fig. 7 (a) Cluster dynamics and stability, depending on cluster size N and activity cTTAB, with added single-swimmer Pe for comparison. • and ○ denote non-rotating and rotating clusters, respectively. The half-full circles corresponds to the margin where both behaviours are observed,  to unstable clusters. (b) Rotational period of the clusters versus their size, labels denote clockwise, counterclockwise and switching rotation; different colours mark data from different experimental runs. (c) A cluster switching rotation direction after dissociating and reforming again. to unstable clusters. (b) Rotational period of the clusters versus their size, labels denote clockwise, counterclockwise and switching rotation; different colours mark data from different experimental runs. (c) A cluster switching rotation direction after dissociating and reforming again. | ||
At low Pe, droplets generate weaker flow and only small clusters form (N = 3–5 at Pe = 5.2). By increasing Pe, the droplet activity increases and in turn the hydrodynamic interactions are strong enough to form larger clusters.
At Pe = 6.8 to 8.7, the dynamics of smaller clusters (N < 8) transition from non-rotating to rotating.
For sufficiently large Pe, we observe unstable clusters that rearrange their structure frequently. In this regime, during the very short periods when the cluster is hexagonally ordered, it starts to rotate before reconfiguring again into a disordered aggregate.
We also probed the aggregation behaviour using droplets of increased size, Rd = 40 μm and Rd = 50 μm, which in individual swimmers increases Pe up to fourfold. While we do not expect a simple quantitative shift of the phase behaviour in Fig. 7(a), we gathered the following qualitative tendencies compared to the Rd = 25 μm case: The aggregation time scale accelerates significantly, from ≈300 s to ≈30 s. As expected, the hovering height decreases, to 80 μm to 110 μm. For low cTTAB = 7.5 wt%, we observed persistently rotating dimers and trimers coexisting with non-rotating larger clusters, and frequently rearranging aggregates at higher concentrations. These observations are consistent with the Pe dependent behaviour seen in smaller droplets, but apparently with a smaller window of stable rotation.
While increasing Pe results in the formation of larger clusters, the cluster size also influences the collective dynamics. As shown in Fig. 7(a), at a given Pe, the cluster behaviour changes from rotating to non-rotating with N. For instance, at Pe = 10.9, very large clusters of size N > 20 barely rotate, while smaller clusters (N < 10) rotate steadily.
This is reflected in Fig. 7(b), in which we have plotted the measured rotational period of clusters with different N at Pe = 13.2. The rotational velocity of a cluster linearly decreases with N.
A similar dependence on N was found by Petroff et al.18 in analysis of Thiovulum majus bacteria that self-organise into 2D clusters rotating counter-clockwise at a solid boundary.51 Here, the counter-clockwise orientation is imposed by the chirality of the bacterial flagella, and a global torque results from the coupling of the individual spinners. The authors analysed the dependence of the rotation period on the cluster size using a scaling relation between viscous friction and hydrodynamic torques.
As in our case the symmetry is broken spontaneously, we observe that the clusters rotate both clockwise and counter-clockwise and can spontaneously switch between the two after an external perturbation. We illustrate this with sequential video frames in Fig. 7(c), taken from Movie S6 (ESI†), where a cluster of size N = 9 first steadily rotates clockwise, then spontaneously loses its crystalline order, then again reorders and begins to rotate, but now counter-clockwise.
7 Chirality and broken symmetries
We further note an intriguing fact when we compare the present results to our previous study on clustering droplets composed of CB15's nematic isomer 5CB.6 Individual nematic droplets feature an extremely robust helical or oscillatory instability caused by nematoelastic torques,39 while, as discussed above, helical swimming in isotropic droplets is limited to a narrow Pe range and mostly suppressed in quasi 2D. However, for clustered states the situation is reversed: isotropic clusters develop stable rotation states, while, in experiments exploring the same parameter space as in Fig. 7 using 5CB droplets, we did not observe any collective rotation.To understand why a cluster built from nematogens would not rotate, let us consider the sketches in Fig. 8. Motile nematic droplets with perpendicular interfacial anchoring incorporate a topological defect of charge 1 that is displaced by the internal flow towards the anterior of the moving droplet. This confers a polarity on the droplet, symbolised in Fig. 8 by a vector corresponding to the defect orientation, which can be extracted from polarised or phase contrast microscopy (panels a and c). As the viscosity of nematogens is reduced around a defect,52 the tangential flow at the interface is enhanced in its vicinity (panel c). In the collective state, the strong radial outflux between cluster and container bottom tilts the droplets around the perimeter inwards (panel a and b, left, see also Fig. 5 in ref. 6). A superimposed rotation would require an additional in-plane tilt of all defect vectors in the same direction (panel b, right). However, as sketched in panel c, the superposition of tangential flow between adjacent droplets would favour them to turn towards each other, such that a uniform tilt causing collective rotation could not arise spontaneously.
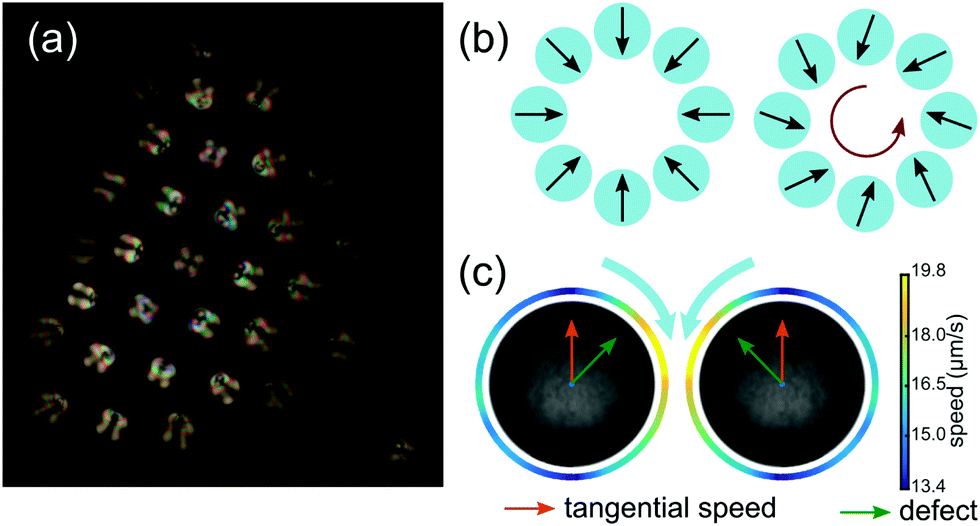 | ||
| Fig. 8 (a) Polarised micrograph of a non-rotating cluster of 5CB nematogen droplets. The orientation of the internal defect is inferred via the fringe pattern: swimmers around the perimeter are titled inwards. (b) Defect orientation pattern required for a non-rotating (left) and a rotating (right) cluster. (c) The coupling of tangential flow fields of adjacent droplets would cause the droplets to tilt towards each other. Panel adapted from ref. 39, Fig. 4. | ||
Inspired by systems like Thiovulum majus, we can yet enforce a prescribed rotation on the stationary nematic clusters by adding the enantiomeric chiral dopants R811 and S811 to the 5CB oil phase. This results in the formation of helical superstructures inside the droplets and, in turn, a twisting flow around them.53 The clusters now rotate with the chirality imposed on the molecular scale (Fig. 9(b and c)). In this case, the chirality is imposed and not required to emerge spontaneously.
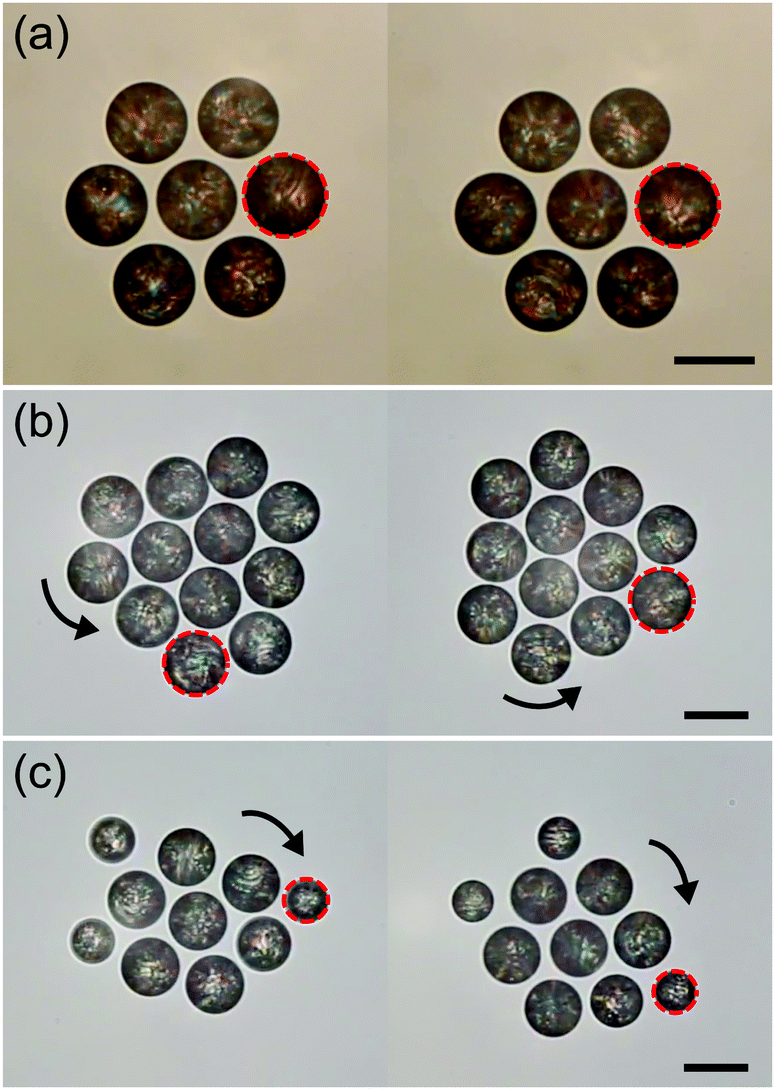 | ||
| Fig. 9 The behaviour of clusters formed by active (a) nematic 5CB, (b) chiral nematic 5CB + R811, and (c) chiral nematic 5CB + S811 droplets. The dashed circle shows one selected droplet within each cluster between two sequential frames (25 seconds apart). Scale bars are 50 μm. | ||
8 Conclusions
In conclusion, we demonstrated that a simple emulsion of active droplets can use hydrodynamic interactions to self-organise into rotating planar clusters reminiscent of living systems.Since the system has no inherent broken symmetry – the droplets themselves are isotropic and rotation occurs even in symmetric heptamer structures like the one in Fig. 5c – the emergence of this rotational motion was, to us, unexpected. Lacking built-in asymmetries, the symmetry has to be broken spontaneously by the nonlinear hydrodynamics of the system. This helical instability arises due to the nonlinearity of surfactant transport and circumvents the need to incorporate built-in, structural asymmetry within the droplet.39,54,55 We characterised the 3D dynamics of individual droplets and identified for increasing Pe three regimes of persistent, helical, and chaotic swimming.
Notably, the helical instability in individual CB15 droplets is limited to a very narrow range of 6.8 ≤ Pe ≤ 8.7. Beyond Pe = 8.7, the dynamics become increasingly chaotic. In contrast, the planar clusters exhibit rotational dynamics within the range of 6.8 ≤ Pe ≤ 91.8 which is remarkably broader compared to the range for the individual droplets. In other words, the clusters show ordered rotational motion even at a Pe range corresponding to the chaotic motion of its constituent elements. This suggests that the cluster formation suppresses the chaotic dynamics of the individual droplets and integrates them into an ordered collective system which performs a synchronised rotational motion. This stability is achieved cooperatively through mutual hydrodynamic interactions between the constituent elements of the clusters. At very high Pe, only very large clusters maintain their ordered structure (stability) and rotate. We showed that the collective properties of rotation period and stability can be controlled by tuning the activity (Pe) and the cluster size.
In our comparison with 5CB droplets, we found that the torques that cause stable helical rotation for individual swimmers can inhibit rotation on the collective scale. We found this quite remarkable: CB15 and 5CB are isomers, so that the main difference between the two systems lies in nematic topology. For individual swimmers, the nematic system has a much more robust helical instability. However, the nonlinear dynamics governing the emergence of collective states apparently cause an inversion of the rotational characteristics, as CB15 clusters rotate and 5CB ones don't, a phenomenon that can be rationalised by fundamental symmetry arguments. Combined with the possibility of controlling chirality via chiral dopants, our findings provide inspiration to the design of tailored rotational states in functional materials.
Author contributions
B. V. H., A. N. and P. R. designed and performed experiments, analysed data and wrote the manuscript. C. K. contributed experiments. C. C. M. designed experiments, analysed data and wrote the manuscript.Conflicts of interest
There are no conflicts to declare.9 Appendix: Materials, methods and supplementary movies
9.1 Materials
We obtained 5CB, CB15, TTAB, R811, and S811 from commercial suppliers (Synthon Chemicals and Sigma-Aldrich) and used them as is.9.2 Droplet production
We fabricated microfluidic devices using standard soft lithography procedures and used them to produce monodisperse emulsions of CB15 and stored them in aqueous TTAB solution with a submicellar concentration. For a detailed protocols of the droplet production, see ref. 37.9.3 Experimental cells and protocols
For the quasi-2D geometries used for PIV measurements, we embedded rectangular reservoirs with the dimensions of 13 × 8 × 0.05 mm3via UV photolithography in SU-8 photoresist (Micro Resist Technologies). For a detailed description of the fabrication protocol, we refer to the supplementary material in ref. 37.For 3D experiments, we used a cylindrical PDMS reservoir (Fig. 2) of height 5 mm and diameter 5 mm. We added small amounts of stock emulsion to TTAB solution at the target concentration, filled reservoirs with this mixture, capped the reservoir with glass cover slips and started videomicroscopy as fast as experimentally feasible (within tens of seconds).
9.4 Microscopy, image recording, and analysis
We observed the large-scale dynamics of the active emulsions under a bright-field microscope (Leica DM4000 B) at magnifications of 2.5× and 5×. Video frames were recorded at 4 frames per second using a Canon digital camera (EOS 600d) with a digital resolution of 1920 × 1080 px. The droplet coordinates were extracted using custom Python scripts (available on request) based on the libraries numpy, PIL, and openCV. Droplet coordinates were acquired via a sequence of background correction, binarisation, feature correlation, blob detection by contour analysis, and minimum enclosing circle fits. Droplet trajectories were then acquired via a frame-by-frame nearest-neighbour analysis. The height measurements and PIV measurements were performed using an Olympus IX83 microscope and images were recorded by a 4 MP CMOS camera (FLIR Grasshopper 3, GS3-U3-41C6M-C) at frame rates between 4 and 24 frames per second under 10× magnification. PIV analysis was done using the MATLAB-based PIVlab interface.569.5 Viscosity measurements
We measured the viscosity of the oil phase and the surfactant solution using an Anton Paar MCR 502 rotational rheometer. For the oil phase, we found μi = 138 mPa s, for the surfactant solutions the measured values were μi = 1.3, 1.6, 1.9, and 2.9 mPa s, corresponding to cTTAB = 5, 10, 15, and 20 wt%, respectively. The estimated values, corresponding to other cTTAB, were extracted by interpolation.9.6 Dissolution rate of active droplets
To estimate the surfactant consumption rate qs for our calculation of Pe, we measured the droplet shrinking rate dRd/dt (plotted in Fig. 10). We found a dependence on cTTAB. We used a first order approximation, via linear regression (black line), for dRd/dt, to calculate qs for different cTTAB values. qs is estimated by relating the dissolution rate of the active droplet to the isotropic surfactant consumption at the droplet interface35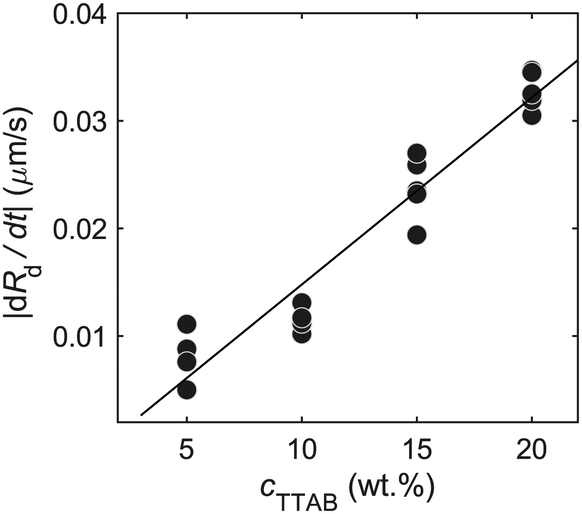 | ||
| Fig. 10 Dissolution rate of active droplets dRd/dt versus different cTTAB values. | ||
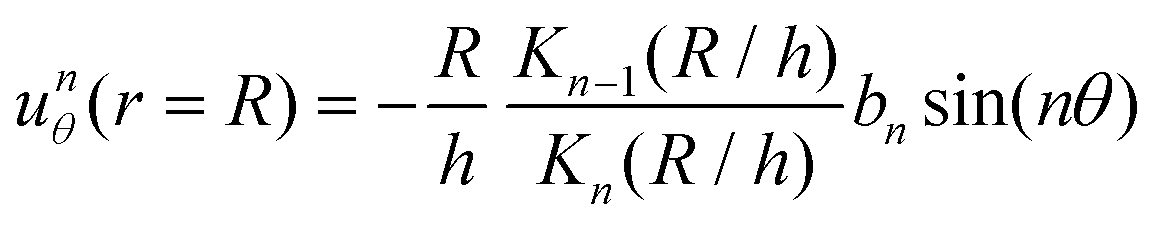
9.7 Brinkman squirmer model
Following the formalism in ref. 45, we consider a squirmer of radius r = R moving through a Hele-Shaw cell of height h at low Reynolds number. The Stokes equations approximated by the Brinkman equations can be written as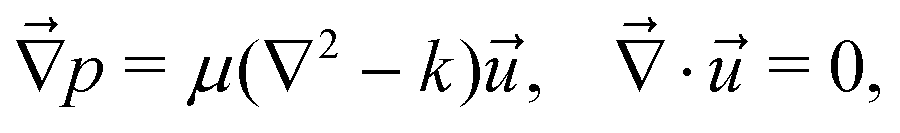 | (2) |
| unr (r = R) = 0 | (3) |
where Kn(x) is the modified Bessel function of the second kind of order n.
The solution of the above equations is given below.
The surface actuation solution using the first two modes is:
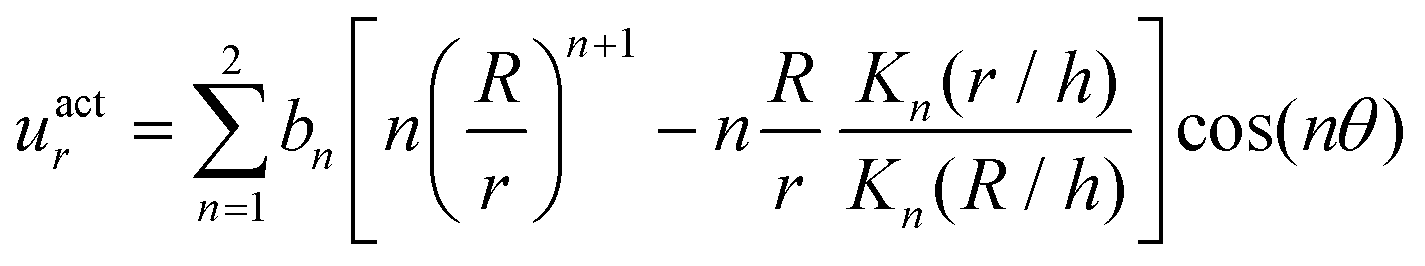 | (5) |
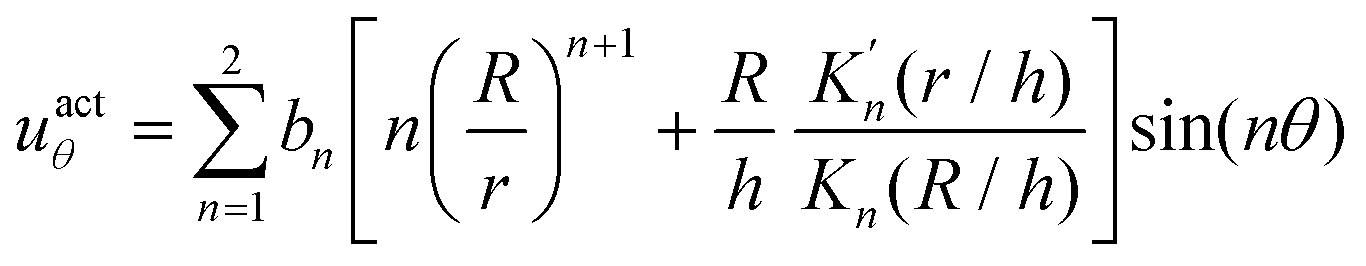 | (6) |
| Uact = uactr + uactθ | (7) |
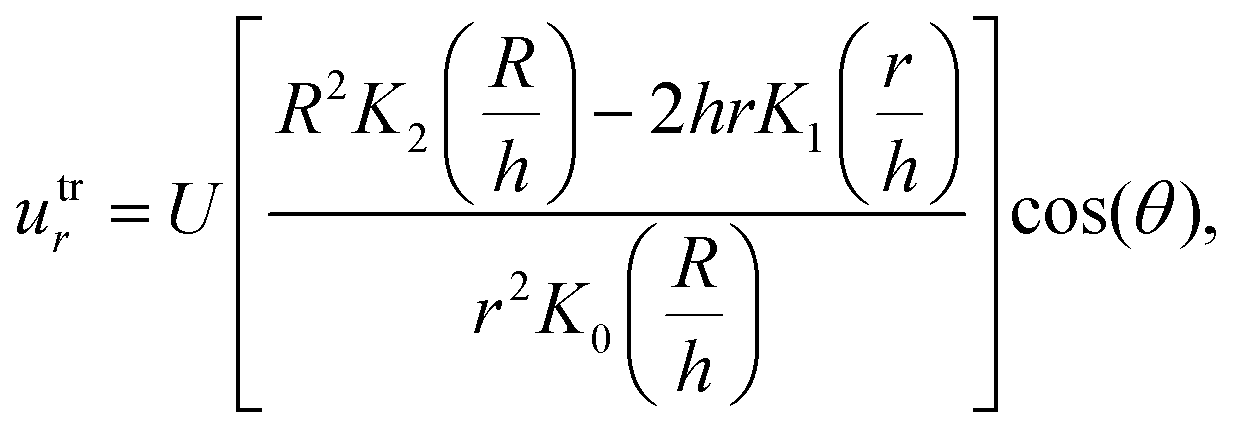 | (8) |
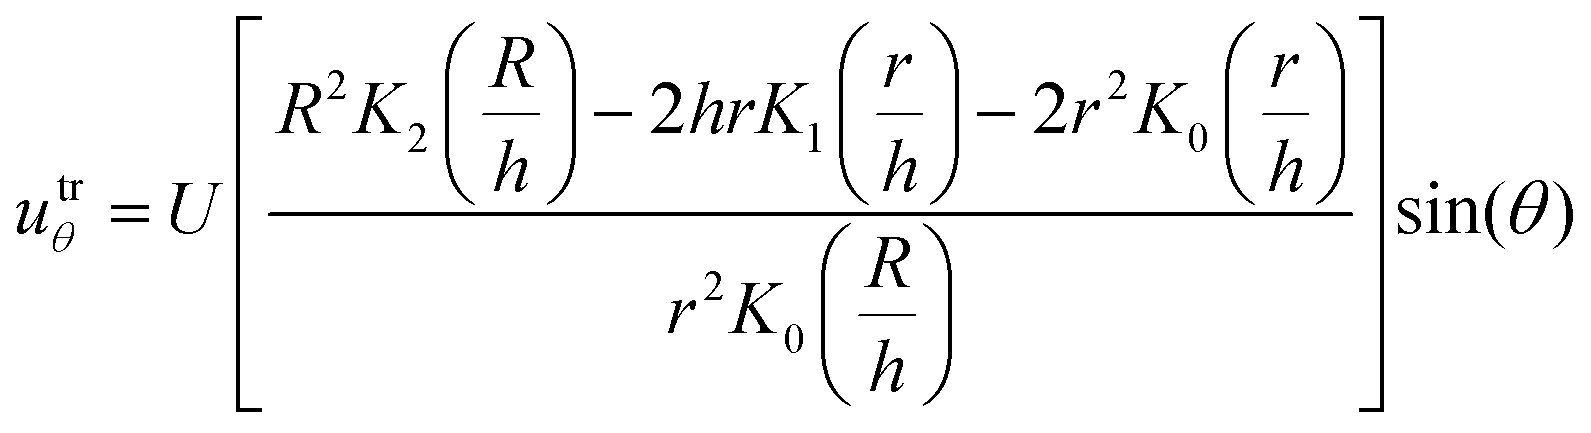 | (9) |
| Utr = utrr + utrθ | (10) |
| Uswim = Uact + Utr | (11) |
9.8 Supplementary movies captions
Movie S1. Hydrodynamic interaction between two active droplets within a Hele-Shaw cell. The video is played 6× faster. The background shows a multi-frame superposition tracking the trajectories of the two droplets.Movie S2. Phase separation and cluster formation in an active emulsion inside a deep reservoir, including both rotating and non-rotating clusters. The video is played 24× faster.
Movie S3. Schematic rendering (Blender) of the assembly and collective motion of a rising and rotating cluster. The xy data was taken from bright field microscopy data of 50 μm droplets, while the height was assumed to increase linearly with time. The video is played 8× faster.
Movie S4. Internal convective flows within the droplets visualised by streaklines of tracer colloids for non-rotating and rotating clusters. The video is played in real time.
Movie S5. Different regimes of cluster dynamics. The video is played 24× faster.
Movie S6. A cluster switching rotation direction after dissociating and reforming again. The video is played 24× faster.
Acknowledgements
We acknowledge fruitful discussions and advice specifically from Ranabir Dey, as well as with Jun Hayakawa, Detlef Lohse, Yibo Chen and Stephan Herminghaus. C. C. M. and B. V. H. acknowledge financial support from the DFG Priority Programme 1726, “Microswimmers”. The authors acknowledge financial assistance from Hitachi Ltd. Open Access funding provided by the Max Planck Society.Notes and references
- A. Snezhko and I. S. Aranson, Nat. Mater., 2011, 10, 698–703 CrossRef CAS PubMed.
- A. Aubret, M. Youssef, S. Sacanna and J. Palacci, Nat. Phys., 2018, 14, 1114–1118 Search PubMed.
- M. V. Sapozhnikov, Y. V. Tolmachev, I. S. Aranson and W.-K. Kwok, Phys. Rev. Lett., 2003, 90, 114301 CrossRef CAS PubMed.
- A. Snezhko, M. Belkin, I. S. Aranson and W.-K. Kwok, Phys. Rev. Lett., 2009, 102, 118103 CrossRef CAS PubMed.
- J. Palacci, S. Sacanna, A. P. Steinberg, D. J. Pine and P. M. Chaikin, Science, 2013, 339, 936–940 CrossRef CAS PubMed.
- C. Krüger, C. Bahr, S. Herminghaus and C. C. Maass, Eur. Phys. J. E: Soft Matter Biol. Phys., 2016, 39, 64 CrossRef PubMed.
- I. Theurkauff, C. Cottin-Bizonne, J. Palacci, C. Ybert and L. Bocquet, Phys. Rev. Lett., 2012, 108, 268303 CrossRef CAS PubMed.
- A. Bricard, J.-B. Caussin, N. Desreumaux, O. Dauchot and D. Bartolo, Nature, 2013, 503, 95–98 CrossRef CAS PubMed.
- A. Bricard, J.-B. Caussin, D. Das, C. Savoie, V. Chikkadi, K. Shitara, O. Chepizhko, F. Peruani, D. Saintillan and D. Bartolo, Nat. Commun., 2015, 6, 7470 CrossRef CAS PubMed.
- Z. T. Liu, Y. Shi, Y. Zhao, H. Chaté, X.-Q. Shi and T. H. Zhang, Proc. Natl. Acad. Sci. U. S. A., 2021, 118, e2104724118 CrossRef CAS PubMed.
- I. Buttinoni, J. Bialké, F. Kümmel, H. Löwen, C. Bechinger and T. Speck, Phys. Rev. Lett., 2013, 110, 238301 CrossRef PubMed.
- M. E. Cates and J. Tailleur, Annu. Rev. Condens. Matter Phys., 2015, 6, 219–244 CrossRef CAS.
- M. C. Marchetti, J.-F. Joanny, S. Ramaswamy, T. B. Liverpool, J. Prost, M. Rao and R. A. Simha, Rev. Mod. Phys., 2013, 85, 1143–1189 CrossRef CAS.
- S. Ramaswamy, Nat. Rev. Phys., 2019, 1, 640–642 CrossRef.
- F. J. Schwarzendahl and M. G. Mazza, Soft Matter, 2018, 14, 4666–4678 RSC.
- R. Singh and R. Adhikari, Phys. Rev. Lett., 2016, 117, 228002 CrossRef PubMed.
- J.-T. Kuhr, F. Rühle and H. Stark, Soft Matter, 2019, 15, 5685–5694 RSC.
- A. P. Petroff, X.-L. Wu and A. Libchaber, Phys. Rev. Lett., 2015, 114, 158102 CrossRef PubMed.
- T. H. Tan, A. Mietke, H. Higinbotham, J. Li, Y. Chen, P. J. Foster, S. Gokhale, J. Dunkel and N. Fakhri, arXiv, 2021, 2105.07507 Search PubMed.
- I. H. Riedel, K. Kruse and J. Howard, Science, 2005, 309, 300–303 CrossRef CAS PubMed.
- Z. Shen, A. Würger and J. S. Lintuvuori, Soft Matter, 2019, 15, 1508–1521 RSC.
- Z. Shen and J. S. Lintuvuori, Phys. Rev. Fluids, 2019, 4, 123101 CrossRef.
- S. Thutupalli, D. Geyer, R. Singh, R. Adhikari and H. A. Stone, Proc. Natl. Acad. Sci. U. S. A., 2018, 115, 5403–5408 CrossRef CAS PubMed.
- A. Varma, T. D. Montenegro-Johnson and S. Michelin, Soft Matter, 2018, 14, 7155–7173 RSC.
- N. Oppenheimer, D. B. Stein and M. J. Shelley, Phys. Rev. Lett., 2019, 123, 148101 CrossRef CAS PubMed.
- X. Chen, X. Yang, M. Yang and H. P. Zhang, EPL, 2015, 111, 54002 CrossRef.
- M. Huang, W. Hu, S. Yang, Q.-X. Liu and H. P. Zhang, Proc. Natl. Acad. Sci. U. S. A., 2021, 118, e2100493118 CrossRef CAS PubMed.
- Y. Goto and H. Tanaka, Nat. Commun., 2015, 6, 5994 CrossRef CAS PubMed.
- C. Maggi, J. Simmchen, F. Saglimbeni, J. Katuri, M. Dipalo, F. D. Angelis, S. Sanchez and R. D. Leonardo, Small, 2016, 12, 446–451 CrossRef CAS PubMed.
- F. Schmidt, B. Liebchen, H. Löwen and G. Volpe, J. Chem. Phys., 2019, 150, 094905 CrossRef PubMed.
- C. H. Meredith, A. C. Castonguay, Y.-J. Chiu, A. M. Brooks, P. G. Moerman, P. Torab, P. K. Wong, A. Sen, D. Velegol and L. D. Zarzar, Matter, 2022, 5, 616–633 CrossRef CAS.
- S. Michelin, E. Lauga and D. Bartolo, Phys. Fluids, 2013, 25, 061701 CrossRef.
- M. Morozov and S. Michelin, J. Chem. Phys., 2019, 150, 044110 CrossRef PubMed.
- M. Morozov, Soft Matter, 2020, 16, 5624–5632 RSC.
- Z. Izri, M. N. van der Linden, S. Michelin and O. Dauchot, Phys. Rev. Lett., 2014, 113, 248302 CrossRef PubMed.
- C. C. Maass, C. Krüger, S. Herminghaus and C. Bahr, Annu. Rev. Condens. Matter Phys., 2016, 7, 171–193 CrossRef CAS.
- B. V. Hokmabad, R. Dey, M. Jalaal, D. Mohanty, M. Almukambetova, K. A. Baldwin, D. Lohse and C. C. Maass, Phys. Rev. X, 2021, 11, 011043 Search PubMed.
- S. Suda, T. Suda, T. Ohmura and M. Ichikawa, Phys. Rev. Lett., 2021, 127, 088005 CrossRef CAS PubMed.
- C. Krüger, G. Klös, C. Bahr and C. C. Maass, Phys. Rev. Lett., 2016, 117, 048003 CrossRef PubMed.
- J. L. Anderson, Annu. Rev. Fluid Mech., 1989, 21, 61–99 CrossRef.
- S. Herminghaus, C. C. Maass, C. Krüger, S. Thutupalli, L. Goehring and C. Bahr, Soft Matter, 2014, 10, 7008–7022 RSC.
- M. Suga, S. Suda, M. Ichikawa and Y. Kimura, Phys. Rev. E, 2018, 97, 062703 CrossRef CAS PubMed.
- R. Dey, C. M. Buness, B. V. Hokmabad, C. Jin and C. C. Maass, arXiv, 2021, 2106.10222 Search PubMed.
- A. Zöttl and H. Stark, Phys. Rev. Lett., 2012, 108, 218104 CrossRef PubMed.
- C. Jin, Y. Chen, C. C. Maass and A. J. T. M. Mathijssen, Phys. Rev. Lett., 2021, 127, 088006 CrossRef CAS PubMed.
- P. Ramesh, B. V. Hokmabad, M. Rahalia, A. J. T. M. Mathijssen, D. O. Pushkin and C. C. Maass, arXiv, 2022, 2202.08630 Search PubMed.
- J. R. Blake, J. Fluid Mech., 1971, 46, 199–208 CrossRef.
- E. Lauga and T. R. Powers, Rep. Prog. Phys., 2009, 72, 096601 CrossRef.
- P. G. Moerman, H. W. Moyses, E. B. van der Wee, D. G. Grier, A. van Blaaderen, W. K. Kegel, J. Groenewold and J. Brujic, Phys. Rev. E, 2017, 96, 032607 CrossRef PubMed.
- F. Rühle, J. Blaschke, J.-T. Kuhr and H. Stark, New J. Phys., 2018, 20, 025003 CrossRef.
- D. Das and E. Lauga, Phys. Rev. E, 2019, 100, 043117 CrossRef CAS PubMed.
- A. G. Chmielewski, Mol. Cryst. Liq. Cryst., 1986, 132, 339–352 CrossRef CAS.
- T. Yamamoto and M. Sano, Phys. Rev. E, 2019, 99, 022704 CrossRef CAS PubMed.
- B. V. Hokmabad, K. A. Baldwin, C. Krüger, C. Bahr and C. C. Maass, Phys. Rev. Lett., 2019, 123, 178003 CrossRef CAS PubMed.
- X. Wang, R. Zhang, A. Mozaffari, J. J. de Pablo and N. L. Abbott, Soft Matter, 2021, 17, 2985–2993 RSC.
- W. Thielicke and E. Stamhuis, JORS, 2014, 2, e30 Search PubMed.
Footnote |
| † Electronic supplementary information (ESI) available: Supplementary Videos. See DOI: 10.1039/d1sm01795k |
| This journal is © The Royal Society of Chemistry 2022 |