
 Open Access Article
 This Open Access Article is licensed under a Creative Commons Attribution-Non Commercial 3.0 Unported Licence
On the formation of hydrogen peroxide in water microdroplets†
Adair
Gallo Jr.‡
 a,
Nayara H.
Musskopf‡
a,
Xinlei
Liu
b,
Ziqiang
Yang
b,
Jeferson
Petry
a,
Peng
Zhang
a,
Sigurdur
Thoroddsen
b,
Hong
Im
b and
Himanshu
Mishra
*a
a,
Nayara H.
Musskopf‡
a,
Xinlei
Liu
b,
Ziqiang
Yang
b,
Jeferson
Petry
a,
Peng
Zhang
a,
Sigurdur
Thoroddsen
b,
Hong
Im
b and
Himanshu
Mishra
*a
aInterfacial Lab (iLab), Biological and Environmental Science and Engineering (BESE) Division, Water Desalination and Reuse Center (WDRC), King Abdullah University of Science and Technology (KAUST), Thuwal 23955-6900, Saudi Arabia. E-mail: Himanshu.Mishra@kaust.edu.sa
bPhysical Science and Engineering (PSE) Division, King Abdullah University of Science and Technology (KAUST), Thuwal 23955-6900, Saudi Arabia
First published on 14th January 2022
Abstract
Recent reports on the formation of hydrogen peroxide (H2O2) in water microdroplets produced via pneumatic spraying or capillary condensation have garnered significant attention. How covalent bonds in water could break under such mild conditions challenges our textbook understanding of physical chemistry and water. While there is no definitive answer, it has been speculated that ultrahigh electric fields at the air–water interface are responsible for this chemical transformation. Here, we report on our comprehensive experimental investigation of H2O2 formation in (i) water microdroplets sprayed over a range of liquid flow-rates, (shearing) air flow rates, and air composition, and (ii) water microdroplets condensed on hydrophobic substrates formed via hot water or humidifier under controlled air composition. Specifically, we assessed the contributions of the evaporative concentration and shock waves in sprays and the effects of trace O3(g) on the H2O2 formation. Glovebox experiments revealed that the H2O2 formation in water microdroplets was most sensitive to the air–borne ozone (O3) concentration. In the absence of O3(g), we could not detect H2O2(aq) in sprays or condensates (detection limit ≥250 nM). In contrast, microdroplets exposed to atmospherically relevant O3(g) concentration (10–100 ppb) formed 2–30 µM H2O2(aq), increasing with the gas–liquid surface area, mixing, and contact duration. Thus, the water surface area facilitates the O3(g) mass transfer, which is followed by the chemical transformation of O3(aq) into H2O2(aq). These findings should also help us understand the implications of this chemistry in natural and applied contexts.
Introduction
Interfacial mass and energy transfer, chemical transformations/reactions, and tensions at water interfaces are implicated in numerous natural and industrial processes, such as the atmosphere–hydrosphere exchange,1 cloud physics2 and chemistry,3 thundercloud charging,4,5 precipitation,6 ion speciation7 and ion-catalyzed proton transfers,8,9 aerobic bioreactors,10 food science,11 soil physics,12 underwater insect respiration,13 and the ubiquitous water evaporation/condensation events. Probing the air–water interface of molecular thickness, however, remains a daunting research area due to the challenges associated with direct experimental interrogation as well as the limitations of the water models.14 Therefore, investigating the properties of the water surface is a research frontier in chemical science, sometimes invoking vigorous debates.14–26 With this preface, we introduce the latest reports on the chemical transformation of water into hydrogen peroxide (H2O2). Researchers have discovered the spontaneous production of (i) H2O2 (∼30 µM) in water microdroplets of diameter ≤20 µm sprayed via pressurized gas27 and (ii) H2O2 (≤115 µM) in condensed water microdroplets of diameter ≤10 µm on common substrates in the relative humidity range 40–70%.28 Crucially, smaller droplets yielded higher H2O2 concentration, pinpointing that the air–water interface is somehow implicated. How could the O–H covalent bonds in water with an approximate strength of ∼100 kcal mol−1 be broken under normal temperature and pressure (NTP, 293 K and 1 atm; kBT = 0.58 kcal mol−1) without the use of a catalyst, significant energy, or co-solvents? There is no explanation available at the moment. Presence of ultrahigh electric fields at the air–water interface has been speculated to be the cause.27,28 These findings challenge our textbook-level understanding of water and perhaps other similar liquids where constituent atoms occupy distant positions on the Pauling's electronegativity table.29 Given water's innumerable roles in environmental cycles and phenomena and industrial processes, could these findings herald a reassessment of what we know of water; opportunities in green chemistry also deserve a serious consideration.We started exploring this phenomenon soon after the appearance of the first report.27 A follow-up report revealed that even condensed water microdroplets contained H2O2, in fact, at even higher concentrations ≤115 µM.28 Let us take a moment to juxtapose these two unrelated experimental methods utilized to study this chemical transformation. Condensation is a gentle process governed by the relative humidity and the substrate's temperature and chemical make-up. In contrast, pneumatic sprays utilize high shearing gas-flow (e.g., 1–10 L min−1) from a microscale capillary/annulus leading to fast gas speeds (e.g., 100–1000 m s−1) that cause much turbulence/mixing/forced-convection inside and around the spray plume and can enhance the concentration of H2O2 due to the faster evaporation of the solvent (more details in Results and Discussion). In fact, if the spray-based experiments are conducted inside a controlled environment glovebox, the shearing gas-flow disturbs the atmospheric composition/distribution, especially the relative humidity. Thus, we restricted our preliminary investigation to water condensation,30 wherein we found that: (i) the condensed microdroplets formed via the vaporization of hot water (50–70 °C) did not contain H2O2; (ii) if ultrasonic humidifiers were exploited to form the vapor, ∼1 µM H2O2 was detected.30 Therefore, we established that the ultrasonic humidifier was a contributor to the H2O2 production and the air–water did not have any detectable effect. The fact that ultrasonic waves can produce H2O2 in water is well-known and has even been exploited in practical applications, including disinfection31 and water treatment32 (see ref. 33–35 for further information). Still, however, we remained puzzled – why did researchers in California observe ∼115-times and ∼30-times higher H2O2 in their condensation and spray experiments, respectively, while we did not find any H2O2 in similar experiments at KAUST? Here, by designing and applying a broad set of experiments, we propose a different explanation for the H2O2 formation in water microdroplets formed via pneumatic spraying or condensation.
Results
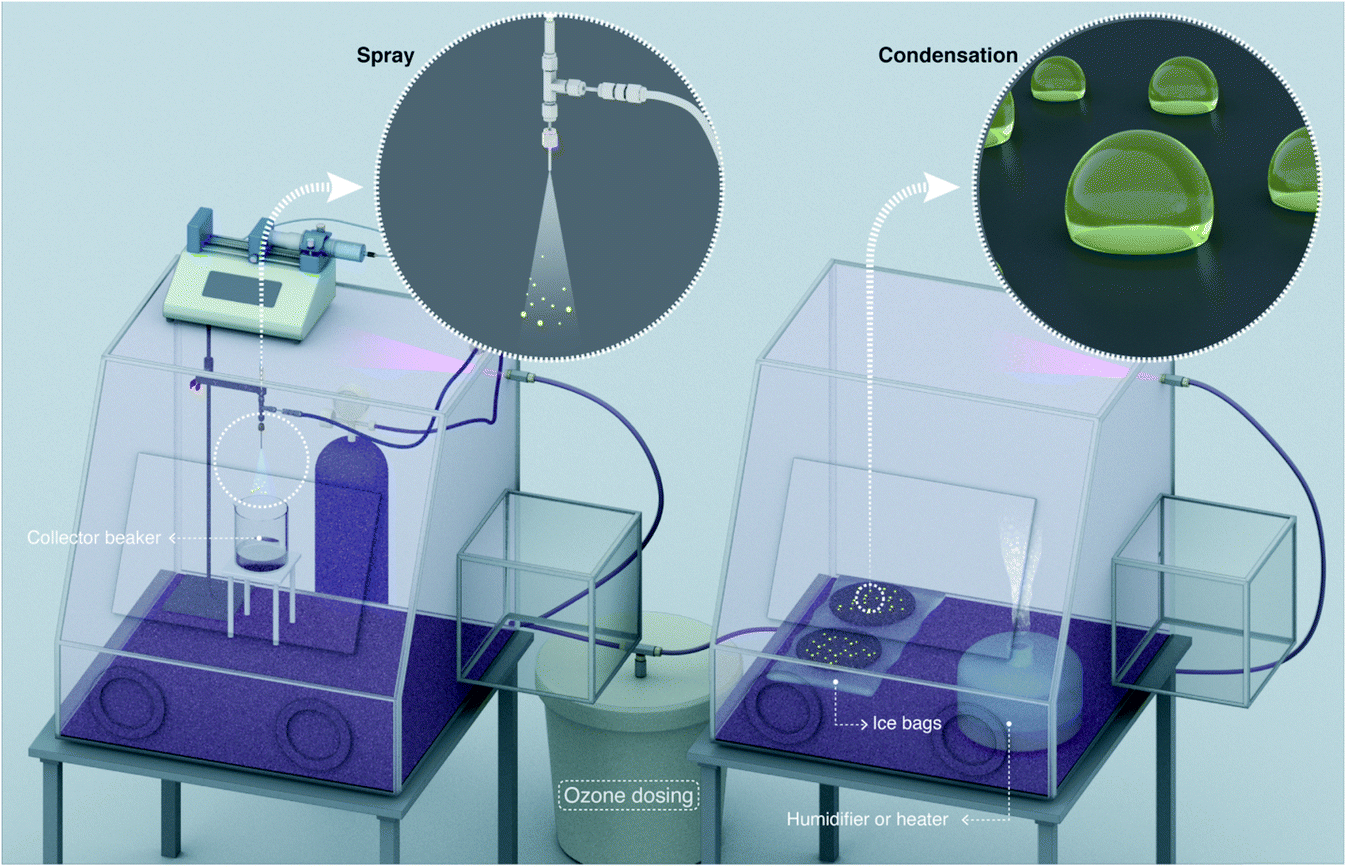
In this experimental study, we utilized high-purity HPLC-grade water as well as water from the standard MilliQ Advantage 10 set up (Methods). Commercially available hydrogen peroxide (H2O2) 30% solutions (v/v) were diluted using water and utilized for the calibration of the assays and other experiments (Fig. S1†). We utilized the fluorometric Hydrogen Peroxide Assay Kit (HPAK, ab138886, Abcam PLC, Cambridge, UK) that facilitated a detection range for aqueous H2O2 down to ∼250 nM,36,37 thereby affording a nearly 40-times lower limit of detection than the potassium titanium oxalate (PTO) assay employed in the original reports27,28 (Methods). HPAK calibration plots and comparisons with other standard H2O2 quantification methods, including the PTO assay and the hydroxyterephthalic acid (HTA) assay, have already been presented in our recent report.30For spraying water microdroplets, we custom-built pneumatic setups following the details presented in the recent report.27 Broadly, our spray units comprised of concentric stainless steel tubes (Fig. 1 and S2†), wherein water was pushed through the inner tube while pressurized N2 gas was applied through the outer annulus to shear the liquid (Table S1†). As water slugs/droplets moving at low speed are hit by fast flowing N2 gas, microdroplets are produced; size distribution of microdroplets depends on the liquid and gas flow rates as well as capillary dimensions (Fig. S3 and S4†). A sealed glass enclosure connected to the spray facilitated sample collection with minimal losses (Fig. 1). We also revisited the investigation of H2O2 production in condensed water microdroplets formed by heating water and ultrasonic humidifiers. Next, we delineate the various hypotheses and factors we considered could contribute to the H2O2 formation in water microdroplets (sprayed or condensed):
 | ||
| Fig. 1 Schematic of the experimental setup illustrates the evaporative concentration of H2O2 in aqueous sprays. The spray setup is comprised of two coaxial stainless steel capillary tubes; liquid flows in the inner tube while nitrogen gas flows through the outer annulus (see 3D design and photographs in Fig. S2†). Ultrapure water samples or aqueous solutions spiked with H2O2 are injected via a syringe pump and nitrogen gas is supplied by a high pressure cylinder. Sprayed microdroplets are collected in a clean glass flask until a sufficient analyte volume is collected (e.g., ≥400 µL analyte was needed for our HPAK analysis30). We define evaporation ratio as V0/VF, where, V0 is the liquid volume injected to create the spray and VF is the volume of the collected sample. Note that the droplets on the walls as well as the analyte collecting at the bottom of the collector flask also contribute to evaporation ratio. | ||
(i) Evaporative concentration (Fig. 1 and 2): trace amount of H2O2 could be present even in the water obtained from reverse osmosis.38 During spraying, as the solvent evaporates, the solute might concentrate, since the boiling point of H2O2 at 1 atm is 423 K that is 50 K higher than that of water;39,40 so H2O2 is expected to evaporate slower than water in the sprays and concentrate.
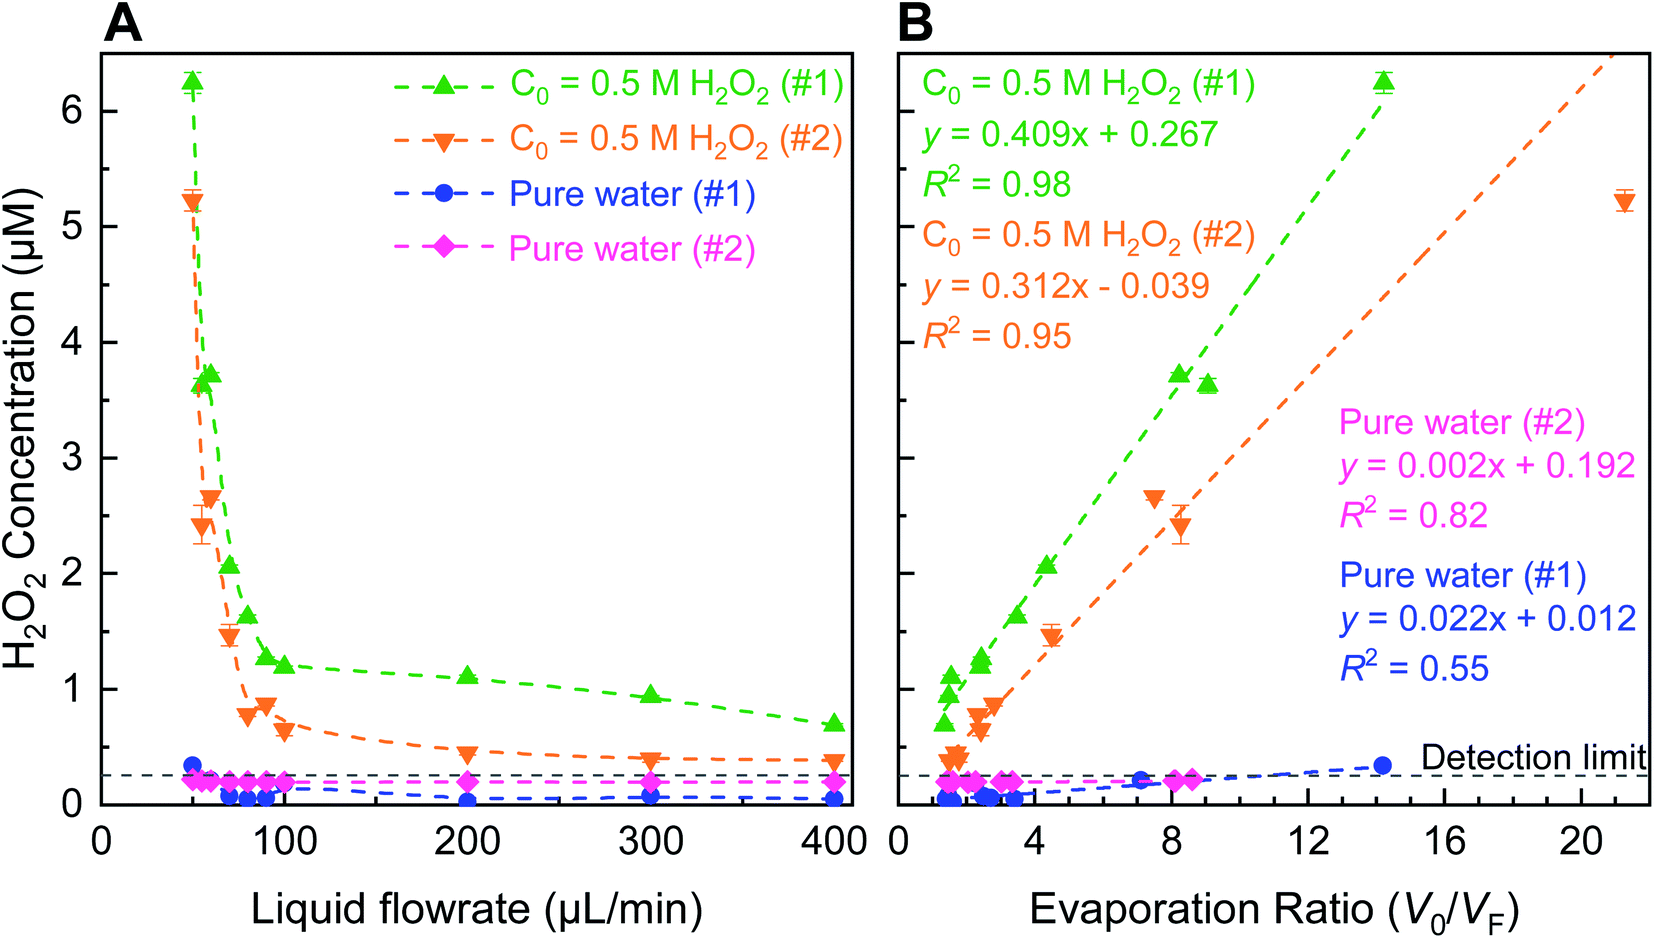 | ||
| Fig. 2 Evaporative concentration in pneumatic sprays formed with ultrapure water (blue and pink) and 0.5 µM H2O2 solutions (green and orange) using a fixed N2 gas flowrate 5.3 L min−1. (A) Sharp rise in the H2O2 concentration of (spiked) 0.5 µM solution when the liquid flow rate was <70 µL min−1; minimal H2O2 production in sprays formed with ultrapure water. (B) Relationships between the final H2O2 concentration and the evaporation ratios. Note: the error bars correspond to the standard deviations in the spectrophotometer readings. All slopes in (B) were statistically greater than zero (p < 0.05; ANOVA test). | ||
(ii) Mechanical vibrations, shock-waves, and cavitation in sprays (Fig. 3): as liquid flows through a capillary, then, depending on the liquid thermophysical properties, flow rate, shearing gas-flow rate, dissolved gases, capillary geometry, etc., shock waves and cavitation events can take place.41–43 Cavitation implosion of bubbles in water can lead to extremely high temperatures and pressures in localized “hot spots”, leading to the production of OH radicals that could yield H2O2.32
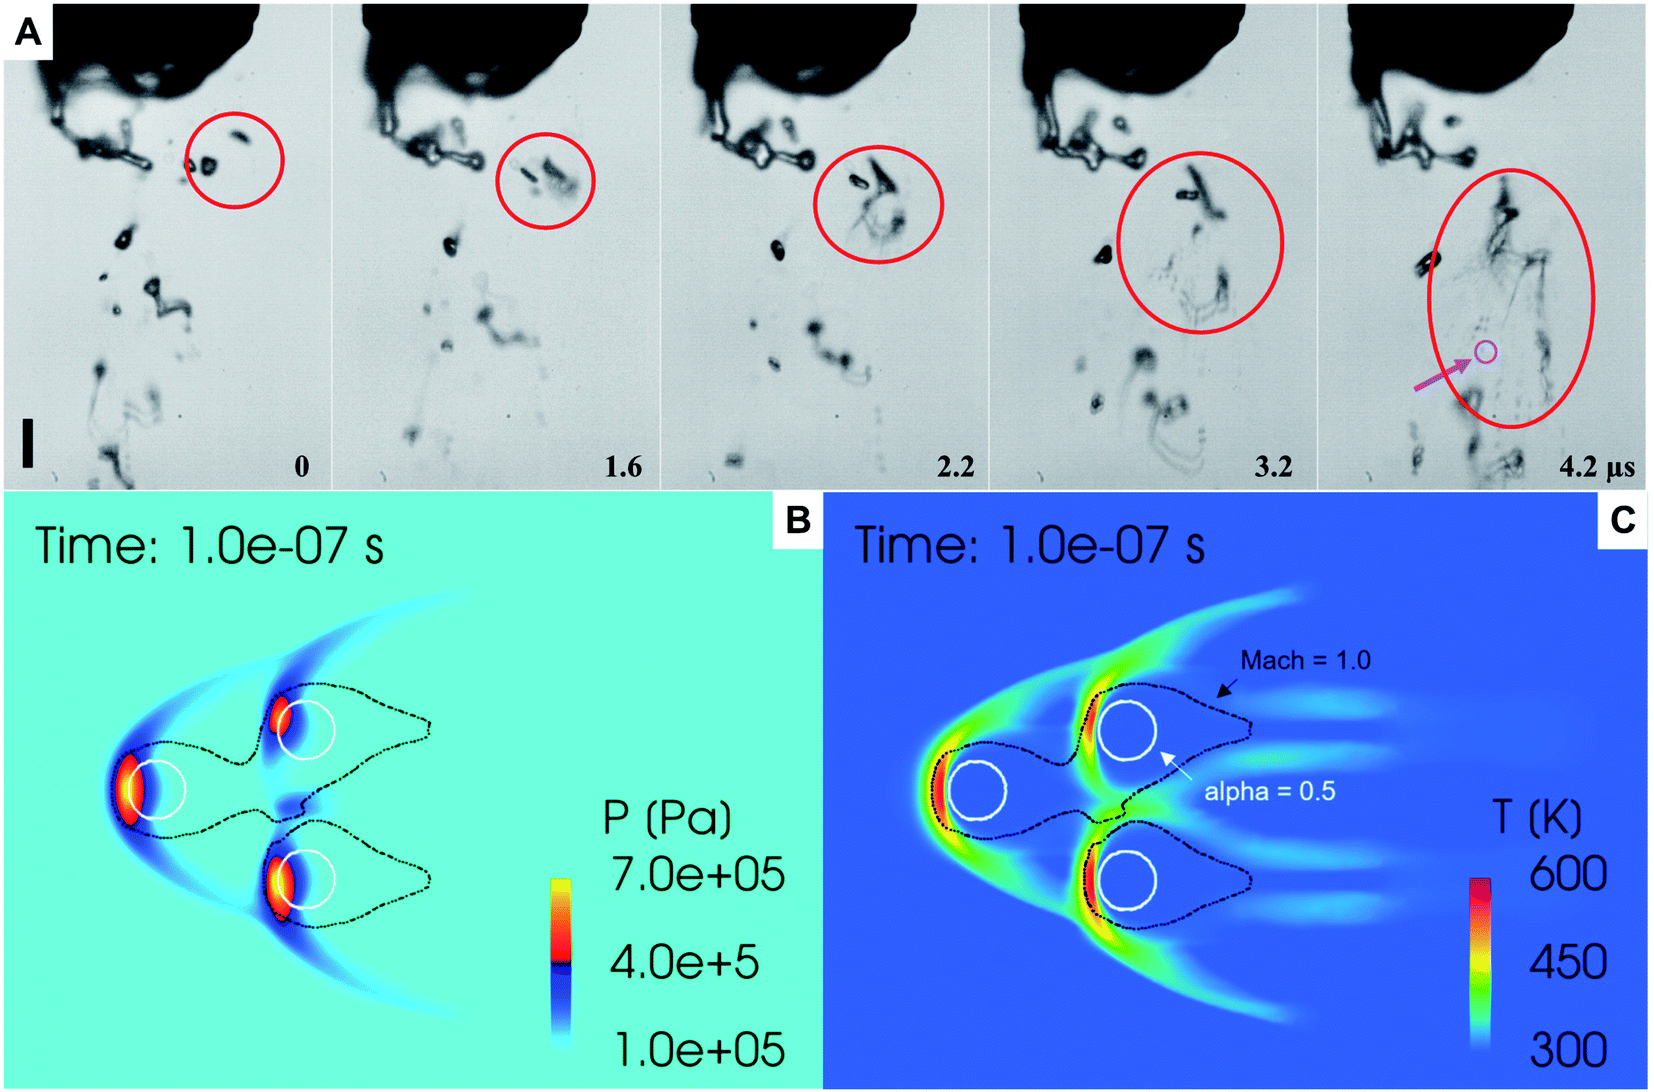 | ||
| Fig. 3 (A) A representative sequence of video images showing interactions between concentric high-speed external nitrogen gas (5.3 L min−1) and a slower inner water jet (100 µL min−1). Red circles indicate a collision and breakup of two droplets upon acceleration by the fast-moving nitrogen gas. Pink arrow shows a droplet of 4 µm diameter. The images are acquired with an ultra-fast camera (Kirana-05M) at 5 million fps using a Leica long-distance microscope. The sequence of frames is shown at times relative to the first frame, t = 0, 1.6, 2.2, 3.2, and 4.2 µs. The scale bar in panel (A) is 50 µm. (B and C) Predicted distributions of pressure and temperature fields from the numerical simulations of high-speed gas-flow around three adjacent droplets of 20 µm diameter. | ||
(iii) Dissolution of airborne ozone in water and its autodissociation (Fig. 4–6): atmospheric/ambient ozone gas could dissolve in water and react to form H2O2.44 N.B. the Henry's law constants for the solubility of ozone and H2O2 in water are, respectively, ∼10−3 M atm−1 and ∼104 M atm−1.45
 | ||
| Fig. 4 Schematics of experimental set-up for conducting spray and condensation experiments inside glovebox with controlled gas composition. Ozone gas is produced outside and diluted with N2 gas and air before its entry inside the glove box, where its concentration is monitored using an ozonometer with a 2 ppb detection limit. On the left-side, we illustrate the spray formation and on the right-side, we illustrate water vapor condensation on hydrophobic substrates. | ||
 | ||
| Fig. 5 H2O2 concentration in water microdroplets formed inside the glovebox via condensation from two humidity sources, (i) ultrasonic humidifier (18–20 °C; RH 70–80%) and (ii) water heated beaker (40 °C; RH ∼ 85%), and via pneumatic sprays of pure water at 1 mL min−1 with 2.3 L min−1 N2 flow rate (18–20 °C; RH 30–60%). As the O3 concentration in the glovebox atmosphere increased, the H2O2 concentration in the microdroplets also increased. The condensation experiments were performed by setting the initial concentration in the gas phase and then stopping all in and out flows, this led to the gradual depletion of ozone from the glovebox; while for the spray was performed by controlling the ozone concentration with manual adjustments in the dilution of ozone by nitrogen gas and clean air (Fig S8†). Horizontal error bars in the sprays represent the range of ozone concentration fluctuation during the time of sample collection. | ||
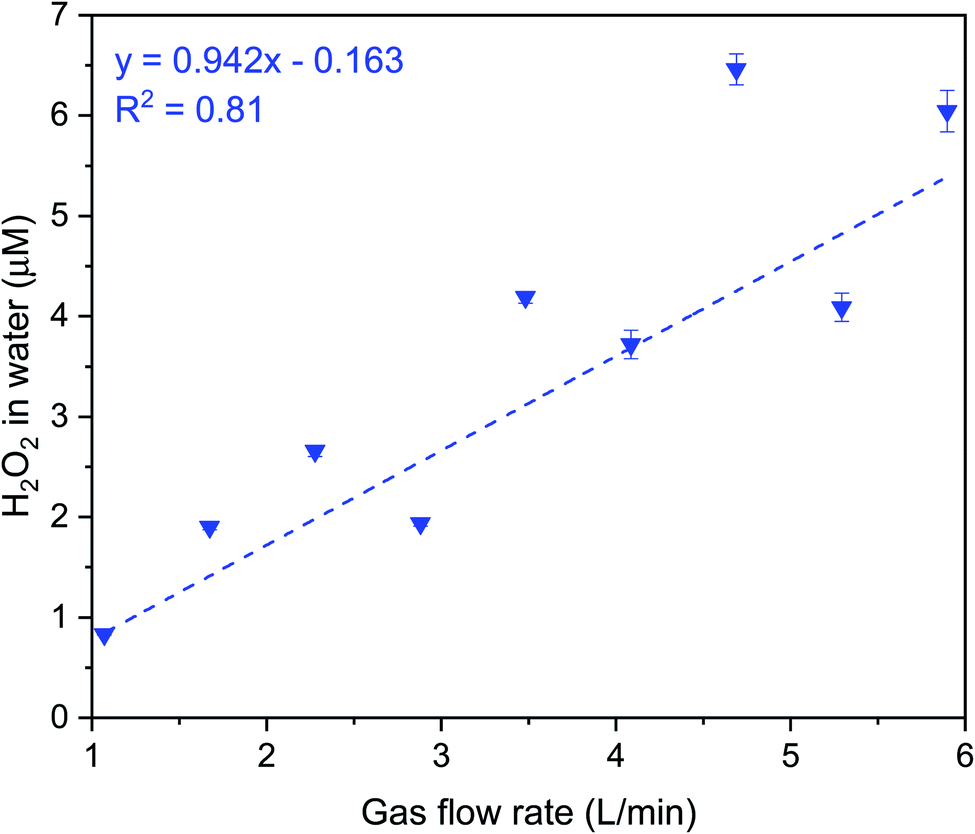 | ||
| Fig. 6 Influence of nitrogen shearing gas flow rates on the formation of H2O2 in water microdroplets produced by pneumatic sprays under ozone atmosphere (100 ± 20 ppb). The liquid flow rate was fixed at 1 mL min−1. | ||
Evaporative concentration
As a solution comprised of water and H2O2 evaporates, for instance, inside a vacuum oven or in the form of sprayed microdroplets, the ratio of the formed vapor (H2O(g)![[thin space (1/6-em)]](https://www.rsc.org/images/entities/char_2009.gif) :H2O2(g)) is not the same as their bulk concentration (H2O(l):H2O2(l)). This is so because water evaporates faster due to its lower boiling point (373 K at 1 atm) than that of H2O2 (423 K at 1 atm).39,40 Here, we define evaporation ratio as the ratio of the initial volume prior to spraying (V0) to the finally collected volume after spraying (VF). A simple evaporation experiment was performed on bulk aqueous solutions containing 4 and 8 µM H2O2 by placing them inside a vacuum oven set at 20 mbar and 293 K for approximately 2 days. These solutions exhibited evaporation ratios of ∼50 and ∼17, respectively, such that the H2O2 concentration increased by ∼12 and ∼7-times, respectively. Next, we quantified evaporation ratios within pneumatic sprays formed via (i) ∼0.5 µM H2O2 solutions and (ii) ultrapure water (Fig. 2). The water flow rate was varied in the range of 50–400 µL min−1 and the nebulizing gas (N2) flow rate was fixed at 5.3 L min−1 (∼8 bar in-line pressure). Our experimental set up's details are presented in Fig. S2, S3 and Table S1;† the influence of the in-line gas pressure and the inner/outer capillary dimensions on the gas flow rates is plotted in Fig. S3A and B;† and the size distributions of sprayed microdroplets, determined via dynamic light scattering (Methods), as a function of gas flow is shown in Fig. S4B.† Under these experimental conditions, when the liquid flow rate was >70 µL min−1, there was hardly any enhancement in the H2O2 concentration. However, as the liquid flow rate was reduced below 70 µL min−1, the H2O2 concentration began to rise exponentially. Remarkably, within the range of 400–50 µL min−1, the H2O2 concentration in the ∼0.5 µM standard solutions increased by 9.1 × (0.7–6.2 µM) and 13.6 × (0.4–5.2 µM), respectively, and the evaporation ratios were 14.2 and 21.3, respectively. Similarly, the H2O2 concentrations in sprays formed with ultrapure water also increased when the liquid flow rate was within the range 400–50 µL min−1: the enhancement factors were 6.6× and 1.1× – both <0.34 µM – while the evaporation ratios were 14.2 and 8.6, respectively. ANOVA tests confirmed that even the slopes of the ultrapure water samples (#1 and #2) were statistically greater than zero (p < 0.05). The average time for sample collection (∼1 mL for analysis) at 50 µL min−1 flow rate was >5 h per datum point due to evaporation rates being almost as high as liquid injection rates; so, we did not pursue investigation of evaporation at lower liquid flow rates. Taken together, these experiments established that while evaporative concentration could enhance the H2O2 concentration in sprayed water microdroplets slightly, this effect is nearly a factor 100× too short to account for the ppm-level (1 ppm = 29.4 µM) H2O2 concentrations noted recently.27
:H2O2(g)) is not the same as their bulk concentration (H2O(l):H2O2(l)). This is so because water evaporates faster due to its lower boiling point (373 K at 1 atm) than that of H2O2 (423 K at 1 atm).39,40 Here, we define evaporation ratio as the ratio of the initial volume prior to spraying (V0) to the finally collected volume after spraying (VF). A simple evaporation experiment was performed on bulk aqueous solutions containing 4 and 8 µM H2O2 by placing them inside a vacuum oven set at 20 mbar and 293 K for approximately 2 days. These solutions exhibited evaporation ratios of ∼50 and ∼17, respectively, such that the H2O2 concentration increased by ∼12 and ∼7-times, respectively. Next, we quantified evaporation ratios within pneumatic sprays formed via (i) ∼0.5 µM H2O2 solutions and (ii) ultrapure water (Fig. 2). The water flow rate was varied in the range of 50–400 µL min−1 and the nebulizing gas (N2) flow rate was fixed at 5.3 L min−1 (∼8 bar in-line pressure). Our experimental set up's details are presented in Fig. S2, S3 and Table S1;† the influence of the in-line gas pressure and the inner/outer capillary dimensions on the gas flow rates is plotted in Fig. S3A and B;† and the size distributions of sprayed microdroplets, determined via dynamic light scattering (Methods), as a function of gas flow is shown in Fig. S4B.† Under these experimental conditions, when the liquid flow rate was >70 µL min−1, there was hardly any enhancement in the H2O2 concentration. However, as the liquid flow rate was reduced below 70 µL min−1, the H2O2 concentration began to rise exponentially. Remarkably, within the range of 400–50 µL min−1, the H2O2 concentration in the ∼0.5 µM standard solutions increased by 9.1 × (0.7–6.2 µM) and 13.6 × (0.4–5.2 µM), respectively, and the evaporation ratios were 14.2 and 21.3, respectively. Similarly, the H2O2 concentrations in sprays formed with ultrapure water also increased when the liquid flow rate was within the range 400–50 µL min−1: the enhancement factors were 6.6× and 1.1× – both <0.34 µM – while the evaporation ratios were 14.2 and 8.6, respectively. ANOVA tests confirmed that even the slopes of the ultrapure water samples (#1 and #2) were statistically greater than zero (p < 0.05). The average time for sample collection (∼1 mL for analysis) at 50 µL min−1 flow rate was >5 h per datum point due to evaporation rates being almost as high as liquid injection rates; so, we did not pursue investigation of evaporation at lower liquid flow rates. Taken together, these experiments established that while evaporative concentration could enhance the H2O2 concentration in sprayed water microdroplets slightly, this effect is nearly a factor 100× too short to account for the ppm-level (1 ppm = 29.4 µM) H2O2 concentrations noted recently.27
Mechanical vibrations and shock waves
We combined experiment and theory to probe the effects of mechanical vibrations on the formation of shock waves during spraying. High-speed videos of pneumatically driven sprays were recorded using a Kirana-05M camera at 5 million frames per second (fps). Its 200 ns time-resolution enabled us to observe microdroplets trajectories before, during, and after their interaction with the shearing gas (Fig. 3A and ESI Movie S1†); their size, number, and velocity were also monitored (Methods). We found that as the slow-moving water droplets got hit by the fast-moving gas, they accelerated and frequently broke into smaller ones (Fig. 3A). We deduced that the speed of the N2 gas to be ∼800 m s−1.Before computational fluid dynamic (CFD) simulations, a theoretical calculation was conducted based on the Rankine–Hugoniot conditions, because from a CFD simulation point of view H2O2 could only be generated by high-temperature reactions (Section S1†). Shock waves could generate high temperatures and pressures. When the high-speed gas hits the water droplet, almost all of the momentum energy is converted to heat. If we assume the heat capacity does not change, then, the temperature rise of the static gas can be estimated as,  where u ∼ 800 m s−1 and cp = 4.2 J g−1 K−1. This yields a ≈ 301 K rise in temperature at the droplet front.
Next, we probed the gas–water interactions via three-dimensional CFD simulations using the converge code, wherein the turbulence is simulated by the renormalization group k–ε model.46 The Eulerian void of fluid (VOF) method47 was adopted to capture the in- and near-nozzle spray details (ESI Section S1, Fig. S5 and S6†). Simulations revealed the formation of bowl-shaped shock waves at the impact point of the droplets that led to an increase in the local temperature (∼327 °C) and pressure (∼7 bar) (Fig. 3B and C). However, these conditions are too mild to produce a chemical transformation; a relatively high concentration of H2O2 was generated only with a temperature over 1000 K and a residence time over 10 µs (Fig. S7†) that are unachievable in our experiments. Thus, this hypothesis cannot explain the formation of H2O2 in sprayed water microdroplets.
Effects of atmospheric ozone on the H2O2 formation in water
Next, we exploited a glovebox to investigate the effects of ozone (O3) gas concentration in the air on the H2O2 formation in water microdroplets (Fig. 4). The O3 concentration in the air was varied in the range 2–4900 ppb and measured using an ozonometer with a 2 ppb detection limit and a range of 2–5000 ppb (Methods). Subsequently, the H2O2 concentration in the water microdroplets was quantified using the HPAK.Below, we discuss the various scenarios in this chronology: (i) condensing the vapor formed using heated water under ∼85% RH (Methods), (ii) condensing water from a commercial ultrasonic humidifier with 15 W output power and RH varying in the range 70–80% (Methods), and (iii) pneumatic sprays formed with a water flow rate of 1 mL min−1 and shearing gas (N2) flow rate of 2.3 L min−1. Single crystal SiO2/Si wafers silanized with perfluorodecyltrichlorosilane (FDTS) using a molecular vapor deposition technique48 were used as substrates. For the condensation experiments, the substrates were cooled down to 3–4 °C. Next, it is crucial to note that the O3(g) concentration in our laboratory during the course of this study was <2 ppb. Thus, the glovebox filled with ambient air served as the control case. In this scenario, the water collected from the pneumatic sprays or the condensates formed via the vapor of hot water (50–70 °C) did not contain H2O2 (Fig. 2 – blue and pink data points and ref. 30. Curiously, when the water vapor was derived from a 15 W commercial ultrasonic humidifier, ∼1 µM H2O2 was detected in the condensate. We have explained its origins in a recent report30 as well as in the introduction above.
O3(g) was produced using an ozone generator and diluted with air (or N2 gas) prior to its entry in the glovebox equipped with an ozonometer (Methods). In the condensation experiments, as the O3(g) and the RH reached the desired levels, the O3(g) supply was terminated (ESI Section S2†). We monitored the time-dependent loss of O3(g) concentration as we waited for 40 minutes to collect adequate condensate volume to be able to perform the HPAK analysis. Fig. 5 (green and red datapoints) presents the final H2O2 concentration in the condensates (from the humidifier and hot water, 40 °C) against the initial O3(g) concentration. Note that these data should not be mistaken to represent thermodynamic equilibrium, which is not achieved in our system. Specifically, a number of factors influence O3(g) depletion, e.g., reactions with and/or adsorption onto the glovebox surface and materials/instruments inside it, reactions with condensed water on the substrates as well as the cold surfaces underneath them, and the leakage from the glovebox. To appreciate this further, we point out that when a metallic heating plate was used to produce water vapor inside the glovebox for condensation experiments, O3(g) depleted rapidly (Fig. S8B†). In comparison, when an ultrasonic humidifier with a plastic surface was utilized, the decay was gradual. This also is the reason for the lower H2O2(aq) concentration in the condensates of heated water in comparison with that of the humidifier (Fig. 5).
To distinguish the O3 consumption by the water from the parasitic losses in the glovebox, we compared the time-dependent depletion of O3(g) with and without water. In this experiment, 120 mL of water was placed inside a shallow container presenting 390 cm2 of the air–water surface area. The O3(g) depletion was faster in the presence of water (Fig. S9†). These experiments and the controls establish unambiguously that (i) water contributes to the O3(g) depletion and (ii) the higher the initial O3(g) concentration, the higher is the formation of H2O2 in the condensates (Fig. 5 – green and red datapoints). We explain in the Discussion section what happens to the depleted O3(g) inside water.
Next, we discuss our spray experiments under controlled O3(g) environment (Fig. 4 (left) and S2†). To offset the dilution of the gas-phase O3(g) due to the shearing gas flow from the sprays (N2, 2.3 L min−1 at NTP), we manually controlled the flow of O3(g) and air via separate lines (ESI Section S2†). Thus, we managed to achieve relatively stable O3(g) concentration (Fig. S8C†) and RH in the range of 30–60%. At the above-listed water and shearing gas flow rates, we were able to collect adequate sample volumes for the HPAK analysis within 5 min. Fig. 5 (blue datapoints) presents the H2O2 concentration in the water collected from the sprays; note-in these experiments, the O3(g) does not deplete with time (Fig. S8C†) unlike the case for the condensation experiments (Fig. S8A and B†). To probe the effects of the sprayed microdroplet size distribution on the formation of H2O2, we varied the shearing gas flowrate keeping the water flow rate fixed under 100 ± 20 ppb O3(g) concentration. The mean droplet diameter decreased non-linearly within the range 105–14 µm as the shearing gas flow was varied from 1–5 L min−1 for 100 µL min−1 liquid flowrate (Fig. S4A and B†). However, the H2O2 concentration increased linearly with nitrogen flowrate (Fig. 6). This indicates that, despite the higher surface, the main reason for the increase in H2O2 concentration with nitrogen flowrate has to do with enhanced mixing between the low-ozone spray region and with the surrounding ozone-containing atmosphere in the glovebox. Some other factors that influence the droplet-O3(g) interactions and the H2O2(aq) formation include, the life-span of the sprayed water droplets, the O3(g) concentration at the droplet surface and its localized depletion/repletion, the droplet surface-area-to-volume ratio, O3 influx into the water, and the O3 and H2O2 outflux from the microdroplets. It should also be realized that the blue datapoints in Fig. 5 and 6 do not ascribe to the liquid–gas thermodynamic equilibrium, which is not uncommon for sprays.
Discussion
Here, we draw together our results to pinpoint the key factors and mechanisms responsible for the H2O2 formation in water microdroplets. First of all, the fact that we do not see the H2O2 formation in water microdroplets, sprayed or condensed, in the absence of O3 proves that this chemical transformation is not a property of the air–water surface (Fig. 2 – blue and pink data points and ref. 30). While the evaporative concentration of trace quantities of H2O2 already present in water is possible, in principle, in sprays, neither is it adequate to explain the ppm-level H2O2 concentration in the previous report27 nor is it relevant to the condensation experiments.28 Similarly, shock waves and temperature rise during pneumatic spraying under our experimental conditions simply cannot contribute to ppm-level H2O2; also, they are irrelevant to condensation-based reports. These experiments, however, facilitate valuable insights into relevant physical and chemical processes that could, under extreme conditions, contribute to the H2O2 concentration/formation in water. For instance, it is worth exploring how those effects could influence gas-phase reactions between O3(g) and H2O(g) followed by the repartitioning of H2O2(g) in the condensed phase.Next, we discuss the scope and significance of our investigation of the H2O2 formation in condensed and sprayed microdroplets under controlled O3(g) environment. These experiments unambiguously pinpoint that the H2O2 formation in water is extremely sensitive to the ambient O3 concentration (Fig. 5 and S8†); if the O3(g) is present, then the enhancement in the air–water surface area combined with higher mixing with the surrounding ozone containing atmosphere leads to higher H2O2 formation (Fig. 6 and S4†). Based on this insight, below, we present an alternative explanation for the H2O2 formation phenomenon reported by researchers based in California, i.e., the original reports.27,28 The Environmental Protection Agency (EPA)49 live database reports that the average O3 concentrations in Santa Clara County in California during the years 2018–2020 were ∼26 ppb with a maximum daily average in the range 48–64 ppb; the highest O3(g) concentrations on some days could even exceed 80 ppb. We submit that this high regional O3(g) is the primary reason behind the H2O2 formation in those reports. Next, we provide some qualitative insights into this chemical transformation.
It is well-known that O3(g) is minimally soluble in water (Henry's law constant, 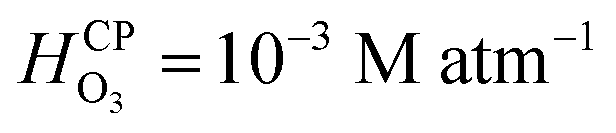 at NTP45) and it would take a much longer time for bulk water to equilibrate with the ambient atmosphere than the duration of our experiments (5–40 min). Thus, water microdroplets in our experiments will have always have an aqueous ozone concentration that is lower than the equilibrium concentration specified by the Henry's law, i.e.,
 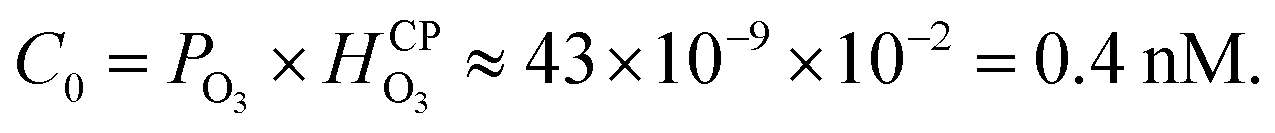 Furthermore, sprays had lower H2O2(aq) concentrations than the condensates because (i) the sample collection for the sprays (∼5 min) was faster than that for the condensates (∼40 min); and (ii) the fast flow of the shearing gas (e.g., N2 gas at 2.3 L min−1) created a N2-rich region around the spray that reduced O3(g) uptake in the microdroplets. Under these circumstances, how could H2O2(aq) concentrations rise to 1–10 µM in sprayed microdroplets, i.e., a factor >2500–25000-X higher than that highest possible O3(aq) concentration (0.4 nM)? Here, the microscale of droplets comes into play: in comparison to bulk water, microdroplets have a dramatically larger surface-to-volume ratio in comparison to the bulk. For instance, if a spherical water droplet of volume 1 mL and diameter D = 1.24 cm is sprayed into microdroplets of diameter d = 10 µm, the surface area increases by a factor of D/d = 1240. This enhancement in the air–water surface area facilitates higher mass transfer of O3(g) into the water within their limited life-span. Next, O3(aq) undergoes chemical transformations in water leading to a variety reactive species such as OH, HO2, HO2−, O−, O2−, OH, and O3− and a stable product, i.e., H2O2.44,50,51 The decomposition of ozone in water is complex, but the following representative reactions provide a qualitative description:
| O3(g) → O3(aq) | (1) |
| O3(aq) + OH−(aq) → HO2−(aq) + O2(aq) | (2) |
| HO2−(aq) + H3O+(aq) → H2O2(aq) + H2O(aq) | (3) |
Since H2O2(aq) is miscible in water ( at NTP), it accumulates in the bulk, i.e., interfacial mass transfer of O3(g) into microdroplets continues to produce H2O2(aq). Next, we note the limitations of this description: kinetics of the reactions (eqn (1)–(3) may not be viable to quantitatively explain the observed H2O2(aq) concentrations within 5–40 min; thus, other reaction pathways of O3 might be implicated.44,50–52 Additionally, discrepancies between the H2O2(aq) concentrations in sprays reported here and those in the original reports27,28 are attributed to the differences in experimental spray setups' dimensions. Minute differences can lead to significantly different gas flowrates (Fig. S3†) and aerodynamic conditions that influence the mass transfer of ozone to the liquid and the formation of H2O2 (Fig. 6, S3 and S4†). Lastly, in the presence of organics in water, such as in the natural and industrial contexts, products of ozone autodissociation participate in numerous reactions and get consumed;53,54 solid surfaces such as silica and perfluorocarbons can also influence the rates of these reactions;44 we also note that ozone generators could produce NOx species that could interfere with reactions.55 An in-depth analysis of these factors as well as the rates of reactions and mechanisms, the mass transfer considerations, and the non-equilibrium effects listed in the Results section is warranted. A microdroplet-level analytical assay with an HPAK-like detection limit, if developed, could help immensely. We close the discussion by noting that this O3–H2O2 coupling inside water has led to misinterpretations in the past also44,53,56 and strategies for curtailing these effects have been devised.37 Furthermore, for a reader interested in simulations of the mass transfer of O3(g) and H2O2(g) at the water surface and subsequent chemistries, we refer to this excellent report.57
Conclusion
In this contribution, we investigated the factors and mechanisms responsible for the formation of H2O2 in water microdroplets produced via spraying or condensation. We found that in the absence of ozone gas, H2O2 does not form regardless of condensation/spraying or the droplet size or the substrate. This unambiguously establishes that the air–water interface does not spontaneously produce H2O2. The H2O2 formation in microdroplets only happens in the presence of O3(g); as the O3(g) concentration increases in the air, the H2O2 concentration also increases in the microdroplets – condensed or sprayed. The higher the gas–liquid surface area, mixing, and contact time, the higher is the O3(g) uptake in the water; this O3(aq) then undergoes chemical transformations yielding H2O2(aq). Through the Environmental Protection Agency (EPA) database,49 we found that the average O3 concentration in California during the years 2018–2020 was ∼26 ppb, with a maximum daily average in the 48–64 ppb range. These facts and our findings therefore present an alternative explanation for the spontaneous formation of H2O2 in water microdroplets (reported from California). The primary role of the air–water interface is to facilitate the mass transfer of ozone into the water. Of course, reactions of O3 with the water surface could be implicated, and they should be probed via surface-specific platforms in conjunction with theory and computation. To sum up, our findings disprove the latest claims for the water surface's ability to spontaneously produce H2O2.27,28 The speculation for the presence of the mysteriously high electric fields at the air–water interface, responsible for transforming H2O into H2O2, thus also appears untenable. H2O2 formed in water microdroplets can also help explain the origins of the recently reported bactericidal properties of pneumatically sprayed water and help assess their practical and environmental relevance.58–60Materials and methods
Chemicals
Standard hydrogen peroxide (H2O2) 30% and high-performance liquid chromatography (HPLC LC-MS) grade water were purchased from VWR Chemicals (Catalogues #270733 and #23622.298). Deionized water produced from a MilliQ Advantage 10 set-up was also used in this study.Quantification of H2O2 in water
Water microdroplets generation via sprays
We built a spray to generate water microdroplets by injecting water through an inner tube of 100 µm of diameter using a syringe pump (PHD Ultra, Harvard Apparatus), and nitrogen coaxial sheath gas through a 430 µm diameter tube, both tubes made of stainless steel. For the concentration by evaporation experiments, HPLC grade water was used, and a glass reactor (a tube of three glass pieces connected with only a small opening for gas release) was connected to the spray to reduce the evaporation while collecting all the sprayed droplets. The water flow rate used varied from 50 to 400 µL min−1, while the nitrogen gas flow rate was set at 5.3 L min−1. For the experiments inside the glovebox, deionized water was injected at a flow rate of 1 mL min−1 and the nitrogen gas flow rate varied from 1.1 to 5.9 L min−1, with most of the experiments set at 2.3 L min−1.Sprayed water microdroplets diameter acquisition
The distribution of microdroplets-size was measured with a Spraytec system (Malvern Instruments). The interaction between the laser beam with the spray produces a diffraction pattern, from which the derived parameter Sauter mean diameter (SMD) was calculated. Our spray was positioned at ∼2 cm from the laser.Substrates for condensation
Silicon wafers (p-doped, <100> orientation, 4″ diameter, thickness of 500 µm and a 2 µm-thick oxide layer) were purchased from Silicon Valley Microelectronics (Catalogue #SV010).Functionalization of SiO2/Si wafers
To make our SiO2/Si wafers hydrophobic, we functionalized them by silanization with perfluorodecyltrichlorosilane (FDTS). Firstly, we removed any organic contaminants and hydroxylated the surface by treating it with oxygen plasma for 2 min. Then by using a molecular vapor deposition process (Applied Microstructures MVD100E), we grafted our silicon wafers with FDTS by applying one of our previous methodologies reported.61Ozone generation and experiments inside the glovebox
A portable isolated glovebox (Cleatech, Catalogue #2200-2-B) was used as a controlled-environment chamber for ozone concentration. An ozone generator (Mainstayae; O3 production rate: 24 g h−1) was placed outside the glovebox inside a bucket with a hole for plastic tubing with an air flow. To control the ozone concentration inside the glove box, this mixture of air and ozone was further mixed with a different channel containing more air and nitrogen, all of them controlled by valves to change the gas flows. A portable ozone meter (GoolRC) with detection range of 2–5000 ppb and detection limit at 2 ppb was positioned inside the glovebox for real time monitoring; its proper functioning required RH <85%. When the ozone concentration was reached, varying from 10 to 4900 ppb, the silicon wafers used as substrates for water microdroplets formation were placed onto an ice–water bag with uniformly distributed temperature at ∼3 °C, which quickly achieved thermal equilibrium, and left for 40 min of condensation time. The temperature on the substrates was checked via a non-contact digital infrared thermometer (Lasergrip 774). In the case of the sprays, the nitrogen gas was already flowing considering its great effect on the ozone concentration inside the glove box, and as soon as the ozone concentration was stabilized, the water injection was started for collection of the microdroplets into a glass funnel inside a beaker during 3–13 min. The relative humidity inside the chamber was kept in the range 70–80% using the ultrasonic humidifier, at ∼85% by heating water and 30–70% when using the spray (a bigger range as the air and nitrogen gas flows were affecting it more). The ambient air temperature was in the 18–20 °C range. To collect the samples, we poured the droplets from the silicon wafers into a clean glassware, and all the samples were transferred into a 15 mL centrifuge tube (VWR International).Water vapor generation via ultrasonic humidifier
An ultrasonic humidifier (Proton PHC 9UH) with 15 W of power was used in this study. This equipment produces mist from water by ultrasonic waves generated from the piezoelectric disk located on its bottom. Deionized water was used and the ultrasonic humidifier was positioned far away from the silicon wafers (∼40 cm apart) to avoid direct mist deposition.Water vapor generation via a heating plate
Deionized water was heated at 40 °C using a heating plate (IKA RCT, Catalogue #3810000). The plate was positioned ∼30 cm apart from the substrates, and the temperature was controlled by the coupled temperature sensor (PT 1000.60), which was in contact with the water.High speed imaging
The rapid interaction between nitrogen gas and water requires observation with an ultra-high-speed video camera (Kirana-05M, Specialized Imaging, Tring UK) acquiring 180 images at capture speeds of up to 5 × 10⁶ fps, with a full resolution of 924 (W) × 768 (H) px irrespective of the frame rate used and magnification with Leica long-distance microscope at magnification up to 29.4. The short- and long-term dynamics of this interaction can be captured using several different frame rates. The framing is synchronized with red diode-lasers with adjustable pulse duration of 50–170 ns per frame to minimize motion smearing. The smallest detectable diameter of the droplets is around 4 µm.Computational methods
Three-dimensional (3D) CFD simulations were performed using the converge code to simulate the sprays. The turbulence was simulated by the renormalization group k–ε model.46 The Eulerian void of fluid (VOF) method47 was adopted to capture the in- and near-nozzle spray details. In this method, the gas and liquid fuel are considered as a single compressible fluid mixture, and the void fraction (αl) is used to represent the volume fraction of liquid. Details of the related models are available in the ref. 62.Funding
HM acknowledges KAUST for funding (grant no. BAS/1/1070-01-01).Data availability
All the data is presented with the article and the ESI.†Author contributions
HM conceived the research plan and oversaw its execution with assistance from collaborators HI and ST. AGJ, NHM, and JP designed and built experimental rigs for sprays; NHM collected experimental data from sprays and humidifiers inside the glovebox; PZ contributed to analytical measurements. AGJ, NHM, and HM analyzed the data. XL and HI performed computational simulation of the spray experiments; ZY and ST conducted ultra-fast imaging of sprays. HM and AGJ wrote the manuscript with assistance from co-authors.Conflicts of interest
There are no conflicts to declare.Acknowledgements
The co-authors thank Mr Heno Hwang, Scientific Illustrator at KAUST, for preparing illustrations in Fig. 1 and 4.References
- R. Wanninkhof, W. E. Asher, D. T. Ho, C. Sweeney and W. R. McGillis, Annu. Rev. Mar. Sci., 2009, 1, 213–244 CrossRef.
- H. R. Pruppacher and J. D. Klett, Microphysics of Clouds and Precipitation, D. Reidel Publishing Company, Holland, 1980 Search PubMed.
- J. H. Seinfeld and S. N. Pandis, Atmospheric Chemistry and Physics: From Air Pollution to Climate Change, Wiley-Interscience, 2nd edn, August 11, 2006, 1998 Search PubMed.
- E. Williams and E. Mareev, Atmos. Res., 2014, 135–136, 208–227 CrossRef.
- J. R. Dwyer and M. A. Uman, Phys. Rep., 2014, 534, 147–241 CrossRef CAS.
- A. V. Shavlov and V. A. Zdzhumandzhi, J. Aerosol Sci., 2016, 91, 54–61 CrossRef CAS.
- S. Enami, H. Mishra, M. R. Hoffmann and A. J. Colussi, J. Chem. Phys., 2012, 136, 154707 CrossRef PubMed.
- H. Mishra, S. Enami, R. J. Nielsen, M. R. Hoffmann, W. A. Goddard and A. J. Colussi, Proc. Natl. Acad. Sci. U. S. A., 2012, 109, 10228–10232 CrossRef CAS PubMed.
- H. Mishra, R. J. Nielsen, S. Enami, M. R. Hoffmann, A. J. Colussi and W. A. Goddard, Int. J. Quantum Chem., 2013, 113, 413–417 CrossRef CAS.
- F. Garcia-Ochoa and E. Gomez, Biotechnol. Adv., 2009, 27, 153–176 CrossRef CAS PubMed.
- L. M. C. Sagis and E. Scholten, Trends Food Sci. Technol., 2014, 37, 59–71 CrossRef CAS.
- A. Gallo Jr, K. Odokonyero, M. A. A. Mousa, J. Reihmer, S. Al-Mashharawi, R. Marasco, E. Manalastas, M. J. L. Morton, D. Daffonchio, M. F. McCabe, M. Tester and H. Mishra, 2021, 1–29, ArXiv:p. 2102.00495 [physics.app-ph].
- G. A. Mahadik, J. F. Hernandez-Sanchez, S. Arunachalam, A. Gallo Jr, L. Cheng, A. S. Farinha, S. T. Thoroddsen, H. Mishra and C. M. Duarte, Sci. Rep., 2020, 10, 7785 CrossRef CAS PubMed.
- M. F. Ruiz-Lopez, J. S. Francisco, M. T. C. Martins-Costa and J. M. Anglada, Nat. Rev. Chem., 2020, 4, 459–475 CrossRef CAS.
- H. Mishra, S. Enami, R. J. Nielsen, L. A. Stewart, M. R. Hoffmann, W. A. Goddard and A. J. Colussi, Proc. Natl. Acad. Sci. U. S. A., 2012, 109, 18679–18683 CrossRef CAS PubMed.
- R. J. Saykally, Nat. Chem., 2013, 5, 82–84 CrossRef CAS PubMed.
- A. Gallo, A. S. F. Farinha, M. Dinis, A.-H. Emwas, A. Santana, R. J. Nielsen, W. A. Goddard and H. Mishra, Chem. Sci., 2019, 10, 2566–2577 RSC.
- A. J. Colussi and S. Enami, Chem. Sci., 2019, 10, 8253–8255 RSC.
- A. Gallo, A. S. F. Farinha, A.-H. Emwas, A. Santana, R. J. Nielsen, W. A. Goddard and H. Mishra, Chem. Sci., 2019, 10, 8256–8261 RSC.
- J. Nauruzbayeva, Z. Sun, A. Gallo, M. Ibrahim, J. C. Santamarina and H. Mishra, Nat. Commun., 2020, 11, 5285 CrossRef CAS.
- Y. Uematsu, D. J. Bonthuis and R. R. Netz, J. Phys. Chem. Lett., 2018, 9, 189–193 CrossRef CAS PubMed.
- S. J. Byrnes, P. L. Geissler and Y. R. Shen, Chem. Phys. Lett., 2011, 516, 115–124 CrossRef CAS.
- N. Agmon, H. J. Bakker, R. K. Campen, R. H. Henchman, P. Pohl, S. Roke, M. Thämer and A. Hassanali, Chem. Rev., 2016, 116, 7642–7672 CrossRef CAS PubMed.
- M. I. Jacobs, R. D. Davis, R. J. Rapf and K. R. Wilson, J. Am. Soc. Mass Spectrom., 2019, 30, 339–343 CrossRef CAS PubMed.
- G. Rovelli, M. I. Jacobs, M. D. Willis, R. J. Rapf, A. M. Prophet and K. R. Wilson, Chem. Sci., 2020, 11, 13026–13043 RSC.
- S. Pullanchery, S. Kulik, B. Rehl, A. Hassanali and S. Roke, Science, 2021, 374, 1366–1370 CrossRef CAS PubMed.
- J. K. Lee, K. L. Walker, H. S. Han, J. Kang, F. B. Prinz, R. M. Waymouth, H. G. Nam and R. N. Zare, Proc. Natl. Acad. Sci. U. S. A., 2019, 116, 19294–19298 CrossRef CAS.
- J. K. Lee, H. S. Han, S. Chaikasetsin, D. P. Marron, R. M. Waymouth, F. B. Prinz and R. N. Zare, Proc. Natl. Acad. Sci. U. S. A., 2020, 117, 30934–30941 CrossRef CAS.
- L. Pauling, General Chemistry, Dover Publications, 1988 Search PubMed.
- N. H. Musskopf, A. Gallo Jr, P. Zhang, J. Petry and H. Mishra, J. Phys. Chem. Lett., 2021, 12, 11422–11429 CrossRef CAS PubMed.
- J. A. Otter, S. Yezli, F. Barbut and T. M. Perl, Decontamination in Hospitals and Healthcare, 2020, pp. 323–369, DOI: DOI:10.1016/B978-0-08-102565-9.00015-7.
- M. Hoffmann, I. Hua and R. Hoechemer, Ultrason. Sonochem., 1996, 3, 168–172 CrossRef.
- P. Riesz, D. Berdahl and C. L. Christman, Environ. Health Perspect., 1985, 64, 233–252 CrossRef CAS PubMed.
- K. S. Suslick, Ultrasound: its chemical, physical, and biological effects, VCH Publishers, 1988 Search PubMed.
- X. Fang, G. Mark and C. von Sonntag, Ultrason. Sonochem., 1996, 3, 57–63 CrossRef CAS.
- G. Kim, Y.-E. K. Lee and R. Kopelman, in Oxidative Stress and Nanotechnology: Methods and Protocols, ed. D. Armstrong and D. J. Bharali, Humana Press, Totowa, NJ, 2013, pp. 101–114, DOI: DOI:10.1007/978-1-62703-475-3_6.
- D. W. Gunz and M. R. Hoffmann, Atmos. Environ., Part A, 1990, 24, 1601–1633 CrossRef.
- Y. S. Veselov, Khim. Tekhnol. Vody, 1991, 13, 5 Search PubMed.
- W. Haynes, CRC Handbook of Chemistry and Physics, CRC Press, 1999 Search PubMed.
- K. V. Titova, V. P. Nikol'skaya, V. V. Buyanov and I. P. Suprun, Russ. J. Appl. Chem., 2002, 75, 1903–1906 CrossRef CAS.
- J. Desantes, R. Payri, F. J. Salvador and J. D. L. Morena, Fuel, 2010, 89, 3033–3041 CrossRef CAS.
- A. Sou, M. Maulana, K. Isozaki, S. Hosokawa and A. Tomiyama, J. Fluid Sci. Technol., 2008, 3, 622–632 CrossRef.
- K.-S. Im, S.-K. Cheong, C. F. Powell, M.-c. D. Lai and J. Wang, Sci. Rep., 2013, 3, 2067 CrossRef PubMed.
- B. Heikes, Atmos. Environ., 1984, 18, 1433–1445 CrossRef CAS.
- M. E. Hassan, M. Janda and Z. Machala, Water, 2021, 13, 182 CrossRef CAS.
- Z. Han and R. D. Reitz, Combust. Sci. Technol., 1995, 106, 267–295 CrossRef CAS.
- C. W. Hirt and B. D. Nichols, J. Comput. Phys., 1981, 39, 201–225 CrossRef.
- S. Pillai, A. Santana, R. Das, B. R. Shrestha, E. Manalastas and H. Mishra, J. Membr. Sci., 2020, 608, 118140 CrossRef CAS.
- USA Environmental Protection Agency (EPA), Daily ozone concentrations in California, 2021 Search PubMed.
- D. Gardoni, A. Vailati and R. Canziani, Ozone: Sci. Eng., 2012, 34, 233–242 CrossRef CAS.
- P. Jiang, H. T. Chen, R. W. Babcock and M. K. Stenstrom, Water Environ. Res., 2009, 81, 57–68 CrossRef CAS PubMed.
- F. J. Beltran, Ozone reaction kinetics for water and wastewater systems, CRC Press, 2003 Search PubMed.
- J. Staehelin and J. Hoigne, Environ. Sci. Technol., 1985, 19, 1206–1213 CrossRef CAS PubMed.
- W. L. Chameides and D. D. Davis, J. Geophys. Res.: Oceans, 1982, 87, 4863–4877 CrossRef CAS.
- D. Yuan, Z. Wang, C. Ding, Y. He, R. Whiddon and K. Cen, J. Phys. D: Appl. Phys., 2016, 49, 455203 CrossRef.
- T. E. Kleindienst, P. B. Shepson, D. N. Hodges, C. M. Nero, R. R. Arnts, P. K. Dasgupta, H. Hwang, G. L. Kok, J. A. Lind, A. L. Lazrus, G. I. Mackay, L. K. Mayne and H. I. Schiff, Environ. Sci. Technol., 1988, 22, 53–61 CrossRef CAS PubMed.
- J. Kruszelnicki, A. M. Lietz and M. J. Kushner, J. Phys. D: Appl. Phys., 2019, 52, 355207 CrossRef CAS.
- M. T. Dulay, J. K. Lee, A. C. Mody, R. Narasimhan, D. M. Monack and R. N. Zare, QRB Discovery, 2020, 1, e3 CrossRef.
- M. T. Dulay, C. A. Huerta-Aguilar, C. F. Chamberlayne, R. N. Zare, A. Davidse and S. Vukovic, QRB Discovery, 2021, 2, e8 CrossRef.
- C. Zhu and J. S. Francisco, Proc. Natl. Acad. Sci., 2019, 116, 19222 CrossRef CAS PubMed.
- B. R. Shrestha, S. Pillai, A. Santana, S. H. Donaldson, T. A. Pascal and H. Mishra, J. Phys. Chem. Lett., 2019, 10, 5530–5535 CrossRef CAS PubMed.
- K. Richards, P. Senecal and E. Pomraning, CONVERGE (v3.0), Convergent Science, Madison, WI, 2020.
Footnotes |
| † Electronic supplementary information (ESI) available. See DOI: 10.1039/d1sc06465g |
| ‡ Equal author contribution. |
| This journal is © The Royal Society of Chemistry 2022 |