Visualization of intercellular cargo transfer using upconverting nanoparticles†
Yeongchang
Goh‡
 a,
Jongwoo
Kim‡
 b,
Hye Sun
Park‡
 c,
Taeyoung
Jung
ab,
Kwan Soo
Hong
 cd,
Sang Hwan
Nam
 *b,
Yung Doug
Suh
 *ef and
Kang Taek
Lee
 *a
*a
aDepartment of Chemistry, Gwangju Institute of Science and Technology (GIST), Gwangju, South Korea. E-mail: ktlee@gist.ac.kr
bLaboratory for Advanced Molecular Probing (LAMP), Korea Research Institute of Chemical Technology (KRICT), Daejeon, South Korea
cResearch Center for Bioconvergence Analysis, Korea Basic Science Institute (KBSI), Cheongju, South Korea
dGraduate School of Analytical Science and Technology (GRAST), Chungnam National University, Daejeon, South Korea
eDepartment of Chemistry, Ulsan National Institute of Science and Technology (UNIST), Ulsan, South Korea
fSchool of Energy and Chemical Engineering, Ulsan National Institute of Science and Technology (UNIST), Ulsan, South Korea
First published on 11th August 2022
Abstract
Cell–cell communication is important for cellular differentiation, organ function, and immune responses. In intercellular communication, the extracellular vesicles (EVs) play a significant role in delivering the cargo molecules such as genes, proteins, and enzymes, to regulate and control the ability of the recipient cells. In this study, the observation of intercellular cargo transfer via dual-colour imaging using upconverting nanoparticles (UCNPs) has been demonstrated. Using this technique, the intercellular transport via contact-dependent and contact-independent signaling in live HeLa cells was clearly visualized with real-time, long-term single-vesicle tracking. Furthermore, it was demonstrated that the endocytosed UCNPs can be transmitted with the encapsulation of EVs labelled with fluorescent proteins.
Introduction
Cell–cell communication is crucial for cell development, tissue interactions, and immune response.1 The intercellular communication with the transmission of biochemical signals can be contact-dependent through cell surface molecules or contact-independent through the secretion of extracellular vesicles (EVs), which are cell-derived membrane vesicles released from cells.2–4 Intercellular communication via secreted EVs has been firmly established for more than two decades, emphasizing the importance of functional cargos, formed as proteins and nucleic acids transferred from one cell to another in physiological and pathological processes.4–6To understand cell–cell communication via EVs, the visualization of EVs using fluorescence microscopy has been intensively investigated. The internalization and trafficking of exosomes were demonstrated using lipophilic fluorescent dye using real-time fluorescence microscopy.7 The exchange and uptake of EVs between different types of cells were visualized using multiplexed live-cell imaging based on palmitoylated fluorescent proteins.8 The endocytosis of EVs and release of their cargo were identified through the expression of fluorescent proteins using correlative light and electron microscopy.3
However, fluorescent proteins and/or organic fluorophores undergo photobleaching, which restricts the imaging time. Therefore, tracking cargo mediated by EVs in recipient cells based on the labelling of fluorescent proteins on EV membrane proteins, such as CD63, remains challenging. As a bioimaging probe, upconverting nanoparticles (UCNPs) have been widely employed because of their various advantages, including high photostability without photobleaching or photoblinking that facilitates long-term tracking, uniform size and intensity, low cytotoxicity owing to near-infrared (NIR) excitation, no autofluorescence because of large anti-Stokes shift, and multiplexed emission with different activator doping under a single light source.9–18 UCNPs functionalized with poly(ethylene glycol) (PEG), which are photostable for tens of hours,19 can be internalized into a cell through endocytosis and moved in a vesicle as a cargo along the microtubule by motor proteins.13 Additionally, the cellular interaction of the PEGylated UCNPs, including endocytosis, intracellular transport, and exocytosis was reported in living HeLa cells.14 Therefore, it can be hypothesized that the PEGylated UCNPs exocytosed from cells have the form of EVs, in particular exosomes.
In this study, the intercellular cargo transfer between HeLa cells was visualized using multiplexed live-cell imaging based on PEGylated UCNPs as cargos. The approach of two cells followed by cell adhesion and contact-dependent cargo transfer between the cells was observed using single-particle tracking (SPT). It was demonstrated that the endocytosed UCNPs can be transmitted in the form of EV with fluorescent labelling of the EV membrane, and their membrane moves with the cargo rather than fusing with the plasma membrane in the recipient cell. This technique is a powerful tool for tracking cargo in live cells to monitor intercellular communication.
Results and discussion
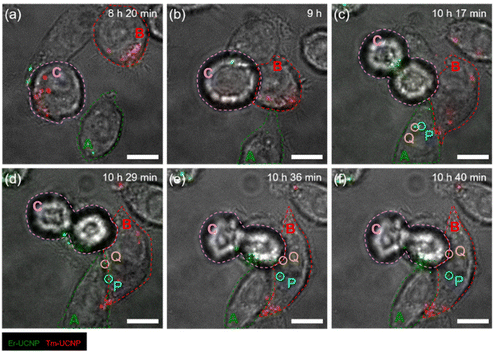
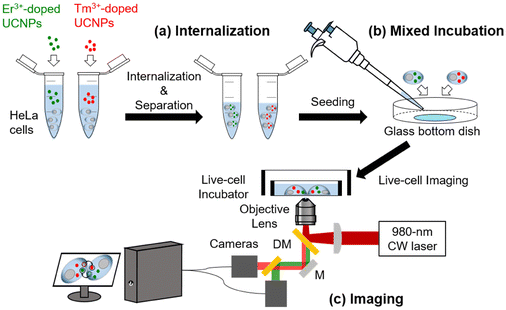
Fig. 1 shows a schematic of intercellular particle transfer in live cells using UCNPs. The sizes of the synthesized Er3+-doped UCNPs and Tm3+-doped UCNPs were 26 and 27 nm, respectively (Fig. S1a and S1b†). The PEGylated Er3+-doped UCNPs (Er-UCNPs) and PEGylated Tm3+-doped UCNPs (Tm-UCNPs) showed well-dispersion stability (Fig. S2a and S2d†). The hydrodynamic diameter of Er-UCNPs and Tm-UCNPs were 40.2 nm and 36.7 nm, respectively (Fig. S2b and S2e†). Er-UCNPs and Tm-UCNPs were found to be have negative surface charges (Fig. S2c and S2f†). Er-UCNPs and Tm-UCNPs were excited by a single 980 nm laser, and their different emission bands, 650 nm for Er-UCNPs and 800 nm for Tm-UCNPs (Fig. S1c†), were separated using the imaging system. Er-UCNPs and Tm-UCNPs were internalized into two groups of HeLa cells, respectively (Fig. 1a). Subsequently, the Er-UCNP-incubated cells and Tm-UCNP-incubated cells were mixed and cultured (Fig. 1b). It is advantageous to introduce UCNPs without photobleaching or photoblinking for live-cell imaging, which facilitates the real-time monitoring of intercellular material transport in live cells for up to several tens of hours,13–16,20–22 much longer than that of organic fluorophores7,23 or fluorescent proteins.8 The material transport between cells was observed via a home-built dual-colour imaging system (Fig. 1c and S3†), which enables long-term particle tracking and transfer between live cells using a single 980 nm laser and monitoring of cell migration. Approximately 6 h after the mixed incubation, most cells contained one type of internalized UCNPs, and no cells containing both Er-UCNPs and Tm-UCNPs were detected (Fig. S4a†), while some cells contained both Er-UCNPs and Tm-UCNPs after approximately 12 h after the mixed incubation (Fig. S4b†). This indicates that the UCNPs internalized in the original cells moved to other cells.Based on this observation, the imaging and tracking of UCNPs was performed between 6 and 12 h after the mixed incubation (Fig. 2). Photoluminescence (PL) images of the two types of UCNPs were obtained every second, and bright-field images were obtained every 10 min. The transfer of UCNPs between two HeLa cells from 10 h 20 min to 10 h 40 min post-mixed-incubation is shown in Video S1.† Before the UCNP transfer, only one type of UCNPs was found in individual cells, and two cells, Cell A internalized by Er-UCNPs and Cell B internalized by Tm-UCNPs, were far from each other at 8 h post-mixed-incubation (Fig. 2a). Cells A and B gradually came closer (Fig. S5†), which may be attributed to cell migration through chemotaxis,24 probably because they move along the concentration gradient of EVs secreted by the counterparts.25–27 The two cells started to establish cell–cell junctions (Fig. 2b) and then formed stable interfaces after 1 h (Fig. 2c). Two Er-UCNPs (particles P and Q) in Cell A moved to the cell boundary (Fig. 2d) after 12 min from the cell adhesion. Approximately 6 min later, particles P and Q that crossed the boundary moved to Cell B (Fig. 2e and f). Additionally, cell division was observed in Cell C during the continuous illumination of a 980 nm laser (Fig. 2). This indicates that the irradiation with the laser at several kW cm−2 of the live cells was not phototoxic, which is consistent with the previous reports.13,20,21 Furthermore, the vesicles containing Tm-UCNPs in Cell B moved near Cell A (Fig. 2). Material transfer from Cell A to Cell B strongly suggests juxtacrine signalling of contact-dependent cell–cell communication to pass signalling cargos directly between cells.1
 | ||
| Fig. 2 Cell migration and material transfer via cell–cell communication in living HeLa cells. Images of Er-UCNPs, Tm-UCNPs, and bright-field are overlaid. Cells A and B are originally incubated by Er-UCNPs and Tm-UCNPs, respectively. Cell C shows cell division, indicating very low phototoxicity during continuous irradiation. Particle P (blue circle) and particle Q (yellow circle) show that the Er-UCNPs were originally in Cell A and transferred to Cell B. Photoluminescence (PL) images of UCNPs were taken every second, and the bright-field images were taken every 10 min. Timestamps represent the time after the mixed incubation. Scale bars represent 10 μm. Video from 10 h 20 min to 10 h 40 min is also available in Video S1.† | ||
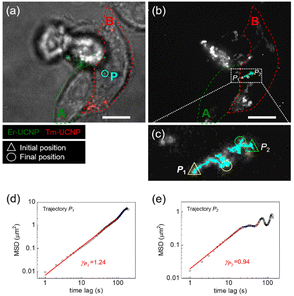
To confirm whether the transferred Er-UCNPs were in the recipient cell (Cell B) in Fig. 2, SPT and mean-square displacement (MSD) analysis were used (Fig. 3).12,28–31 The MSD plot is described by the following equation:
 | (1) |
| MSD(t) = 4Dtγ | (2) |
 | ||
| Fig. 3 Single-particle tracking (SPT) analysis of the transferred UCNPs in living HeLa cells. (a) Snapshot image at 10 h 40 min after mixed incubation in Fig. 2. Boundaries of Cells A (containing Er-UCNPs) and B (containing Tm-UCNPs) are indicated by red and green dashed lines, respectively. (b) Projection image of UCNPs is shown in the video from 10 h 30 min to 10 h 40 min post-mixed-incubation. (c) Magnified image of the white box in (b). Trajectories of UCNPs are separated into two: P1 and P2. (d and e) mean-square displacement (MSD) plots and their exponent values of Trajectories P1 and P2 as 1.24 and 0.94, which indicate active transport and sub-diffusion, respectively. Scale bars represent 10 μm. | ||
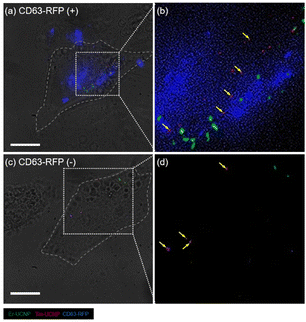
To assess whether the UCNP cargos are transferred to the recipient cell with the surface protein of EVs in contact-independent cell–cell communications, the HeLa cells had been transduced with a lentivirus vector encoding, red fluorescent protein (RFP) conjugated with CD63, a tetraspanin highly enriched in the intraluminal vesicles and EVs.32Fig. 4 shows the z-projection of three-dimensional images of a CD63-RFP-expressing HeLa cell (Fig. 4a and b) initially incubated with Tm-UCNPs and a wild-type HeLa cell (Fig. 4c and d) initially incubated with Er-UCNPs at 24 h after mixed incubation of the two groups of HeLa cells, obtained via super-resolution radial fluctuation (SRRF).33 The fluorescence of RFP was distributed in the CD63-RFP-expressing HeLa cell (Fig. 4a), indicating that the RFP was successfully expressed in HeLa cells. The co-localization of Tm-UCNPs and RFP in the CD63-RFP-expressing cell (Fig. 4b) reveals that the existing Tm-UCNPs were internalized in intraluminal vesicles or that the Tm-UCNPs were endocytosed while being internalized in EVs from other CD63-RFP-expressing HeLa cells. Additionally, Er-UCNPs were evident in the CD63-RFP-expressing HeLa cell (Fig. 4b), suggesting the internalization of the cargo from the wild-type HeLa cells via paracrine signalling, which is a type of cell–cell communication without cell–cell contact.1 In the wild-type HeLa cells (Fig. 4c and d), the RFP fluorescence indicates that EVs exocytosed from CD63-RFP-expressing HeLa cells were not fused with the plasma membrane or endosome membrane of the recipient cell, which is consistent with the EV internalization via endocytosis and the suppressed release of EV contents due to the neutralization of endosomal pH and accumulation of cholesterol in endosomes.3 Furthermore, Tm-UCNPs co-localized with CD63-RFPs were observed in the wild-type HeLa cells (Fig. 4c), indicating that the cargos exocytosed from a CD63-RFP-expressing HeLa cell and transferred to the wild-type HeLa cell were encapsulated by the EVs.
Conclusions
In this study, a method for real-time monitoring based on the dual-colour imaging of PEGylated UCNPs as cargos was proposed to visualize intercellular communication. Using this technique, the transport of intercellular materials was monitored for several hours through SPT in live cells, without chemical- or phototoxicity. It was demonstrated that cargo transport between live cells that occurred in contact or at long distances could be tracked at the level of a single vesicle. Additionally, it was confirmed that the membrane and cargo of EVs could be distinguished through the fluorescence imaging of the membrane proteins of EVs and PL imaging of UCNPs.This technique, combined with fluorescence imaging will help elucidate the fundamental roles of cells and their functions within their communities. Additionally, nanoparticle-containing EVs can contribute to fundamental studies of EVs, such as the quantitative analysis of EVs depending on the cell type, and environment using PL emitted from UCNPs as their cargo. Furthermore, this technique is expected to not only strengthen the understanding of biochemical events behind intercellular interaction, but also to provide an opportunity for developing next-generation cell-based therapeutics.
Materials and methods
Synthesis of UCNPs
UCNPs of β-NaYF4:20 mol% Yb3+,2 mol% Er3+ were synthesized according to previously reported methods.34 Yttrium acetate hydrate (0.312 mmol), ytterbium acetate hydrate (0.08 mmol), erbium acetate hydrate (0.008 mmol) were dissolved in deionized water. The solution was added to a mixture of 3 mL of oleic acid (OA) and 7 mL of 1-octadecene (1-ODE) in a 50 mL two-neck round-bottom flask and heated to 150 °C with stirring for 30 min. After cooling, 1.6 mmol of ammonium fluoride and 1 mmol of sodium hydroxide dissolved in methanol were added to the flask and heated to 50 °C with stirring for 30 min. The solution was heated to 100 °C under vacuum with stirring for 30 min to remove any residual solvent. Subsequently, the solution was heated to 290 °C and maintained at 290 °C under argon for 2 h. After cooling, the UCNPs were precipitated through the addition of ethanol. After centrifugation, the nanoparticles were dispersed in hexane. In the case of β-NaYF4:20 mol% Yb3+,1 mol% Tm3+ UCNPs, 0.316 mmol of yttrium acetate hydrate, 0.08 mmol of ytterbium acetate hydrate, and 0.004 mmol of thulium acetate hydrate were used instead.PEGylation of UCNPs and their characterization
UCNPs encapsulated in PEG-phospholipids were synthesized as previously reported. The UCNPs (2 mg) in chloroform were slowly added to an aqueous solution of 1,2-dipalmitoyl-sn-glycero-3-phosphoethanolamine-N-[methoxy(polyethylene glycol)-2000] (mPEG; Nanocs, Inc.) during tip sonication (Branson Sonifier, USA) for 3 min, and the emulsion mixture was vigorously vortexed and stirred for 2 h. After evaporating the solvent, UCNPs were purified via centrifugation and dispersed in deionized water. The PEGylated UCNPs were characterized by high-resolution transmission electron microscopy (HR-TEM; JEM-1400 Plus, JEOL, Japan). Their particle size distribution and surface zeta potential were analysed using a particle size analyser (NanoZS, Malvern Instruments LTD, UK).Internalization of UCNPs into HeLa cells
HeLa cells were cultured in Dulbecco's modified Eagle's medium (DMEM) with 10% heat-inactivated fetal bovine serum and 1% penicillin–streptomycin at 37 °C in a 5% CO2 incubator. HeLa cells were seeded in a T25 culture flask and cultured for 2 d. HeLa cells were then detached using trypsin ethylenediaminetetraacetic acid (EDTA) at a cell density of 105 cells per mL. PEGylated Er- and Tm-UCNPs (5 mg mL−1, 20 μL) were separately injected into the culture medium and incubated for 30 min. After incubation, UCNPs that were not internalized into the cells but dispersed in the culture medium were removed via centrifugation. After mixing the two types of HeLa cells containing each type of UCNPs, the mixed HeLa cells were seeded on a 25Φ glass-bottom dish and incubated for 6 h in a cell incubator.Observation of intercellular material transport using dual-colour imaging
HeLa cells were placed on an inverted microscope (IX71, Olympus) equipped with a live-cell incubator (Chamlide TC, Live Cell Instrument). The sample was excited by a 980 nm laser diode (AC1401-0600-0980-SM, Gooch & Housego) for PL imaging. To collect the emission from Er-UCNPs and Tm-UCNPs separately, bandpass filters (FF01-660/13, Semrock for Er-UCNPs; F1 in Fig. S3† and FF01-800/12, Semrock for Tm-UCNPs; F2 in Fig. S3†) were used. For dividing the dual-colour emission, a 785 nm long-pass dichroic beamsplitter (LPD02-785RU, Semrock) was used. Images were captured using two electron-multiplying charge-coupled device (EMCCD) cameras (DU-888E-C00-#BV, Andor for Er-UCNPs; DU-888D-C00-#EX, Andor for Tm-UCNPs). PL images of UCNPs were obtained every second, and bright-field images of HeLa cells were obtained every 10 min.Expression of RFP in HeLa cells
HeLa cells were seeded in a 6-well plate (SPL) for 24 h at a concentration of 5 × 10⁵ cells per mL. RFP was transfected with HeLa cells and fused to CD63 tetraspanin using a lentivirus vector (pCT-CD63-RFP, System Biosciences) with a transfection reagent (Lipofectamine 3000 Transfection Reagent, ThermoFisher Scientific). After 48 h of incubation, CD63-RFP-expressing HeLa cells with Tm-UCNPs and wild-type HeLa cells with Er-UCNPs were mixed on a glass-bottom dish. After 24 h of mixing, the sample was fixed with a 5% paraformaldehyde solution.SRRF imaging
SRRF imaging was performed at a high spatial resolution of 50 to 150 nm. A single SRRF image was reconstructed with each 100 identical UCNPs and RFP images using the SRRF microscopy software (Oxford Inc.). Scanning through the z-axis was controlled using a piezo objective scanner for a three-dimensional (3-D) SRRF. The sample was scanned with at a depth of 500 nm along the z-axis, with a total scanning range of 17![[thin space (1/6-em)]](https://www.rsc.org/images/entities/char_2009.gif) 500 nm. The acquisition time for the 3-D SRRF image was approximately 1 s. The 3-D scanning was performed using the 3-D piezo objective scanner with a home-made LabVIEW software. For the dual-colour imaging of Er-UCNPs and Tm-UCNPs, two filters, 600/50 bandpass filter (ET600/50, Chroma Technology) and 811/80 bandpass filter (ET811/80, Chroma Technology), were used, respectively (Fig. S3†). The analysis of the co-localization of the UCNPs and RFP was performed using the ImageJ software.
500 nm. The acquisition time for the 3-D SRRF image was approximately 1 s. The 3-D scanning was performed using the 3-D piezo objective scanner with a home-made LabVIEW software. For the dual-colour imaging of Er-UCNPs and Tm-UCNPs, two filters, 600/50 bandpass filter (ET600/50, Chroma Technology) and 811/80 bandpass filter (ET811/80, Chroma Technology), were used, respectively (Fig. S3†). The analysis of the co-localization of the UCNPs and RFP was performed using the ImageJ software.
Conflicts of interest
There are no conflicts to declare.Acknowledgements
K. T. L. acknowledges support from the National Research Foundation of Korea (NRF) grant funded by the Ministry of Science and ICT (2021R1A2C2010557) and support by GIST Research Institute (GRI) grant funded by the GIST in 2022. Y. D. S. and S. H. N. acknowledges support by the Global Research Laboratory (GRL) program through the National Research Foundation of Korea (NRF) funded by the Korea Government (MSIT) (2016911815), and KRICT (KK2261-12). K. S. H. and H. S. P acknowledges support from the National Research Foundation of Korea (NRF) grant funded by the Korea Government (MIST) (2020R1A2C2012011) and a grant from KBSI (C210400).References
- E. Armingol, A. Officer, O. Harismendy and N. E. Lewis, Nat. Rev. Genet., 2021, 22, 71–88 CrossRef CAS PubMed.
- T. J. Bechtel, T. Reyes-Robles, O. O. Fadeyi and R. C. Oslund, Nat. Chem. Biol., 2021, 17, 641–652 CrossRef CAS PubMed.
- B. S. Joshi, M. A. de Beer, B. N. G. Giepmans and I. S. Zuhorn, ACS Nano, 2020, 14, 4444–4455 CrossRef CAS PubMed.
- R. C. Paolicelli, G. Bergamini and L. Rajendran, Neuroscience, 2019, 405, 148–157 CrossRef CAS PubMed.
- D. S. Chulpanova, K. V. Kitaeva, V. James, A. A. Rizvanov and V. V. Solovyeva, Front. Immunol., 2018, 9, 1534 CrossRef PubMed.
- M. Tkach and C. Théry, Cell, 2016, 164, 1226–1232 CrossRef CAS PubMed.
- T. Tian, Y.-L. Zhu, F.-H. Hu, Y.-Y. Wang, N.-P. Huang and Z.-D. Xiao, J. Cell. Physiol., 2013, 228, 1487–1495 CrossRef CAS PubMed.
- C. P. Lai, E. Y. Kim, C. E. Badr, R. Weissleder, T. R. Mempel, B. A. Tannous and X. O. Breakefield, Nat. Commun., 2015, 6, 7029 CrossRef CAS PubMed.
- H. S. Park, J. Kim, M. Y. Cho, Y. J. Cho, Y. D. Suh, S. H. Nam and K. S. Hong, ACS Appl. Mater. Interfaces, 2020, 12, 49362–49370 CrossRef CAS PubMed.
- A. H. All, X. Zeng, D. B. L. Teh, Z. Yi, A. Prasad, T. Ishizuka, N. Thakor, Y. Hiromu and X. Liu, Adv. Mater., 2019, 31, 1803474 CrossRef CAS PubMed.
- X. Zeng, S. Chen, A. Weitemier, S. Han, A. Blasiak, A. Prasad, K. Zheng, Z. Yi, B. Luo, I.-H. Yang, N. Thakor, C. Chai, K.-L. Lim, T. J. McHugh, A. H. All and X. Liu, Angew. Chem., Int. Ed., 2019, 58, 9262–9268 CrossRef CAS PubMed.
- F. Wang, S. Wen, H. He, B. Wang, Z. Zhou, O. Shimoni and D. Jin, Light: Sci. Appl., 2018, 7, 18007 CrossRef CAS PubMed.
- S. H. Nam, Y. M. Bae, Y. I. Park, J. H. Kim, H. M. Kim, J. S. Choi, K. T. Lee, T. Hyeon and Y. D. Suh, Angew. Chem., Int. Ed., 2011, 50, 6093–6097 CrossRef CAS PubMed.
- Y. M. Bae, Y. I. Park, S. H. Nam, J. H. Kim, K. Lee, H. M. Kim, B. Yoo, J. S. Choi, K. T. Lee, T. Hyeon and Y. D. Suh, Biomaterials, 2012, 33, 9080–9086 CrossRef CAS PubMed.
- G. Chen, H. Qiu, P. N. Prasad and X. Chen, Chem. Rev., 2014, 114, 5161–5214 CrossRef CAS PubMed.
- Y. I. Park, K. T. Lee, Y. D. Suh and T. Hyeon, Chem. Soc. Rev., 2015, 44, 1302–1317 RSC.
- A. Gnach, T. Lipinski, A. Bednarkiewicz, J. Rybka and J. A. Capobianco, Chem. Soc. Rev., 2015, 44, 1561–1584 RSC.
- G. Huang, Y. Zhu, S. Wen, H. Mei, Y. Liu, D. Wang, M. Maddahfar, Q. P. Su, G. Lin, Y. Chen and D. Jin, Nano Lett., 2022, 22, 3761–3769 CrossRef CAS PubMed.
- J.-C. Boyer, M.-P. Manseau, J. I. Murray and F. C. van Veggel, Langmuir, 2010, 26, 1157–1164 CrossRef CAS PubMed.
- Y. Goh, Y. H. Song, G. Lee, H. Bae, M. K. Mahata and K. T. Lee, Phys. Chem. Chem. Phys., 2018, 20, 11359–11368 RSC.
- H. L. Jo, Y. H. Song, J. Park, E. J. Jo, Y. Goh, K. Shin, M. G. Kim and K. T. Lee, Nanoscale, 2015, 7, 19397–19402 RSC.
- Y. I. Park, H. M. Kim, J. H. Kim, K. C. Moon, B. Yoo, K. T. Lee, N. Lee, Y. Choi, W. Park, D. Ling, K. Na, W. K. Moon, S. H. Choi, H. S. Park, S.-Y. Yoon, Y. D. Suh, S. H. Lee and T. Hyeon, Adv. Mater., 2012, 24, 5755–5761 CrossRef CAS PubMed.
- A. M. Booth, Y. Fang, J. K. Fallon, J.-M. Yang, J. E. K. Hildreth and S. J. Gould, J. Cell Biol., 2006, 172, 923–935 CrossRef CAS PubMed.
- D. Dormann and C. J. Weijer, Curr. Opin. Genet. Dev., 2003, 13, 358–364 CrossRef CAS PubMed.
- A. Lo Cicero, P. D. Stahl and G. Raposo, Curr. Opin. Cell Biol., 2015, 35, 69–77 CrossRef CAS PubMed.
- M. Simons and G. Raposo, Curr. Opin. Cell Biol., 2009, 21, 575–581 CrossRef CAS PubMed.
- M. A. Garcia, W. J. Nelson and N. Chavez, Cold Spring Harbor Perspect. Biol., 2018, 10, a029181 CrossRef PubMed.
- M. J. Saxton, Biophys. J., 1997, 72, 1744–1753 CrossRef CAS PubMed.
- M. J. Saxton, Nat. Methods, 2008, 5, 671–672 CrossRef CAS PubMed.
- X. Michalet, Phys. Rev. E: Stat., Nonlinear, Soft Matter Phys., 2010, 82, 041914 CrossRef PubMed.
- C. Manzo and M. F. Garcia-Parajo, Rep. Prog. Phys., 2015, 78, 124601 CrossRef PubMed.
- C. Théry, et al. , J. Extracell. Vesicles, 2018, 7, 1535750 CrossRef PubMed.
- S. Culley, K. L. Tosheva, P. Matos Pereira and R. Henriques, Int. J. Biochem. Cell Biol., 2018, 101, 74–79 CrossRef CAS PubMed.
- F. Wang, R. Deng and X. Liu, Nat. Protoc., 2014, 9, 1634–1644 CrossRef CAS PubMed.
Footnotes |
| † Electronic supplementary information (ESI) available: Supplementary Fig. S1–S5. See DOI: https://doi.org/10.1039/d2nr01999j |
| ‡ These authors contributed equally. |
| This journal is © The Royal Society of Chemistry 2022 |


