
 Open Access Article
 This Open Access Article is licensed under a
 Creative Commons Attribution 3.0 Unported Licence
Phosphorus-modified Pt@Cu surfaces for efficient electrocatalysis of hydrogen evolution†
Yeshu
Tan
a,
Longxiang
Liu
a,
Liquan
Zhang
a,
Siyu
Zhao
b,
Dan J. L.
Brett
 b,
Paul R.
Shearing
b,
Ying
Bai
c,
Ivan P.
Parkin
*a and
Guanjie
He
*ab
b,
Paul R.
Shearing
b,
Ying
Bai
c,
Ivan P.
Parkin
*a and
Guanjie
He
*ab
aChristopher Ingold Laboratory, Department of Chemistry, University College London, 20 Gordon Street, London WC1H 0AJ, UK. E-mail: g.he@ucl.ac.uk; i.p.parkin@ucl.ac.uk
bElectrochemical Innovation Laboratory, Department of Chemical Engineering, University College London, London WC1E 7JE, UK
cSchool of Physics & Electronics, Henan University, Kaifeng 475004, P. R. China
First published on 8th August 2022
Abstract
Robust and efficient platinum (Pt)-based electrocatalysts are pursued for hydrogen evolution reaction (HER). However, the performance of Pt-based HER electrocatalysts needs to be further improved in alkaline and neutral media due to the extra water dissociation step. Moreover, the fabrication process and long-term stability of current Pt-based HER electrocatalysts are unsatisfactory in mild media. Herein, a one-step facile process was developed to fabricate a phosphorus-modified Pt@Cu (Pt/P@Cu) electrocatalyst to realize the feasibility of high-performance HER in neutral media. The HER performance of Pt/P@Cu is further increased with the successful introduction of phosphorus. P exists as oxides on the Pt/P@Cu surface, which was demonstrated by XPS and Raman. The P doping leads to increased surface active sites, lower charge transfer resistance, and enhanced HER performance in neutral media. Pt/P@Cu presents a low overpotential of 24.3 mV at the current density of −10 mA cm−2, along with an excellent stability reaching −1000 mA cm−2 for 1000 cycles of LSV. The successful P doping on the catalyst surface inspires future study on developing simple surface modifications to increase the electrocatalytic activity to develop advanced electrocatalysts.
Introduction
With the increasing energy consumption and large amounts of greenhouse gas released, considerable efforts have been made to find clean-energy alternatives to fossil fuel resources.1–3 Hydrogen has been regarded as an environmentally friendly and high-energy-density resource for renewable energy systems.4,5 The production, storage and transport of hydrogen have flourished and developed during last decades, leading to more and more hydrogen programs and commercial applications.6,7 In addition to fossil fuel reforming, water electrolysis has been further explored as a main hydrogen production method, consisting of two half-reactions, the hydrogen evolution reaction (HER) and oxygen evolution reaction (OER).8–12 HER consists of three different reaction pathways according to the reaction kinetics, which include the Volmer step, Heyrovsky step and Tafel step.13Platinum is regarded as a top electrocatalyst for HER due to its free energy being close to zero, as well as its fast kinetics for both hydrogen atom adsorption and desorption.14,15 However, the scarcity and high cost of Pt restrict its wide application. Commercial materials include Pt nanoparticles on carbon support with different loading amounts, which highly increase the surface area and reduce the cost, but the stability is poor when the Pt/C is coated on the current collector, with weak physical interaction due to the continuous release of large bubbles, especially under high current densities.16,17 Thus, self-standing electrocatalysts with strong interaction for long-term durability have been innovated accordingly. Luo's group reported Ni foam-supported single Pt atoms/CoP nanotubes.18 The self-standing electrocatalyst exhibited remarkable HER performance, with an overpotential of 24 mV at the current density of −10 mA cm−2. Meanwhile, its durability was much better than that of Pt/C under −100 mA cm−2 for 24 h. Recently, one representative work reported a strategy to prepare a Pt monolayer on Ni foam.19 The Pt monolayer reached a similar catalytic activity as bulk Pt film, indicating the full utilization of the Pt monolayer on the large-surface-area Ni foam. Concurrently, an atomic layer deposition (ALD) strategy was used to fabricate well-dispersed Pt nanostructures on Ni foam.20 Different ALD cycles were explored in the Pt deposition process. The Pt/Ni foam showed a low overpotential of 37 mV to reach the current density of −10 mA cm−2 and good stability.
On the other hand, phosphorus has been explored intensively in transition metal phosphide (TMP) electrocatalysts. Introducing P into transition metal-based electrocatalysts can tune the electronic properties and modify active sites.21,22 Besides TMPs, surface phosphates are becoming attractive in HER due to the negatively charged species, which accelerate water dissociation in the Volmer step.23 We have reported the P-modified CoMoO4 nanosheets as an efficient electrocatalyst for HER. The existence of P–O groups leads to increased surface active sites for HER and accelerated water dissociation in an alkaline medium.24 Additionally, phosphate-functionalized CoP nanowire was developed.25 The P–O group plays a critical role in improving HER performance by accelerating water dissociation and charge transfer kinetics. However, P doping in noble-metal electrocatalysts is less explored. When Pt-based electrocatalyst was optimized in different angles, shapes, substrates and alloyed materials, the surface modification was worth further exploring. As for these modifications, it is also important to develop facile methods for performance enhancement. Herein, inspired by our previous work, Cu foam was used as substrate, and Pt was loaded directly on Cu foam as a self-standing electrode Pt@Cu.16 Then, phosphorous was doped on the Pt@Cu surfaces (Pt/P@Cu), leading to increased HER performance with the addition of sodium hypophosphite during Pt growth. P exists as P–O components on the Pt/P@Cu surface, modifying the surface chemical environment and contributing to HER improvement. Our work plots an innovative way to fabricate Pt/P@Cu materials by a facile method as self-standing robust electrocatalyst, leading to the improvement of HER performance in neutral medium.
Results and discussion
Phosphorus-modified Pt@Cu
Platinum nanocrystals, especially dendritic structures, are widely applied as electrocatalysts for HER. The fabrication process is facile, and the mass activity has increased during recent years.26,27 In this work, we fabricated platinum nanocrystals directly on copper foam. The process utilized a facile solvent reduction strategy. In a typical fabrication process, ammonium citrate dibasic and L-ascorbic acid were used as surfactant and reduction solvent, respectively. Then, boric acid was used to tune the pH value for growth of dendritic shapes. Cu foam was used as substrate to load Pt. Finally, Pt4+ was reduced to Pt dendrite-like nanocrystals on the copper foam, as Pt@Cu, as described in our previous work.16 The scanning electron microscope (SEM) image (Fig. S1, ESI†) illustrated that small Pt nanocrystals dispersed uniformly on the copper foam. To further improve HER performance, phosphorus was introduced into Pt@Cu (Fig. 1). During the growth of Pt nanocrystals, sodium hypophosphite hydrate was used as P source, and the P was introduced simultaneously. P doping was realized by an electroless contact deposition method as presented in eqn (1).28| 3H2PO2− → H2PO3− + H2O + 2OH− + 2P | (1) |
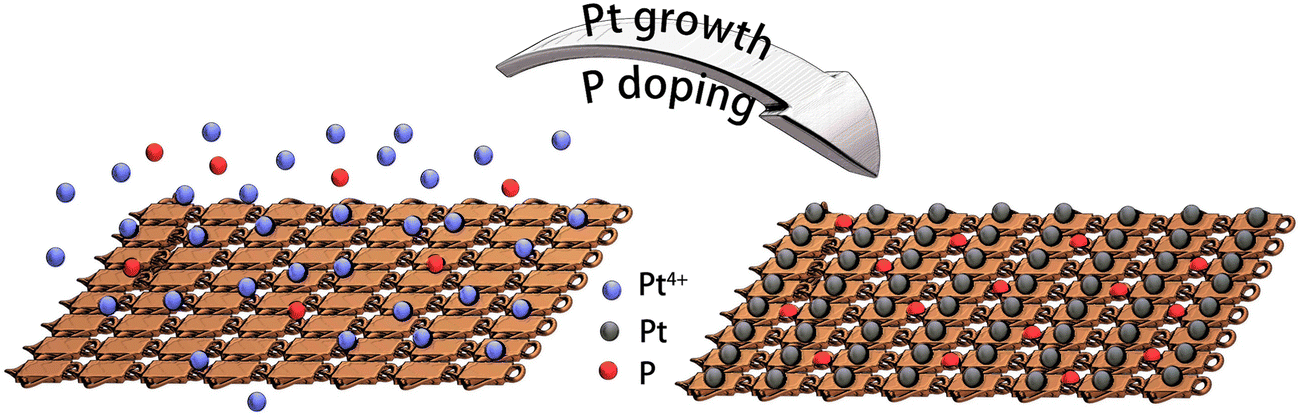 | ||
| Fig. 1 Fabrication process of phosphorus-modified Pt@Cu (Pt/P@Cu). | ||
The detailed fabrication process is listed in the experimental section. By adding extra P source during the synthetic process, phosphorus-modified Pt@Cu (Pt/P@Cu) electrocatalyst was successfully prepared.
The morphology of Pt/P@Cu is illustrated in Fig. 2. Fig. 2a presents the porous structure of Pt/P@Cu on the Cu foam, which is beneficial for sufficient contact with the electrolyte and efficient bubble release. Fig. 2b shows the uniform dispersion of Pt nanocrystals on Cu foams, which was similar to Pt@Cu, indicating the negligible effect on shape growth of the extra P doping. The SEM image and corresponding energy-dispersive spectroscopy (EDS) mapping images are shown (Fig. 2c–f). Pt and P elements were distributed uniformly on the Cu foam, indicating successful P doping on the Pt@Cu framework.
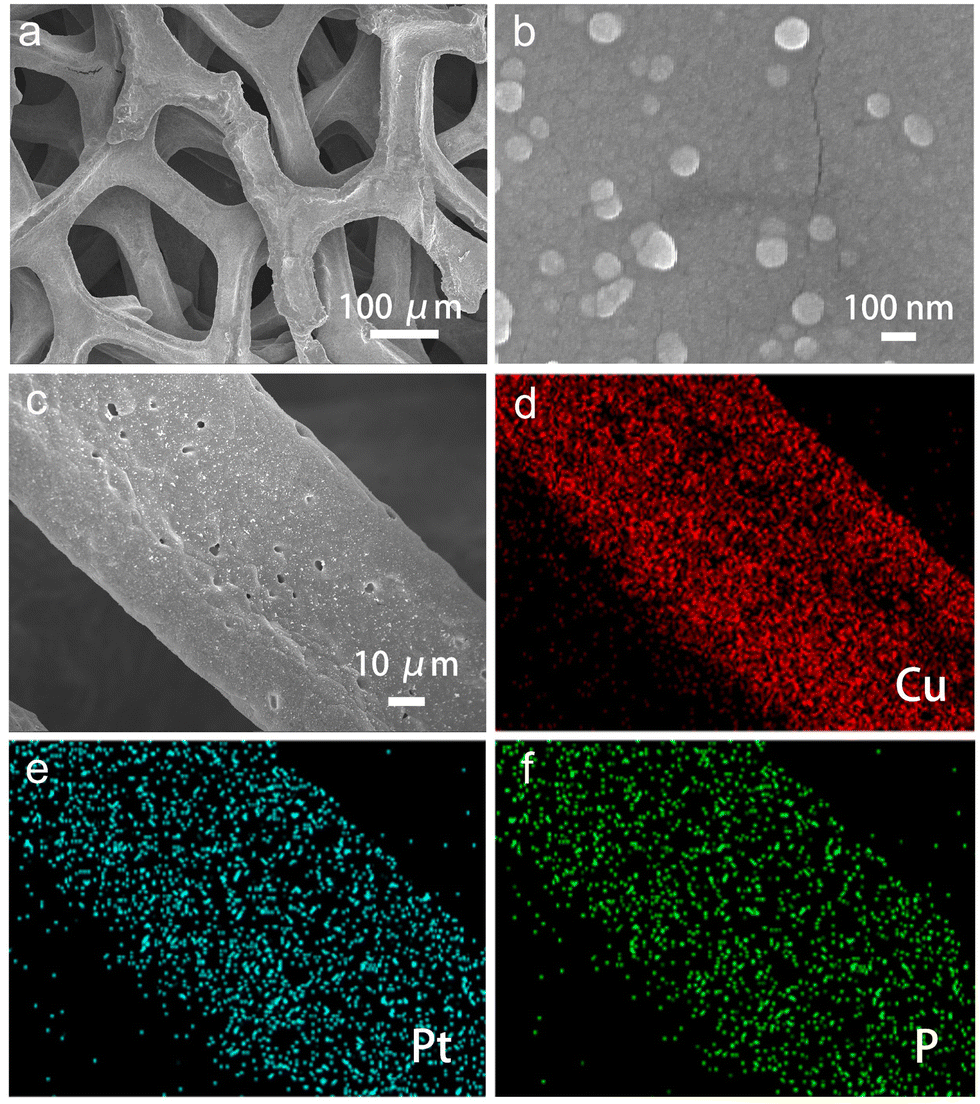 | ||
| Fig. 2 Morphology characterization. (a) Low-resolution and (b) high-resolution SEM images of Pt/P@Cu. (c) SEM image and corresponding EDS mapping images of (d) Cu, (e) Pt and (f) P. | ||
The successful P doping is also illustrated by the photographic images (Fig. S2, ESI†). The Pt/P@Cu electrode showed darker colour than Pt@Cu. As for this synthetic process, P was doped on the Pt@Cu surface with the simultaneous reduction reaction of Pt.
Surface chemical environment
To further explore the surface chemical environment of Pt/P@Cu, X-ray powder diffraction (XRD), X-ray photoelectron spectroscopy (XPS) and Raman microscopy were used. Fig. S3 (ESI†) shows the XRD patterns of Pt@Cu and Pt/P@Cu. Only peaks of Cu were presented because of the ultralow loading of Pt. The XPS survey spectra was acquired accordingly (Fig. S4, ESI†). An obvious peak of P 2p is shown by the Pt/P@Cu sample in the inset image (Fig. S4, ESI†).Detailed XPS spectra of Cu 2p, Pt 4f, P 2p and O 1s are shown in Fig. 3. The XPS spectra (Fig. 3a) illustrate the Cu surface chemical environment. Peaks located at 932.7 eV and 952.5 eV were assigned to Cu 2p3/2 and Cu 2p1/2, respectively, in the deconvoluted spectra of Cu 2p.29 The peak located at 934.4 eV stands for Cu2+ species.30,31 There was also a shake-up satellite peak at 942.5 eV. The surface chemical state of Pt is illustrated in the XPS deconvoluted spectra (Fig. 3b). The paired peaks at 71.6 and 74.9 eV belong to metallic Pt0.32 Meanwhile, the peaks with dashed lines located at 78.4 eV and 75.0 eV represent Cu 3p1/2 and Cu 3p3/2, which can be confirmed in the reported work.33 The other paired peaks located at 75.5 eV and 72.1 eV represent the Pt2+ species, which are ascribed to oxidation when exposed to air. The surface chemical environment of Pt had negligible change after P doping. The XPS spectra of P 2p is presented in Fig. 3c. The obvious peak located at 133.3 eV was ascribed to P–O.34 The spectra confirmed that P exists as dominant P–O components in Pt/P@Cu. Fig. 3d shows the XPS spectra in O 1s. After deconvolution, the peak located at 531.3 eV appears, presenting the peak of P–O after P doping in Pt/P@Cu compared with Pt@Cu.35 The peak located at 532.2 eV was ascribed to Cu-O.36
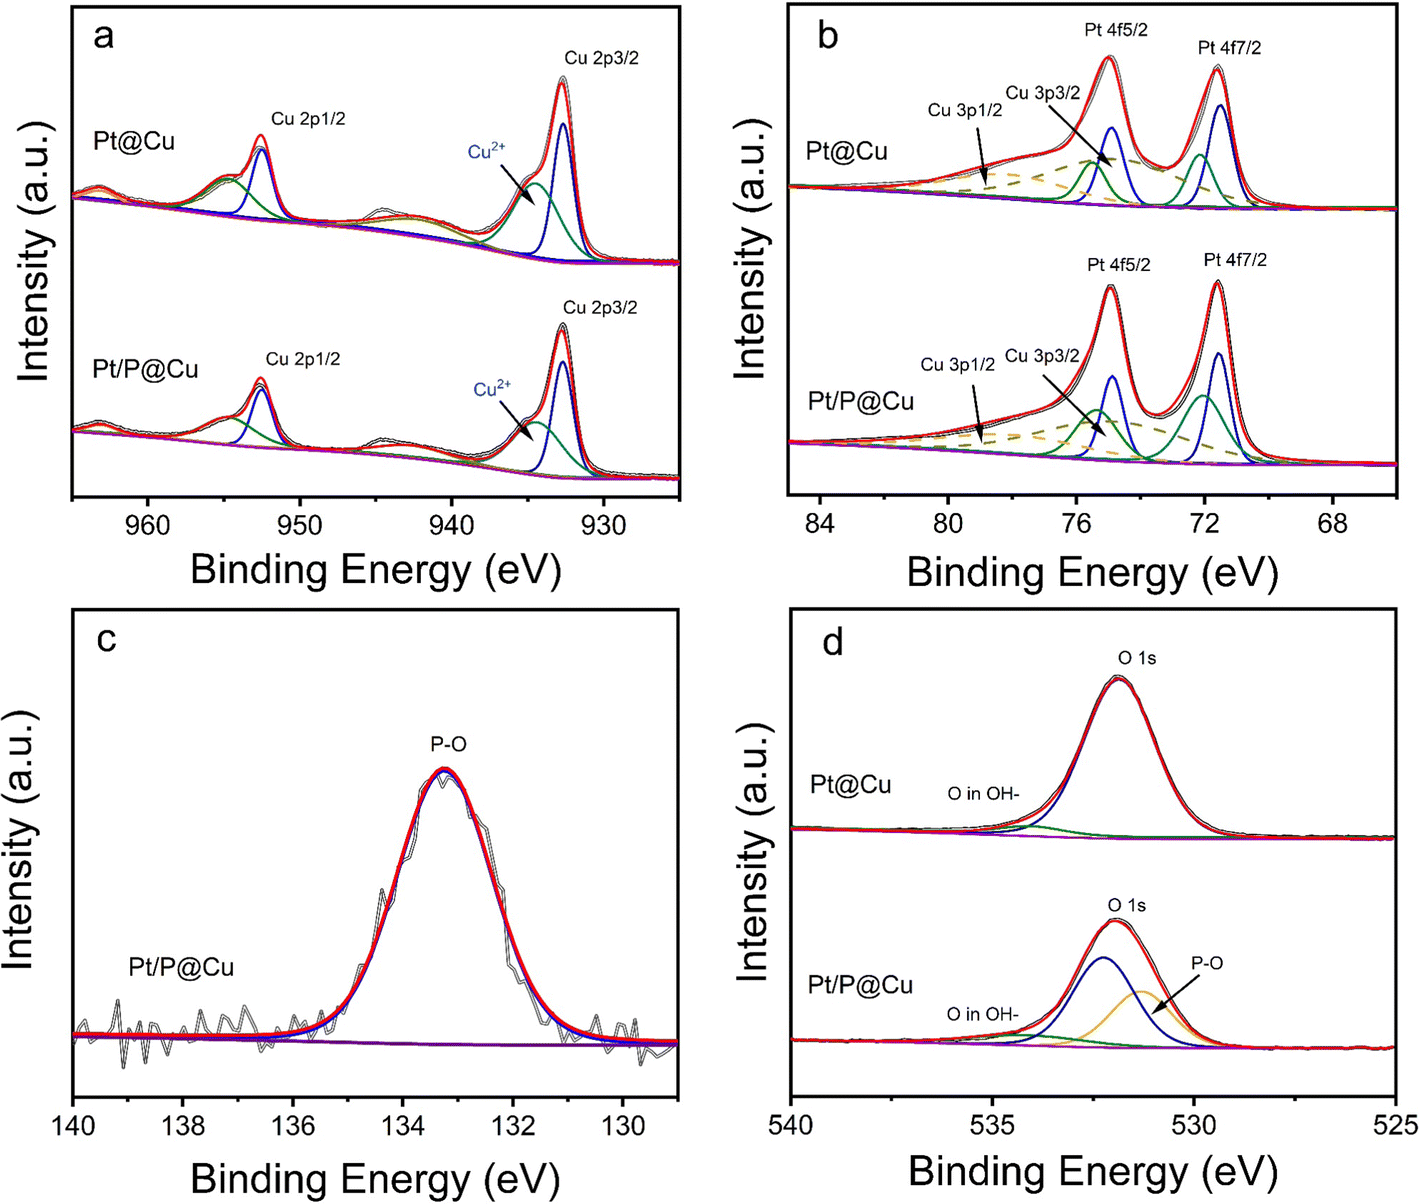 | ||
| Fig. 3 XPS spectra of (a) Cu 2p, (b) Pt 4f, (c) P 2p and (d) O 1s of Pt@Cu and Pt/P@Cu surfaces. | ||
Raman spectra were extracted (Fig. S5, ESI†). Three Raman peaks, at 288, 335 and 626 cm−1, were indexed to surface oxides of Cu in Pt@Cu. After phosphorous doping, all three vibration peaks weakened, indicating that CuO was reduced. The introduction of phosphorus vacancies will lead to decreased vibration intensity of CuO.37 Moreover, the peak at 288 cm−1 shifted to 278 cm−1, reflecting the influence of P doping on the oxygen stretching.38
Electrocatalytic performance
The as-prepared electrocatalysts were evaluated in 1 M phosphate buffered saline (PBS) for HER. Pt/C, Pt@Cu and Pt/P@Cu were examined, and the linear sweep voltammetry (LSV) curves are illustrated in Fig. 4a. Pt/P@Cu showed better HER performance, with an overpotential of 24.3 mV to reach the current density of −10 mA cm−2. The other two Pt/C and Pt@Cu samples showed overpotentials of 45.6 mV and 36.1 mV, respectively. The successful P doping enhanced the HER performance based on the Pt@Cu interface, with the overpotential of 36.1 mV decreasing to 24.3 mV. Tafel slopes of Pt/C, Pt@Cu, and Pt/P@Cu are 87.1 mV dev−1, 53.7 mV dev−1 and 50.2 mV dev−1, respectively (Fig. 4b). The Tafel slopes reflect the same dominant Tafel-Heyrovsky process. To further explore the electrochemical surface area (ECSA), double-layer capacitances of Pt@Cu and Pt/P@Cu were extracted from CV curves (Fig. S6, ESI†). The double-layer capacitances of Pt@Cu and Pt/P@Cu were 96.2 mF cm−2 and 118.2 mF cm−2, respectively, illustrating the increased HER active sites due to the extra P doping. Electrochemical impedance spectroscopy (EIS) was explored (Fig. 4c). Nyquist plots (dots) and fitting data (solid lines) recorded at the potential of −0.7 V (vs. Ag/AgCl) with an AC potential of 5 mV over the frequency range from 100 kHz to 0.1 Hz are shown. The inset shows the simulated equivalent circuit. The Nyquist plots of Pt@Cu and Pt/P@Cu were acquired at the voltage of −0.7 V (vs. Ag/AgCl), corresponding to their respective HER onset potentials. From these plots, the measured charge transfer resistances (Rct) of Pt@Cu and Pt/P@Cu are 0.45 and 0.31 Ω, respectively. The smaller charge transfer resistance of Pt/P@Cu has a positive influence on accelerating the HER kinetics.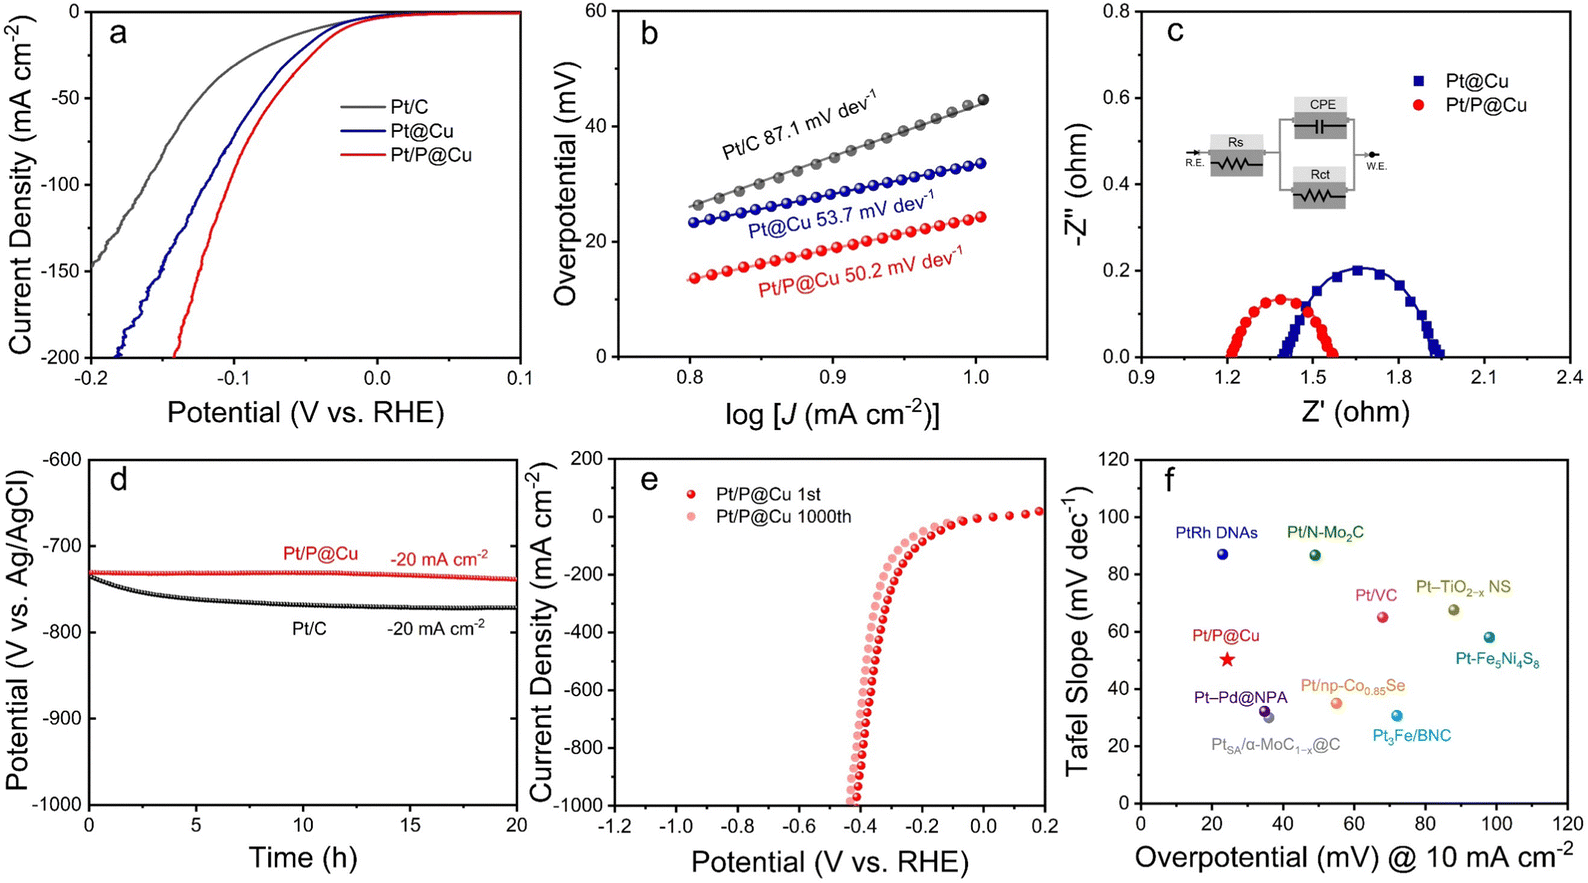 | ||
| Fig. 4 HER performance. (a) LSV curves with iR correction and (b) Tafel slopes of commercial Pt/C, Pt@Cu and Pt/P@Cu. (c) Nyquist plots (dots) and fitting data (solid lines) recorded at a potential of −0.7 V (vs. Ag/AgCl) with an AC potential of 5 mV over a frequency range from 100 kHz to 0.1 Hz. Inset shows the simulated equivalent circuit. (d) Chronopotentiometry test of Pt/C and Pt/P@Cu. (e) 1000 cycles of LSV tests with iR correction of Pt/P@Cu under a scan rate of 100 mV s−1. (f) Comparison of overpotentials at a current density of −10 mA cm−2 and the Tafel slopes of Pt/P@Cu with those of recently reported Pt-based catalysts in neutral medium. | ||
To evaluate the stability of the electrocatalysts, chronopotentiometry test was applied for 20 h under a constant current density of −20 mA cm−2 (Fig. 4d). The potential (V vs. Ag/AgCl) of Pt/C decreased from −734 mV to −771 mV after 20 h, while the potential (V vs. Ag/AgCl) of Pt/P@Cu decreased from −730 mV to −738 mV, which was much more stable. The 1000 cycles of LSV reaching a high current density of −1000 mA cm−2 illustrates the obvious advantages of Pt/P@Cu as a self-standing electrocatalyst compared to Pt/C (Fig. 4e). After 1000 LSV cycles under 100 mV s−1, the overpotential of Pt/P@Cu required to reach a current density of −1000 mA cm−2 decreased from −412 mV to −435 mV (only 23 mV shift), indicating its robust physical and chemical stability. Pt/C showed a fragile performance after 1000 LSV cycles (Fig. S7, ESI†). The overpotential at a current density of −1000 mA cm−2 increased from −749 mV to −1128 mV, indicating the fragile physical stability under fierce bubble release. A comparison of overpotential at the current density of −10 mA cm−2 and the Tafel slope of Pt/P@Cu with those of recently reported Pt-based catalysts in neutral medium is illustrated in Fig. 4f. The as-prepared Pt/P@Cu electrode shows remarkable HER performance in neutral medium among promising Pt-based electrocatalysts. Detailed information is listed in Table S1, ESI.†
The experimental results illustrated the successful P doping on Pt@Cu surface and enhanced electrocatalytic activity. The phosphorus-modified Pt@Cu electrocatalyst showed remarkable HER performance and stability under high current densities.
Conclusion
In summary, phosphorus-modified Pt@Cu electrocatalyst was fabricated through a facile, one-step method. The chemical state of P was studied by XPS and Raman spectra, illustrating the P–O oxides as the dominating component on the Pt/P@Cu surface. The successful introduction of P modified the surface chemical environment of Pt/P@Cu, leading to increased numbers of surface active sites, reduced charge transfer resistance and enhanced HER performance in neutral medium. The overpotential further lowered to 24.3 mV to reach a current density of −10 mA cm−2. The 1000 cycles of LSV test reaching −1000 mA cm−2 also confirmed its structural and chemical stability as self-standing electrocatalyst. This work plots an innovative way to modify the surface environment of Pt-based electrocatalysts with phosphorus, showing promising potential as highly efficient HER electrocatalysts with a facile surface modification.Experimental section
Materials
Sodium hypophosphite monohydrate (NaH2PO2·H2O), chloroplatinic acid hexahydrate (H2PtCl6·H2O, 8 wt% Pt) and ammonium citrate dibasic (HOC(CO2H)(CH2CO2NH4)2) were purchased from Sigma Aldrich (UK) Co., Ltd. L-Ascorbic acid (C6H8O6) was purchased from Merck (USA) Co., Ltd. Boric acid (H3BO3) was purchased from Alfa Aesar (UK) Co., Ltd. Potassium dihydrogen phosphate (KH2PO4) and potassium phosphate dibasic (K2HPO4) were purchased from Alfa Aesar (UK) Co., Ltd. Nafion solution was purchased from Sigma-Aldrich (UK) Co., Ltd. All chemicals were used as received without further purification.Preparation of Pt/C electrode
Commercial 20% Pt/C powder (10 mg) was dispersed in a solution with 400 μL DI water, 100 μL ethanol, and 20 μL Nafion solution to form the ink solution. The electrode was prepared by dropping 260 μL of the ink solution on 1 cm2 of the carbon paper as the Pt/C electrode.Preparation of Pt/P@Cu and Pt@Cu electrodes
To prepare Pt/P@Cu, 0.678 g of ammonium citrate dibasic and 0.529 g of L-ascorbic acid were dissolved in 30 mL of deionized (DI) water. Then, 0.123 g of boric acid was dissolved in 20 mL of DI water. Commercial Cu foams (2 cm × 1 cm) were used as the substrates for preparing the working electrodes. Cu foams were placed in 0.5 M hydrochloric acid solution for ≈10 min under ultrasonication to remove surface oxides. Next, Cu foams were washed by DI water and dried in a vacuum oven at 60 °C for 2 h. In a typical process, Cu foams were placed in a 100 mL beaker under magnetic stirring with 10 mL of DI water, 10 mL of ammonium citrate dibasic solution and 75 μL of chloroplatinic acid hexahydrate solution. Then, 100 mg of sodium hypophosphite monohydrate was added to the solution. Boric acid was added to adjust the pH value, and the solution was stirred for 10 min at room temperature. Finally, the solution was heated to 50 °C, then 10 mL of L-ascorbic acid solution was added immediately. The whole synthetic process lasted for 1 h, then, the as-prepared electrocatalyst Pt/P@Cu electrodes were washed with DI water three times and dried in a vacuum oven at 60 °C for 12 h. The fabrication of Pt@Cu used the same process except with the addition of 100 mg sodium hypophosphite monohydrate.Characterization
The surface morphology and elemental distribution of the working electrodes were characterized by SEM (Carl Zeiss EVO MA10). XRD patterns were obtained using a STOE SEIFERT diffractometer with a detection angular range of 2° < 2θ < 40° and a Mo X-ray radiation source. The surface chemical environments of different elements were evaluated by XPS (Thermo Scientific K-alpha photoelectron spectrometer) analysis. Data analysis of XPS results was achieved using CasaXPS with the calibration of C 1s 284.8 eV. Raman spectra were recorded by a Bruker Senterra Raman Spectrometer. The pH value was acquired using an HI2550 Meter.Electrochemical measurements
Electrochemical measurements of working electrodes were conducted in a three-electrode cell. A volumetric ratio of 1![[thin space (1/6-em)]](https://www.rsc.org/images/entities/char_2009.gif) :1 between K2HPO4 and KH2PO4 were mixed to prepare 1 M PBS solution, which was used as the electrolyte. A graphite rod, an Ag/AgCl electrode (filled with 3 m KCl) and the as-prepared electrodes were used as counter electrode, reference electrode and working electrode, respectively. 1 cm2 of the metal foam was controlled to immerse in the electrolyte during the test. LSV and CV measurements were carried out using a Gamry Interface 1000 potentiostat. All the potentials were converted to the reversible hydrogen electrode (RHE) according to the equation ERHE = EAg/AgCl + 0.197 + 0.059 pH. Tafel slopes were determined by fitting the linear regions of the Tafel plots according to the Tafel equation (η = blog(j) + a) and replotted polarization curves. EIS was performed with frequencies from 0.1 to 100000 Hz with an amplitude of 10 mV. All LSV measurements were calculated with 100% iR compensation except LSV curves reaching −1000 mA cm−2 (90% iR compensation).
:1 between K2HPO4 and KH2PO4 were mixed to prepare 1 M PBS solution, which was used as the electrolyte. A graphite rod, an Ag/AgCl electrode (filled with 3 m KCl) and the as-prepared electrodes were used as counter electrode, reference electrode and working electrode, respectively. 1 cm2 of the metal foam was controlled to immerse in the electrolyte during the test. LSV and CV measurements were carried out using a Gamry Interface 1000 potentiostat. All the potentials were converted to the reversible hydrogen electrode (RHE) according to the equation ERHE = EAg/AgCl + 0.197 + 0.059 pH. Tafel slopes were determined by fitting the linear regions of the Tafel plots according to the Tafel equation (η = blog(j) + a) and replotted polarization curves. EIS was performed with frequencies from 0.1 to 100000 Hz with an amplitude of 10 mV. All LSV measurements were calculated with 100% iR compensation except LSV curves reaching −1000 mA cm−2 (90% iR compensation).
Conflicts of interest
The authors declare no conflict of interest.Acknowledgements
We acknowledge China Scholarship Council/University College London for joint PhD scholarships and the Engineering and Physical Sciences Research Council (EPSRC, EP/V027433/1, EP/L015862/1, EP/R023581/1). The project was supported by the Royal Academy of Engineering under the Research Chairs and Senior Research Fellowships scheme (Brett and Shearing), and we thank the Royal Society (RGS\R1\211080; IEC\NSFC\201261) and Henan Overseas Expertise Introduction Center for Discipline Innovation (CXJD2021003) for funding support.References
- S.-L. Li and Q. Xu, Energy Environ. Sci., 2013, 6, 1656–1683 RSC.
- N. Kittner, F. Lill and D. M. Kammen, Nat. Energy, 2017, 2, 17125 CrossRef.
- D. P. Tabor, L. M. Roch, S. K. Saikin, C. Kreisbeck, D. Sheberla, J. H. Montoya, S. Dwaraknath, M. Aykol, C. Ortiz, H. Tribukait, C. Amador-Bedolla, C. J. Brabec, B. Maruyama, K. A. Persson and A. Aspuru-Guzik, Nat. Rev. Mater., 2018, 3, 5–20 CrossRef CAS.
- J. O. Abe, A. P. I. Popoola, E. Ajenifuja and O. M. Popoola, Int. J. Hydrogen Energy, 2019, 44, 15072–15086 CrossRef CAS.
- C.-J. Winter, Int. J. Hydrogen Energy, 2009, 34, S1–S52 CrossRef CAS.
- J. González-Cobos, V. J. Rico, A. N. R. González-Elipe, J. L. Valverde and A. de Lucas-Consuegra, ACS Catal., 2016, 6, 1942–1951 CrossRef.
- A. M. Abdalla, S. Hossain, O. B. Nisfindy, A. T. Azad, M. Dawood and A. K. Azad, Energy Convers. Manage., 2018, 165, 602–627 CrossRef CAS.
- X. Liu, R. Guo, K. Ni, F. Xia, C. Niu, B. Wen, J. Meng, P. Wu, J. Wu, X. Wu and L. Mai, Adv. Mater., 2020, 32, 2001136 CrossRef CAS PubMed.
- F. Xia, L. Shu, Y. Wen, F. Yang and C. Zhen, Mater. Adv., 2022, 3, 5772–5777 RSC.
- G. Zhao, K. Rui, S. X. Dou and W. Sun, Adv. Funct. Mater., 2018, 28, 1803291 CrossRef.
- G. Zhang, Y. Li, X. Xiao, Y. Shan, Y. Bai, H.-G. Xue, H. Pang, Z. Tian and Q. Xu, Nano Lett., 2021, 21, 3016–3025 CrossRef CAS PubMed.
- X. Li, J. Wei, Q. Li, S. Zheng, Y. Xu, P. Du, C. Chen, J. Zhao, H. Xue, Q. Xu and H. Pang, Adv. Funct. Mater., 2018, 28, 1800886 CrossRef.
- X. Tian, P. Zhao and W. Sheng, Adv. Mater., 2019, 31, 1808066 CrossRef PubMed.
- N. Cheng, S. Stambula, D. Wang, M. N. Banis, J. Liu, A. Riese, B. Xiao, R. Li, T.-K. Sham, L.-M. Liu, G. A. Botton and X. Sun, Nat. Commun., 2016, 7, 13638 CrossRef CAS PubMed.
- H. Q. Pham and T. T. Huynh, Mater. Adv., 2022, 3, 1609–1616 RSC.
- Y. Tan, R. Xie, S. Zhao, X. Lu, L. Liu, F. Zhao, C. Li, H. Jiang, G. Chai, D. J. L. Brett, P. R. Shearing, G. He and I. P. Parkin, Adv. Funct. Mater., 2021, 31, 2105579 CrossRef CAS.
- Y.-Y. Ma, C.-X. Wu, X.-J. Feng, H.-Q. Tan, L.-K. Yan, Y. Liu, Z.-H. Kang, E.-B. Wang and Y.-G. Li, Energy Environ. Sci., 2017, 10, 788–798 RSC.
- L. Zhang, L. Han, H. Liu, X. Liu and J. Luo, Angew. Chem., Int. Ed., 2017, 56, 13694–13698 CrossRef CAS PubMed.
- M. Li, Q. Ma, W. Zi, X. Liu, X. Zhu and S. Liu, Sci. Adv., 2015, 1, e1400268 CrossRef PubMed.
- H. Chen, J.-T. Chen, L. Shao, L. Wang, X.-Z. Fu and J.-L. Luo, Appl. Surf. Sci., 2019, 494, 1091–1099 CrossRef CAS.
- Y. Tan, J. Feng, L. Kang, L. Liu, F. Zhao, S. Zhao, D. J. L. Brett, P. R. Shearing, G. He and I. P. Parkin, Energy Environ. Mater., 2022 DOI:10.1002/eem2.12398.
- J. Kibsgaard, C. Tsai, K. Chan, J. D. Benck, J. K. Nørskov, F. Abild-Pedersen and T. F. Jaramillo, Energy Environ. Sci., 2015, 8, 3022–3029 RSC.
- Q. Zhang, Z. L. Zhe Ru, R. Daiyan, P. Kumar, J. Pan, X. Lu and R. Amal, ACS Appl. Mater. Interfaces, 2021, 13, 53798–53809 CrossRef CAS PubMed.
- S. Zhao, J. Berry-Gair, W. Li, G. Guan, M. Yang, J. Li, F. Lai, F. Corà, K. Holt, D. J. L. Brett, G. He and I. P. Parkin, Adv. Sci., 2020, 7, 1903674 CrossRef CAS PubMed.
- D. Zhu, L. Wang, M. Qiao and J. Liu, Chem. Commun., 2020, 56, 7159–7162 RSC.
- J. Zhang, Y. Zhao, X. Guo, C. Chen, C.-L. Dong, R.-S. Liu, C.-P. Han, Y. Li, Y. Gogotsi and G. Wang, Nat. Catal., 2018, 1, 985–992 CrossRef CAS.
- Y. Shi, Z.-R. Ma, Y.-Y. Xiao, Y.-C. Yin, W.-M. Huang, Z.-C. Huang, Y.-Z. Zheng, F.-Y. Mu, R. Huang, G.-Y. Shi, Y.-Y. Sun, X.-H. Xia and W. Chen, Nat. Commun., 2021, 12, 3021 CrossRef PubMed.
- Q. Zhao, Q. Qian, B. Zhang and X. Zhang, Mater. Chem. Phys., 2021, 263, 124412 CrossRef CAS.
- O. Akhavan, R. Azimirad, S. Safa and E. Hasani, J. Mater. Chem., 2011, 21, 9634–9640 RSC.
- X. Zhao, M. Deng, G. Rao, Y. Yan, C. Wu, Y. Jiao, A. Deng, C. Yan, J. Huang, S. Wu, W. Chen, T. Lei, P. Xu, W. He and J. Xiong, Small, 2018, 14, 1802477 CrossRef PubMed.
- T. Ghodselahi, M. A. Vesaghi, A. Shafiekhani, A. Baghizadeh and M. Lameii, Appl. Surf. Sci., 2008, 255, 2730–2734 CrossRef CAS.
- X. Pei, H. Jiao, H. Fu, X. Yin, D. Luo, S. Long, W. Gong and L. Zhang, ACS Appl. Mater. Interfaces, 2020, 12, 51459–51467 CrossRef CAS PubMed.
- X. Du, S. Luo, H. Du, M. Tang, X. Huang and P. K. Shen, J. Mater. Chem. A, 2016, 4, 1579–1585 RSC.
- L. Tian, X. Yan and X. Chen, ACS Catal., 2016, 6, 5441–5448 CrossRef CAS.
- A. Majjane, A. Chahine, M. Et-tabirou, B. Echchahed, T.-O. Do and P. M. Breen, Mater. Chem. Phys., 2014, 143, 779–787 CrossRef CAS.
- S. Lv, J. Li, B. Zhang, Y. Shi, X. Liu and T. Wang, Int. J. Hydrogen Energy, 2022, 47, 9593–9605 CrossRef CAS.
- B. Chang, X.-G. Zhang, Z. Min, W. Lu, Z. Li, J. Qiu, H. Wang, J. Fan and J. Wang, J. Mater. Chem. A, 2021, 9, 17876–17884 RSC.
- O. Prakash, S. Kumar, P. Singh, V. Deckert, S. Chatterjee, A. K. Ghosh and R. K. Singh, J. Raman Spectrosc., 2016, 47, 813–818 CrossRef CAS.
Footnote |
| † Electronic supplementary information (ESI) available: Additional characterizations, including XRD, SEM, XPS, LSV, Raman and CV curves, are provided. See DOI: https://doi.org/10.1039/d2ma00772j |
| This journal is © The Royal Society of Chemistry 2022 |