
 Open Access Article
 This Open Access Article is licensed under a Creative Commons Attribution-Non Commercial 3.0 Unported Licence
Recent progress in 0D optical nanoprobes for applications in the sensing of (bio)analytes with the prospect of global health monitoring and detailed mechanistic insights
Riyanka
Das
 ab,
Rajeshwari
Pal†
ab,
Sourav
Bej†
ab,
Moumita
Mondal
ab,
Krishnendu
Kundu
c and
Priyabrata
Banerjee
*ab
ab,
Rajeshwari
Pal†
ab,
Sourav
Bej†
ab,
Moumita
Mondal
ab,
Krishnendu
Kundu
c and
Priyabrata
Banerjee
*ab
aSurface Engineering & Tribology Group, CSIR-Central Mechanical Engineering Research Institute, Mahatma Gandhi Avenue, Durgapur, 713209, India. E-mail: pr_banerjee@cmeri.res.in; priyabrata_banerjee@yahoo.co.in; Web: https://www.cmeri.res.in Web: https://www.priyabratabanerjee.in Tel: +91-9433814081
bAcademy of Scientific & Innovative Research (AcSIR), Ghaziabad-201002, Uttar Pradesh, India
cEnergy & Post Harvest Technology Group, CSIR CMERI CoEFM, Ludhiana, 141006, Punjab, India
First published on 2nd May 2022
Abstract
Continuous monitoring of a variety of biomolecules and bio-relevant ions is of tremendous importance in maintaining the physiological balance and evaluation of metabolic parameters. Therefore, the development of fast, selective, sensitive and reliable sensors and their application in point-of-care testing (POCT) analysis are one of the main interests. Over the past few decades, a variety of zero-dimensional nanomaterials have been extensively developed for the optical biosensing of different bio-analytes due to their unique characteristics, such as high sensitivity, bio-compatibility, and low toxicity. In the present review, the current trends of the research endeavours (2017–2022) based on emerging optical biosensing applications including the systematic classification of various zero-dimensional nanomaterials including carbon quantum dots (CQDs), graphene quantum dots (GQDs), inorganic quantum dots (IQDs), noble metal nanomaterials such as silver nanoparticles (AgNPs), gold nanoparticles (AuNPs), magnetic nanoparticles (MNPs), upconversion nanoparticles (UCNPs) and polymer dots (PDs) are comprehensively described towards the detection of various target-specific bio-analytes, such as deoxyribonucleic acid (DNA), proteins, enzymes, adenosine triphosphate (ATP), adenosine, dopamine (DA), uric acid (UA), glucose, hydrogen peroxide (H2O2), biothiols, cysteamine, and cancer biomarkers. Additionally, an in-depth discussion of the chromo-fluorogenic signaling mechanisms, the detection thresholds, and linear dynamic ranges of detection is presented. The sensitivity of the developed nanomaterials is also summarized for a broad range biological applications in complex bio-matrices, such as human blood plasma, serum, and urine. Ultimately, the gaps and challenges in the present research strategies and future perspectives are highlighted herein to strengthen the current research strategies for the commercialization of “next-generation” nanosensors. The significant research endeavours and technical breakthroughs towards the development of optical nano biosensing platforms give rise to new motivation, which will be highly beneficial in the domain of non-invasive clinical diagnosis.
 Riyanka Das | Riyanka Das received her Master's in Chemistry from Presidency University, Kolkata, India in 2017. She is a DST-INSPIRE Senior Research Fellow at CSIR-CMERI, Durgapur, India and presently pursuing her PhD in Chemical Sciences from the Academy of Scientific and Innovative Research under the joint supervision of Dr Priyabrata Banerjee, Pr. Scientist and Dr Naresh Chandra Murmu, Sr. Pr. Scientist and Head, Surface Engineering and Tribology Group, CSIR-CMERI, Durgapur. Her research is primarily focused on the development of chemosensors via the C–N bond fusion pathway for expeditious fluoro/chromogenic detection of toxic metal contaminants and lethal anions, together with their detailed characterization and applications. |
 Rajeshwari Pal | Rajeshwari Pal received her Master of Technology Degree from NIT, Durgapur, India in 2021. She is a Junior Research Fellow at CSIR-CMERI, Durgapur, India and presently pursuing her PhD in Engineering Sciences from the Academy of Scientific and Innovative Research under the joint supervision of Dr Priyabrata Banerjee, Pr. Scientist, Surface Engineering and Tribology Group, CSIR-CMERI, Durgapur and Dr Krishnendu Kundu, Sr. Pr. Scientist, Energy & Post Harvest Technology Group, CSIR-CMERI CoEFM, Ludhiana, India. Her research is primarily focused on the development of chemosensors for the immediate chromo-fluorogenic detection of toxic contaminants in biodiesel. |
 Sourav Bej | Sourav Bej received his Master's in Chemistry from Presidency University, Kolkata, India in 2016. He qualified for GATE in 2016. He is a Senior Research Fellow at CSIR-CMERI Durgapur, India and presently pursuing his PhD in Chemical Sciences from the Academy of Scientific and Innovative Research under the joint supervision of Dr Priyabrata Banerjee, Pr. Scientist and Dr Naresh Chandra Murmu, Sr. Pr. Scientist and Head, Surface Engineering and Tribology Group, CSIR-CMERI, Durgapur. His research is primarily focused on the development of metal organic frameworks for the expeditious fluoro/chromogenic detection of lethal anions and volatile organic solvents. |
 Moumita Mondal | Moumita Mondal received her Master's Degree in Chemistry from Presidency University, Kolkata, India in 2020. She qualified for the Graduate Aptitude Test in Engineering (GATE) in 2021. She is a Junior Research Fellow at CSIR-Central Mechanical Engineering Research Institute (CMERI) Durgapur, India and presently pursuing her PhD in Chemical Sciences from the Academy of Scientific and Innovative Research (AcSIR) under the supervision of Dr Priyabrata Banerjee, Pr.g Scientist, Surface Engineering and Tribology Group, CSIR-CMERI, Durgapur. Her research is primarily focused on the development of innovative sensory receptors for the fluoro/chromogenic detection of heavy toxic metal contaminants and lethal anions. |
 Krishnendu Kundu | Krishnendu Kundu is a Senior Principal Scientist, Energy & Post Harvest Technology Group, CSIR CMERI CoEFM, Ludhiana, Punjab, India. Dr Kundu received his PhD in 2006 from G. B. Pant University of Agriculture and Technology, Pantnagar, Uttarakhand, India. He has published 45 research papers in several reputed journals, 2 book chapters, 10 magazines, and 25 national conference proceedings. His current research interest broadly covers biodiesel and biogas production, process optimization, plant design (batch, semi continuous and fully automatic), fuel testing and characterization, engine testing on biodiesel/biogas and required engine modifications, briquetting technology and plant design, algal biofuel, and waste to wealth. |
 Priyabrata Banerjee | Priyabrata Banerjee is a Principal Scientist & Associate Professor (AcSIR), Surface Engineering & Tribology Division, CSIR-CMERI, India. He received his PhD degree from IACS, Jadavpur, Kolkata, India in 2007. He did his Post-Doctoral research at the Max Planck Institute for Bio-Inorganic Chemistry, Mülheim, Germany. He was a Visiting Fellow at HTW Dresden, Germany, and presently he has been selected as a CSIR-Raman Research Fellow at Ghent University, Belgium. He has published 134 research papers (5437 citations, h-index: 39, i-index: 107) in several international SCI journals, 13 book chapters and 10 magazines. He is the Editor of Advances in Materials and Processing Technologies, Taylor & Francis online and Guest Editor of Frontiers in Chemistry. His current research interest broadly covers selective bio-relevant cation-anion detection; corrosion science, solid waste management, wastewater treatment, metal-mediated C-heteroatom bond fusion and metal organic complexes and their unexplored radical chemistry development. |
1. Introduction
In the current era, nanomaterial-based technology has emerged as a rapidly growing field due to its wide range of practical applications including energy management,1,2 sensing,3,4 biomedical applications,5,6 environmental remediation,7,8 and drug delivery.9,10 The term “nano” stems from the Greek word “nanos”, which means dwarf.11 Materials with dimensions in the range of 1–100 nm are designated as nanomaterials, where the length of each nanometer can be easily understood by lining up ten hydrogen atoms. The term nanometer was first used by Richard Adolf Zsigmondy in 1914.12 The roots of nanotechnology were planted in 1959 by physicist and Nobel laureate Richard Feynman in his legendary talk entitled “There's Plenty of Room at the Bottom”.13 However, in 1974, Norio Taniguchi first used the term nanotechnology. Nevertheless, before 1980s, nanotechnology was only limited to concepts, whereas presently this burgeoning field is dominating materials chemistry gradually. Recently, there have been numerous reports on the synthesis and applications of various nanomaterials, including nanoparticles,14 nanowires,15 nanotubes,16a–c nanonails,16d core–shell nanostructures,16e and nanosheets.16f Among them, zero-dimensional nanomaterials are spherical or quasi-spherical in shape in most of the cases, having a diameter of <100 nm.17,18 Currently, zero-dimensional nanomaterials are considered “next-generation” materials, which have attracted much attention as they possess several unique characteristics, such as high surface-to-volume ratio, ultra-small size, optical stability, excitation-dependent fluorescence, cell permeability, etc. Moreover, due to the quantum confinement effect, they possess the high quantum efficiency among nanoprobes. This property makes them highly efficient in in vitro and in vivo fluorescence imaging. Moreover, the size of 0D nanomaterials is also beneficial for cellular uptake. Thus, the properties of nanomaterials can be further improved by converting them into zero-dimensional nanomaterials, which are very different from bulk high-dimensional nanomaterials.19These unique characteristics make zero-dimensional nanomaterials suitable for diverse applications, including, memory devices, light-emitting diodes, solar cells, catalysts, energy generation in biofuel cells,20,21 together with fascinating applications in biomedicine and healthcare field.22 In this regard, the fast and reliable detection of biomolecules by nanomaterials plays a fundamental role in medical diagnosis due to their unique size and unprecedented physico-chemical properties.23 Biosensing is crucial for monitoring human health by the detection of bio-relevant analytes, which act as specific biomarkers of different diseases in the human body for specific disease diagnosis. Biomarkers are actually measurable indicators of a particular biological state and state of any particular disease, and thus are often measured to scrutinize biological processes. However, the recognition of biomarkers with high selectivity and specificity remains a significant challenge towards the development of high-performance biosensors with the prospect of human health monitoring. Traditional sensing strategies involve gas chromatography, field-effect transistors, microgravimetry, Raman spectroscopy-based platforms, etc.24a However, these methods suffer from several drawbacks, such as high maintenance cost, cumbersome instrumentation, requirement of skilled professionals for operation, and non-portability. Moreover, to date, the available biosensing techniques are based on electrochemistry, chemiluminescence, surface-enhanced Raman spectroscopy (SERS), etc.24b–j However, they sometimes suffer from a narrow operating temperature, short life span, reduced shelf life, etc. Among the different sensing approaches, optical sensing (mainly chromogenic and fluorogenic) has attracted substantial attention over the last few decades due to its simplicity, selectivity, sensitivity, cost-effectiveness, etc.25,26 Moreover, this type of sensing phenomenon can be easily visualized by the naked eye and is deployable for on-site monitoring of the targeted analyte via point-of-care testing (POCT) analysis.27,28 Recently, there have been many reports on the organic molecule-based optical sensing of biomolecules, which is highly advantageous for the diagnosis of diseases and different bio-medical applications.29–31 However, this type of sensor suffers from several drawbacks, such as poor sensitivity, low specificity, poor water solubility, photobleaching, etc. Therefore, in comparison to the traditional chromo-fluorogenic assays, attention has been shifted towards the development of nanosensing strategies due to their signal amplification, low toxicity, bio-compatibility, improved sensitivity, naked-eye detection capability, cell permeability, excellent in vitro or in vivo cell imaging applicability, etc.32,33 Consequently, the applications of nanomaterial-based optical biosensing are accelerating progressively, which is advantageous for their practical applications. In the design of target-specific nano-biosensors, the main factor to consider is the judicious selection of the receptor unit to boost the sensing selectivity and specificity by specific host–guest binding interactions. To accomplish this, nanosensors have to be devised in a manner that they can be equally responsive towards target-specific analyte detection in laboratory conditions and in real field complex biological matrices to obtain a readable signal with high reliability. Recently, there have been an increasing number of reports on zero-dimensional nanomaterials for biosensing applications. The degree of sophisticated design of nanosensors based on controlled receptor-analyte interactions will lead to increased specificity and sensitivity, which ultimately will be helpful for clinical diagnosis via point-of-care testing analysis34 or long-term in vivo monitoring of the targeted analytes.35
In the past few decades, numerous review articles have been published in this domain, which discussed the chemosensing and biosensing applications based on a particular type of nanomaterial, such as carbon-based nanomaterials,36 graphene-based nanomaterials,37 metallic and semi-conducting nanomaterials,38 silver and gold nanoparticles, etc.39,40a Furthermore, most of these reviews focused on the electrochemical properties of nanomaterials.40b However, definitive review articles on optical biosensing applications using a variety of zero-dimensional nanomaterials together with an in-depth explanation of their sensing mechanism are still limited. This prompted us to offer a comprehensive overview of the recent research endeavours on this topic in the domain of optical nano-biosensing platforms to fill the gap in this field.
In this perspective, the main motive of the current review is to give a comprehensive overview of the fundamental principles of various 0D nanomaterials for chromo-fluorogenic sensing, validation of the developed nanosensors, insight into their sensing mechanism and provide a brief idea about the gaps and key challenges in future research for the commercialization of “next-generation” nanosensors.
In Section 2 of the present review, the chromo-fluorogenic signaling mechanisms, including aggregation/disaggregation-based sensing strategy, growth/etching-based supramolecular sensing strategy, inner filter effect (IFE), photoinduced electron transfer (PET), fluorescence resonance energy transfer (FRET), dynamic quenching, and static quenching are exclusively discussed. Subsequently, Section 3 is sub-divided into 7 main categories, wherein the application of various zero-dimensional nanomaterials (e.g., carbon quantum dots, graphene quantum dots, inorganic quantum dots, magnetic nanoparticles, metallic nanoparticles (such as silver nanoparticles and gold nanoparticles), upconversion nanoparticles and polymer dots) as promising biosensors operating through these mechanisms (as summarized in Fig. 1) is comprehensively highlighted to finely exhibit the recent trends (2017–2022) of nanomaterial-based biosensing strategies towards the detection of various bio-analytes, such as deoxyribonucleic acid (DNA), protein, enzymes, biothiols, aminothiols, dopamine (DA), uric acid (UA), glucose, hydrogen peroxide (H2O2), ascorbic acid (AA), adenosine triphosphate (ATP), etc. for the diagnosis of diseases. In Section 4, we summarize the advancement of the present research works together with a preview of the current research status. Finally, in Section 5, we discuss the future challenges and perspectives to boost the current research strategies. We believe that this review will provide a comprehensive overview of the endeavours on zero-dimensional nanomaterials for biosensing applications developed in the last few years (2017–2022), which will ultimately give insight towards the progressive development of optical biosensing in the domain of global health monitoring.
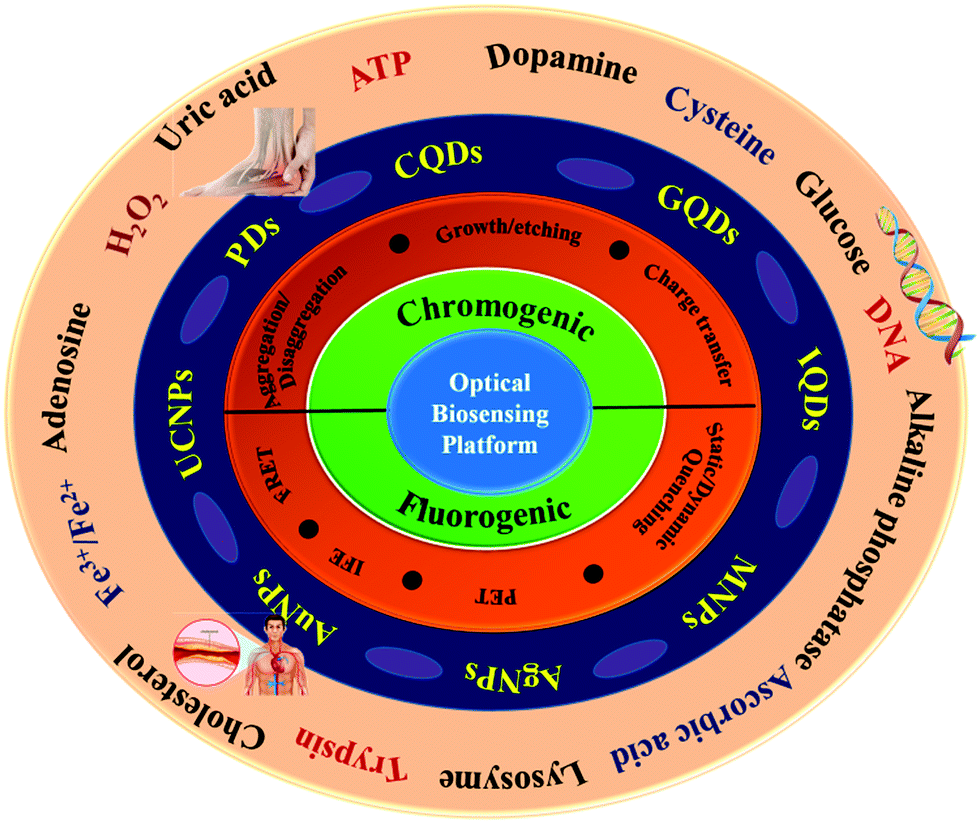 | ||
| Fig. 1 Schematic diagram of biosensing by zero-dimensional nanomaterials. | ||
2. Mechanisms of chromo-fluorogenic biosensing by zero-dimensional nanomaterials
For the ultimate clinical validation and improved detection accuracy, currently attention has been shifted to the design of new nano biosensors for early-stage disease diagnosis followed by corresponding biomedical applications. Among the different types of biosensors, chromo-fluorogenic biosensors are emerging as an exciting class of nanomaterials because of their many unique advantages, such as low detection threshold, on-spot applicability, requirement of small amount of sample for signal generation, etc. There are several chromo-fluorogenic signaling mechanisms, which play a significant role in the design of nanomaterials for target-specific biosensing. In this section, we present fundamental insight into some of the chromo-fluorogenic signaling mechanisms.2.1 Chromogenic signaling mechanisms
Nanomaterial-based chromogenic biosensors are one of the important sensing tools for applications in point-of-care testing analyses due to the generation of a visible color or alteration in visible color that can be monitored by the ‘naked eye’. Therefore, the generated “YES”/“NO” signal can be assessed instantly by the bare eye without the need for additional instrumentation.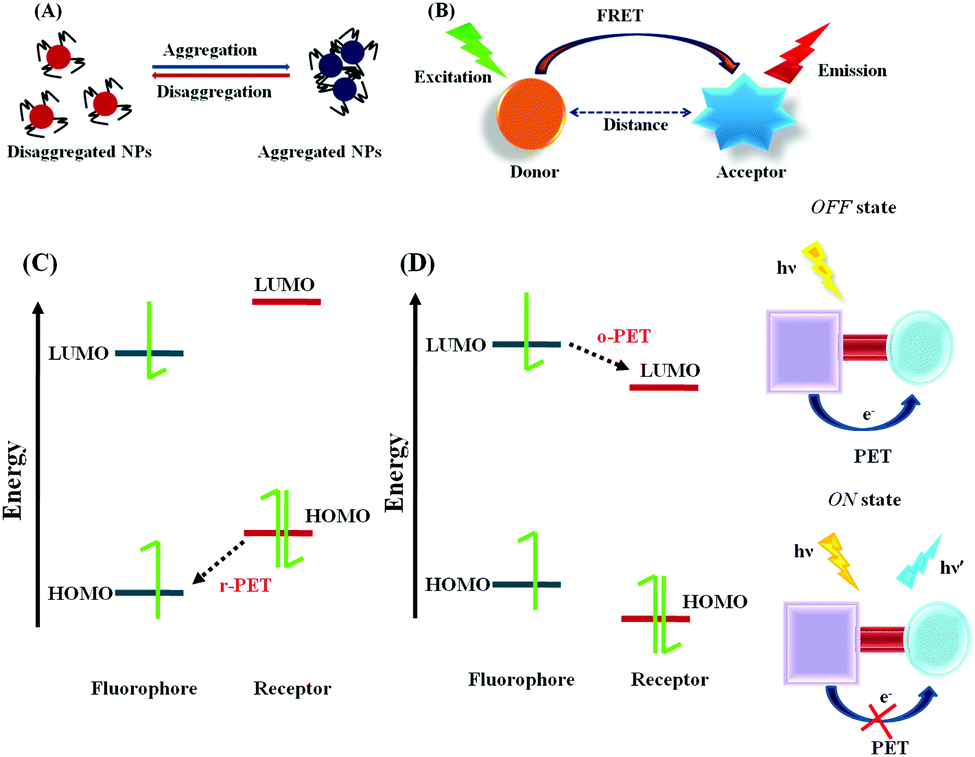 | ||
| Fig. 2 (A) Aggregation–disaggregation-based chromogenic signaling mechanism. (B) Schematic diagram of Förster resonance energy transfer (FRET) process. Frontier molecular orbital energy diagrams of the PET mechanism: (C) R-PET and (D) O-PET. | ||
Another chromogenic sensing mechanism in this category includes the etching-based sensing strategy. Generally, it is difficult to oxidize or etch Au and Ag due to their high redox potential value. However, by conjugating them with particular ligands (e.g., CN− and SCN−) or by the conversion of the bulk materials into nanoparticles, the corresponding redox potential values can be minimized, and then they may be suitable for etching to produce a target-specific colorimetric signal.45
2.1.3.1 Metal to ligand charge transfer (MLCT) or ligand to metal charge transfer (LMCT). Transition metal elements generally contain partially filled d-orbitals in their electronic configuration. As an artefact, several electronic transitions may be possible, which result in an alteration in chromo/fluorogenic properties. Here, in the case of LMCT or MLCT, the electronic transition takes place from filled orbital of the ligand to the vacant d-orbital of the metal or from the metal-filled d-orbital to the vacant anti-bonding orbital of the ligand respectively. Also, the coordination of certain anions to the target specific metal centre also leads to an alteration in the intrinsic properties of the host moiety, resulting in chromogenic changes.46–48
2.1.3.2 Intramolecular charge transfer (ICT). In the case of internal charge transfer, one electron-donating part should be present together with an electron-withdrawing part, which results an electron “pull–push” effect in the molecular scaffold. The molecular scaffold may interact via two ways, as follows: (i) the donor part may interact with the targeted analyte, thereby reducing the electronic transition (hypsochromic shift) and (ii) the acceptor fragment may interact with the targeted analyte, thereby increasing the ICT phenomenon, which causes a change in chromogenic properties. These properties may be helpful for recognizing the targeted analyte through the designed nanomaterials.49–51
2.2 Fluorogenic signaling mechanisms
The fluorescence phenomenon was first observed in quinine solution by Sir John Fredrick William Herschel in 1845 and this process was explained by Prof. Alexander Jablonski. Subsequently, numerous fluorescence signaling mechanisms were developed, and in current scenario, they are widely used for the nanomaterial-based biosensing of various targeted analytes due to the unique optical and physicochemical features of this method, such as efficient signal transduction, high sensitivity, in vitro or in vivo cell imaging for medicinal applications, etc.In the case of R-PET, upon photoexcitation the fluorescence of the fluorophore is quenched due to the relocation of an electron from the highest occupied molecular orbital (HOMO) of the donor to the lowest unoccupied molecular orbital (LUMO) of the fluorophore. However, upon interaction with the targeted analytes, there may be a change in the redox potential of the donor, which may lead to a reduction in the HOMO energy level compared to that of the fluorophore. Therefore, the PET process may be deactivated with an enhancement in fluorescence (Fig. 2C).58 Hence, due to the PET process, a charge separated state is generated, which is comprised of the acceptor radical anion and the donor radical cation, with the reduction of the fluorophore and the oxidation of the chelator/receptor.
On the contrary, in the case of O-PET, the fluorescence is quenched due to the transfer of an electron from the excited state of the fluorophore to the LUMO of the receptor. In this case, the oxidation of the fluorophore and reduction of the chelator/receptor occur (Fig. 2D).
Overall, both the lifetime and emission quantum yield are compromised due to the activation of the PET process, while the fluorescence is again regenerated due to the restriction of the PET process via target-specific binding with the guest analytes.
For example, in 2015, Xiao et al. developed an NP-based fluorophoric system. Interestingly, in the presence of hemoglobin (HGB), the fluorescence of the system was quenched. Thus, to understand the underlying mechanism, both UV-Vis and excited state lifetimes studies were performed. The average lifetime before and after the addition of HGB to the NP system was found to be 6.46 ns and 6.51 ns, respectively, which was almost unaltered, nullifying the possibility of dynamic quenching. Alternatively, the UV-Vis spectra of the NPs, HGB and NP-HGB were studied, and interestingly a peak at ∼403 nm due to HGB was found in the absorbance spectrum of the complex, indicating that the mechanism was static quenching.
On the contrary, dynamic quenching occurs when the excited-state nanomaterial returns to the ground state through collision with the target quencher, leading to energy/charge transfer. This process may be explained with the help of simple equation, i.e.,
| A* + Q → A + Q, |
The kinetics of the process obeys the non-linear Stern–Volmer equation, as follows:
| F0/F = 1+ kqτ0[Q] | (1) |
Similar to static quenching, dynamic quenching also abides by some rules, as follows: (i) it affects only the excited state, and thus there will be no change in the ground-state absorbance spectrum, (ii) the excited state lifetime of the NPs changes in the presence and absence of the quencher molecule, and (iii) an increase in the reaction temperature increases the rate of dynamic quenching.
3. Exploration of different types of zero-dimensional nanomaterials in the domain of biosensing applications
3.1 Carbon quantum dots or carbon dots (CQDs)
Carbon quantum dots (CQDs) are carbon-based nanomaterials applied in the research field because of their various physico-chemical properties such as good biocompatibility, presence of different functional groups such as hydroxyl, amino, and carboxyl, unique optical properties, easy and cost-effective synthetic procedure, high chemical stability, ease of functionalization, high resistivity towards photobleaching, aqueous phase stability, etc. CQDs exhibit sharp optical absorption in the UV window. Furthermore, their absorption tail is extended in the visible window. Alternatively, CQDs normally exhibit broad fluorescence emission spectra, which are excitation tunable.83 CQDs are beneficial for sensing applications towards the detection of various bio-analytes including lysine, vitamin B2 (riboflavin), intracellular pH, Fe3+, hypochlorite (ClO−), bilirubin (BR), vitamin B12 (cyanocobalamin), polysaccharide, ATP, cysteine (Cys), homocysteine (Hcy), glutathione (GSH) etc (Table 1).62a,63–82,84–90,93 The sensing phenomenon by CQDs mostly relies on PET, FRET, IFE, static and dynamic quenching. In the case of static quenching, a non-fluorescent ground state complexation is observed via the interaction of CQDs with the quencher, which can be easily examined by UV-Vis absorption spectroscopy or lifetime values. Particularly, in the case of static quenching, the average lifetime remains almost constant, whereas in the case of dynamic quenching, the value is significantly changed.62b On the contrary, in the case of PET, electron transfer occurs between the CQDs and quencher depending on the type of PET process, i.e., reductive or oxidative. In the case of reductive PET, the CQDs are reduced due to the transfer of an electron from the electron donor to CQDs, which is governed by the energy gap of the lowest unoccupied molecular orbitals (LUMO) of the CQDs with the highest occupied molecular orbitals (HOMO) of the electron donor. In the case of oxidative PET, electron transfer occurs from the CQDs to the quencher, which is governed by the energy gap of the LUMO of both species. Therefore, PET can be considered to one of the mechanistic pathways of fluorescence quenching if the lifetime and the corresponding HOMO–LUMO energy gaps are reduced.62b,c In the case of IFE, there must be an overlap of the absorption spectrum of the quencher with the excitation or emission spectrum of the CQDs. However, this does not fall under the category of either the static or dynamic quenching mechanism and there is no change in the lifetime value, ruling out the formation of any new species. Alternatively, if a significant overlap of the emission spectrum of the CQDs occurs with the absorption spectrum of the quencher and the distance between the CQDs and quencher lies in the range of 10–100 Å together with a reduction in the lifetime of the CQDs, FRET is the best possible fluorescence signaling mechanism to be operative.62d| Targeted analyte | Mode of biosensing | Limit of detection | Linear range | Ref. |
|---|---|---|---|---|
| Vitamin B2 (riboflavin) | Fluorogenic | 37.2 nM | VB2: 0.35–35.9 μM | 62 |
| pH | pH: 3.6–8.0 | |||
| Fe3+ | Fluorogenic | 87 nM/L | Fe3+: 1.5–692 μmol L−1 | 63 |
| pH | pH: 1.60–7.00 | |||
| ClO− | Fluorogenic | 0.27 μM | ClO−: 1.5–187.5 μM | 65 |
| pH | pH: 4.0–9.0 | |||
| pH | Fluorogenic | — | 4.45–7.00 | 84 |
| pH | Fluorogenic | — | 5.2–8.8 | 64 |
| Lysine | Fluorogenic | 94 nM | Lysine: 0.5–260 μM | 93 |
| pH | pH: 1.5–5.0 | |||
| BR | Fluorogenic | BR: 56.28 nM | — | 67 |
| VB12 | VB12: 89.07 nM | |||
| Adenosine triphosphate (ATP) | Fluorogenic | 15.0 nM | 0.5–2.0 nM | 69 |
| Polysaccharide | Fluorogenic | — | Polysaccharide: 3.00–8.00, | 66 |
| pH | pH: 7.10–7.25 | |||
| L-Cysteine (Cys) | Both chromogenic and fluorogenic | Fluorogenic: 28.11 μM | 0–800 μM | 70 |
| Chromogenic: 19.74 μM | ||||
| Fe3+ | Fluorogenic | Fe3+: 22.1 nM | Fe3+: 0.05–80 μM | 73 |
| Pyrophosphate (PPi) | PPi: 73.9 nM | PPi: 0.5–120 μM | ||
| Amifostine (AMF) | Fluorogenic | 0.15 nM | 0.5–200 nM | 74 |
| Vitamins B12 | Fluorogenic | 2.045 μmol L−1 | 0–200 μM | 68 |
| Ascorbic acid (AA) | Fluorogenic | 0.35 μM | 0–200 μM | 75 |
| Glutathione (GSH) | Both chromogenic and fluorogenic | 0.38 μM | 10–100 μM | 72 |
| Fe3+ | Fluorogenic | Fe3+: 0.27 μM | Fe3+: 0–30 μM | 71 |
| L-Cys | L-Cys: 0.14 μM | L-Cys: 0–24 μM | ||
| HCHO | Fluorogenic | 0.9 μM | 0.2–0.4 mM | 77 |
| Glucose | Fluorogenic | 0.18 μM | 0.5–250 μM | 78 |
| Coenzyme A | Fluorogenic | 6.5 μM | 0–75 μM | 76 |
| L-Cysteine (Cys) | Fluorogenic | 0.14 μM | 0–24 μM | 79 |
| Cysteamine | Fluorogenic | 75.6 nM | 10–210 μM | 85 |
| Fe3+ | Fluorogenic | Fe3+: 5 nM | Fe3+: 10 nM–50 μM | 81 |
| Ascorbic acid (AA) | AA: 5 μM | AA: 0–200 μM | ||
| Sorbate | Fluorogenic | Sorbate: 6.1 nM | Sorbate: 0.20–24 μM vitamin B12 | 87 |
| Vitamin B12 | 8.0 nM | 0.20–30 μM | ||
| Cysteine | Fluorogenic | 0.14 μM | 4–18 μM | 89 |
| β-Glucuronidase | Fluorogenic | 0.3 U L−1 | 1–15 U L−1 | 90 |
| Fe3+ | Fluorogenic | Fe3+: 0.21 μM | Fe3+: 0.5–400 μM | 86 |
| Pyrophosphate (PPi) | PPi: 0.86 μM | PPi: 2–600 μM | ||
| Fe3+ | Fluorogenic | Fe3+: 0.01 μM | Fe3+: 0–40 μM | 85 |
| ATP | ATP: 0.005 μM | ATP: 40–350 μM | ||
| Fe3+ | Fluorogenic | Fe3+: 0.01 μM | Fe3+: 0–40 μM and 40–350 μM | 88 |
| ATP | ATP: 0.005 μM | ATP: 0.01–450 μM | ||
| Biotin | Fluorogenic | 0.1 ng mL−1 | 0.5–100 ng mL−1 | 82 |
In human plasma and urine, a high concentration of lysine indicates congenital metabolic disorders, and thus the recognition of lysine is significant for the diagnosis of these diseases.91 Again, the measurement of pH in acidic condition in living cells is important because it plays a key role in cellular organelles.92 It is always desirable to design ratiometric probes to effectively eliminate the errors induced by the excitation sources or change in the local environment, which may improve the detection efficiency or sensitivity. Recently, Xiao and Ren et al. reported the application of functional dual emissive carbon dots (dCDs) for the fluorogenic detection of lysine with an LOD of 94 nM.93 Herein, in the presence of lysine, there occurs surface passivation of the CQDs via the partial shielding of the positively charged amino groups of dCDs, which ultimately led to a variation in the fluorescence property of the CQDs. Together with this, the nanosensor was also responsive to a variation in pH in the range of 1.5 to 5.0. Between the dual emissions, the emission at 624 nm was sensitive at the mentioned acidic range, keeping the emission at 440 nm constant, and thereby rendering a ratiometric response. The variation in the fluorescence of dCDs at 624 nm may originate from the protonation or deprotonation of the doped nitrogen in the CDs, whereas the surface functional groups remained unchanged, ruling out the fluorescence variation at 440 nm. Owing to its good stability and high biocompatibility, this nanosensor could be effectively applied for the ratiometric monitoring of cellular pH or lysine level, showing potential practical applicability for the diagnosis of lysine and pH-related diseases and disorders.
Vitamin B2 (riboflavin or VB2) is another important biomolecule, the detection of which is essential for food safety, supplement quality, and clinical diagnosis as a lack of VB2 causes urogenital syndrome, eye lesions, skin disorders, risk factor for different cancers, etc.94 In this regard, Dong et al. reported the use of carnation petal-derived carbon nanodots (CNDs) for the ratiometric determination of VB2, exhibiting a linear detection range of 0.35–35.9 μM with an LOD of 37.2 nM.62a CNDs showed a ratiometric fluorescence response towards VB2 due to the facilitation of the FRET process from CNDs to VB2via intermolecular H-bonding interaction between the surface OH/–COOH with the –C![[double bond, length as m-dash]](https://www.rsc.org/images/entities/char_e001.gif) O and –NH groups of the incoming VB2. This resulted in a decrease in the blue fluorescence, enhancing the green fluorescence. In addition, these CNDs exhibited a pH-sensitive “turn off” fluorescence response by tunable protonation–deprotonation of the –OH and nitrogen sites of CNDs. Moreover, owing to their favorable photostability and good biocompatibility, the obtained CNDs exhibited excellent applications towards the intracellular monitoring of VB2 and pH (Fig. 3).
O and –NH groups of the incoming VB2. This resulted in a decrease in the blue fluorescence, enhancing the green fluorescence. In addition, these CNDs exhibited a pH-sensitive “turn off” fluorescence response by tunable protonation–deprotonation of the –OH and nitrogen sites of CNDs. Moreover, owing to their favorable photostability and good biocompatibility, the obtained CNDs exhibited excellent applications towards the intracellular monitoring of VB2 and pH (Fig. 3).
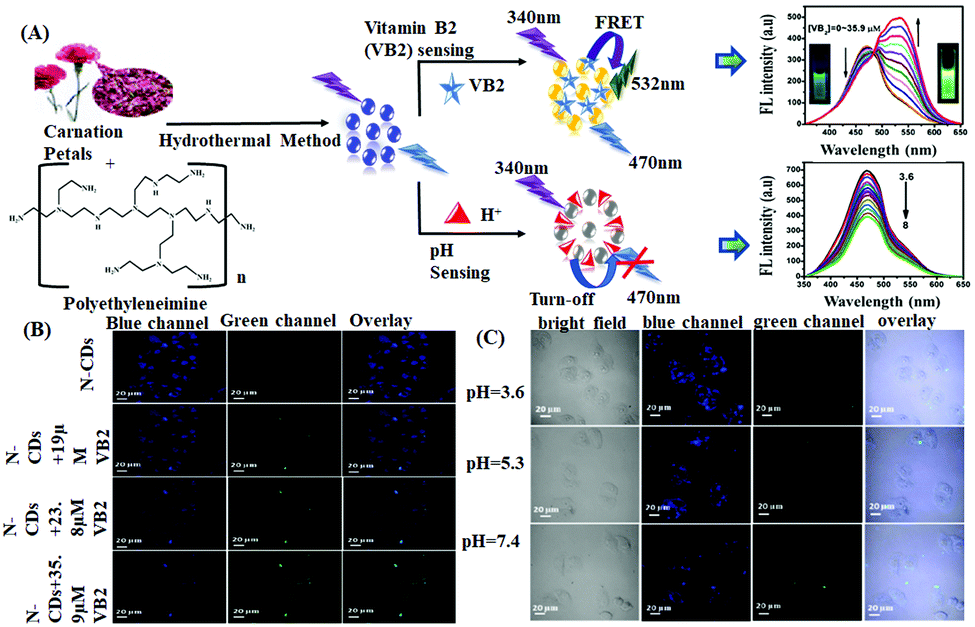 | ||
| Fig. 3 (A) Synthesis of CNDs and their application for the determination of vitamin B2 and pH. (B and C) Confocal fluorescence images of HeLa cells incubated with CNDs with different concentrations of VB2 and different pH values in blue and green channels, respectively. Adopted with permission from ref. 62. | ||
Again, the balance of Fe3+ in human body is essential as it helps in transporting and storing oxygen, enhancing reversible reactions, treatment of anemia, etc., making the selective detection of Fe3+ important.95 In this regard, Song and Gong et al. reported the use of boron, nitrogen and sulfur co-doped carbon dots (BNSCDs) for the fluorogenic determination of Fe3+ and intracellular pH in the pH range of 1.60–7.00.63 In the presence of Fe3+, a fluorescence “turn off” response occurred together with a hyperchromic shift in the UV-Vis absorption spectrum, which may be assigned to the electron/charge transfer transition from BNSCDs to Fe3+ and the coordination of Fe3+ with the surface amino and carboxyl functional groups of BNSCDs. Here, the constant lifetime value indicates the occurrence of static quenching via the formation of a stable non-fluorescent complex, which was also confirmed by UV-Vis spectroscopy. Simultaneously, the nanosensor was also employed for intracellular pH monitoring by the protonation–deprotonation of the surface –COOH moieties, which was fully reversible in the pH range of 3.0 to 7.4 and produced a rapid response. BNSCDs were applied in the live cell imaging of L02 cells for intracellular pH monitoring.
The hypochlorite anion (ClO−) is widely used in disinfection and water treatment; however, excess ClO− can cause immunodeficiency, neuronal degeneration, myocardial damage, cancer, etc. CDs with an emission in the long wavelength region are more advantageous in the domain of clinical diagnosis than that with an emission in the low wavelength region. In this regard, Dong et al. reported the application of nitrogen-doped orange emissive carbon dots (N-CDs) for the fluorogenic recognition of ClO−via the “turn off” static quenching mechanism with an LOD of 0.27 μM. The static quenching mechanism was confirmed by the lifetime measurement and the emergence of a new peak in the UV-Vis spectral window. Together with this, N-CDs also exhibited a reversible pH-sensitive fluorescence response.65 With an increase in pH in the range of 4.0–9.0, the fluorescence emission intensity of N-CDs gradually diminished via the protonation–deprotonation of the surface functional groups. Furthermore, the proposed N-CDs were effectively employed for intracellular pH monitoring in PC-12 cells, exhibiting a promising response in the domain of biomedical research.
Polysaccharides are another type of biomolecules having anti-tumor, anti-coagulation, and anti-aging effects.96 Intracellular pH may be closely related to the biosynthesis of polysaccharides. Therefore, monitoring intracellular pH may be useful for a deeper understanding of biosynthetic mechanisms. In this regard, Wang and Sun et al. reported the use of a ratiometric fluorescence nanoprobe based on CDs for intracellular pH detection to establish a correlation between intracellular polysaccharide biosynthesis and the pH in the mycelia of Pholiota adipose fungus.66 Herein, the ratiometric pH probe was designed based on the IFE exerted from the pH-sensitive non-fluorescent moiety aniline blue to the pH-insensitive fluorescent dye Rhodamine B (RhB) on the surface of the designed CDs, which was confirmed by the nearly unchanged lifetime values at different pH (Fig. 4A and B).
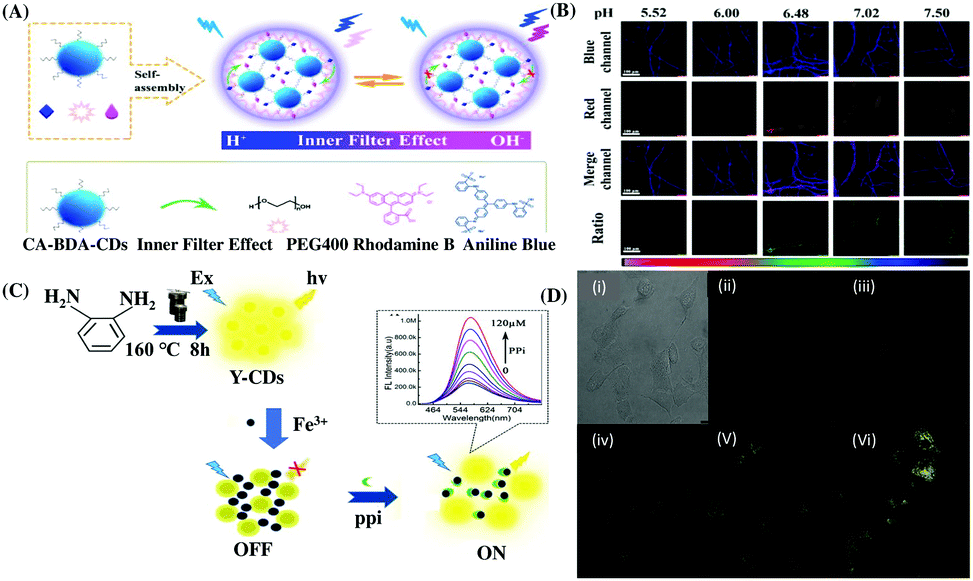 | ||
| Fig. 4 (A) Schematic diagram of the preparation of RhBAB-CDs and their sensing mechanism at acidic and basic pH. (B) Confocal fluorescence images of Pholidota adipose mycelia stained by RhB-AB-CDs at different pH values. Adopted with permission from ref. 66. (C) Fluorescence response of y-CDs-Fe3+ in the presence of PPi. (D) Confocal microscopy (i) bright-field and (ii) dark-field images of A-549 cells co-incubated with y-CDs and Fe3+, and (iii and vi) images of co-stained A-549 cells using the y-CDs-Fe3+ ensemble with different concentrations of PPi. Adopted with permission from ref. 73. | ||
Pyrophosphate (PPi) is also an important anion in various physiological activities such as starch transformation regulation, cellular metabolism etc.103a Many nanosensors have been reported for the detection of PPi. However, most of them work in the blue or green region, whereas the emission in the long wavelength region, such as yellow or orange region is relatively weak.103b In this regard, Du and Shao et al. reported the application of yellow emissive carbon dots (y-CDs) from o-phenylenediamine (OPD) for the fluorogenic recognition of Fe3+ and PPi with an LOD of 22.1 and 73.9 nM, respectively. The fluorescence response of the y-CDs could be turned off by Fe3+, which may be attributed to the static quenching due to non-fluorescent complexation and was monitored via lifetime measurement and UV-Vis spectral data. However, the quenched spectrum was selectively regenerated in the presence of PPi due to the stronger interaction between Fe3+ and PPi.73 The newly proposed y-CDs exhibited efficient intracellular imaging of Fe3+ and PPi in A-549 lung cancer cells (Fig. 4C and D), respectively.
Bilirubin (BR) is a side product from the breakdown of hemoglobin. Vitamin B12 (VB12) is another important micronutrient for cellular function maintenance and development.97,98 In this regard, Sahu et al. reported the use of N-doped carbon dots (NCDs) for the fluorogenic recognition of BR and VB12via the fluorescence quenching mechanism through FRET for BR, while IFE was the driving force for the recognition of VB12. The UV-Vis spectral data exhibited no evidence of ground state complexation, thereby indicating the dynamic quenching mechanism. The variation in the lifetime value together with the large overlap of the UV-Vis spectrum of BR with the emission spectrum of NCDs indicates the occurrence of the FRET process, which was facilitated by the H-bonding interaction of BR with the surface functional groups of NCDs. Ultimately, this led to the fluorescence quenching of NCDs in the presence of BR, whereas in the case of VB12, there was a large overlap in the UV-Vis absorption spectrum of VB12 with the excitation and emission spectra of NCDs. This was mainly responsible for the IFE or FRET process or both to be operative. However, almost constant lifetime values before and after THE interaction with VB12 confirmed the occurrence of IFE in this case, thus excluding FRET. Moreover, NCDs were also successfully applied for cellular imaging purposes using HeLa cells and for the detection of BR in blood plasma and urine samples (Fig. 5A and B).67 Zhang and Liu et al. also reported the use of yellow luminescent carbon dots (Y-CDs) for the “turn off” fluorogenic detection of VB12via IFE, which was confirmed via lifetime measurement and the UV-Vis spectral overlap with the excitation spectrum of Y-CDs.68 This strategy acquired an LOD of 2.045 μmol L−1 towards the detection of VB12. Y-CDs exhibited efficient cell imaging application for the intracellular monitoring VB12 using the MDA-MB-231 cell lines. Moreover, this nanoprobe was also exploited towards the detection of VB12 in animal vitamin B12 injection with good recovery in the range of 96.9% to 100.2%. To improve the bioimaging of the targeted analytes, it is always desirable to design long wavelength nanoprobes. In this connection, Dong et al. reported the preparation of multifunctional orange emissive carbon dots (O-CDs) for the label-free fluorogenic detection of VB12via IFE and peroxynitrite via the static quenching mechanism.99 The static quenching mechanism towards the detection of peroxynitrite was observed due to the non-fluorescent ground state complex formation via the interaction of peroxynitrite with the surface functional groups of O-CDs, which was confirmed by the evidence from lifetime and UV-Vis spectral data. Alternatively, IFE was confirmed to be the driving force towards the detection of VB12 from the substantial overlap of its absorption spectrum with the excitation spectrum of O-CDs together with constant lifetime values. The nanosensor exhibited potential applicability towards the intracellular monitoring of VB12 using PC-12 cells and exogenous/endogenous monitoring of peroxynitrite.
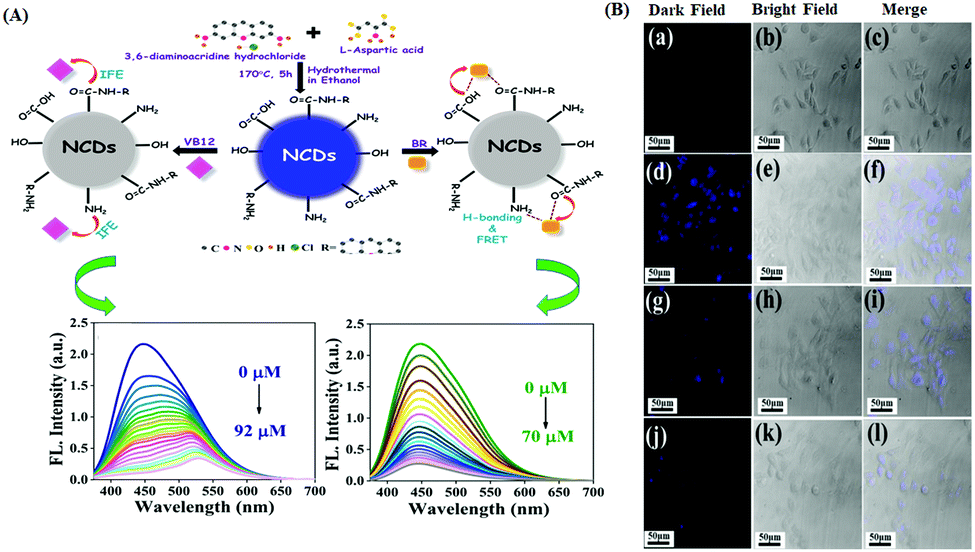 | ||
| Fig. 5 (A) Schematic representation of NCDs for the detection of VB12 and BR together with the corresponding fluorescence response of NCDs towards varying concentrations of BR and VB12. (B) Fluorescence cell imaging study of NCDs in the presence of different concentrations of VB12. Adopted with permission from ref. 67. | ||
Adenosine triphosphate (ATP) acts as an energy carrier and plays a key role in extracellular cell signaling.100 In this regard, Yang et al. reported the use of glycine and citric acid-derived N-doped carbon dots (N-CDs) for the fluorogenic recognition of ATP via the “turn-on” mechanism with the detection limit of 15 nM. N-CDs exhibited higher sensitivity and selectivity for Fe3+ to exhibit “turn off” response via the formation of a non-fluorescent ground state complex due to the strong coordination of Fe3+ with the surface functional groups of N-CDs. The Fe3+-CDs nano-assembly exhibited simultaneous selectivity towards ATP due to formation of the stronger Fe–O–P bond, which eventually recovered the fluorescence.69 The lifetime value measurement indicated the operation of the static quenching mechanism during the Fe3+ sensing event. Moreover, the proposed sensing strategy exhibited a promising response for the detection of ATP with real field biological applications with human serum and cell lysates.
Again, the recognition of biothiols, such as cysteine (Cys), glutathione (GSH), homocysteine (Hcy), etc. is also significant as they play a key function in cellular physiology and pathology with the regulation of the intracellular redox system.101,102 In this regard, Fang and Xiu et al. reported the preparation of polyethyleneimine (PEI)-based N-CQDs (PQDs) for the sensitive, chromo-fluorogenic recognition of Cu2+ and L-cysteine (Cys).70 The initially quenched fluorescence of PQDs in the presence of Cu2+ with the generation of blue color was due to the electron/charge transfer from the surface functional groups of PQDs to Cu2+. However, in the presence of Cys selectively in the same assembly, the initial fluorescence was recovered and the generated color disappeared due to the detachment of Cu2+ from the surface of PQDs due to the stronger interaction of Cu2+ with Cys than that of the surface functional groups of PQDs. This nanoprobe was also employed for the detection of Cys in diluted lemon flavored beverage samples with good accuracy. Again, Dong et al. reported the preparation of a label-free ratiometric chromo-fluorogenic nitrogen-doped carbon dots (N-CDs)-Ag+ ensemble, which could selectively detect GSH via the fluorescence recovery of the bare N-CDs from green to orange (Fig. 6A).72 Actually, in the presence of Ag+, N-CDs exhibited a ratiometric response due to the ligand to metal charge transfer transition (LMCT) via the binding of Ag+ with the surface functional groups of N-CDs. However, due to the prolific interaction of Ag+ with biothiols, in the presence of GSH, Ag+ was removed from the surface of N-CDs, recovering the fluorescence of N-CDs. N-CDs exhibited proficient cellular imaging applications towards the intracellular detection of Ag+ and GSH, which will be highly beneficial in the domain of clinical diagnosis and other biomedical fields. Sun and Sun et al. reported the use of N,S-co-doped red-emitting carbon dots (R-CDs) for the selective detection of Fe3+ and Cys with an LOD of 0.27 μM and 0.14 μM, respectively (Fig. 6B–D).71 R-CDs exhibited an efficient “turn off” fluorescence response in the presence of Fe3+ ions due to the non-fluorescent ground state complexation via efficient electron transfer from R-CDs to Fe3+, while the selective presence of Cys in the R-CDs-Fe3+ ensemble recovered the inherent fluorescence of R-CDs by the competitive binding of Fe3+ with Cys. Interestingly, the nanosensor exhibited excellent in vitro and in vivo imaging for the effective detection of the targeted analytes using Hep G2 cells and nude mice, respectively, exhibiting the good tissue penetrating behaviour of the nanosensor.
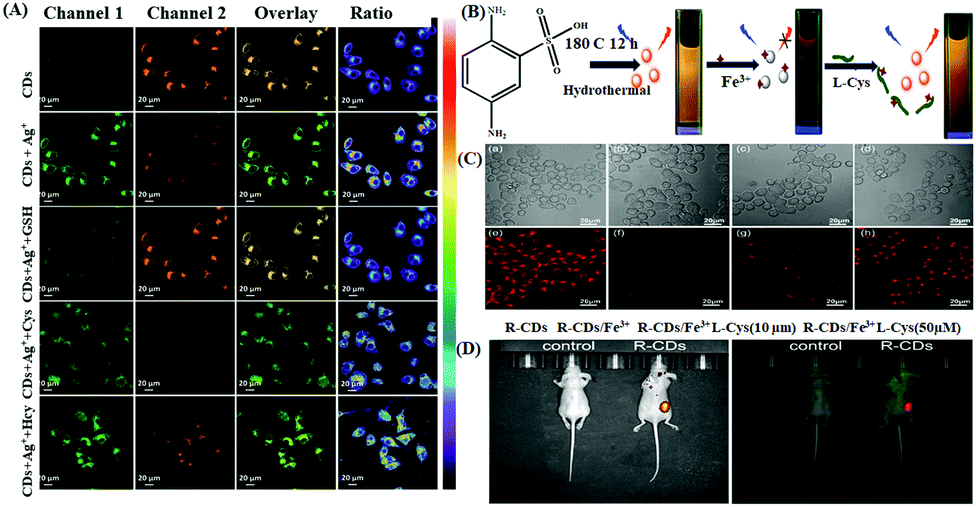 | ||
| Fig. 6 (A) Confocal laser scanning microscopy images of Ag+ and GSH in living SMMC7721 cells. Adopted with permission from ref. 72. (B) Schematic illustration of the sensing platform for detecting Fe3+ ions and L-Cys and (C) (a–d) bright-field images and confocal fluorescence images (e–h) of HeP G2 cells incubated with R-CDs with different concentrations of L-Cys. (D) In vivo PL images of nude mice in the presence of the synthesized R-CDs. | ||
Again, Li, Dong and Liu et al. designed Si-doped carbon dots (Si-CDs) with red emission via a simple hydrothermal strategy, which exhibited a “on–off–on” fluorescence response for the specific detection of L-cysteine with a limit of detection of 0.14 μM and linear range of 0–24 μM for L-Cys.79 The surface-functionalized amino group of the nanosensor initially underwent chelation with Cu2+ to form Si-CDs@Cu2+, which resulted in fluorescence quenching through the electron transfer mechanism. Upon the addition of L-cysteine to the above-mentioned system, the fluorescence of Si-CDs@Cu2+ was recovered because of the strong affinity of Cu2+ towards the L-cysteine (L-Cys) residue, resulting in the highly specific detection of L-Cys. Furthermore, this particular nanoprobe was employed for the detection of L-cysteine in human serum samples and bioimaging in the HeLa and A549 cell lines.
Dong et al. reported the use of red emissive carbon dots (CDs) for the specific and selective “on–off–on” detection of Cr(VI) and cysteine sequentially via colorimetric and fluorometric dual readout approaches with a detection limit of 0.14 μM for cysteine.89 In the presence of Cr(VI), the fluorescence of CDs was quenched due to their complexation with Cr(VI) via N → Cr ligand-to-metal charge transfer. After the addition of Cys to the newly formed complex CDs@Cr(VI), it could effectively regenerate the inherent fluorescence of the CDs owing to its ability to remove Cr(VI) on the surface of CDs. This nanoprobe was also employed in SMMC7721 for multicolor in vitro cell imaging.
Alkaline phosphatase (ALP) is an important enzyme, which takes part in different metabolic processes in the human body and acts as a potential biomarker for breast cancer, osteopenia, etc.104 In this regard, Chen et al. reported the preparation of a silica-based molecularly imprinted polymer (MIP) cross-linked with carbon dots (CDs) to produce a fluorescent nanosensor towards the detection of ALP with an LOD of 0.5 μU mL−1 in the linear range of 2–150 μU mL−1.74 Moreover, this nanosensor exhibited the good recovery of ALP in human serum samples with an RSD of 5.41%.
Ascorbic acid (AA) is a significant neurochemical. The abnormal consumption of AA in the human body can cause urinary stones, diarrhoea, etc.105 In this regard, Li et al. reported flax straw-derived carbon dots (CDs), showing “on–off” fluorescence for the detection of Co2+ or Cr6+ due to the strong interaction of the surface functional groups of the CDs with the incoming metal ions via IFE, which was confirmed by the overlap of the UV-Vis absorption spectrum of the CDs with the excitation spectrum of the targeted quencher metal ions. Additionally, the static quenching mechanism is also a driving factor for the fluorescence quenching, which was validated by the lifetime and UV-Vis spectral data of the CDs before and after interaction with the analyte. However, in the presence of AA, the nanoprobe-metal ion assembly exhibited an “on–off–on” fluorescence response via weakening of the IFE.75 The nanosensor exhibited detection efficiency towards Co2+, Cr6+ and AA with the an LOD of 0.38, 0.19, and 0.35 μM, respectively. Thus, due to the stability, simplicity, high selectivity, and high sensitivity of the new carbon dots, they exhibited excellent sensing efficacy towards the detection of AA from vitamin C tablets with a qualified recovery (93.4–107.1%).
Again, coenzyme A (CoA) participates and plays important roles in many biological events such as signal transduction, protein acetylation, etc. In this regard, Zhao et al. reported the use of a biomass-derived carbon quantum dots (BQDs)-Cu2+ ensemble for the NIR ratiometric fluorescence sensing of CoA with good sensitivity and selectivity. Initially, one of the two emissions of BQDs was decreased by Cu2+. However, in the presence of CoA, the quenched fluorescence was regenerated based on the specific interaction of the thiolate groups of CoA with Cu2+, exhibiting a detection threshold value of 6.5 μM for CoA.76 Moreover, the nanosensing strategy could be effectively employed for the imaging of CoA in living T24 cells.
3.2 Graphene quantum dots (GQDs)
Amongst the different types of nanomaterials, graphene-based structures such as pristine graphene, graphene quantum dots (GQDs), reduced graphene oxide (rGO), graphene oxide (GO)106a and carbon nanotubes (CNTs) are advantageous due to their unique physico-chemical and optical properties, which are essential for the selective recognition of bio-analytes. In this connection, GQDs with a particle size of less than 30 nm have attracted wide interest owing to their unique properties, e.g., high photostability against photobleaching and blinking, high chemical/thermal stability, stable luminescence, tunable fluorescence, excellent aqueous solubility, good conductivity with pronounced quantum confinement effect and low cytotoxicity compared to other inorganic quantum dots, which is one of the most important criteria for GQDs to be immensely considered in bio-medical applications. The fluorescence property of GQDs can be excitation dependent or independent. The excitation dependence mainly arises due to their free zigzag structures, while excitation independence arises mainly due to the regularity of their surface states and the size of their sp2 clusters. To improve the quantum yield and optical properties of GQDs, they are doped with heteroatoms or sometimes surface functionalization is carried out to increase the number of reactive sites. Moreover, GQDs function as an efficient FRET donor due to their prominent luminescence properties.106b Furthermore, GQDs can be loaded with drugs and tumor-targeting ligands to act as a cancer biomarker detector. Thus, therapies for the targeted delivery of anticancer agents with in vitro and in vivo imaging of cancer cells are possible.106c,107From a morphological aspect, GQDs show integrated characteristics of both carbon dots (CDs) and graphene. Both CDs and GQDs are zero-dimensional carbon-based nanomaterials associated with quantum size and edge effects. GQDs are particularly synthesised from materials in which sp2 carbon atoms are assembled into a graphene structure. The large surface to volume ratio and the structure of graphene allow its easy surface functionalisation. PSL (post synthetic linkers) such as nucleic acids, proteins, antibodies and various other polymers are covalently attached to the surface of graphene, affording a wide verity of biomarker sensors. These properties of GQDs make them superior in the domain of electronic and optoelectronic sensors (Table 2).108–122 The photophysical properties of GQDs are highly dependent on their band gap because of the quantum confinement effect, which is dependent on their shape, size and edge configuration. Due to the key merits of GQDs including their good biocompatibility, water solubility, chemical inertness, ease of functionalization, stable photoluminescence, etc. GQDs are effectively used in the domain of optical biosensing applications via promising signaling mechanisms, such as FRET, IFE, PET, static or dynamic quenching, etc.
| Type of nanomaterials | Targeted analyte | Mode of biosensing | Limit of detection | Linear range | Ref. |
|---|---|---|---|---|---|
| GQDs | Fe3+ | Fluorogenic | 0.45 μM | 0–60 μM | 118 |
| N-GQDs | Fe3+ | Fluorogenic | 0.07 μM | 50–2000 μM | 120 |
| BGQDs | Fe3+ | Fluorogenic | 0.005 ± 0.001 μM | 0.01–100 μM | 121 |
| N-GQDs | Fe3+ | Fluorogenic | 9.7 nM | 20–70 nM | 114 |
| 1–100 μM | |||||
| GQDs | Fe3+ | Fluorogenic | 1.6 μM | 3.5 × 10⁻⁶–6.7 × 10⁻⁴ M | 117 |
| B-GQDs | Fe3+ | Fluorogenic | Fe3+: 31.2 nM | Fe3+: 50 nM–220 μM | 116 |
| Cyt-C | Cyt-C: 5.9 μg mL−1 | Cyt C: 10–300 μg mL−1 | |||
| Phosphate (Pi) | Pi: 340 nM | Pi: 3–40 μM | |||
| (N-GQDs)-Cu2+ | Histidine (His) | Fluorogenic | 72.2 nmol L−1 | 0–35 μmol L−1 | 119 |
| GQDs | Paracetamol (PAR) and ascorbic acid (AA) | Fluorogenic | PAR: 0.022 μg L−1 | PAR: 0.067–233 μg L−1 | 111 |
| AA: 1.05 μg L−1 | AA: 3.33–997.5 μg L−1 | ||||
| GQDs | Dopamine (DA) and ascorbic acid (AA) | Fluorogenic | DA: 0.16 μmol L−1 | DA: 0.5–120 μmol L−1 | 113 |
| AA: 0.021 μmol L−1 | AA: 0.05–6 μmol L−1 | ||||
| GQDs | H2S | Fluorogenic | 0.89 nM | up to ∼1500 nM | 112 |
| GQDs | Ascorbic acid (AA) | Fluorogenic | 0.32 μM | 1.11–300 μM | 110 |
| Tb(III)-GQDs | L-Ascorbic acid (AA) | Fluorogenic | 0.12 μg mL−1 | — | 122 |
| S,N-GQDs | Ascorbic acid (AA) | Fluorogenic | 1.2 μM | 10–500 μM | 115 |
| GQDs | pH | Fluorogenic | — | — | 108 |
| N-GQDs | Tyrosinase (TYR) | Fluorogenic | TYR: 0.15 U mL−1 | TYR: 0.43–3.85 U mL−1 | 109 |
| Acid phosphatase (ACP) | ACP: 0.014 mU mL−1 | ACP: 0.04–0.7 mU mL−1 |
In most of the reported GQDs, it has been observed that a detectable fluorescence response is only obtained in strongly acidic or basic pH, which is not desirable for bioimaging. In this case, recently, Zhou et al. developed a unique nanoprobe based on pH-responsive fluorescent graphene quantum dots (pRF-GQDs), which were synthesized via the electrolysis of graphite rods in an acetonitrile solution of sodium p-toluenesulfonate.108 The as-obtained fluorescent probe could discriminate solid tumors from normal tissues. Herein, pRF-GQDs showed a variation in fluorescence from green to blue below and above pH 6.8, respectively. The proposed mechanism for the fluorescence switch was thought to be that in weakly acidic medium, the protonated pRF-GQDs form intramolecular H-bonding interactions with the adjacent sulfonic oxygen and the disruption of these interactions leads to a fluorescence change from green to blue. This probe was successfully used for in vivo and ex vivo imaging of a mouse model.
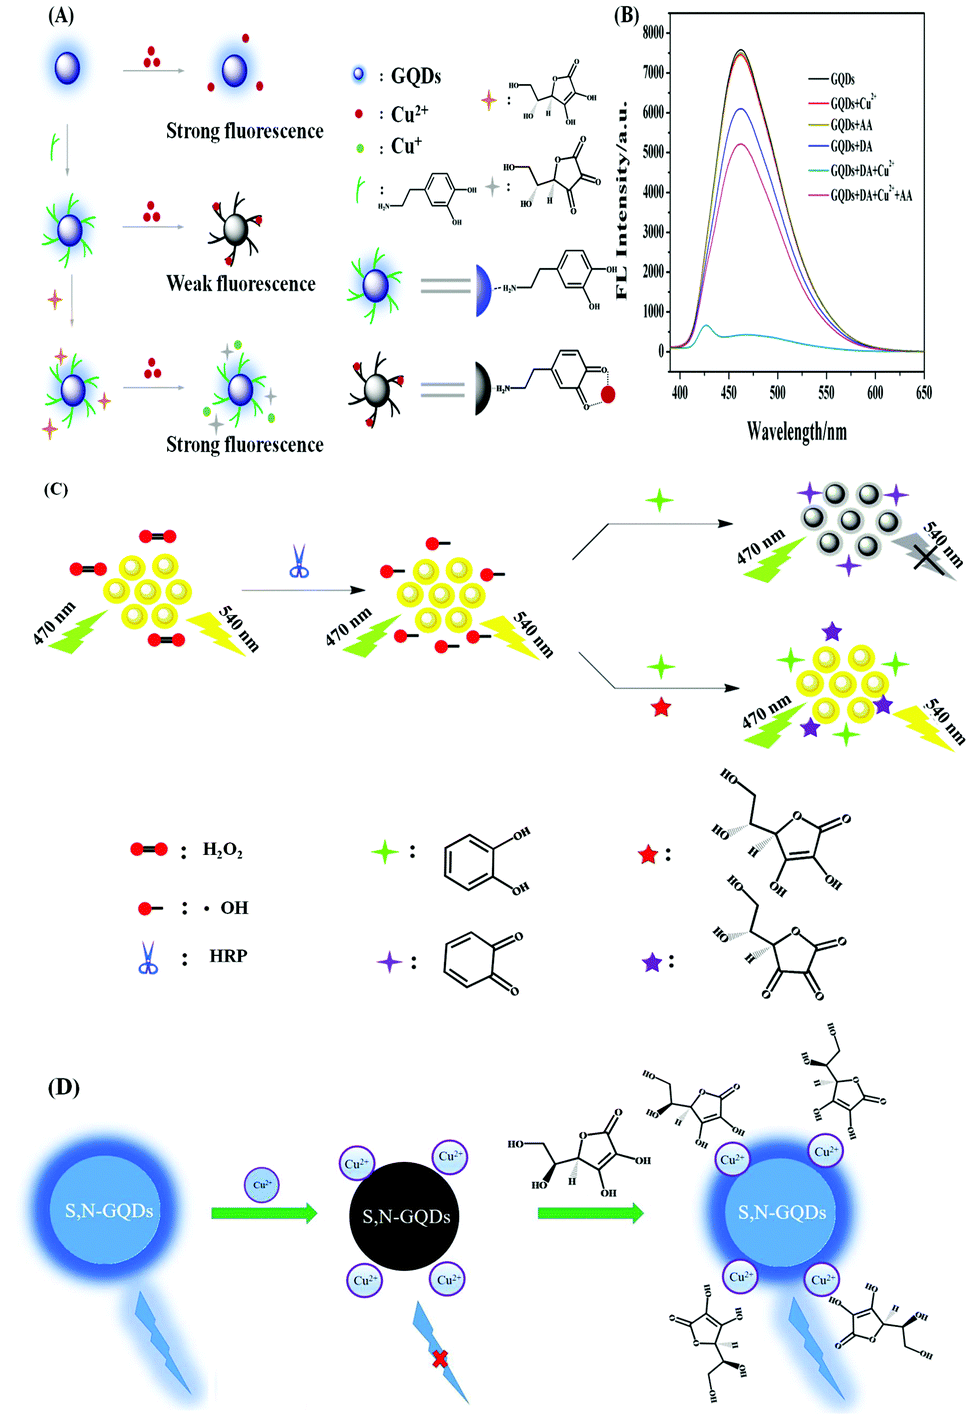
Next, Su et al. developed nitrogen-doped graphene quantum dots (N-GQDs) for the selective recognition of bio-analytes such as acid phosphatase (ACP) and tyrosinase (TYR).109 In the presence of TYR, tyrosine is converted into dopaquinone, which is responsible for the fluorescence quenching of the developed N-GQDs because dopaquinone acted as a good electron acceptor, and expectedly with an increase in the concentration of TYR, the degree of quenching increased. The nature of quenching was observed to be dynamic according to the lifetime values. Interestingly, in the presence of ACP, L-ascorbic acid-2-phosphate (AAP) was hydrolysed into ascorbic acid and L-dopa was produced by the reduction of dopaquinone. As an artefact, the developed N-GQDs regained their fluorescence property. Additionally, real sample analysis was also performed by applying the biosensor for the recognition of TYR and ACP in human serum samples and the appreciable recovery percentage and relative standard deviation (RSD) value indicated the potentiality of the developed probe in real-life applications.
Su et al. developed a GQDs-based system for the selective recognition of ascorbic acid (AA) and dopamine (DA).113 Herein, DA formed a stable DA-GQDs complex via electrostatic and H-bonding interactions. Subsequently, upon the incorporation of Cu2+ in the DA-GQDs complex, the fluorescence of the adduct was quenched due to the oxidation of catechol to o-semiquinone. On the contrary, the addition of AA, helped to regain the inherent fluorescent property of the synthesized GQDs due to reduction of Cu2+ to Cu+ (Fig. 7A and B). Consequently, the formation of o-semiquinone, was hindered, leading to an enhancement in fluorescence. Therefore, a fluorescence “off–on” nanosensor was prepared herein for the detection of DA and AA based on complex formation and oxidation principles. However, it is desirable to detect ascorbic acid without the use of any heavy metal. In this regard, Su et al. developed orange emissive GQDs for the sensitive recognition of ascorbic acid (AA) with an LOD of 0.32 μM (Fig. 7C).110 The optimised reaction conditions involving hydrogen peroxide, horseradish peroxidase (HRP) and catechol were utilised for detecting AA by regaining the inherent fluorescence property of GQDs. Actually, herein, the hydroxyl radicals, produced from H2O2 by the catalysis of HRP, oxidized catechol to o-benzoquinone, which was responsible for the fluorescence quenching of GQDs. However, the presence of AA inhibited the generation of o-benzoquinone by consuming H2O2 and the hydroxyl radicals, which was responsible for the fluorescence recovery of the GQDs. Additionally, the proposed strategy was employed for the recognition of AA in human serum samples and the appreciable recovery percentage and acceptable RSD values confirmed its practical applicability. Again, Su et al. developed polypyrrole/graphene quantum dots (PPy/GQDs) as a “turn-on–off” probe for the detection of paracetamol and ascorbic acid.111 Interestingly, the composite material showed 3-times higher fluorescence compared to the bare GQDs due to the surface passivation of the amino functionalities of PPy. Basically, the fluorescence of the composite material was quenched dramatically due to the electron transfer between PPy/GQDs and N-acetyl-p-benzoquinone (4-AOBQ), which was produced by the oxidation of paracetamol (PAR). The inherent fluorescent property of PPy/GQDs was regenerated in presence of ascorbic acid (AA) by the reduction of 4-AOBQ. The detection of the targeted bio-analytes was also successfully checked in human serum samples.
 | ||
| Fig. 7 (A) Schematic process path for recognising AA by fluorescent GQDs. Adopted with permission from ref. 110. (B) Schematic illustration of the recognition mechanism. (C) Fluorescence spectra of the GQDs and their composite systems, as described in the graph. Concentration: 40 μmol L−1 of Cu2+, 120 μmol L−1 of DA, and 6 μmol L−1 of AA. Adopted with permission from ref. 113. (D) Detection mechanism of AA through “off–on” mode. Adopted with permission from ref. 115. | ||
Chen et al. developed GQDs functionalised with (2,4-dinitrophenoxy)tyrosine (DNPTYR) for the selective recognition of H2S, which is an important gaseous signaling molecule.112 Herein, DNPTYR carries an electron-withdrawing dinitrophenoxyl group, which is responsible for the PET-assisted fluorescence quenching of GQDs. Upon the addition of H2S to the developed system, the dinitrophenoxyl group was cleaved, which recovered the initial fluorescence of the system via termination of the PET process, thereby producing a “turn-on” fluorescence response. The LOD was determined to be 2 nM and the nanoprobe was applied for real-time intracellular H2S level monitoring through real-time imaging in MCF-7 cells.
Salavati-Niasari et al. synthesised sulfur and nitrogen-doped GQDs (S, N-GQDs), wherein citric acid and thiourea were utilised as C, N and S sources, respectively.115 The developed system was utilised for the detection of ascorbic acid (AA) based on the “off–on” detection mode with an LOD of 1.2 μM. Briefly, upon the introduction of Cu2+ in the S, N-GQDs solution, the fluorescence was quenched by the coordination of Cu2+ with the surface functional groups of GQDs; however, the addition of AA to the Cu2+/S, N-GQDs system promoted the inherent photoluminescence of GQDs due to the gradual detachment of Cu2+ from the surface of S,N-GQDs (Fig. 7D).
Next, Ai et al. developed nitrogen-doped GQDs, i.e., N-GQDs, utilising sodium citrate and triethanolamine as the precursors.114 Herein, the N-GQDs showed bright blue fluorescence with a quantum yield of 8% and good pH stability (Fig. 8). Interestingly, in the presence of Fe3+, the fluorescence of N-GQDs was quenched via static quenching due to the formation of a non-fluorescent ground state complex, which was also confirmed by the lifetime data. The LOD was found to be 9.7 nM and the designed nanomaterial was utilised for the selective recognition of Fe3+ in various real water samples to expediate its practical applicability.
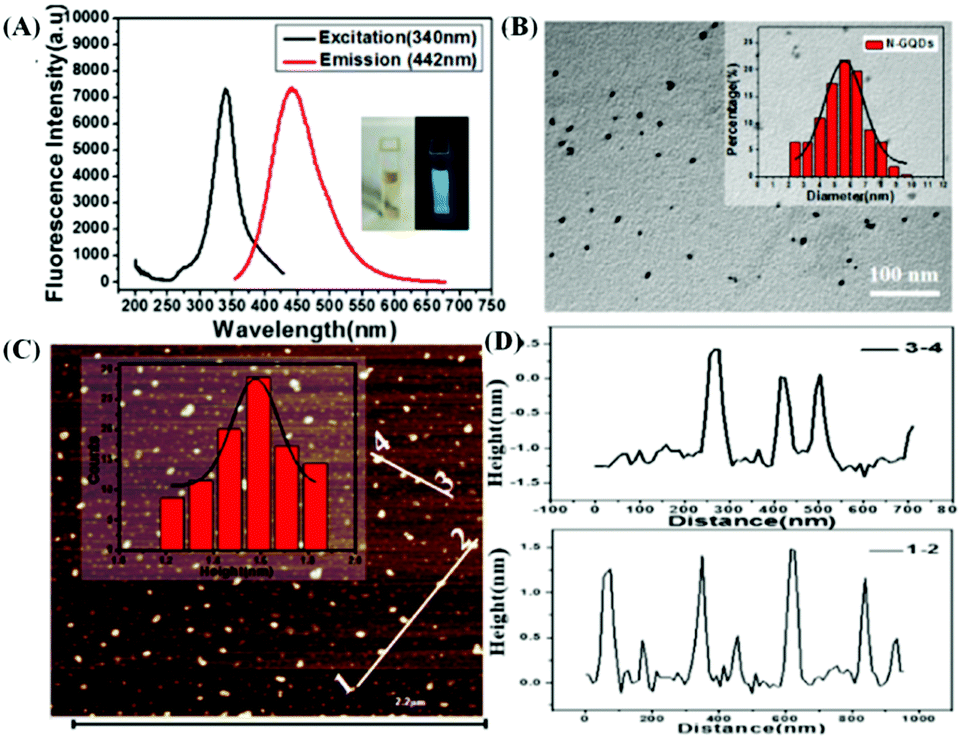 | ||
| Fig. 8 (A) Fluorescence spectra of N-GQDs (excitation wavelength: 340 nm and emission wavelength: 442 nm). (B) TEM image and size distribution of N-GQDs. (C) AFM image on maria substrate. (D) Height profiles along the lines in (c). | ||
Dong et al. synthesised boron-doped GQDs (B-GQDs) for the selective recognition of Fe3+ and Fe3+-rich Cyt-C with an LOD of 31.2 nM and 5.9 μg mL−1, respectively, with the indirect detection of phosphate (Pi).116 Doping with boron led to greenish fluorescence with a high quantum yield of 16.8%, which was quenched in the presence of Fe3+ or Fe3+-containing protein, which was not due to electron transfer, as confirmed from the lifetime data. Actually, in the presence of Fe3+, the aggregation of B-GQDs (evidenced from DLS) occurred via the coordination of Fe3+ with the surface functional groups, which was mainly responsible for the observed quenching. However, in the presence of Pi, the disaggregation of B-GQDs occurred, which was beneficial to regain the inherent fluorescence of B-GQDs. Moreover, the detection of the targeted analytes was also done in real water samples, increasing the importance of the present work.
Next, Liao et al. developed GQDs having blue fluorescence with a quantum yield of 27.4%.117 The presence of Fe3+ led to the quenching of the blue fluorescence, and according to the fluorescence titration data, the LOD was found to be 1.6 μM. Basically, the GQDs in the excited state collide with Fe3+, causing quenching of the fluorescence intensity of GQDs via non-radiative transitions to the ground state, leading to aggregation-induced quenching. Furthermore, the detection of Fe3+ was carried out in real water samples, indicating the potentiality for environmental monitoring.
3.3 Inorganic quantum dots (IQDs)
Among the various types of quantum dots, CdTe/CdSe are type 2 band-engineered quantum dots.123 CdSe quantum dots (QDs) are obtained by simultaneously injecting a solution of cadmium (Cd) and selenium (Se) as precursors into a heated growth solution of octadecene under ambient conditions. Alternatively, CdTe is a stable crystalline compound, which is obtained from cadmium (Cd) and tellurium (Te). It is basically applied as a semiconductor such as infrared optical window material and photovoltaics. It is commercially available as a powder or crystals and it can also be made into nanocrystals. CdTe shows fluorescence at 790 nm. As the size of the CdTe crystals decrease to a few nanometers or less, CdTe quantum dots exhibit a shift in their fluorescence emission peak from the visible to the ultraviolet range.124a They are chemically more stable than their parent compounds because of their insolubility and high melting point. CdTe is not harmful if it is ingested or in contact with the skin. These types of QDs can act as efficient FRET donors compared to traditional organic dye molecules due to their excellent size-tunable luminescence properties, high photostability, high resistance to photobleaching, broad excitation spectra, high quantum yield, long fluorescence life-time, narrow symmetric emission spectra,etc.124b,c The emission property of QDs is generally generated from the recombination of photogenerated electron-hole pairs, which can be tuned in different ways. QDs can be conjugated with other metallic nanoparticles, which are fluorescence quenchers, and therefore this combination leads to an effective FRET process in the resulting binary quantum dots (QDs).124d Subsequently, interaction with the targeted analytes may lead to a ratiometric fluorescence response by tuning the distance of the donor–acceptor and the overlapping region of the donor emission with the acceptor absorption. By combining additional metals (Zn, Mn, etc.) in binary QDs, ternary alloyed QDs can also be prepared, which feature better photostability, narrower emission band, broader excitation spectra, etc. These characteristics may improve the sensitivity or specificity of the designed biosensors.124e Again, QDs may be coated with other organic molecules, where photoinduced electron transfer may take place to the valence band of the excited QDs, thereby resulting a reduction in fluorescence. However, upon the interaction of the targeted analytes with the coating material, the initial fluorescence of the QDs is revived due to the restriction of the PET process to generate an “off–on” or “on–off’-type fluorescence response.124f,g QDs can also be conjugated with different ligands, such as thiols, to increase their stability. Recently, QDs have been extensively used for sensing various biomolecules, such as ascorbic acids, proteins, tumor markers, glucose, dopamine, and biothiols such as Cys, GSH etc (Table 3).125–143| Type of nanomaterials | Targeted analyte | Mode of biosensing | Limit of detection | Linear range | Ref. |
|---|---|---|---|---|---|
| QDs/CDs@MOFs | Ascorbic acid (AA) | Fluorogenic | AA: 4 nM | AA: 0.01–0.2 μM | 125 |
| Ascorbic acid oxidase (AAO) | AAO: 0.02 U L−1 | AAO: 0.05–4.0 U L−1 | |||
| CdTe | Ascorbic acid (AA) | Fluorogenic | AA: 3 μM | AA: 0–800 μM | 126 |
| Alkaline phosphatase (ALP) | ALP: 0.25 U L−1 | ALP: 1–1000 U L−1 | |||
| CdTe QDs | Captopril (CTP) | Fluorogenic | — | CTP: 0.025–0.250 mmol L−1 | 127 |
| glutathione (GSH) | GSH: 0.025–0.175 mmol L−1 | ||||
| Cys | L-Cys: 0.025–0.175 mmol L−1 | ||||
| Thiomalic Acid | |||||
| Coenzyme A | |||||
| CdSe@SiO2@CdTe | Glutathione | Fluorogenic | 42 nM | 0.1–10 μM | 131 |
| CdTe-AuNPs | tumor marker | Fluorogenic | 400 pg mL−1 | 0.5–45 ng mL−1 | 128 |
| Red QDs (CdSe/ZnS QDs)-green QDs (ZnCdSeS/ZnS QDs | Serum amyloid A (SAA) | Fluorogenic | SAA: 2.39 ng mL−1 | SAA: 10–1000 ng mL−1 | 129 |
| C-Reactive protein (CRP) | CRP: 6.37 ng mL−1 | CRP: 10–1000 ng mL−1 | |||
| CdTe QDs | H2O2 | Fluorogenic | 0.3 μM | 10–125 μM | 130 |
| CdZnTeS QDs | Dopamine (DA) | Fluorogenic | DA: 1.93 nM | DA: 10.0–1000.0 nM | 132 |
| Tyrosinase (TYR) | TYR: 1.05 ng mL−1 | TYR: 10.0–100.0 ng mL−1 | |||
| CdZnTe QDs-AuNPs | Aflatoxins B1 | Fluorogenic | 20 pg mL−1 | 50 pg mL−1–100 ng mL−1 | 133 |
| CdS–CdTe QDs | Glucose | Fluorogenic | Above 500 μM in Planta | In vitro 100–1000 μM | 134 |
| In vivo 500–1000 μM | |||||
| CdSe/ZnS QDs | Alzheimer's disease-related Aβ1–42 | Fluorogenic | 1.7 pM (7.6 pg mL−1). | 5.0–100 pM | 135 |
| (0.023–0.45 ng mL−1) | |||||
| CdTe QDs-AuNPs | OmpW antigen of Vibrio cholerae | Fluorogenic | 2 nM | 2–10 nM | 136 |
| CdSe QDs-CQDs | Tuberculosis (TB) biomarker | Fluorogenic | — | — | 138 |
| CdTe QDs-AuNPs | Guanine | Fluorogenic | — | 0.80 nmol mL−1–0.53 μmol mL−1 | 137 |
| CdTe QDs-AuNPs | Arginine | Fluorogenic | 5.6 μg L−1 | 16–121 μg L−1 | 139 |
| ZnS QDs | Arginine | Fluorogenic | — | 1.0–10−4 M | 140 |
| CdSe, CdSe/ZnS and CdSe/CdS | Protein | Fluorogenic | 2.84 × 10⁻¹¹ ML−1 | — | 141 |
| CdTe QDs | L-Cysteine | Fluorogenic | Cys: 10.5 ng mL−1 | Cys: 0.02–40 μg mL−1 | 142 |
| Glutathione | GSH: 8.2 ng mL−1 | GSH: 0.02–50 μg mL−1 | |||
| Mn2+-ZnSe/ZnS@SiO2 | Thiol | Fluorogenic | — | — | 143 |
Ascorbic acid (AA) is one of the most important nutrients in the human body as it plays a pivotal role in different physiological functions such as anti-oxidant effects, immunity improvement, etc.144 Ascorbic acid oxidase (AAO), an enzyme containing copper ions, can catalyze the redox reaction between oxygen and AA to generate dehydroascorbic acid (DHA) and water.145 In this regard, Su et al. reported the preparation of a ratiometric fluorogenic nanosensor, QDs/CDs@MOFs, via the combination of thioglycolic acid (TGA)-capped CdTe QDs, CDs and zeolitic imidazolate framework-8 (ZIF-8) for the sensitive detection of AA and AAO.125 Herein, the MOF-based nanoprobe was developed by integrating the interesting features of carbon dots and QDs to prevent the agglomeration of the nanomaterial, which also presented a fascinating stimulus-responsive ratiometric response. Initially, Hg2+ quenched the red emission of the QDs via electron transfer and ion-binding process, while in the presence of AA, the initial fluorescence of the nanosensor assembly was restored via the redox reaction between AA and Hg2+ to exhibit an “off–on” response. The fluorescence was again quenched in the presence of AAO to exhibit an “off–on–off” response due to the oxidation of AA to dehydroascorbic acid (DHA). Throughout the sensing event, the fluorescence of the CDs remained constant, which was helpful to use them as a reference standard. Interestingly, the nanosensor could also be used satisfactorily for the detection of AAO in human serum samples.
Similar to AA, alkaline phosphatase (ALP) is also an essential coenzyme and enzyme present in multiple metabolic processes in the human body.146 Thus, an abnormal level of these molecules causes various disorders, which necessitates their sensitive detection. Among the various sensing approaches based on QDs, the cation exchange reaction based on distinguishing the capability between Ag+ and AgNPs is one of the important strategies for quantitative biosensing applications. In this perspective, Wu and Geng et al. proposed the sensitive fluorogenic recognition of AA and ALP based on the selective quenching of CdTe QDs by Ag+via fast cation exchange reaction.126 Based on the controlled production of AgNPs by the reduction of Ag+ by AA, this strategy could be efficiently exploited for the “turn on” fluorescence detection of AA. Alternatively, using AA as a mediator, this strategy was also useful for assaying ALP via the ALP-catalysed hydrolysis of L-ascorbic acid-2-phosphate (AAP) to produce AA. The developed label-free nanosensor was effectively utilized for the recognition of ALP and AA in human serum samples and fruit juice, respectively.
Captopril (CTP), glutathione (GSH), L-Cys, thiomalic acid and coenzyme A are several bioactive thiols in various pharmaceutical applications.127a In this regard, Santos et al. reported the fluorogenic recognition of these biothiols based on the enhancement of the quantum yield of QDs, agglomeration of AuNPs, nanoparticle detachment, etc. to reverse the FRET process, operating between CdTe QDs and AuNPs.127a AuNPs are emerging fluorescence quenchers in the FRET process, replacing the traditional organic quenchers. The high molar extinction coefficient value and broad absorption spectrum in the visible window of AuNPs, which overlaps with the emission spectrum of QDs like FRET donors, make them promising FRET acceptors.127b Moreover, surface modification is another important parameter to achieve an effective FRET process. Herein, effective FRET donor–acceptor assemblies were also acquired via the combination of mercaptopropionic acid (MPA)-capped CdTe QDs and cysteamine (CS)-capped AuNPs. However, in the presence of the targeted biothiols, the FRET process was hampered and accordingly the emission property of the CdTe QDs was modulated. This method acquired the linear detection range of 0.025–0.250, 0.025–0.175 and 0.025–0.175 mmol L−1 for CTP, GSH and L-Cys, respectively, making it easy to implement and presenting valuable analytical working ranges and sensitivity. Again, Wang and Fan et al. proposed the use of a dual-emission ratiometric fluorescent probe (CdSe@SiO2@CdTe) for the naked-eye “turn-on” recognition of glutathione (GSH) with an LOD of 42 nM.131 Herein, the CdSe QDs were coated with silica (SiO2) spheres, then conjugated with CdTe QDs and functionalized with N-acetyl-L-cysteine (NALC), which is more eco-friendly and stable than the usually employed MPA stabilizer, to ultimately obtain a tunable fluorescence response. Initially, the red emission of the CdTe QDs was quenched in the presence of Hg2+ by both electron transfer and ion binding processes due to the interaction of the amino and surface sulfydryl groups in NALC with Hg2+. However, in the presence of GSH, the red emission was again restored via the stronger interaction of Hg2+ and GSH than the amino groups of NALC. This hybrid nanosensing strategy was also exploited for the evaluation of GSH in real vegetable and fruit samples.
Hepatocellular carcinoma (HCC) is one of the major malignant tumors, where alpha-fetoprotein (AFP) is one of the important tumor biomarkers for the diagnosis of HCC and post-operative management.147 Currently, the aptamer-based sensing strategy has become an important biosensing platform for targeted bio-analytes. In this regard, Jin and Ruan et al. exhibited a fluorescent sandwich aptasensor for the “turn-off” recognition of the tumor marker AFP based on the FRET between the energy donor, AFP aptamer-tagged luminescent CdTe quantum dots (QDs), and the energy acceptor, anti-AFP ab-functionalized gold nanoparticles (AuNPs), due to the stronger bio-affinity of aptamer-AP-antibody.128 To resist the agglutination of the particles, SiO2 nanospheres were used to coat the CDs. The proposed aptasensor also exhibited excellent results for the detection of AFP in human serum samples, indicating its great potential for carcinoma screening.
Serum amyloid A (SAA) and C-reactive protein (CRP) are important inflammation biomarkers. An elevated level of SAA is related to acute bacterial infection,148 while a low level of C-reactive protein (CRP) may be responsible for the pathogenesis of cardiovascular events.149 Most of the developed sensing methods are responsive to a particular biomarker. However for clinical accuracy, it is desirable to use multiple biomarkers to obtain a clear idea about the stages of pathogenesis, which is obviously a challenging task. Moreover, quantitative detection and reproducibility are also important factors to be considered. In this regard, Wu, Li and Guo et al. reported a dual quantum dots-based immunosorbent assay, red QDs (CdSe/ZnS QDs) and green QDs (ZnCdSeS/ZnS QDs), for the sensitive and simultaneous fluorogenic recognition of the inflammation biomarkers SAA and CRP.129 A single sample well was coated with two types of antibodies, which underwent simultaneous interactions with the targeted biomarkers. Moreover, the nanosenor could be effectively applied for the recognition of the biomarkers in real human negative serum samples, which will be highly beneficial for in vitro diagnostics (IVD), biomedicine, food safety, environmental monitoring, etc.
H2O2 is one of the main biologically reactive analytes in the human body and plays a key role in different biological procedures, which necessitates low-cost, selective and sensitive methods for its detection.150 Recently, Wang et al. reported the ratiometric “turn-off” fluorescence determination of H2O2 based on the unique combination of green-emitting CdTe QDs and red-emitting CdTe QDs.130 Herein, they showed that the selectivity could be tuned by using QDs with different sizes without any surface modification. In the presence of H2O2, the fluorescence was quenched via the transfer of electrons from QDs to H2O2, followed by H2O2-induced aggregation of the QDs, and the extent of fluorescence quenching was also driven by the size of the QDs to ultimately produce a ratiometric response.
Tyrosinase (TYR) is a copper-containing enzyme that exists in various organisms, which is known as an important biomarker for human malignancy.132 On the other hand dopamine (DA) is a significant hormonal neurotransmitter, which plays a significant role in many biological processes. Therefore, abnormal level of DA is related to various diseases, such as Huntington's disease,151 Parkinson's disease, etc.152,153 which necessitates the quantitative monitoring of DA in different body fluids by fluorometric methods, particularly by ratiometric response. However, most of QDs that produce highly selective and sensitive ratiometric responses are obtained via multi-step synthetic procedures. In this regard, He et al. reported the preparation of ROx-DNA-functionalized CdZnTeS quantum dots (QDs) (where ROx is a commercially available fluorophore) via a one-pot synthetic route for the sensitive detection of dopamine (DA) and tyrosinase (TYR).154 QDs and ROx could both be excited at a single wavelength, enabling the biosensor to exhibit a ratiometric response. Herein, TYR catalyzed the oxidation of DA to DA quinone, the absorption spectrum of which overlapped with the emission spectrum of QDs. Additionally, the short distance between DA quinone and the QDs also facilitated the occurrence of the FRET process. Moreover, the PET process from the QDs to DA quinone was responsible for quenching the emission of the QDs. Throughout the process, the fluorescence of ROx remained constant, while the QDs exhibited stimuli-responsive enhanced or quenched fluorescence, which was ultimately beneficial for the functionalized QDs to act as a ratiometric fluorescence probe. The obvious change in the lifetime values before and after sensing was consistent with the dynamic quenching process in the present work. The sensing strategy was also evaluated by the satisfactory detection of DA and TYR in real human serum samples.
Aflatoxins are a group of secondary metabolites of mycotoxins, which are generally generated by Aspergillus flavus and Aspergillus parasiticus. Among the various types of aflatoxins, aflatoxin B1 (AFB1) is the most common and toxic one because it prohibits RNA synthesis.155 Immunoassay using AFB1-specific antibody is widely used for its detection. However, aptamer-based fluorescence detection is more desirable in terms of cost and stability during storage. In this regard, Qian and Wang et al. reported a fluorescence aptasensor based on MPA-capped CdZnTe QDs and Au nanoparticles (AuNPs) conjugated with thiol group-modified complementary DNA for the trace determination of AFB1 with high sensitivity and selectivity via the FRET process with a linear range of 50 pg mL−1–100 ng mL−1 and limit of detection of 20 pg mL−1 (Fig. 9A).133 In the present system, DNA hybridization in the system helped to initiate the FRET process by bringing the donor QDs and acceptor AuNPs in close proximity. However, upon the binding of the aptamer with AFB1, FRET was hindered, which regenerated the fluorescence of the QDs. The sensor was also used to investigate the presence of AFB1 in real agricultural products such as peanut samples.
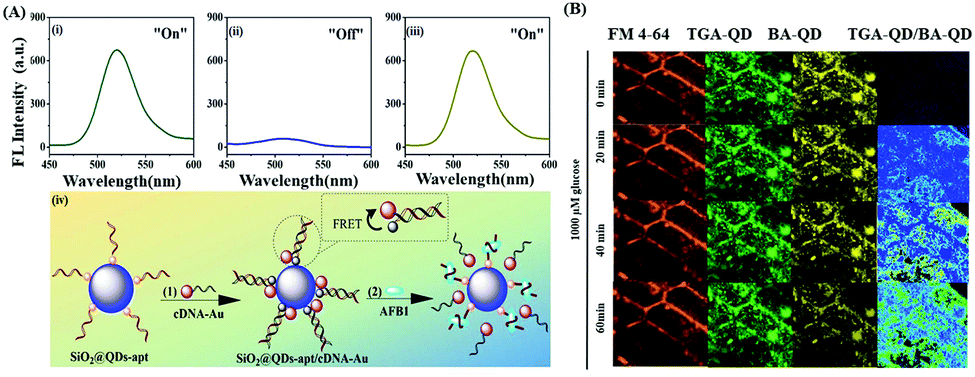 | ||
| Fig. 9 (A) Fluorescence spectra of (i) SiO2@QDs-apt and SiO2@QDs-apt/cDNA-AuNPs (ii) before and (iii) after incubation with 100 ng mL−1 of AFB1. (iv) Schematic illustration of aptasensor fabrication and sensing mechanism. Adopted with permission from ref. 133. (B) In vivo sensing of glucose in algae (Chara zeylanica) by TGA-QD and BA-QD probe. Adopted with permission from ref. 134. | ||
Glucose is one of the main components that controls plant growth through the formation of complex intracellular signal transduction pathways.156 However, the nanomaterials-based in vivo destection of glucose in photosynthetic organisms is rarely explored. In this regard, Giraldo et al. reported a ratiometric optical nanoprobe based on boronic acid (BA) and thioglycolic acid-conjugated QDs as a standoff optical monitoring tool for the sensitive “turn-off” fluorescence recognition of glucose in photosynthetic tissue based on the specific interaction of BA with the two pairs of cis diols groups of glucose (Fig. 9B).134 The interaction of glucose resulted in the aggregation of BA-QDs, which induced the corresponding fluorescence quenching by excitation energy transfer and electronic coupling between the QDs in close proximity (<10 nm). Therefore, the developed portable glucose sensing approach is a value-added addition in the domain of photosynthesis research.
Alzheimer's disease (AD) is a neurological disorder leading to memory loss, anxiety, etc. Amyloid-beta peptide 1–42 (Aβ1–42) is the basic component of amyloid plaques related to this disease.153 In this regard, Zheng et al. reported the preparation of a streptavidin-functionalized quantum dots and dual antibody (C-terminal antibody (C-Ab) and biotinylated N-terminal antibody (N-Ab))-based sandwich immunoassay for the fluorogenic recognition of the Alzheimer's disease-related peptide biomarker Aβ1–42 with a linear range of 5.0–100.0 pM.135 Herein, the QDs act as fluorescent labels for the quantification of Aβ1–42, which was also free from the magnetic separation in the previous sandwich assay approaches for the detection of Aβ1–42. This method was also successfully applied for the recognition of Aβ1–42 in a human cerebrospinal fluid sample (CFS), which may pave the way for the diagnosis of AD.
Bacteria possess a bacterial cell membrane and cell wall around their outer side. Their cell membrane is based on the fluid mosaic model (protein-lipid-protein), indicating that lipids are incorporated inside a layer of proteins. These proteins are called outer membrane protein W (OmpW). In comparison to lateral flow immunoassay or enzyme-linked immunosorbent assay (ELISA), FRET-based homogeneous immunoassay is advantageous for the detection of OmpW, which does not require washing or separation steps.136a In this regard, Rezayan et al. reported a competitive CdTe QDs and AuNPs-based fluorescence probe for the ratiometric recognition of OmpW antigen of whole V. cholerae bacterial cells via the FRET process with a linear range of 2–10 nM and detection limit of 2 nM.136b Upon the interaction of the AuNPs-conjugated OmpW antigen with the specific antibody bound to carboxyl-functionalized CdTe QDs, the distance between the QDs and AuNPs was close enough to facilitate the FRET process, resulting in fluorescence attenuation via energy transfer from the QDs to AuNPs. The addition of free OmpW led to the revival of the initial fluorescence due to the increasing competition between the free and conjugated OmpW, causing the detachment of Au-OmpW from CdTe-anti-OmpW. Thus, the developed FRET based assay can also be extended to the detection of various targeted bio-analytes such as toxins and bacterial virulence factors.
Tuberculosis (TB) is a type of lung disease that can be potentially diagnosed via the quantitative detection of tuberculosis volatile organic biomarkers (VOBs). Current technologies include aeoNose (The eNose Company), breathalyzer (Rapid Biosensor Systems), prototype breathalyzer (Next Dimensions Tech), breath analysis instrument (Metabolomx) etc., which rely on the principle of gas chromatography flame ionization (GC-FID), surface acoustic wave detection (GC-SAW), etc. However, they are not efficient enough to analyse the specific VOBs present in the exhaled breath of TB patients. In this regard, Sarswat et al. reported a stable colloidal suspension of CdSe QDs together with CDs as a viable photoluminescent platform.138 Methyl nicotinate, methyl anisate, etc. are the major VOBs present in the breath. The CDs exhibited selective quenching in the presence of methyl nicotinate or methyl anisate due to non-radiative electron transfer to the CDs, while the observed fluorescence spectral shift of the QDs in the presence of pyridine was because of the formation of a charge transfer excited state. Overall, an algorithm could be created for the quantification of TB VOBs.
Guanine is one of the important nitrogen bases of DNA. Łańcucka et al. synthesized CdTe QDs and AuNPs as a selective and sensitive “turn-on” fluorescent assay for the detection of guanine, which was also effectively employed for guanine recognition in real samples using simulated urine conditions.137 Herein, TPA and guanine-functionalized QDs and cytosine-functionalized AuNPs underwent specific bio-interaction to produce a QDs-guanine-AuNPs-cytosine assembly, thereby facilitating the FRET process, which was approved by both distance and spectral overlap. However, in the presence of the targeted guanine, the FRET process was hampered to produce a “turn-on” fluorescence response, resulting in a low possibility of false positive signals. The sensitivity of the developed nanoassembly has also been employed towards the detection of guanine in a simulated urine environment.
Arginine (Arg) plays an important role as an anti-oxidant and blood pressure regulator, and thus its detection is very important.139 Furthermore, cancer can be diagnosed by investigating the concentrations of arginine in the blood. In this regard, Ren et al. reported the preparation of a fluorescence nanoprobe via the combination of thioglycolic acid (TGA)-capped CdTe-QDs and AuNPs for the selective fluorescence “turn on” detection of Arg via Arg-induced aggregation of AuNPs with promising real field biological applications.139 Herein, the intense absorption of AuNPs was initially responsible for the IFE process, leading to the quenching of the fluorescence of the QDs. However, in the presence of Arg, the specific interaction of Arg with the carboxyl groups of the citrate-capped AuNPs occurred via hydrogen-bonding and electrostatic interactions. This resulted in a decrease in the absorption of the AuNPs, leading to the inhibition of IFE, which was ultimately helpful for the regeneration of the initial fluorescence of the QDs. This method was employed for the detection of Arg in blood plasma samples with good accuracy. Again, Verma et al. reported the fluorogenic detection of arginine using the unique combination of Mn-doped ZnS QDs and arginine deaminase enzyme with a linear detection range of 1.0–10−4 M.140 Additionally, the newly synthesized biosensor was exploited for monitoring Arg in different fruit juice samples, such as watermelon, pomegranate, orange and guava.
Chen et al. reported the use of a mercaptopropionic acid (MPA) and crystal violet (CV)-functionalized CdTe quantum dots (QDs) based “turn-on” fluorescent probe for the recognition of Cys and GSH.142 CV led to the quenching of the initial fluorescence of the QDs due to the specific electrostatic interaction and FRET between CV and MPA. However, in the presence of Cys or GSH, MPA was separated from the QDs due to the better interaction of biothiols with Cd2+ than that of MPA. Meanwhile, CV was also detached from the QDs as MPA and CV were inter-linked. Therefore, the fluorescence was again revived. In addition, biothiols were investigated using the developed nanoprobe in real human urine samples with a recovery in the range of 97.3–105.8%. Thus, the low cost and high sensitivity of the newly synthesized QDs make them an efficient candidate for the analysis of Cys and GSH in environmental and physiological samples.
3.4 Magnetic nanoparticles (MNPs)
Magnetic nanoparticles (MNPs) based biosensing is a burgeoning research interest in the sensing area due to their increased sensitivity, short-time analysis, low detection threshold value, elevated signal-to-noise ratio, high mass transference, large surface area, etc.157a,b MNPs, having a size between 10 nm to 20 nm display the best characteristics due to their supermagnetism under an applied field for a fast sensing response.158 Moreover, they are particularly interesting in the domain of solution-phase sensing due to their ease of separation.157c It has been observed that magnetic nanoparticles based on spinel ferrites, i.e., ferric oxide connected with different metal nodes (MFe2O4, where M = Zn, Cd, Ni, Co, Mn, etc.), exhibits morphology-tunable oxidase-like activity, which has attracted the attention of researchers in the current scenario. The catalytic activity of ferrites is mainly driven by Fe3+, which exhibits Fenton reactions to degrade target-specific organic substances. During catalytic reactions, H2O2 is adsorbed on the surface of the nanoparticles, which is then easily reduced to hydroxyl radicals by the redox reaction of Fe3+. To visualize the extent of the catalytic reactions, various chromogenic substances are used, which can help quantify the target analytes.157c In some cases, it has been observed that ferrites undergo aggregation at a certain level, leading to a decrease in their catalytic efficiency.157d Thus, to overcome this issue, MNPs are combined with other nanomaterials, such as graphene oxide,157e graphitic carbon nitride,157f and multiwalled carbon nanotubes,157g or even MoS2157hetc. to increase their catalytic efficiency by increasing their surface area. Presently, MNPs have engaged as significant probes for the detection of various biomolecules such as ascorbic acid, glucose, dopamine, H2O2, etc. via mostly the chromogenic method, utilizing their peroxidase-mimic activity (Table 4).159–165| Type of nanomaterials | Targeted analyte | Mode of biosensing | Limit of detection | Linear range | Ref. |
|---|---|---|---|---|---|
| MnFe2O4 | Glucose | Chromogenic | 0.7 μM | 0.5–16.0 μM | 160 |
| MoS2@CoFe2O4 | Cysteine (Cys) | Chromogenic | Cys: 0.10 μM | Cys: 0.5–15.0 μM | 159 |
| Glutathione (GSH) | GSH: 0.21 μM | GSH: 0.5–35.0 μM | |||
| Fe3O4@Au | Reduced glutathione (GSH) | Chromogenic | 0.013 μmol L−1 | 0–0.25 mmol L−1 | 161 |
| NF-PANI | Ascorbic acid (AA) | Chromogenic | 232 nM | — | 162 |
| R-Co3O4 | Glucose | Chromogenic | Glucose: 3.2 × 10⁻⁷ mol L−1 | Glucose: 1–20 μM | 163 |
| H2O2 | H2O2: 4.3 × 10⁻⁷ mol L−1 | H2O2: 1–30 μM | |||
| 0.15Fe-doped CoO NCs | H2O2 | Chromogenic | H2O2: 4.40 μM | H2O2: 6–20 μM | 164 |
| Dopamine (DA) | DA: 1.99 μM | DA: 2–10 μM | |||
| Fe3O4@SiO2@Au | H2O2 | Chromogenic | H2O2: 6 × 10⁻⁷ M | H2O2: 1 × 10⁻⁶–4 × 10⁻⁵ M | 165 |
| Glucose | Glucose: 3.5 × 10⁻⁶ M | Glucose: 5 × 10⁻⁶–3.5 × 10⁻⁴ M | |||
| Fe3O4/m-GC | Glucose | Chromogenic | 0.24 μM | 0.5–200 μM | 169 |
Glucose acts as an energy source in the human body and an abnormal level of glucose in the blood is related to the most common disease, diabetes.166 In this regard, recently, Wu et al. synthesized mesoporous MnFe2O4 magnetic nanoparticles (mMnFe2O4 MNPs) via a one-step green method, showing high indispensable peroxidase activity, homogeneous distribution, enhanced stability, and quick separation.160 The as-synthesized MNPs were used for the chromogenic detection of glucose indirectly. The oxidation of glucose catalysed by glucose oxidase (GOx) promoted H2O2 to produce hydroxyl radicals (˙OH), which can oxidize 3,3′,5,5′-tetramethylbenzidine (TMB) in the presence of the mMnFe2O4 MNP nanozyme to form a blue colour (due to the formation of oxidation product of TMB, OxTMB) within a few minutes, leading to the highly selective and sensitive on-site detection of glucose with a detection threshold of 0.7 μM. Therefore, the reported magnetic nanoparticles exhibited intrinsic horseradish peroxidase (HRP)-like activity. It is worth mentioning that the glucose detection capacity of this nanoprobe was also investigated using real human urine samples, exhibiting its application for real field diagnosis of diseases.
Again, the deficiency in biothiols (e.g., cysteine (Cys), glutathione (GSH), etc.) has been linked to various chronic diseases.167,168 Yu et al. reported a flower-like nanozyme based on CoFe2O4 modified with MoS2 for the chromogenic determination of Cys and GSH via a redox interaction, where the hydroxyl generated from H2O2 formed a blue colour in the presence of TMB.159 However, in the presence of the targeted biothiol, the redox reaction was inhibited due to the competition of TMB with biothiols, ultimately nullifying the chromogenic reaction. This synthesized sensor responded to cysteine and glutathione in the linear range of 0.5–15 μM and 0.5–35 μM, with an LOD of 0.10 and 0.21 μM, respectively. This sensing mechanism not only provided high sensitivity, strong catalytic effect and dynamic property, but was also employed in real tests of Cys in serum, acting as a potential biomarker.
Alternatively, Huanan et al. proposed a straightforward and prompt strategy for the chromogenic recognition of reduced GSH based on an Fe3O4@Au nanocomposite, which acts as one of the most important enzymes due to the presence of increased number of active sites, high specific surface area, etc.161 This nanoprobe exhibited inherent peroxidase-like activities, resulting in the generation of ˙OH by the oxidation of H2O2, which generated green coloration from colorless due to the oxidation of ABTS (ABTS = 2,2′-azino-bis-(3-ethylbenzothiazoline-6-sulfonic acid)) to OxABTS. However, in the presence of GSH, the chromogenic alteration was observed to be green to colorless. A smartphone-based detection strategy was also developed herein based on RGB (red-green-blue)-based chromogenic changes to quantify the presence of GSH. This nanoprobe achieved the highly sensitive and on-site quantitative detection for GSH, having a linear range of 0–0.25 mmol L−1 with an LOD of 0.013 μmol L−1. Interestingly, this as-synthesized nanosensor was used in a wheat flour sample for the detection of GSH to prove its applicability in real samples (Fig. 10).
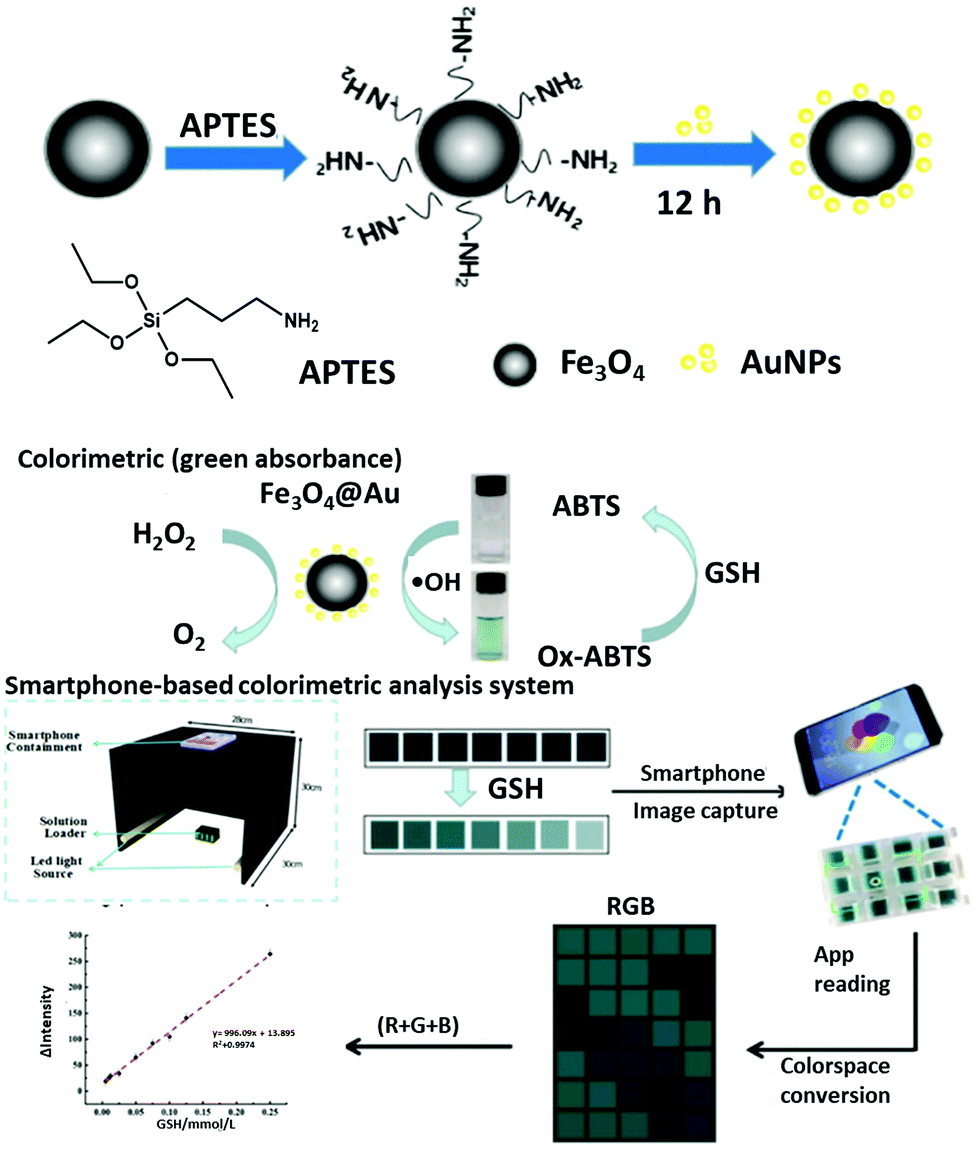 | ||
| Fig. 10 Schematic diagram of the synthetic mechanism of Fe3O4@Au and a new Fe3O4@Au-based detection of GSH by smartphone. Adopted with permission from ref. 161. | ||
Nickel ferrite is an important biocompatible ferromagnetic nanomaterial, which exhibits prominent peroxidase-mimic activity. Ponpandian et al. reported the use of a non-enzymatic nickel ferrite/PANI (NF–PANI) nanocomposite, which showed peroxidase-mimic activity, for the chromogenic detection of ascorbic acid (AA) through the sensing of H2O2 in the presence of the chromogenic substance TMB.162 In the presence of the catalyst, NF-PANI, TMB was prone to be oxidized to exhibit the corresponding chromogenic change colorless to blue, which was then utilized for the quantification of AA. Actually, in the presence of AA, TMB is reduced due to the interaction of AA with the –NH2 functional groups of TMB. Therefore, the intensity of the blue color was reduced, and ultimately became colorless, based on which the presence of AA was quantified, with the LOD of 232 nM. This as-synthesized probe was also involved in the detection of AA in real samples prepared from commercial beverages, fruit extracts and vitamin-C tablets with a relative standard deviation (RSD) of 1.7–2.3%. Interestingly, this nanoprobe also exhibited an electrochemical sensing response towards AA with an LOD of 423 nM.
Lu, Meng and Zhang et al. designed a novel reduced Co3O4 nanocomposite (R-Co3O4), which was synthesized from MOF ZIF-67, for the selective chromogenic detection of H2O2 and glucose.163 It was observed that the catalytic activity of the reduced Co3O4 nanocomposite was higher than that of the pristine Co3O4 due to the introduced oxygen vacancies, which facilitated H2O2 adsorption followed by its conversion to hydroxy radicals. Herein, TMB was also used as a chromogenic substrate, which was oxidized in the presence of ˙OH, to show the corresponding chromogenic alteration from colorless to blue. Thus, this assay was useful for quantitative detection of H2O2. Alternatively, glucose oxidase promotes the oxidation of glucose to H2O2, the quantification of which is also beneficial for the indirect detection of glucose. Based on this, the developed nanosensor was utilized for the quantification of H2O2 and glucose, exhibiting a linear range of 1–30 μM and 1–20 μM, respectively. Furthermore, the as-designed nanoprobe was efficaciously used to analyse glucose in human serum samples, indicating its capability for use in complex biological matrices.
CoO nanoparticles exhibit promising catalytic activity due to their high surface area, good stability and facile redox reaction between Co3+/Co2+. However, they tend to agglomerate, thereby exhibiting poor catalytic activity due to the decrease in active sites. Therefore, research is ongoing to improve the catalytic activity of CoO NPs. In this regard, Liu and Liu et al. reported a new series of magnetic flower-like CoO nanocomposites (Fe–CoO NCs) doped with 0.15Fe, possessing peroxidase and oxidase dual enzyme mimetic activities for the rapid and selective chromogenic detection of H2O2 and dopamine (DA) with an LOD of 4.40 and 1.99 μM, respectively.164 The introduction of Fe herein was beneficial for the easy magnetic separation of the nanocomposite. Initially, the Fe2+ in the doped Fe compounds was oxidized to Fe3+ by decomposing H2O2 to ˙OH, which then oxidized the chromogenic substrate TMB. Subsequently, the oxidized Fe3+ converted H2O2 to O2 with self-reduction to Fe2+. The generated O2 was responsible for the oxidation of Co2+ to Co3+ with self-conversion to ˙O2−, which then helped in the oxidation of TMB. However, the oxidizing capability of ˙O2− is much lower than that of ˙OH. This nanosensor was successfully employed to prove the real field applicability of DA and H2O2 detection in human urine samples with promising responses.
Again, to improve the surface activity and stability of the naked Fe3O4, Wang et al. fabricated multifunctional fluorescent nanoparticles, Fe3O4@SiO2@Au MNPs, via surface silanization, which possess superparamagnetism and good intrinsic peroxidase-like catalytic activity towards the chromo-fluorogenic sensing of H2O2 and glucose.165 Herein, this nanosensor exhibited bright red fluorescence, which was quenched gradually in the presence of an increasing concentration of glucose due to the increasing generation H2O2 from glucose, catalyzed by glucose oxidase (GOx). TMB was used herein as the chromogenic substrate to induce a chromogenic alteration from colorless to blue in the presence of glucose. Furthermore, the real field efficacy of the as-fabricated nanosensor was also investigated via the chromogenic analysis of glucose in human blood serum samples.
To improve the catalytic activity of Fe3O4 NPs, Xu et al. reported the use of an Fe3O4/mesoporous graphitized carbon (Fe3O4/m-GC) composite for the chromogenic determination of glucose (using TMB as the chromogenic substrate), exhibiting peroxidase-mimetic activity.169 The as-designed nanoprobe was facile, selective and highly sensitive towards the determination of glucose through the Fe(II)/Fe(III) redox cycle and m-GC by the CCsp2/C–Csp3 redox cycle. This nanosensor exhibited potential for the real sample analysis in serum samples.
3.5 Noble metal nanomaterials
Due to their unique size and shape-dependent optical and physico-chemical properties, noble metal nanomaterials, such as silver (Ag) and gold (Au) and core–shell nanoparticles or their bi-metallic alloys exhibit fascinating biosensing applications, which can be visualized by the naked eye. The appearance of the absorption spectrum of noble metal nanoparticles is mainly due to the oscillation of the electric component of light with the electronic cloud present in their conduction band.170a,c Recently, there have been numerous reports towards target-specific biosensing applications with enhanced selectivity and sensitivity via simple structural tuning, which would be an added impetus for nanomaterial-based health-monitoring.| Type of nanomaterials | Targeted analyte | Mode of biosensing | Limit of detection | Linear range | Ref. |
|---|---|---|---|---|---|
| AgNPs | H2O2 | Chromogenic | 0.071 μM | 1–100 μM | 171 |
| AgNPs | H2O2 | Chromogenic | 10−6 M | — | 196 |
| AgNPs | H2O2 | Chromogenic | 1.379 × 10⁻⁸ M | 1 × 10⁻⁹–3.6 × 10⁻⁷ M | 172 |
| AgNPs-CQDs | H2O2 | H2O2: 9 nM | H2O2: 0.1–100 μM | 173 | |
| Glucose | Chromogenic | Glucose: 10 nM | Glucose: 1–600 μM | ||
| AgNPs-GQDs | H2O2 | Chromogenic | H2O2: 162 nM | H2O2: 0.5–50 μM | 189 |
| Glucose | Glucose: 30 μM | Glucose: 0.5–8 mM | |||
| AuNPs-AgNPs | Glucose | Chromogenic | 3 μM | 5–70 μM | 187 |
| AgNPs | Fe2+, H2O2 and glucose | Chromogenic | Fe2+: 0.54 μM | Fe2+: 1–90 μM | 192 |
| H2O2: 0.032 μM | H2O2: 0.05–7.5 μM | ||||
| Glucose: 0.29 μM | Glucose: 1.5–30 μM | ||||
| AgNPs | Glucose | Chromogenic | 5 μM | 0–100 μM | 195 |
| Ag/carbon nanocomposite (Ag/C NC) | H2O2 | Chromogenic | H2O2: 0.03 μM | H2O2: 0.1–80 μM and 80–220 μM | 193 |
| Cysteine (Cys) | Cys: 0.004 μM | Cys: 0.01–10 μM | |||
| Homocysteine (Hcy) | L-Lactate: 0.35 μM | Hcy: 0.05–6 μM GSH: 0.02–1 μM | |||
| Glutathione (GSH) | L-Lactate: 1–30 mM and 30–900 mM | ||||
| L-Lactate | |||||
| AgNPs | Dopamine (DA) | Chromogenic | 1.18 × 10⁻⁷ M | 1 × 10⁻⁸–3.6 × 10⁻⁶ M | 174 |
| AgNPs | Cysteine (Cys) | Chromogenic | 4.0 nM | 0–100 ng mL−1 | 175 |
| AgNPs-CQDs | Cysteine (Cys) | Fluorogenic | Cys: 68.5 nM | 0.1–1000 μM | 182 |
| Homocysteine (Hcy) | Hcy: 82.6 nM | ||||
| Glutathione (GSH) | GSH: 90.9 nM | ||||
| AgNPs | Cysteine (Cys) | Chromogenic | 0.043 μM | 0.1–200 μM | 183 |
| AgNPs | Cysteine (Cys) | Chromogenic | Cys: 1.80 × 10⁻⁸ M | Cys: 1.10 × 10⁻⁶ M to 5 × 10⁻⁸ M | 184 |
| Glutathione (GSH) | GSH: 3.68 × 10⁻⁷ M | GSH: 1 × 10⁻⁵ M to 5 × 10⁻⁷ M | |||
| AgNPs | Cysteine (Cys) | Chromogenic | 12.0 μM | — | 185 |
| AgNPs | Cysteine (Cys) | Chromogenic | 0.1–10.0 μM | Cys: 15.0 nM Hcy: 84.6 nM and GSH: 40.0 nM | 186 |
| Homocysteine (Hcy) | |||||
| Glutathione (GSH) | |||||
| AgNPs | Cysteamine (CA) | Chromogenic | 4.9 nM | 0.1–1.0 μM | 176 |
| AgNPs | Cysteamine (CA) | Chromogenic | 0.37 μM | 0.6–1.8 μM | 201 |
| AgNPs | Ascorbic acid (AA) | Both Chromogenic and Fluorogenic | AA: 0.6 μmol L−1 | AA: 5–150 μmol L−1 | 194 |
| Ascorbic acid oxidase activity (AA-Ox) | AA-Ox: 0.0048 U mL−1 | AA-Ox: 0.01–0.20 U mL−1 | |||
| AgNPs | Uric acid | Chromogenic | 30 pM | 0.1 nM–0.1 mM | 198 |
| AgNPs | Vitamin B1 | Chromogenic | 7.0 μgmL−1 | 25–500 μgmL−1 | 177 |
| AgNPs | Bovine sex pheromones | Chromogenic | — | — | 199 |
| AgNPs-CQDs | H2O2 | Both Chromogenic and Fluorogenic | H2O2: 0.6 μM | Lactate: 0–0.02 mM and 0.4–18 mM | 178 |
| Lactate | Lactate: 10 μM | ||||
| AgNPs | Adenosine | Chromogenic | 21 nM | 60–280 nM | 197 |
| AgNPs | Alkaline phosphatase | Chromogenic | 0.24 U L−1 | 0.5–225 U L−1 | 180 |
| Au@AgNPs-GQDs | Alkaline phosphatase | Both Chromogenic and Fluorogenic | Chromogenic: 9 μU mL−1 | Chromogenic: 0.01–6 mU mL−1 | 181 |
| Fluorogenic: 5 μU mL−1 | Fluorogenic: 0.01–2 mU mL−1 | ||||
| AgNPs | Alkaline phosphatase | Chromogenic | 0.003 U L−1 | 0.01–2.00 U L−1 | 191 |
| AgNPs | Ascorbic acid | Chromogenic | 0.054 μM | 0.25–25 μM | 188 |
| AgNPs | Creatinine | Chromogenic | 53.4 nM | 0–4.2 μM | 190 |
| AuNPs | Concanavalin A | Chromogenic | — | — | 206 |
| AuNPs | Human immunoglobulin G (IgG) | Chromogenic | <100 ng mL−1 (700 pM) | 50–500 ng mL−1 | 228 |
| AuNPs | Protein-phosphatase-1-gamma-2 | Chromogenic | — | — | 207 |
| Au NPs | Biomarker-HER2 protein (human epidermal growth factor receptor 2, also called c-erbB2 or Neu) | Fluorogenic | 1 ng mL−1 | 2–100 ng mL−1 | 226 |
| AuNPs | Dipeptidyl peptidase IV (DPP-IV or CD-26) | Chromogenic | VP-EN-DC method: 1.5 U L−1 | VP-EN-DC method: 0–30 U L−1 | 219 |
| GPDC method: 1.2 U L−1 | GPDC method: 0–12 U L−1 | ||||
| AuNPs | Cholesterol | Fluorogenic | 343.48 nmol L−1 | 10–210 μmol L−1 | 231 |
| AuNPs | ATP | Fluorogenic | 23 nM | 50 nM–10 μM | 224 |
| AuNPs | ATP | Chromogenic | 1.7 nM | 20–100 nM | 229 |
| AuNPs | Adenosine | Chromogenic | 0.13 nM | 5 nM−1 μM | 225 |
| AuNPs | Adenosine | Chromogenic | 1.8 × 10⁻⁸ M | 1 × 10⁻⁷–1 × 10⁻⁴ M | 230 |
| AuNPs | Trypsin | Both chromogenic and fluorogenic | Chromogenic: 8.4 ng mL−1 | Chromogenic: 20–2000 ng mL−1 | 232 |
| Fluorogenic: 4.6 ng mL−1 | Fluorogenic: 10–2500 ng mL−1 | ||||
| AuNPs | Lysozyme | Chromogenic | 57.2 μg mL−1 | — | 208 |
| AuNPs | Lysozyme | Fluorogenic | 33.43 ng mL−1 | 50–1000 ng mL−1 | 220 |
| AuNPs | DNA | Chromogenic | 0.36 μM | 0–5 μM | 209 |
| AuNPs | DNA | Chromogenic | 3.0 nM | 10–150 nM | 235 |
| CQDs-AuNCs | Dopamine | Fluorogenic | 2.66 nM | 2.66–0.18 mM, 0.511–3.79 mM and 4.87–13.1 mM | 210 |
| AuNPs | Dopamine | Both Chromogenic and Fluorogenic | Chromogenic: 1.85 μM Fluorogenic: 0.29 μM | Chromogenic: 0–0.3 mM | 214 |
| AuNPs | Spermine | Both Chromogenic and Fluorogenic | Chromogenic: | Chromogenic: 0.0001–50 μM | 222 |
| Spermidine | Spermine: 136 pM | Fluorogenic: 10–130 nM | |||
| Spermidine: 636 pM | |||||
| Fluorogenic: | |||||
| Spermine: 6.2 nM | |||||
| Spermidine:5.3 nM | |||||
| AuNPs | L-Histidine | Chromogenic | 3.6 nM | 0–400 nM | 227 |
| Au Ag NCs | Cys | Fluorogenic | Cys & GSH: 0.74 nM (Solution state) | Cys: 2.3 nM–110 μM | 213 |
| GSH | 5.0 μM (Paper based) | GSH: 2.3 nM–63 μM | |||
| AuNCs | GSH | Fluorogenic | 0.018 μmol L−1 | 0–0.1 μmol L−1 | 216 |
| CQDs-AuNPs | GSH | Fluorogenic | 0.21 μM | 3.8–415.1 μM | 215 |
| AuNPs | GSH | Fluorogenic | 3.6 nM | 0.01–5.0 μM | 223 |
| CQDs-AuNPs | Cys | Fluorogenic | 0.16 μM | 1.0–110 μM | 217 |
| CQDs-AuNPs | Cys | Both Chromogenic and Fluorogenic | 20 nM | 0.05–12 μM and 0–100 μM | 221 |
| AuNPs | PA | Chromogenic | PA: 0.15 μM | PA: 1.0–35.0 μM | 211 |
| Fe3+ | Fe3+: 1.0 μM | Fe3+: 5.0–30.0 μM | |||
| GQDs-AuNPs | Fe3+ | Fluorogenic | 30 nM | 0.10–0.75 μM | 238 |
| AuNPs | Fe3+ | Chromogenic | 0.051 μmol L−1 | 0.3–2.1 μmol L−1 | 218 |
| AuNPs | Fe2+ | Chromogenic | 0.036 ppb | 0.3–7.0 ppb | 212 |
Recently, Karakuş et al. reported a green synthetic strategy for the preparation of Konjac gum/polyethylene glycol-AgNPs (KG/PEG-Ag NPs) for the selective chromogenic detection of H2O2 within the very short response time of <5 s.171 This nanosensor exhibited a “naked eye” chromogenic change from yellow to transparent, which may be attributed to the H2O2-induced oxidation of Ag0 to Ag+.
To improve the catalytic activity of the metallic nanoparticles, ionic liquids are beneficial to cap the nanoparticles for preventing their agglomeration. Therefore to improve the catalytic activities of AgNPs, Rahim et al. reported the preparation of ionic liquid-coated lignin-stabilized AgNPs for the chromogenic detection of H2O2 within the response time of 5 min.172 Herein, the synergistic effect between the ionic liquid and lignin helped to maintain the peroxidase-like activity of AgNPs, which ultimately oxidized 3,3′,5,5′-tetramethylbenzidine (TMB) to achieve an H2O2-induced facile chromogenic response from colorless to blue-green. Herein, after the absorption of photons, the nanosensor generates an H+ and electron pair, which is consumed by the H2O2 adsorbed on the surface of the nanosensor, forming a peroxo complex between Ag and H2O2. Therefore, the recombination of the electron and H+ pair is not possible. After consumption of the electron by H2O2, OH− and ˙OH are produced, which are beneficial for the oxidation of TMB to produce the blue-green-colored oxidized product. This sensing strategy was employed for the detection of H2O2 in the blood serum samples of hypertension patients.
Similarly, the peroxidase-like activity of functionalized carbon dots (CDs)-stabilized AgNPs was employed toward the chromogenic recognition of glucose and H2O2, wherein the charge of the CDs at their periphery stabilized the AgNPs.173 To design a greener pathway, herein, banana peels were chosen for the preparation of CDs, which acted as both a reducing (for converting Ag+ to Ag0) and capping agent for the AgNPs. Interestingly, the nano-assembly exhibited promising peroxidase-like activity due to its high surface area and the presence of sp2-hybridized carbon structure. In the presence of H2O2, the initial yellow color of the nanoassembly gradually disappeared by the obvious H2O2-induced oxidation of Ag0 to Ag+. By using glucose oxidase enzyme, glucose could also be detected by this method indirectly. This sensing strategy was employed for the detection of glucose in human serum samples with a promising response.
Recently, Nishan and Rahim et al. reported the preparation of Augmentin drug-mediated AgNPs functionalized with an ionic liquid (IL) for the chromogenic detection of dopamine within only 4 min.174 Herein, the IL was adsorbed on the surface of the AgNPs via different intermolecular interactions, such as H-bonding interaction, van der Waals interactions, electrostatic interactions etc. The observed chromogenic change from light grey to brown can be attributed to the oxidation of dopamine by the photogenerated hydroxyl radical from the water molecules or the hydroxyl functional groups present on the surface of the NPs.
Ghosh et al. reported the use of IL-functionalized AgNPs for the selective chromogenic detection of Cys.175 Herein, the chromogenic change was observed from pale yellow to wine red to purple in the presence of an increasing concentration of Cys due to the morphology and self-induced aggregation of ILs-AgNPs with neutralization of surface charge via the increase in intramolecular electrostatic interaction due to the strong affinity of AgNPs towards Cys, which ultimately led to a bathochromic shift in the SPR band from 395 nm to 560 nm.
Liu et al. reported a nanomaterial surface energy transfer (NSET) system based on AgNPs and nitrogen and sulfur co-doped CQDs for the selective recognition of GSH from Cys and Hcy by a “turn-on” fluorescence response via pH modulation together with the steric hindrance and charge density of the biothiols, which was also checked in real human serum samples.182 In comparison to AuNPs, which exhibit an LSPR band at 520 nm, AgNPs exhibit the same at a higher resonance frequency. Therefore, there is a chance of good spectral overlap of the LSPR band of AgNPs with the emission band of CQDs due to the strong interaction of their surface functional groups (–NH2, –SH, etc.) with AgNPs, facilitating the FRET process to exhibit a decrease in fluorescence compared to that of the bare CQDs. However, in the presence of the targeted biothiols, the inherent fluorescence of the CQDs was regenerated due to the competitive binding interaction of the AgNPs with the biothiols.
Again, Ali et al. reported the use of maltol-capped AgNPs for the selective chromogenic detection of Cys due to the formation of nanoaggregates via the formation of Ag–S bonds, H-bonding interaction, and electrostatic interaction between AgNPs and Cys, leading to a chromogenic alteration from yellow to orange due to the variation in the LSPR absorption.183 The practicability of the proposed method was also checked by detecting Cys in biological samples, including blood plasma and urine. Together with the exploration of non-toxicity to various cell lines, the probe also exhibited a prominent antibiofilm, antimicrobial and biofilm eradicating activities, suggesting its broad applicability.
Kumar et al. reported the use of a tyrosine-functionalized AgNPs-based chromogenic probe for the discriminative recognition of cysteamine and GSH.184 Upon the addition of GSH, the characteristic LSPR band intensity decreased, leading to a chromogenic change from yellow to colorless, which may be attributed to the dissolution of AgNPs into their oxidized form. Alternatively, in the presence of cysteamine, the chromogenic change was observed to be red due to the cysteamine-induced aggregation of AgNPs by the binding interaction between the NH2 or -SH group of cysteamine with the metal surface. They also checked the sensing ability using artificial serum samples.
Lazić et al. also reported the use of dextran-coated AgNPs as a chromogenic probe for the selective detection of Cys via the analyte-induced aggregation of AgNPs, leading to a decrease in the LSPR band at 402 nm with the generation of a new absorption band in the visible window with a chromogenic variation from yellow to orange-red-brown.185 Due to the presence of various surface functional groups in dextran, the agglomeration and oxidation of the AgNPs were prevented. However, in the presence of Cys, the dextran molecules were replaced by Cys due to the stronger interaction of the thiol groups of Cys with AgNPs, which led to the corresponding agglomeration of the nanoparticles.
Similarly, Mohammadi et al. also reported the use of a chitosan-stabilized AgNPs-based chromogenic probe (yellow to orange) for the selective detection of biothiols via the target-specific aggregation of AgNPs due to H-bonding interaction, electrostatic interaction and Ag-S bond formation, which was also applied for the recognition of biothiols from real biological samples, such as human serum and urine samples.186 Herein, chitosan was chosen due to its bio-compatibility, biodegradability and strong interaction with Ag+.
Cysteamine is an important aminothiol, which has many significant biological and clinical applications.176,200 Ilanchelian et al. reported the preparation of a simple, chromogenic polyvinylpyrrolidone-stabilized AgNP-based nanosensor for the selective detection of cysteamine.201 The corresponding chromogenic change from pale yellow to purple was observed via the cysteamine-induced aggregation of the NPs, leading to a decrease followed by bathochromic shift in the SPR band from 395 nm to 436 nm with a shoulder peak at 436 nm, which may be due to the strong electrostatic interaction of the positively charged cysteamine with the negatively charged PVP-AgNPs. The sensing sensitivity towards cysteamine was also investigated in real human blood serum samples, where cysteamine was recovered at a high rate (96–101.8%), demonstrating the practical applicability of the developed nanosensor (Fig. 11A).
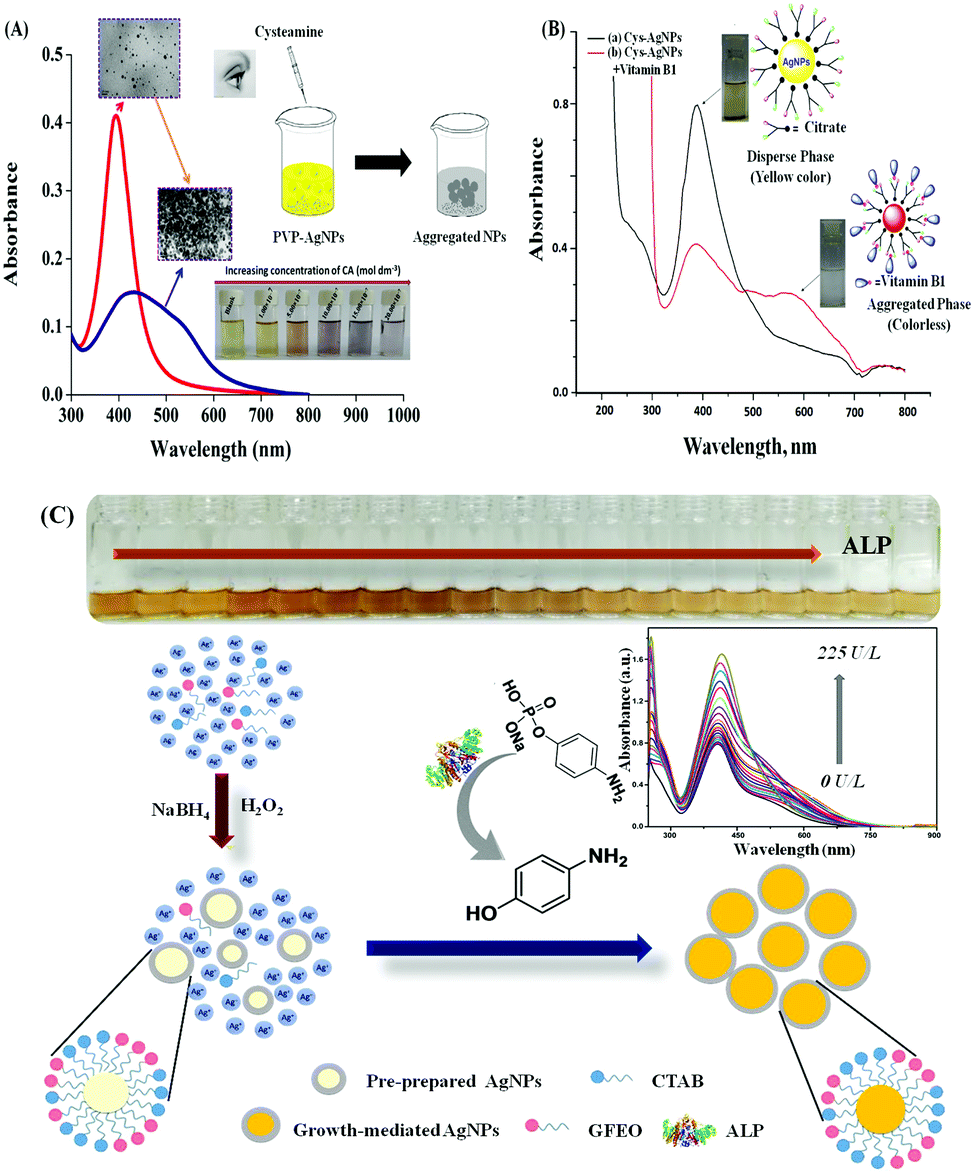 | ||
| Fig. 11 (A) Schematic illustration of the colorimetric determination of CA based on PVP-AgNP aggregations. Adopted with permission from ref. 201. (B) UV-Vis absorption spectral variation of dispersed Cys-capped AgNPs and aggregated Cys-capped AgNPs after the addition of vitamin B1. (C) Schematic representation of ALP detection based on the pAP-mediated growth of AgNPs (inset: UV-Vis absorption spectral change with an increase in the concentration of ALP and the corresponding chromogenic changes). Adopted with permission from ref. 180. | ||
Vitamin B1 (thiamine) is another important biomolecule, which has many significant biological and pharmaceutical applications.202 Deb et al. reported the use of L-cysteine-functionalized AgNPs for the sensitive chromogenic detection of thiamine.177 The electrostatic interaction with the positively charged thiamine is the driving force for the thiamine-induced aggregation of the nanosensor, which ultimately led to a bathochromic shift in the LSPR band from 390 nm to 580 nm with a naked eye chromogenic change from yellow to colorless (Fig. 11B). The negatively charged Cys stabilized the AgNPs, preventing their agglomeration. However, in the presence of thiamine, an electrostatic interaction occurred between the negative oxygen sites of the Cys-capped AgNPs and the positively charged nitrogen sites of thiamine. This method was also applied for the detection of thiamine from different food samples, such as peas, grapes and tomato.
Lactate is another important biomolecule, which is generated in the human body by altered metabolism in cancer cells together with an increase in glucose uptake.203 Park and Yoon et al. reported the use of silver nanoparticles-coated carbon dots (AgNPs-CDs) for the selective chromo-fluorogenic detection of H2O2 and lactate on paper strips within minutes.178 Based on the catalytic reaction of lactate oxidase (LOx), H2O2 was produced, which decomposed the AgNPs, leading to a chromogenic change from yellowish to colorless with the recovery of the fluorescence of the CDs from dark to bright blue. The synthesized nanoprobe was also applied for the intracellular monitoring of lactate using the 4T1 cell line related to stage IV human breast cancer.
Alkaline phosphatase (ALP) enzyme is an alternative enzyme to horseradish peroxidase (HRP) in immunoassay systems due to the interference of HRP by antibacterial agents. Kim et al. reported the preparation of a chromogenic assay for the selective chromogenic detection of ALP via the specific dephosphorylation of p-aminophenol phosphate (pAPP) into p-aminophenol (pAP).180 The selective chromogenic alteration from yellow to brown with the corresponding bathochromic shift in the LSPR peak was attributed to the pAP-mediated growth of AgNPs in the presence of ALP (Fig. 11C). The proposed method was exploited towards the recognition of ALP in real human serum samples, where ALP was recovered at a high-quality rate of 99.2% ± 1.5%.
Metal core/shell nanostructures, particularly Au@Ag nanostructures, may be an appropriate colorimetric platform for biosensing applications due to their tunable opto-chemical properties. However, much less attention has been paid to Au@Ag nanostructure-mediated dual-mode chromo-fluorogenic assays. In this regard, Lu et al. reported the chromo-fluorogenic detection of ALP using GQDs as a fluorescent indicator.181 The catalytically formed AA from the hydrolysis of 2-phospho-L-ascorbic acid (AAP) in the presence of ALP led to the production of AgNPs, ultimately forming Au@Ag NPs (silver nanoshell over AuNPs core) with the corresponding chromogenic change from pink to deep yellow. The generated Au@Ag NPs quenched the fluorescence of GQDs via IFE via both a static and dynamic quenching mechanism to ultimately produce a dual channel signal in the presence of ALP. This assay was also examined for the detection of ALP in human serum samples.
![[thin space (1/6-em)]](https://www.rsc.org/images/entities/char_2009.gif) 206–232 (Table 5)
206–232 (Table 5)
Seto et al. reported the preparation of glucosylrutin-catechol-conjugated AuNPs for the selective and specific visual recognition of proteins via an aggregation-induced chromogenic alteration from red to reddish violet.206 Herein, catechol was beneficial for surface coating, while glycoside helped to bind the targeted biomolecules.
Similarly, the detection of urinary lysozymes is tremendously important in the early-stage monitoring of lysozymuria and various renal disorders, such as hypokalemia. Recently, Prado-Gotor and Jimenez-Ruiz et al. reported the preparation of a non-functionalized, anionic AuNP-based nanosensor stabilized by sodium citrate for the selective recognition of lysozymes in human urine samples.208 In the presence of lysozymes, the nanosensors exhibited a chromogenic change from purple to blue, which was actually taken as the reference signal. This chromogenic alteration was ascribed to the aggregation of the AuNPs, which led to plasmonic coupling. The corresponding CIEL*a*b* parameters were extracted from the observed chromogenic changes to obtain a clear pediatric range for monitoring urinary lysozymes.
Moreover, as one of the deadliest diseases, early-stage cancer diagnosis is a necessary task. In this regard, Sachdev and Bandyopadhyay et al. reported an AuNPs-based chromogenic immunosensor-based POCT platform for the recognition of the cervical cancer (CaCx) specific biomarker antigen protein-phosphatase-1-gamma-2 (PP1γ2) in human urine samples.207 In the presence of the targeted antigen, the UV-Vis spectrum of the nanosensor experienced a prominent hypsochromic shift with a concomitant enhancement in absorbance due to the localized surface plasmon resonance, originating from the particular epitope–paratope interaction. Based on this principle, herein a proof-of-concept POCT device was fabricated for monitoring urinary CaCx, which would be an early-stage disease diagnostic tool.
Again, the quantitative detection of free DNA from bio-fluids currently requires complicated time-consuming methodologies, such as rolling circle amplification (RCA), real-time polymerase chain reaction (RT-PCR) etc.233,234 Therefore, for the rapid, on-spot monitoring of DNA, Kaushik et al. prepared citrate-reduced AuNPs (CI-AuNPs) for the colorimetric recognition of calf thymus DNA (Ct-DNA) and the anti-cancer drug sanguinarine (SNG).209 The initially dispersed AuNPs exhibited a red color, while in the presence of SNG, the AuNPs underwent target-specific agglomeration to induce a blue coloration with a bathochromic shift in the SPR band via electrostatic interaction of the negatively charged CI-AuNPs with positively charged SNG. However, the presence of Ct-DNA re-dispersed the AuNPs due to the specific binding interaction of SNG with Ct-DNA to revive the initial red coloration, which could easily be visualized by the naked eye. Thus, herein, DNA could be visualized via the anti-aggregation strategy. The nanosensing strategy was also employed for the detection of Ct-DNA in human urine samples, which would be helpful for the quantitative monitoring of Ct-DNA in various bio-fluids. Li and Chen et al. also reported the preparation of an AuNP-based chromogenic nanosensor for the selective detection of DNA, assisted by exonuclease III, via the anti-aggregation of AuNPs, leading to a bare-eye chromogenic change from blue-purple to red.235 Initially, in a salt environment, the color of the NPs solution was blue-purple due to the salt-induced aggregation. However, in the presence of DNA, this type of aggregation was prohibited due to the tethering of residual DNA on the AuNPs, leading to the corresponding chromogenic alteration from blue-purple to red. This method also exhibited a good response in real human serum samples. However, significant tuning of the nanosensor or sensing strategy is still needed to improve the sensitivity of the nanosensor for its effective application in disease diagnostics.
Again, FRET-based sensory receptors are in high demand due to their self-calibrating behaviour. For an effective FRET process, the emission spectrum of the donor must overlap with the absorption spectrum of the quencher. Therefore, by conjugating AuNPs with the relevant fluorophores, the FRET process can be initiated. The emission spectra of CQDs are generally located in the blue region and the absorption spectra of AuNPs or gold nanoclusters (AuNCs) are also in the same range. Therefore, the combination of these two materials may be a perfect FRET pair. In this perspective, Liao et al. reported the use of a carbon quantum dots and gold nanoclusters-based nanohybrid (CQDs-AuNCs) for the selective fluorogenic detection of dopamine (DA) with a very low detection threshold of 2.66 nM.210 Initially, the nanohybrid exhibited purple-colored fluorescence due to the FRET process operating from the CQDs to AuNCs, exhibiting dual emission peaks at 446 nm and 670 nm (Fig. 12A). However, in the presence of DA, the initial FRET process was restricted, and then initiated from CQDs to DA, and thus fluorescence was quenched via the static quenching mechanism, leading to a ratiometric fluorescence response, which was successfully employed towards the monitoring of DA in real human serum samples.
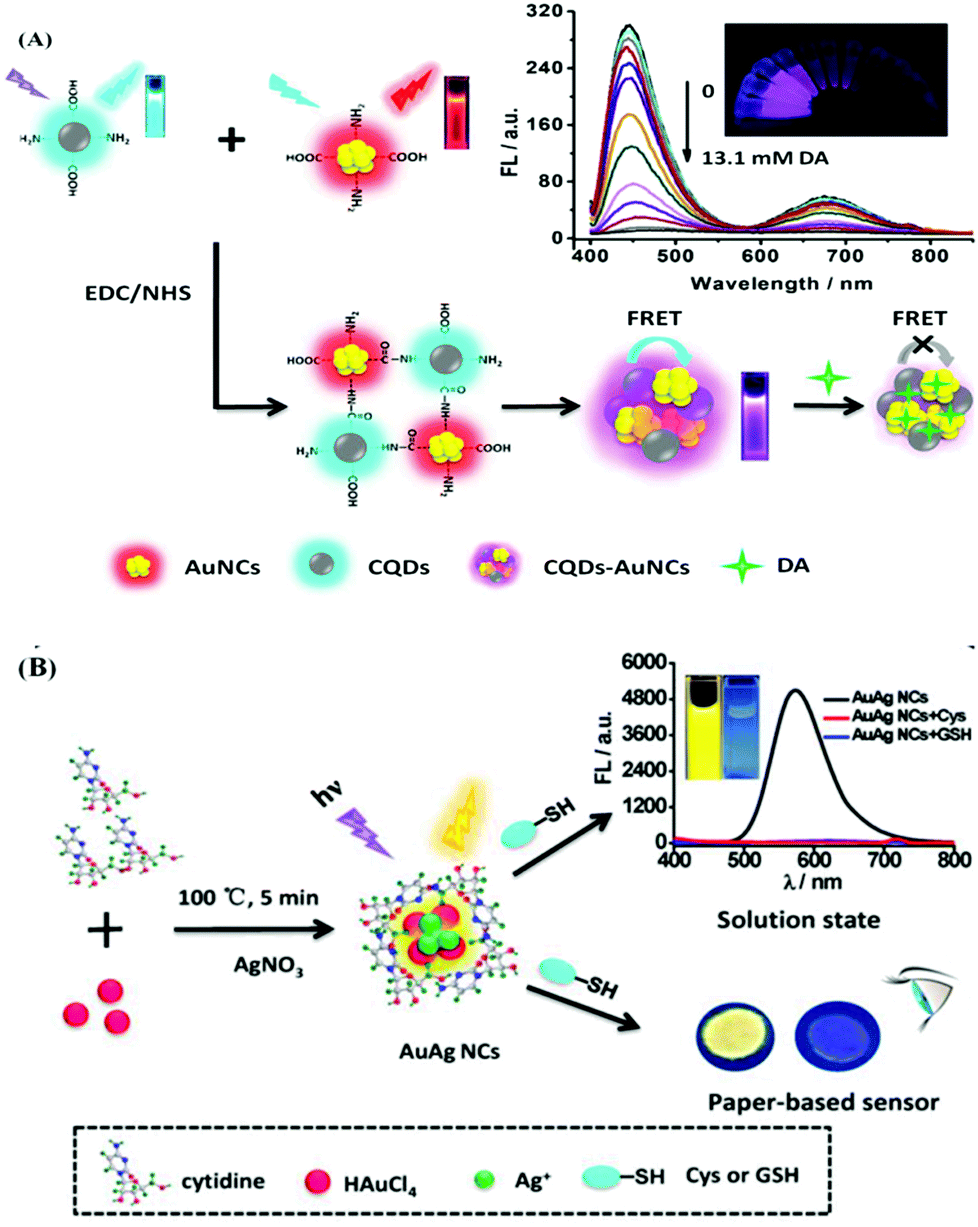 | ||
| Fig. 12 (A) Schematic illustration of the ratiometric fluorescent CQDs-AuNC probe for the detection of DA (inset: fluorescence spectral variation in the presence of an increasing amount of DA and the corresponding naked-eye fluorometric changes under UV light). Adopted with permission from ref. 210. (B) Schematic illustration of AuAg NCs used for the detection of biothiols both in solution and paper-based test. Adopted with permission from ref. 213. | ||
Again, Peng et al. reported the use of citrate-capped AuNPs linked with a 4-(4-dialkylaminostyryl)pyridinium-derived fluorophore for the selective chromo-fluorogenic recognition of DA via DA-induced aggregation, leading to a chromogenic alteration from red to blue with fluorescence recovery of the fluorophore.214 Initially, herein, the FRET process was operative from the fluorophore to AuNPs, which quenched the fluorescence emission of the fluorophore. However, in the presence of DA, the catechol groups of DA were adsorbed on the surface of the AuNPs, inducing the aggregation of the AuNPs and impeding the FRET process from the fluorophore, which was actually responsible for the fluorescence recovery of the fluorophore and allowed the quantification of DA. This sensing strategy was also applied for the recognition of DA in human urine samples with a high rate of recovery (98.2–106.0%), which may be helpful for DA-induced disease diagnosis.
Xu and Liao et al. reported the preparation of a gold/silver nanoclusters (AuAg NCs)-based nanosensor with cytidine as the binding unit for the “turn-off” fluorogenic detection of Cys and GSH via the aggregation of NCs due to the coordination of Ag or Au metal atoms with the sulfur of biothiols to form non-fluorescent coordination complexes.213 This sensing strategy based on the static quenching mechanism was also effectively applied towards the recognition of biothiols in real human serum samples (Fig. 12B). To increase the photostability and biocompatibility of nanoclusters, Zhang and Zhou et al. reported the preparation of a DNA-templated gold nanoclusters (AuNCs@C30)-based fluorescent probe for the selective fluorogenic detection of GSH via dynamic quenching with a very low detection threshold value of 0.018 μmol L−1.216 Herein, the fluorescence quenching was basically originated from the coordination of the various functional groups of GSH with AuNCs, consequently leading to the aciniform aggregation of AuNCs@C30. The probability of this static quenching mechanism was ruled out due to the fact that no change was perceived in the UV-Vis spectral window. However, at a higher concentration, a new absorption peak appeared due to the generation of AuNPs with a decrease in the number of AuNCs.
Again, Dong and Gong et al. reported the preparation of a nitrogen and sulfur dual-doped CQDs and AuNPs-based nanosensor, where CQDs act as the energy donor and AuNPs act as the acceptor to induce fluorescence quenching by the FRET process throughout the system.215 GSH led to the recovery of the fluorescence of CQDs due to the particular interaction of AuNPs with GSH through Au-S bond formation, leading to the disruption of FRET process to result in a “turn-on” fluorescence response to quantify the presence of GSH. This method also exhibited a good performance towards the detection of GSH in real human serum samples, exhibiting potential biomedical applications.
Similarly, Gong et al. reported the preparation of a FRET-based infrared nanosensor composed of positively charged carbon dots (CDs) and negatively charged N-acetyl-L-cysteine-capped AuNPs for the selective ratiometric fluorogenic detection of cysteine with a low detection threshold of 0.16 μM.217 Herein, the FRET process was operative from CDs to AuNPs to quench the emission intensity of the CDs. However, in the presence of L-Cys, the emission intensity of the AuNPs was quenched with a slight red shift, keeping the emission of the CDs constant, which resulted in a ratiometric response to quantify the targeted analytes via a continuous FRET process. The static quenching of the AuNPs can be ascribed to the Au-S coordination-induced change in the surface state of the AuNPs. The nanosensor exhibited a good response towards the detection of Cys in real human serum samples.
Again, the detection of phytic acid (PA), which is present as the main storage form of phosphorous in cereal and legume grains,236 is an important food antioxidant as it plays an imperative role in diverse physiological processes and undergoes strong binding interaction with minerals such as iron, zinc etc.237 Apak et al. reported the preparation of a 4-mercaptophenol and thioglycolic acid (TGA)-functionalized gold nanoparticles-based chromogenic nanosensor for the selective simultaneous detection of PA and Fe3+.211 Initially, the nanoprobe exhibited an SPR peak at 520 nm; however, in the presence of Fe3+, a strong peak appeared at 620 nm with a concomitant reduction in absorbance at 520 nm, leading to a chromogenic alteration from red to purple due to the aggregation of the NPs via coordinative interaction. Upon the addition of PA to the same solution, the chromogenic change was reversed due to the disaggregation of the NPs through the stronger binding affinity between Fe3+ and PA. Herein, the presence of TGA was beneficial for the nano-assembly to independently detect two analytes proficiently. The detection strategy was also effectively employed for the detection of PA extracted from bean grains at the μM level.
Again, Giri et al. reported the use of nitrogen-doped GQDs decorated on AuNPs (Au@N-GQDs) for the selective “turn-off” fluorescent determination of Fe3+ with ultrahigh sensitivity of 1 nM due to the strong interaction of Fe3+ with the surface hydroxyl groups.238 Herein, Au@N-GQDs exhibited a better emission efficiency than that of the bare N-GQDs due to the generation of hot electrons. Additionally, the absorption properties also improved due to the local field enhancement and the surface functionalization. In presence of Fe3+, the fluorescence was strongly quenched via the dynamic quenching mechanism due to the charge transfer together with the photoinduced charge transfer process from Au@N-GQDs to the vacant d-orbital of Fe3+, ultimately leading to the agglomeration of Au@N-GQDs. However, in the presence of EDTA in the above-mentioned assembly, the fluorescence was recovered due to the EDTA-triggered disaggregation of Au@N-GQDs. The sensing strategy was effectively applied for the recognition of Fe3+ in real water and human serum samples.
Sirajuddin et al. synthesized AuNPs functionalized with acetyl salicylic acid (ASA) drug for the selective chromogenic detection of Fe3+. Here, the aggregation-induced spectral change and the corresponding chromogenic changes from red to dark blue were assumed to be due to the aggregation via the formation of Au-Fe alloy.218 The detection of Fe3+ or Fe2+ selectively in the presence of both is a challenging task. In this regard, to develop a cost-effective and green approach, Sirajuddin et al. reported the preparation of green bell pepper, Capsicum annuum L., extract-capped AuNPs for the selective chromogenic detection of Fe2+ (red to purple) with a clear bathochromic and hyperchromic shift in the UV-Vis absorption spectra due to the aggregation of the AuNPs, as confirmed from AFM studies.212
3.6 Upconversion nanoparticles
Upconversion luminescence is a non-linear optical process that can convert near infrared radiation into ultraviolet, visible or NIR radiation as lanthanide-doped nanocrystals via a two-photon or multi-photon mechanism.239 This phenomenon has been perceived for various metal ions and organic molecules, among which rare earth (RE) metals act as luminescent centres having an electronic configuration of [Xe]4fn5s25p6 (n = 0–14). Compared with organic polymers and quantum dots, rare-earth doped upconversion nanoparticles show tremendous resistance to photobleaching and photodegradation, low background noise, large anti-Stokes shift, distinct emission, etc., making UCNPs an attractive alternative source for overcoming the current limitations of traditional fluorescent probes.240a Moreover, the excitation wavelengths of these types of nanoparticles lie in the NIR region, which provides an improved signal-to-noise ratio, deep tissue penetration ability and rules out the possibility of autofluorescence.240b Therefore, these nanoparticles, having a size in the range of 5–100 nm, are widely used in FRET- or IFE-based biological assays as efficient donors. UCNPs are generally conjugated with diverse nanomaterials, such as metallic nanoparticles (e.g., AuNPs and AgNPs),240c 2D nanomaterials (e.g., graphene oxide (GO)240d and MnO2240e nanosheets), etc. which often reduce the fluorescence of UCNPs. Upon interaction with the targeted analytes, the quenched fluorescence may be recovered, which may be ultimately useful for the quantification of the targeted analytes.240f Based on excellent luminescence property of UCNPs, they have been widely utilized in diverse biosensing applications, in vivo and in vitro imaging, cancer treatment, immune-chromatography assays, detection of intracellular pH, glucose, H2O2, etc.241–252 (Table 6).| Type of nanomaterials | Targeted analyte | Mode of biosensing | Limit of detection | Linear Range | Ref. |
|---|---|---|---|---|---|
| UCNPs | pH | Fluorogenic | — | — | 242 |
| UCNPs | pH | Fluorogenic | — | — | 243 |
| UCNPs@SiO2-Ag2S- | pH | Fluorogenic | — | 4.0–9.0 | 246 |
| UCNPs | pH | Fluorogenic | — | 6.0–9.0 and 6.8–9.0 | 252 |
| UCNPs | pH | Fluorogenic | — | — | 247 |
| UCNPs | pH | Fluorogenic | — | — | 249 |
| UCNPs | pH | Fluorogenic | — | 5.0–8.0 | 250 |
| UCNPs | Myeloperoxidase (MPO) | Fluorogenic | — | — | 245 |
| UCNPs | Fe3+ | Both Chromogenic and Fluorogenic | Chromogenic: 10 μM | Fluorogenic: 0.25–50 μM | 248 |
| Fluorogenic: 0.65 μM | |||||
| UCNPs | H2O2 and glucose | Fluorogenic | H2O2: 0.8 μμ | H2O2: 2.5–300 μμ | 251 |
| Glucose: 2.3 μM | Glucose: 7–340 μM | ||||
| AMP-Ce(IV)/Tb polymer dots | Ascorbic acid | Fluorogenic | 190 nM | 0–100 μM | 259 |
| NCPDs-Qc | Quercetin | Both Fluorogenic and | Fluorogenic: 8.5 ng mL−1 | Fluorogenic: 0.05–10 μg mL−1 and 12.5–30 μg mL−1 | 260 |
| Chromogenic | Chromogenic: 0.22 μg mL−1 | Chromogenic: 0.5–27.5 μg mL−1 | |||
| Polystyrene polymer dot (PSP dots) | DNA methyltransferase (MTase) | Fluorogenic | 0.025 U mL−1 | 0.025–3 U mL−1 | 261 |
| DA-CD@Pdots | Glutathione (GSH) | Fluorogenic | 2.7 nM | 0.01–3.0 μM | 262 |
| Pdots and dopamine (DA)-melanin nanosystem | Glutathione (GSH) | Fluorogenic | 60 nM | 0.2–20 μM | 263 |
| Pdots | pH | Fluorogenic | — | pH 3.0–8.0 | 264 |
| PFV/PSMA-DA NPs | pH | Fluorogenic | — | pH 5.0–9.0 | 265 |
| CR/TPP@Pdots | Mitochondrial pH | Fluorogenic | — | pH 2.57–8.96 | 273 |
| Pdots | Mitochondrial sulfur dioxide (SO2), formaldehyde (FA) in cancer cells | Fluorogenic | 110 nM | 500 nM–30 μM | 266 |
| SPN | Alkaline phosphatase (ALP) | Fluorogenic | 0.01 μU mL−1 | 0.031–12.4 μU mL−1 | 267 |
| Pdots@Rb-hy | ALP | Fluorogenic | 0.0018 U L−1 | 0.005–15 U L−1 | 269 |
| Pdots@MB | DNA | Fluorogenic | — | 0.006–200 nM | 268 |
Recently, Wu and Zhao et al. reported the use of label-free ratiometric core–shell UCNPs for the monitoring of intracellular pH.242 The nanosensor was made up of polyethylene glycolyated phospholipid (DSPE-PEG) and the surface of the UCNPs was functionalised with phenol red, which acted as a pH indicator by forming a phospholipid monolayer for sensing pH changes during endocytosis and interrogating the external stimulus-responsive pH fluctuations inside cells. Therefore, the newly synthesized nanoprobe could be used as a vital tool for the diagnosis of various diseases and pH-related cell biology research (Fig. 13A). Herein, the UV-Vis absorption band of phenol red overlaps with one of the emission bands of the UCNPs at 557 nm, which led to quenching of the upconversion luminescence (UCL) via IFE. Therefore, phenol red acts as both a pH indicator and quencher of upconversion luminescence via IFE. The other UCL band at 655 nm acted as a reference signal to produce a ratiometric response at varying pH. The reported nanoprobe was also used for the intracellular monitoring of pH using HeLa cells, which will be helpful for monitoring and diagnosis of pH-related diseases.
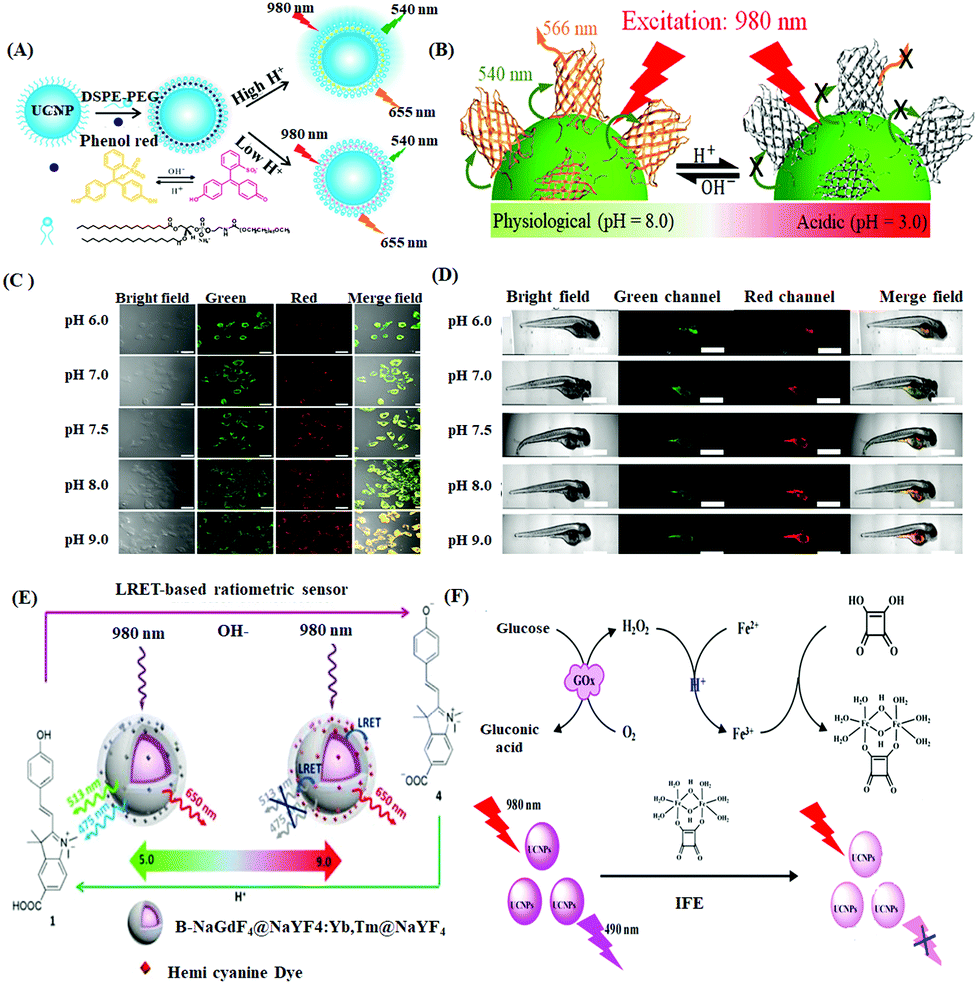 | ||
| Fig. 13 (A) Schematic diagram of the construction of the pH nanoprobe and sensing of pH via IFE. Adopted with permission from ref. 242. (B) Schematic illustration of the pH-dependent energy transfer between Cit-UCNPs and mOrange FPs. Adopted with permission from ref. 243. (C) Confocal microscopic imaging of HeLa cells incubated with UCNPs@SiO2-Ag2S at different pH values. (D) Imaging of zebra fish incubated with UCNPs@SiO2-Ag2S at different pH values. Adopted with permission from ref. 246. (E) Schematic illustration of the LRET-based ratiometric nanosensor for pH detection with hemicyanine dye-modified core/shell/shell UCNPs, Adopted with permission from ref. 252. (F) Schematic representation of the glucose detection mechanism using the UCNPs. Adopted with permission from ref. 251. | ||
Again, Chattopadhyay et al. reported the preparation of a FRET-based ratiometric nanoprobe using UCNPs (NaGdF4:Yb3+,Er3+) as a donor and mOrange fluorescent protein as an acceptor for the efficient sensing of pH (Fig. 13B).243 The synthesized nanoprobe was also employed for monitoring intracellular pH using HeLa cells via pH-dependent ratiometric calibration, which made the nanosensor efficient for using in early cancer detection and other pH malfunctions in cells. In the current scenario, luminescence resonance energy transfer (LRET)-based ratiometric fluorescence assays are limited especially for basic pH. In this perspective, Zhang and Xian et al. reported a pH-responsive LRET-based upconversion nanoprobe via the combination of an energy acceptor, near-infrared (NIR) Ag2S nanodots (NDs) and energy donors, UCNPs, to ultimately produce an NIR excitation-NIR emission based nanoprobe.246 This NIR probe exhibited a ratiometric fluorescence response with fluorescence enhancement at 795 nm (red channel) with an increase in pH, keeping the reference emission constant at 540 nm (green channel). Herein, the LRET efficiency was adjusted by controlling the thickness of the silica layer. Moreover, the photostable UCNPs@SiO2-Ag2S-based probe having excellent biocompatibility, ratiometric pH sensitivity, etc. was explored for the in vitro and in vivo bioimaging of pH in tumor cells and zebra fish with promising sensitivity and selectivity (Fig. 13C and D). Sun and Zhang et al. reported another improved LRET-based NIR ratiometric core/shell/shell-structured upconversion nanophosphor using polyacrylic acid-modified UCNPs as an energy donor and organic moieties as an energy acceptor to detect pH fluctuations mostly in the basic region and monitoring intracellular pH in live HeLa cells (Fig. 13E).252 Hall et al. proposed the preparation of a core–shell upconversion nanoprobe using two anthraquinone dyes, Calcium Red (CaR) and Alizarin Red S (ARS), to efficiently act as a potential pH-responsive nanosensor.247 Initially, the green UCL of the thick-shell UCNPs was quenched via the dynamic quenching mechanism due to the non-diffusional interaction of the donor UCNPs with the quencher dyes. There was promising spectral overlap of the green emission band of the UCNPs with the absorption spectrum of CaR, which was pH dependent, resulting a significant IFE. Therefore, with a variation in pH, the green emission band was tuned, while the other red emission band remained constant due to its pH independence. Thus, this red band could be used as a reference signal during the ratiometric monitoring of pH in a broader range. Nareoja and Schaferling et al. reported the use of polyethyleneimine (PEI)-coated UCNPs for the ratiometric fluorogenic sensing and imaging of intracellular pH.249 PEI was conjugated herein to improve the colloidal stability and increase the number of reactive sites. Red Rhodamine dye, which was used as the energy acceptor, also acted as an efficient pH indicator in the range of 4–8. Moreover, this probe was successfully employed for monitoring intracellular pH in in vitro models. Gallo, Sun, Long and Yan et al. reported another ratiometric fluorescence nanoprobe based on PEI-functionalised UCNPs conjugated with fluorescein (FL) for the effective sensing of pH in the range of 5.0–8.0. Herein, fluorescein was used as the pH-responsive energy acceptor. The synthesized UCNPs exhibited blue and red emission, between which the blue emission decreased with an increase in pH by the absorption of FL to promote its green fluorescence, whereas the red fluorescence remained constant, making it a reference signal to ultimately produce a ratiometric response. The proposed self-calibrated ratiometric nanoprobe was also effectively employed for in vitro cell imaging.250
Myeloperoxidase (MPO) is a heme peroxidase protein related to many inflammatory diseases, which is found in neutrophil anhydrous granulocytes.244 Recently, Zhang and Xian et al. reported the use of a UCNPs-based NIR nanoprobe conjugated with phycocyanin (PC) for the detection and in situ monitoring of MPO via the specific sensing of ClO− and ONOO−, where the fluorescence of the UCNPs was recovered by the target-induced destruction of PC.245 Herein, the absorption spectrum of PC overlapped with the UCL, which quenched the UCL by an efficient FRET process, where PC acted as an energy acceptor. Based on the target-specific destruction of PC, the UCL was again revived to produce “turn-on” luminescence. This probe was effectively applied in real-time biosensing and high-resolution bioimaging in living cells using an acute liver injury mouse together with the bioimaging of exogenous MPO activity in macrophage RAW 264.7 cells.
Chen et al. reported the highly selective fluorogenic determination of Fe3+ using a nanoprobe comprised of UCNPs and N,N-diethyl-p-phenylenediamine (EPA) with the linear range of 0.25–50 μM (fluorogenic method) and limit of detection of 10 μM and 0.65 μM for the chromogenic and fluorogenic method, respectively.248 In the presence of Fe3+, a new UV-Vis absorption peak was generated at 552 nm due to the formation of EPA oxide. Herein, the UCNPs exhibited emissions at 4 different wavelengths including 812, 758, 657 and 546 nm, among which the emission at 546 nm overlapped with the absorption peak of the oxidized product of EPA. This led to effective IFE to quench the UCL emission at 546 nm, whereas the other emission remained constant. Therefore, by the ratiometric fluorescence response of UCNPs at 546 and 758 nm, Fe3+ could be quantified.
Considering that diabetes mellitus has become a worldwide epidemic disease, monitoring of the blood glucose level is very important.253 In this regard, Zhang et al. reported the use of ratiometric UCNPs for H2O2 and glucose detection based on IFE with a linear range of 7–340 μM and LOD of 2.3 μM.251 Herein, by the GOx-catalyzed oxidation of glucose, gluconic acid and H2O2 were produced, which then oxidized Fe2+ to Fe3+. This Fe3+ was then bound to squaric acid to produce the corresponding non-fluorescent ground state complexation, the absorption band of which overlapped with the emission of UCNPs, leading to a significant IFE to induce the corresponding quenching of the UCL emission (Fig. 13F). Interestingly, the developed probe was satisfactorily utilized for monitoring glucose in real human serum samples.
3.7 Polymer dots (PDs)
Polymer dots (Pdots) made of polymers or small molecules254 act as a potential fluorescent nanoprobe having significant biomedical and bioanalytical applications.255a–c The presence of conjugated units in polymer dots make them unique semiconductor materials as the electron-off domain can be moved along the polymer chain.255d Due to their excellent enhanced fluorescence brightness due to both one-photon and two photon stimulation,256 chemically managed surface, no heavy-ion toxicity, biocompatibility, low cytotoxicity,257 good photostability, large Stokes shift,258etc., Pdots are ubiquitously used in the domain of biosensing. These polymer dots can be easily coupled with small organic molecules or biomolecules to tune the energy transfer process to be applied for target-specific detection in complex biological matrices. Nowadays, Pdots have emerged as flexible probes for the detection of numerous biomolecules such as ascorbic acid, quercetin, glutathione, intracellular pH, and alkaline phosphatase, etc.,259–269via the chromogenic and/or fluorogenic strategy through tunable IFE, FRET, PET, static and dynamic quenching mechanism (Table 6).The use of lanthanide ions is highly advantageous in the construction of supramolecular architectures due to their flexible coordination number and very appealing “antenna effect”, which help enhance their photoluminescence behaviour. In this regard, Luo and Li et al. designed fluorogenic AMP-Ce4+/Tb3+ (AMP= adenosine monophosphate)-based infinite coordination polymer (ICP) nanoparticles for the “turn-on” fluorescence detection of ascorbic acid (AA) via the AA-induced redox reaction of Ce4+ (confirmed by the corresponding UV-Vis spectra) together with the sensitization of Tb3+ by the oxidation product of AA. Actually, Tb3+ was sensitized by excitation energy transfer from the oxidation product of AA to Tb3+ (confirmed by the increase in lifetime value in the presence of AA) and the reduced product of Ce4+, i.e., Ce3+ also acted as a sensitizer for Tb3+ due to their comparable energy states, which was ultimately helpful to enhance the fluorescence in the presence of AA. This method acquired an LOD of 190 nM towards the detection of AA.259 The sensitivity of the designed nanosensor was investigated in real serum samples and vitamin C samples with qualified recoveries.
Again, the detection of the natural flavonoid quercetin (Qc) (3,5,7-trihydroxy-2-(3,4-dihydroxyphenyl)-4H-chromen-4-one) is significant due to its important biochemical and pharmacological activities, such as anti-oxidant and anti-inflammatory, etc.270 The design of aggregated non-conjugated polymer dots is an important domain of research to obtain improved optical properties. In this regard, Fan et al. synthesized eco-friendly non-conjugated polymer dots (NCPDs) using polyethyleneimine (PEI) and L-threonine for the selective chromo-fluorogenic detection of Qc.260 NCPDs exhibited a selective “turn-off” fluorescence response due to the synergism of static quenching (confirmed from the lifetime data) and IFE of the NCPDs-Qc ensemble via ground state complexation (confirmed from the overlap of the absorption spectrum of Qc with the excitation spectrum of NCPDs), which acquired the detection limit for Qc of 0.22 μg mL−1 and 8.5 ng mL−1 by the chromogenic and fluorogenic methods, respectively. The sensitivity was also checked via the detection of Qc in red wine samples.
DNA methyltransferase (MTase) participates in DNA methylation, helping genetic imprinting, normal cell function, human tumorigenesis, etc.271 Huang and Ren et al. proposed a sensitive and simple polystyrene polymer dots (PS Pdots) assay via single-molecule fluorescence correlation spectroscopy (FCS) for the evaluation of DNA adenine methylation (Dam) MTase activity quantitatively.261 This method acquired a detection threshold value of 0.025 U mL−1, making it a suitable approach for the analysis of Dam MTase activity in blood serum and complex matrices and for fast inhibitor screening of Dam MTase-related drugs.
During the surface functionalization of Pdots, sometimes they suffer from low colloidal stability and loss of biocompatibility. In this regard, to improve their biocompatibility and colloidal stability, Sun and Gao et al. developed novel two-photon fluorescent hybrid Pdots, DA-CD@Pdots, obtained from amino-β-cyclodextrin (β-CD) and dopamine (DA) with other precursors via the nanoprecipitation method. Initially, surface-functionalized DA underwent oxidation to produce a quinine-like structure, dopamine-quinone (DQ), which acted as a good electron acceptor to facilitate fluorescence quenching via the PET process from Pdots to DQ, as confirmed by the corresponding lifetime data. However, in the presence of GSH, DQ was again reduced, which restricted the PET process, leading to the selective “turn-on” fluorescence recovery towards GSH with the detection limit of 2.7 nM (Fig. 14A and B).262 Interestingly, this nanosensor was satisfactorily used for in vitro and in vivo monitoring of GSH using human cervical carcinoma HeLa cells and living zebrafish (Fig. 14C and D), respectively.
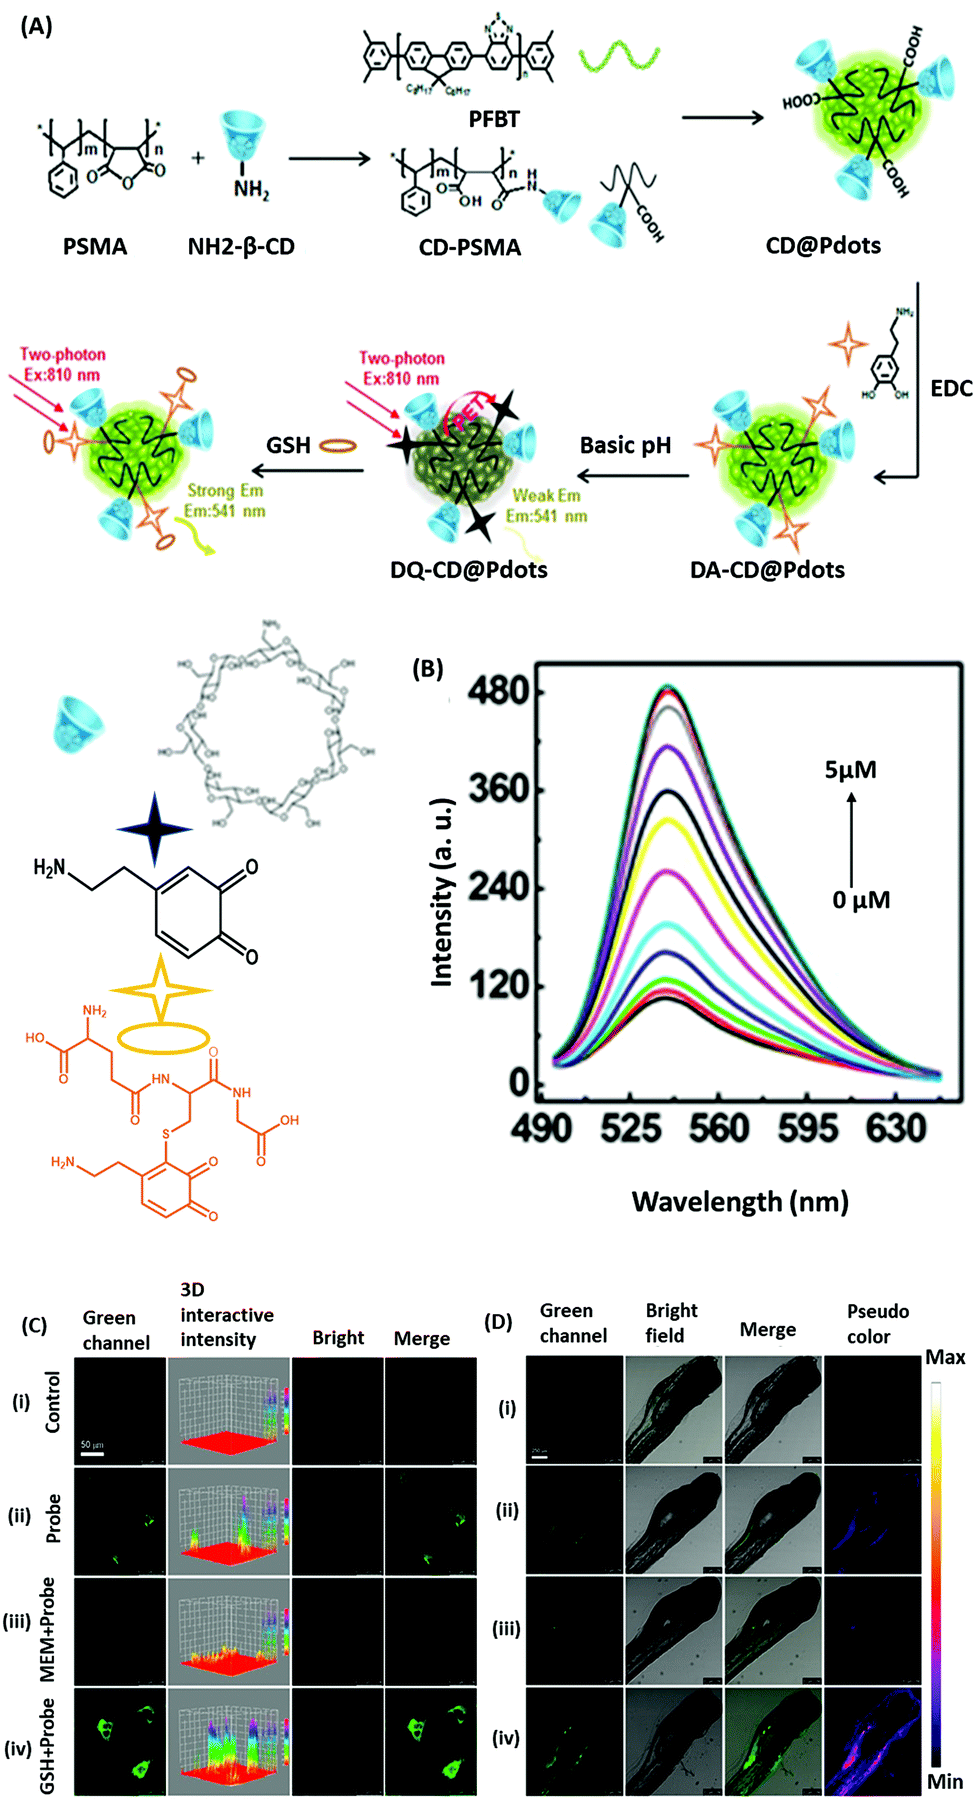 | ||
| Fig. 14 (A) Schematic representation of the designed two-photon hybrid Pdots for GSH sensing. (B) Fluorescence spectral change of GSH. (C) In vitro cell imaging of untreated control HeLa cells (i), HeLa cells labeled with DQ–CD@Pdots (ii), HeLa cells pretreated with N-methylmaleimide (iii), and HeLa cells pretreated with GSH (iv). (D) In vivo cell imaging of 7 day old zebrafish: (i) untreated zebrafish (control), (ii) zebra fish incubated with DQ–CD@Pdots, (iii) zebrafish pretreated with NEM, and (iv) GSH. Adopted with permission from ref. 262. | ||
Alkaline phosphatase (ALP) plays a vital role in intracellular signal transmission and protein activity regulation process, and thus an abnormal change in its level is closely related to several chronic diseases.275 Dopamine is one of the important neurotransmitters, which is present in most organisms. This can be easily polymerized to produce polydopamine (PDA), which is one of the important methods of surface functionalization to produce polymer dots. As an energy acceptor, PDA can take part in the FRET process, where energy transfer is possible from the fluorophoric polymer dots to the quencher, PDA. Thus, to find a way for the defined analysis of ALP, Wei et al. established FRET-based semiconducting polymer nanoparticles (SPNs), functionalized with PDA, for the quantitative “turn-on” fluorescence detection of ALP via the single-particle enumeration (SPE) method.267 ALP can hydrolyze 2-phosphate-L-ascorbic acid trisodium salt (AAP) to ascorbic acid (AA). However, in the presence of AA, the formation of PDA is restricted. Based on this phenomenon, herein, a quantitative ALP assay with a “turn-on” fluorescence response was prepared by recovering the inherent fluorescence of SPNs. The reliability of the sensing strategy was also investigated by monitoring ALP in real human serum samples, which will be helpful in clinical diagnosis. Besides, Liu et al. developed a new evolving near infrared fluorescent semiconducting Pdots and dopamine (DA)-melanin nanosystem for the “turn-on” fluorescence detection of GSH with high selectivity and sensitivity via the restricted polymerisation of DA.263 Herein, the NIR-Pdots acted as the fluorophore, while polydopamine (PDA) formed via the oxidative polymerization of DA acted as the quencher. This led to a “turn-off” fluorescence response via both static and dynamic quenching by the FRET process due to the large overlap of the absorption band of PDA with the NIR emission of Pdots. However, in the presence of GSH, the polymerization of DA was inhibited. This nanosensor was fruitfully employed towards detection of GSH in HepG2 cells and real human serum samples with a qualified recovery (97.4–103.3%).
To improve the biocompatibility and sensitivity of Pdots, Jin and Huang et al. proposed semiconductor water-soluble fluorescent Pdots via selective reprecipitation methods, which exhibited ratiometric fluorogenic pH sensing in the pH range of 3.0 to 8.0.264 This probe could also be used for in vivo bioimaging in HeLa cells due to its effective cellular uptake and low cytotoxicity. Alternatively, Wang et al. designed robust two-photon excitable semiconducting polymer nanoparticles (PFV/PSMA-DA NPs) (PFV= poly(9,9′-dihexylfluorene-2,7-ylene-vinylene-co-alt-1,4-phenylene), PSMA= poly(styrene-co-maleic anhydride) and DA = dopamine) via the reprecipitation method, which were functionalized with the redox-active and pH-sensitive DA for the highly sensitive and reversible fluorogenic detection of pH over the range of 5.0 to 9.0 (Fig. 15A).265 In acidic pH, the nanosensor exhibited enhanced fluorescence, while in basic pH, its fluorescence was quenched. This pH-dependent fluorescence fluctuation can be attributed to the electron and/or energy transfer to the fluorophores. This process was mainly facilitated by the facile oxidation of dopamine to quinine, while at acidic pH, this was restricted. Interestingly, this probe showed high stability, low cytotoxicity and biocompatibility for intracellular pH monitoring in living HeLa cells. Again, the mitochondrial pHmit plays a pivotal role in various biochemical processes.272 Thus, it is necessary to find suitable techniques for monitoring pHmit. Contextually, Gao et al. constructed novel ratiometric fluorescent pH-sensitive Congo Red (CR)-modified dual-emitting semiconducting polymer dots (Pdots), CR/TPP@Pdots (TPP = triphenylphosphonium), for mitochondrial pH monitoring and imaging in living Raw 264.7 cells via a competitive FRET mechanism.273 Herein, Pdots were prepared via the nanoprecipitation of TPP-modified polyoxyethylene nonylphenylether (CO-520), poly(9,9-dioctylfluorene)-co-(4,7-di-2-thienyl-2,1,3-benzothiadiazole) (PF-DBT5), poly(9,9-dioctylfluorenyl-2,7-diyl) (PFO) and poly(styrene-co-maleic anhydride) (PSMA), which produced effective FRET from PFO and PF-DBT5 to the quencher, CR. At different pH, the FRET efficiency changed to different extents to produce different fluorescence responses. The as-designed probe exhibited good biocompatibility, enhanced selectivity and sensitivity, appreciable photostability and low cytotoxicity for monitoring pHmit in a broad pH range from 2.57 to 8.96 (Fig. 15B).
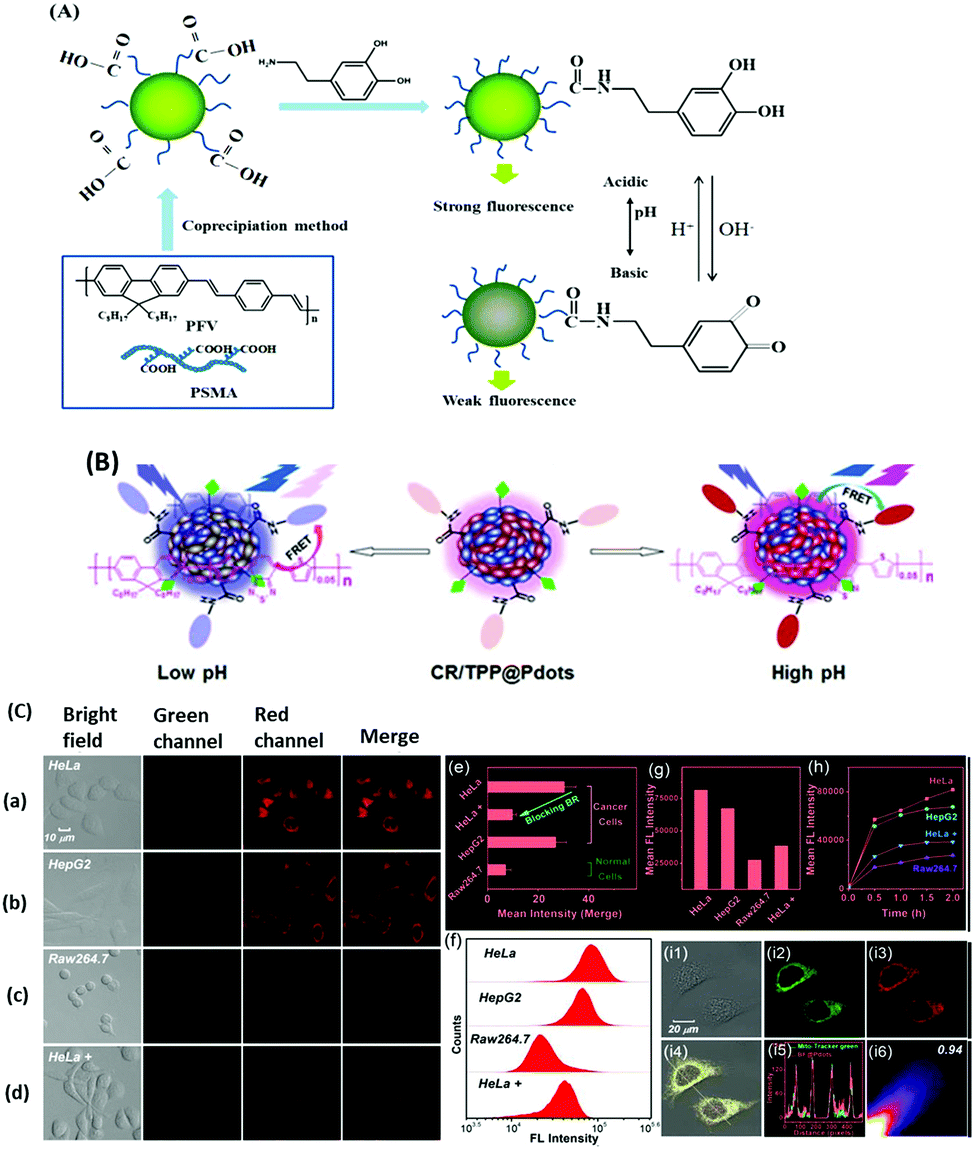 | ||
| Fig. 15 (A) Schematic representation of pH sensing based on PFV/PSMA-DA NPs. Adopted with permission from ref. 265. (B) Schematic representation of the designed mitochondria-targeted Pdots for ratiometric pHmit detection. Adopted with permission from ref. 273. (C) Two-photon images of HeLa (a), HepG2 (b), Raw264.7 (c) and HeLa+ (d). (e) Mean intensity of HeLa cells, HepG2 cells, Raw264.7 cells and HeLa+. (f and g) Flow cytometry assay of HeLa, HepG2, Raw264.7, and HeLa+ cells treated with BF@Pdots. (h) Mean cellular fluorescence intensity of these cell lines incubated with Pdots for different times. Colocalization images of Mito-Tracker Green in the green channel (i2), Pdots in the red channel (i3), merged i1 bright field, i2 and i3 in HeLa cells (i4), intensity profile of the highlighted line in the green and red channels (i5) and colocalization scatter plot of Pdots and Mito-Tracker Green (i6). Adopted with permission from ref. 266. | ||
Precise inspection of the deviation of mitochondrial sulfur dioxide (SO2) and formaldehyde (FA) in cancer cells is significant for studying cancer mechanisms and the role of mitochondrial homeostasis in cancer invasion and metastasis.274 In this case, Gao et al. fabricated novel semiconductor two-photon Pdots following a simple four-step engineering pathway.266 This nanoprobe exhibited a ratiometric fluorescence response in the presence of SO2 or FA via a tunable FRET process with an LOD of 110 nM. Initially, the nanoprobe exhibited two fluorescence emission bands, one was a red band (610 nm) and the other was a green band (500 nm). In the presence of HSO3−, the red band was gradually attenuated with a slight increase in the green band, leading to a ratiometric response via the inhibition of the FRET process due to the consumption of the energy acceptor. This nanoprobe exhibited the reversible detection of SO2 and FA via a reversible Michael addition reaction at the energy acceptor site. Interestingly, the as-designed Pdots could be efficiently exploited for monitoring the dynamic fluctuation of exogenous and endogenous SO2 and FA in the mitochondria of cancer cells and larval zebra fishes, and tumour-bearing mice, exhibiting satisfactory biocompatibility, enhanced permeation and retention effect (Fig. 15C).
Again, Gao et al. fabricated highly fluorescent Pdots combined with non-fluorescent Rhodamine B hydrazide (Rb-hy), Pdots@Rb-hy,269 which underwent a specific interaction with Cu2+ and the Pdots@Rb-hy-Cu2+ ensemble exhibited a “turn-off” fluorescence response via the FRET process between the energy donor, Pdots, with the energy acceptor, RB-hy-Cu(II). Pyrophosphate (PPi) can be hydrolyzed to phosphate (Pi) catalysed by ALP. Furthermore, PPi can be easily coordinated to Cu2+, whereas Pi cannot be coordinated to Cu2+. Based on this fact, the selective ratiometric fluorescence sensing of ALP was achieved by the designed nanoprobe via a tunable FRET process276 with an LOD of 0.0018 U L−1. This nanosensor was satisfactorily used towards the recognition of ALP in human serum.
Deoxyribonucleic acid (DNA) is a crucial nucleotide, which plays a key role in the course of life as it contributes to storing and transmitting genetic information.277 Consequently, an infinitesimal alteration in the structure of DNA can affect in the genetic features of biological organisms, leading to serious disorders.278 Therefore, for the quantitative detection of DNA, Gong et al. designed methylene blue (MB)-modified poly(9,9-di-n-octyfluorenyl-2,7-diyl) (PFO)/poly[2-methoxy-5-(2-ethylhexyloxy)-1,4-(1-cyanovinylene phenylene)] (CN-PPV) Pdots, represented as Pdots@MB, using the nanoprecipitation method.268 Herein, Pdots acted as the fluorophore, while MB acted as the quencher to facilitate the PET process. However, this probe exhibited a selective PET-restricted ratiometric fluorescence response in the presence of DNA via the electrostatic interaction between MB with negatively charged phosphate group of DNA, thereby releasing MB from the surface of Pdots. This nanosensor probe exhibited good biocompatibility, high photostability and efficiency towards the quick ratiometric fluorescence detection of DNA in real serum samples, exhibiting potential for biomedical applications.
4. Conclusions
The last decade has witnessed a mammoth escalation of zero-dimensional nanomaterial-based sensing applications based on their unique size/shape or aggregation/disaggregation-induced chromo-fluorogenic spectral variation. It has been observed that the developed nanosensors can quantitatively monitor different targeted bio-analytes, such as vitamins, DNA, proteins, aminothiols, biothiols, cancer biomarkers etc. Their high surface-to-volume ratio, high thermal/chemical stability, high quantum yield, high photostability, good biocompatibility, tunable luminescence behaviour, aqueous phase stability, etc. make 0D nanomaterials efficient for effective bio-analyte sensing applications. Compared to other detection strategies, the optical sensing strategy based on a chromo-fluorogenic response is advantageous due to the fact that it does not require any expensive instrumentation, rather monitoring target-specific changes by the naked eye. Therefore, these types of sensing strategies significantly reduce the detection time, detection complexity and associated costs. Based on their excellent responses towards target-specific analyte sensing, nanosensors have been effectively exploited towards the detection of analytes in real samples, such as human urine, serum, etc. Their promising fluorogenic response and good biocompatibility have also been exploited towards intracellular monitoring of targeted analytes via fluorescence cell imaging. The sensitivity of nanosensors can be further improved by heteroatom doping or surface functionalization. Besides, fluorescent nanomaterials can be integrated with quencher nanomaterials such as metallic nanoparticles to tune the FRET and IFE processes to obtain better efficiency in the sensing event. Furthermore, the controlled preparation of metallic nanoparticles is beneficial to obtain nanosensors with tunable physico-chemical and fluorescence properties, which also enhance the performance of the developed nanosensors. These fascinating advancements in the domain of biosensing provide a new arena for the selective and sensitive detection of the targeted bio-analytes, which will be ultimately helpful for the regular monitoring of human health and early-stage disease diagnosis in a non-invasive manner.5. Outlook and future perspectives
In this review, we systematically elaborated the fundamentals of the signaling mechanisms responsible for chromo-fluorogenic biosensing by zero-dimensional nanomaterials. Additionally, the numerous biosensing applications of the most common zero-dimensional nanomaterials, such as carbon quantum dots (CQDs), graphene quantum dots (GQDs), inorganic quantum dots (IQDs), magnetic nanoparticles (MNPs), noble metal nanoparticles (AgNPs, AuNPs), upconversion nanoparticles (UCNPs), and polymer dots (PDs) reported in the last few years were discussed. However, sensing employing 0D nanomaterials is still in its infancy and there is room for the advancement of the practical applicability of nanosensors, which need to be addressed in the near future. The major challenges for chromo-fluorogenic biosensing applications can be described as follows:(i) Firstly, the major issue that needs to be addressed is the selective detection of a particular targeted analyte. Although most of the developed nanosensors exhibit sensing specificity for a particular analyte, many sensors suffer from interference from congener bio-analytes. Therefore, an important futuristic strategy will be to develop selective sensors with zero interference from analogous bio-analytes.
(ii) The second point is ultra-sensitivity. Usually, bio-analytes, specifically cancer biomarkers, need to be detected at acute levels, which is also desirable for real-field biological applications. However, in most cases, the targeted bio-analytes cannot be directly detected at that low concentration (pico and femto to zeptomolar), which necessitates the design of signal amplification methods but these methods suffer from several drawbacks, such as prolonged detection time, detection complexity, etc. Therefore, in the near future, ultrasensitive nanosensors will have to be rationally designed for the trace-level detection of targeted bio-analytes without relying on signal-amplification methods.
(iii) Another important issue is the simultaneous and discriminative detection of multiple analytes, i.e., one-to-more-type sensor. Although there are numerous reports on the selective detection of a particular analyte, reports on the detection of multiple analytes with different responses are lagging behind. These types of discriminative multi-analyte sensing strategies are highly advantageous as they are simple, cost-effective, less time-consuming and offer less reagent consumption with multiple responses. Hence, future initiatives should be focused on the fabrication of a single nanosensor having selective and discriminative detection capability for multiple analytes.
(iv) The storage stability of nanosensors is a crucial parameter that should be considered. By optimizing the environmental conditions, e.g., temperature and light, the storage stability of the developed nanosensors may be improved.
(v) The high quantum yield of nanosensors should also be considered because it is crucial for the intracellular monitoring of targeted cancer biomarkers and other bio-analytes via fluorescence cell imaging. In that case, nanosensors should be bio-compatible in nature, specific to the cancer cells with differentiation capability between normal cells and cancer cells and avoid the possibility of false positive and false negative signals.
(vi) The use of the minimum volume of metal-based nanoparticles for the detection of targeted analytes is another important factor. For example, it is always desirable to use a small volume of AgNPs (5–10 μL) due to their toxic nature. Alternatively, the volume of AuNPs-based nanosensors will also have to be reduced in terms of cost. Therefore, there is a domain of cost-effective, biocompatible nanosensor-based research, which should be improved in the near future.
(vii) Another important thing to consider is the sensing mechanism. Amongst the different types of fluorescence signaling mechanisms, including off–on, on–off and ratiometric responses, it is desirable to design nanosensors with a ratiometric response as these types of nanoprobes can act as self-calibrating probes. This can be achieved by proper tuning of the surface functionalization or modulation of the FRET process. Alternatively, analyte detection by self-organizing agents mainly relies on the quenching capability of the targeted analytes. However, in some cases, the analytes are not quenchers. Therefore, some new transduction mechanisms may be designed to accurately quantify the presence of analytes. This will motivate future researchers to design more sophisticated sensing systems with new transduction mechanisms.
(viii) The sensing time and reproducibility should also be considered for the real-day applicability of next-generation nanosensors.
(ix) Moreover, in some cases, the sensing phenomenon is only limited to serum, urine samples, etc. However, the in vivo monitoring of the targeted bio-analytes by nanomaterials suffers from several drawbacks, such as loss of detection accuracy due to the complex biological environment, low bio-compatibility, etc. Therefore, for clinical applications, their long-term bio-toxicity and bio-degradation must be evaluated.
(x) Finally, although there are several reports on the selective detection of targeted analytes followed by the fabrication of microfluidic paper-based devices or other smartphone-integrated or wearable POCT devices for on-field detection applications, the exploitation of these nanosensors in industrial use has not been explored. One plausible reason for this may be due to the fact that most of the optical sensing strategies are still in the proof-of-concept stage as in most of the cases nanosensors suffer from sensing specificity and difficulties in detection of the targeted analytes from complex bio-matrices due to interferences from analogous biomolecules. This necessitates the requirement of future endeavours for the practical applicability of the developed nanosensors, especially in resource-constraint regions.
Typically, zero-dimensional nanomaterials have been well-explored in biosensing applications and significant progress has been achieved in the last few decades. Although there are still some gaps in nanosensing research, there is a huge scope for future analytical advancement in the domain of supramolecular nanosensing, where the developed nanosensors can be practically applied in non-invasive biomedical clinical applications with satisfactory results, making the nanosensing strategy a sustainable approach for global health monitoring in a user-friendly way.
Author contributions
RD and PB conceived the review topic and modified the whole manuscript. RD, RP, SB and MM wrote the manuscript. All authors contributed to the final manuscript.Conflicts of interest
There are no conflicts to declare.Acknowledgements
RD gratefully acknowledges DST-INSPIRE for her fellowship (INSPIRE Roll no: [IF180252]). Department of Higher Education, Science & Technology and Biotechnology, Govt. of West Bengal, India, sponsored project is hereby acknowledged for financial assistance (GAP-225612 vide sanction order no. 78 (Sanc.)/ST/P/S&T/6G-1/2018).Notes and references
- L. Miao, Z. Song, D. Zhu, L. Li, L. Gan and M. Liu, Mater. Adv., 2020, 1, 945–966 RSC.
- S. Dutta, J. Kim, Y. Ide, J. H. Kim, Md.-S. A. Hossain, Y. Bando, Y. Yamauchi and K. C.-W. Wu, Mater. Horiz., 2017, 4, 522–545 RSC.
- Y. Zhang, S. Yuan, G. Day, X. Wang, X. Yang and H.-C. Zhou, Coord. Chem. Rev., 2018, 354, 28–45 CrossRef CAS.
- A. F.-A. A. Melo, A. Hassan, L. J.-A. Macedo, I. Osica, L. K. Shrestha, Q. Ji, O. N. Oliveira Jr., J. Henzie, K. Ariga and F. N. Crespilho, ACS Appl. Mater. Interfaces, 2019, 11(20), 18053–18061 CrossRef CAS PubMed.
- B. L. Li, M. I. Setyawati, L. Chen, J. Xie, K. Ariga, C.-T. Lim, S. Garaj and D. T. Leong, ACS Appl. Mater. Interfaces, 2017, 9(18), 15286–15296 CrossRef CAS PubMed.
- Y. Cai, Z. Wei, C. Song, C. Tang, W. Han and X. Dong, Chem. Soc. Rev., 2019, 48, 22–37 RSC.
- S. Yu, X. Wang, H. Pang, R. Zhang, W. Song, D. Fu, T. Hayat and X. Wang, Chem. Eng. J., 2018, 333, 343–360 CrossRef CAS.
- Z. Li, Y. Sun, Y. Yang, Y. Han, T. Wang, J. Chen and D. C.-W. Tsang, J. Hazard. Mater., 2020, 383, 121240 CrossRef CAS PubMed.
- M. J. Mitchell, M. M. Billingsley, R. M. Haley, M. E. Wechsler, N. A. Peppas and R. Langer, Nat. Rev. Drug Discovery, 2021, 20, 101–124 CrossRef CAS PubMed.
- B. Fonseca-Santos, M. P.-D. Gremião and M. Chorilli, Nanotechnology-based drug delivery systems for the treatment of Alzheimer's disease, Int. J. Nanomed., 2015, 10, 4981–5003 CrossRef CAS PubMed.
- M. Fang, W.-M. Zeisberg, C. Condon, V. Ogryzko, A. Danchin and U. Mechold, Nucl. Acids Res., 2009, 37(15), 5114–5125 CrossRef CAS PubMed.
- A. Santamaria, Nanotoxicity, Humana Press, Totowa, NJ, 2012, pp. 1–12 Search PubMed.
- R. P. Feynman, Plenty of Room at the Bottom, APS Annual Meeting, 1959.
- S. Guo and E. Wang, Anal. Chim. Acta, 2007, 598, 181–192 CrossRef CAS PubMed.
- Q. Jin, W. Wen, S. Zheng, R. Jiang and J.-M. Wu, Nanotechnology, 2021, 32, 295501 CrossRef CAS PubMed.
- (a) S. Islam, S. S. Shah, S. Naher, M. A. Ehsan, A. Aziz and A. J.-S. Ahammad, Chem. – Asian J., 2021, 16(22), 3516–3543 CrossRef CAS PubMed; (b) M. M. Rahman, A. Umar and K. Sawada, Sens. Actuators, B, 2009, 137, 327–333 CrossRef; (c) M. M. Rahman, J. Ahmed and A. M. Asiri, RSC Adv., 2017, 7, 14649–14659 RSC; (d) A. Umar, M. M. Rahman, S. H. Kim and Y. B. Hahn, J. Nanosci. Nanotechnol., 2008, 8, 3216–3221 CrossRef CAS PubMed; (e) S. H. Gebre, New J. Chem., 2022, 46, 5438–5459 RSC; (f) M. M. Hussain, M. M. Rahman, A. M. Asiri and M. R. Awual, RSC Adv., 2016, 6, 80511–80521 RSC.
- J. N. Liu, W. Bu and J. Shi, Chem. Rev., 2017, 117, 6160–6224 CrossRef CAS PubMed.
- P. Sondhi, M. H.-U. Maruf and K. J. Stine, Biosensors, 2020, 10(1), 2 CrossRef CAS PubMed.
- R. Liang, M. Wei, D. G. Evans and X. Duan, Chem. Commun., 2014, 50, 14071–14081 RSC.
- E. Singh, K. S. Kim, G. Y. Yeom and H. S. Nalwa, ACS Appl. Mater. Interfaces, 2017, 9, 3223–3245 CrossRef CAS PubMed.
- (a) E. Singh, K. S. Kim, G. Y. Yeom and H. S. Nalwa, RSC Adv., 2017, 7, 28234–28290 RSC; (b) S. Ul Haque, A. Nasar, Inamuddin and M. M. Rahman, Sci. Rep., 2020, 10, 10428 CrossRef PubMed.
- (a) T. R. Fadel, D. F. Farrell, L. E. Friedersdorf, M. H. Griep, M. D. Hoover, M. A. Meador and M. Meyyappan, ACS Sens., 2016, 1, 207–216 CrossRef CAS PubMed; (b) S. Premcheska, M. Lederer and A. M. Kaczmarek, Chem. Commun., 2022, 58, 4288–4307 RSC; (c) M. Ghirardello, R. Shyam, X. Liu, T. G. Millan, I. Sittel, J. R. Soriano, K. M. Kurian and M. C. Galan, Nanoscale Adv., 2022, 4, 1770–1778 RSC; (d) M. Sun, X. Wang, X. Guo, L. Xu, H. Kuang and C. Xu, Chem. Sci., 2022, 13, 3069–3081 RSC; (e) S. Sivagnanam, K. Das, M. Basak, T. Mahata, A. Stewart, B. Maity and P. Das, Nanoscale Adv., 2022, 4, 1694–1706 RSC; (f) C. Lu, X. Xu, T. Zhang, Z. Wang and Y. Chai, J. Mater. Chem. B, 2022, 10, 1623–1633 RSC; (g) H. Zhao, H. Wang, H. Li, T. Zhang, J. Zhang, W. Guo, K. Fu and G. Du, Nanoscale Adv., 2022, 4, 1815–1826 RSC; (h) M. Rodriguez-Rios, A. Megia-Fernandez, D. J. Norman and M. Bradley, Chem. Soc. Rev., 2022, 51, 2081–2120 RSC.
- W. Zhou, X. Gao, D. Liu and X. Chen, Chem. Rev., 2015, 115, 10575–10636 CrossRef CAS PubMed.
- (a) Z. Wang, S. Zong, L. Wu, D. Zhu and Y. Cui, Chem. Rev., 2017, 117, 7910–7963 CrossRef CAS PubMed; (b) A. Umar, M. M. Rahman and Y.-B. Hahn, Electrochem. Commun., 2009, 11, 1353–1357 CrossRef CAS; (c) M. M. Alam, A. M. Asiri, M. M. Rahman and M. A. Islam, Mater. Chem. Phys., 2020, 244, 122740 CrossRef CAS; (d) M. M. Alam, A. M. Asiri, M. T. Uddin, M. A. Islam, M. R. Awual and M. M. Rahman, New J. Chem., 2019, 43, 8651–8659 RSC; (e) G. Gumilar, Y. V. Kaneti, J. Henzie, S. Chaterjee, J. Na, B. Yuliarto, N. Nugraha, A. Patah, A. Bhaumik and Y. Yamauchi, Chem. Sci., 2020, 11, 3644–3655 RSC; (f) N. Pal, S. Banerjee and A. Bhaumik, J Colloid Interface Sci., 2018, 516, 121–127 CrossRef CAS PubMed; (g) N. Pal, B. Saha, S. K. Kundu, A. Bhaumik and S. Banerjee, New J. Chem., 2015, 39, 8035–8043 RSC; (h) M. M. Alam, A. M. Asiri, M. T. Uddin, M. A. Islam, Md.-R. Awual and M. M. Rahman, New J. Chem., 2019, 43, 8651–8659 RSC; (i) M. M. Rahman, M. M. Hussain and A. M. Asiri, RSC Adv., 2019, 9, 31670–31682 RSC; (j) S. B. Khan, M. M. Rahman, A. M. Asiri, S. A.-B. Asif, S. A.-S. Al-Qarni, A. G. Al-Sehemi, S. A. Al-Sayari and M. S. Al-Assiri, Phys. E, 2014, 62, 21–27 CrossRef CAS.
- K. Saha, S. S. Agasti, C. Kim, X. Li and V. M. Rotello, Chem. Rev., 2012, 112, 2739–2779 CrossRef CAS PubMed.
- T. Wei, T. Dong, Z. Wang, J. Bao, W. Tu and Z. Dai, J. Am. Chem. Soc., 2015, 137, 8880–8888 CrossRef CAS PubMed.
- X. Q. Chen, F. Wang, J. Y. Hyun, T. W. Wei, J. Qiang, X. T. Ren, I. Shin and J. Yoon, Chem. Soc. Rev., 2016, 45, 2976–3016 RSC.
- S. Lee, K. K. Y. Yuen, K. A. Jolliffe and J. Yoon, Chem. Soc. Rev., 2015, 44, 1749–1762 RSC.
- S. A. Lee, J. J. Lee, J. W. Shin, K. S. Min and C. Kim, Dyes Pigm., 2015, 116, 131–138 CrossRef CAS.
- Y. Sasaki, X. Lyu, R. Kubota, S.-Y. Takizawa and T. Minami, ACS Appl. Bio Mater., 2021, 4(3), 2113–2119 CrossRef CAS PubMed.
- P. Ravichandiran, D. S. Prabakaran, N. Maroli, A. Boguszewska-Czubara, M. Masłyk, A. R. Kim, B. Chandrasekaran and D. J. Yoo, Anal. Chim. Acta, 2021, 1181, 338896 CrossRef CAS PubMed.
- X. H. Pham, E. Hahm, T. H. Kim, H. M. Kim, S. H. Lee, Y. S. Lee, D. H. Jeong and B. H. Jun, Sci. Rep., 2018, 8(1), 6290 CrossRef PubMed.
- D. Li, S. Song and C. Fan, Acc. Chem. Res., 2010, 43(5), 631–641 CrossRef CAS PubMed.
- V. Gubala, L. F. Harris, A. J. Ricco, M. X. Tan and D. E. Williams, Anal. Chem., 2012, 84, 487–515 CrossRef CAS PubMed.
- G. Rong, S. R. Corrie and H. A. Clark, ACS Sens., 2017, 2, 327–338 CrossRef CAS PubMed.
- O. Erol, I. Uyan, M. Hatip, C. Yilmaz, A. B. Tekinay and M. O. Guler, Nanomedicine, 2018, 14(7), 2433–2454 CrossRef CAS PubMed.
- S. K. Krishnan, E. Singh, P. Singh, M. Meyyappan and H. S. Nalwa, RSC Adv., 2019, 9, 8778–8881 RSC.
- S.-K. Sun, H.-F. Wang and X.-P. Yan, Acc. Chem. Res., 2018, 51, 1131–1143 CrossRef CAS PubMed.
- H. Wang, H. Rao, M. Luo, X. Xue, Z. Xue and X. Lu, Coord. Chem. Rev., 2019, 398, 113003 CrossRef CAS.
- (a) Z. Zhang, H. Wang, Z. Chen, X. Wang, J. Choo and L. Chen, Biosens. Bioelectron., 2018, 114, 52–65 CrossRef CAS PubMed; (b) A. Ambrosi, C. K. Chua, A. Bonanni and M. Pumera, Chem. Rev., 2014, 114, 7150–7188 CrossRef CAS PubMed.
- G. Yue, S. Su, N. Li, M. Shuai, X. Lai, D. Astruc and P. Zhao, Coord. Chem. Rev., 2016, 311, 75–84 CrossRef CAS.
- M. Iarossi, C. Schiattarella, I. Rea, L. De Stefano, R. Fittipaldi, A. Vecchione, R. Velotta and B. D. Ventura, ACS Omega, 2018, 3(4), 3805–3812 CrossRef CAS PubMed.
- R. de la Rica and M. M. Stevens, Nat. Nanotechnol., 2012, 7, 821–824 CrossRef CAS PubMed.
- Y. Jia, W. Zheng, X. Zhao, J. Zhang, W. Chen and X. Jiang, Anal. Chem., 2018, 90, 8276–8282 CrossRef CAS PubMed.
- J.-b Zeng, Y.-y Cao, J.-j Chen, X.-d Wang, J.-f Yu, B.-b Yu, Z.-f Yan and X. Chen, Nanoscale, 2014, 6, 9939–9943 RSC.
- F. Sancenon and R. M. Manez, Chem. Rev., 2003, 103(11), 4419–4476 CrossRef PubMed.
- A. Poggi, A. Taglietti, C. Mangano, L. Fabbrizzi, P. Pallavicini and V. Amendola, Coord. Chem. Rev., 2018, 21, 219–221 Search PubMed.
- A. P. de Silva, A. J.-M. Huxley, C. P. McCoy, H. Q.-N. Gunaratne, J. T. Rademacher, T. Gunnlaugsson and T. E. Rice, Chem. Rev., 1997, 97(5), 1515–1566 CrossRef CAS PubMed.
- A. P. de Silva, D. C. Magri and J. F. Callan, Tetrahedron, 2005, 61, 8551–8588 CrossRef.
- B. Valeur and I. Leray, Coord. Chem. Rev., 2000, 205(1), 3–40 CrossRef CAS.
- C. H. Huang, F. Y. Li and Q. Zhao, Chem. Soc. Rev., 2010, 39, 3007–3030 RSC.
- A. J. Lam, F. St-Pierre, Y. Gong, J. D. Marshall, P. J. Cranfill, M. A. Baird, M. R. McKeown, J. Wiedenmann, M. W. Davidson, M. J. Schnitzer, R. Y. Tsien and M. Z. Lin, Nat. Methods, 2012, 9, 1005–1012 CrossRef CAS PubMed.
- R. A. Cardullo, Methods Cell Biol., 2013, 114, 441–456 Search PubMed.
- (a) A. M. Smith and S. Nie, Acc. Chem. Res., 2010, 43, 190–200 CrossRef CAS PubMed; (b) J. Zhou, Y. Liu, J. Tang and W. Tang, Mater. Today, 2017, 20, 360–376 CrossRef CAS; (c) T. Nareoja, T. Deguchi, S. Christ, R. Peltomaa, N. Prabhakar, E. Fazeli, N. Perala, J. M. Rosenholm, R. Arppe, T. Soukka and M. Schaferling, Anal. Chem., 2017, 89(3), 1501–1508 CrossRef CAS PubMed; (d) C. Li, J. Zuo, L. Zhang, Y. Chang, Y. Zhang, L. Tu, X. Liu, B. Xue, Q. Li, H. Zhao, H. Zhang and X. Kong, Sci. Rep., 2016, 6, 38617 CrossRef CAS PubMed.
- Y. Han, M. O. Noor, A. Sedighi, U. Uddayasankar, S. Doughan and U. J. Krull, Langmuir, 2017, 33, 12839–12858 CrossRef CAS PubMed.
- S. Chen, Y.-L. Yu and J.-H. Wang, Anal. Chim. Acta, 2018, 999, 13–26 CrossRef CAS PubMed.
- G. Blagoi, Fluorescence Resonance Energy Transfer (FRET) Based Sensors for Bioanalysis, University of New Orleans Theses and Dissertations, 2004 Search PubMed.
- J. S. Kim and D. T. Quang, Chem. Rev., 2007, 107(9), 3780–3799 CrossRef CAS PubMed.
- A. Iqbal, Y. Tian, X. Wang, D. Gong, Y. Guo, K. Iqbal, Z. Wang, W. Liu and W. Qin, Sens. Actuators, B, 2016, 237, 408–415 CrossRef CAS.
- J. R. Lakowicz, Principles of fluorescence spectroscopy, Maryland, USA, 2006 Search PubMed.
- W. Liu, H. Diao, H. Chang, H. Wang, T. Li and W. Wei, Sens. Actuators, B, 2017, 241, 190–198 CrossRef CAS.
- (a) F. Du, Z. Cheng, G. Wang, M. Li, W. Lu, S. Shuang and C. Dong, J. Agric. Food Chem., 2021, 69(9), 2836–2844 CrossRef CAS PubMed; (b) J. R. Lakowicz, Principles of fluorescence spectroscopy, Maryland, USA, 2006 CrossRef; (c) Y. Z. Fan, Y. Zhang, N. Li, S. G. Liu, T. Liu, N. B. Li and H. Q. Luo, Sens. Actuators, B, 2017, 240, 949–955 CrossRef CAS; (d) H. Liu, C. Xu, Y. Bai, L. Liu, D. Liao, J. Liang, L. Liu and H. Han, Sens. Actuators, A, 2017, 171, 311–316 CAS.
- S. Song, J. Hu, M. Li, X. Gong, C. Dong and S. Shuang, Mater. Sci. Eng., C, 2021, 118, 111478 CrossRef CAS PubMed.
- J. Shangguan, D. He, X. He, K. Wang, F. Xu, J. Liu, J. Tang, X. Yang and J. Huang, Anal. Chem., 2016, 88(15), 7837–7843 CrossRef CAS PubMed.
- Y. Meng, H. Zhang, M. Li, W. Lu, Y. Liu, X. Gong, S. Shaung and C. Dong, Biomater. Sci., 2021, 9, 2255–2261 RSC.
- X. Wang, Y. Wang, W. Pan, J. Wang and X. Sun, ACS Sustainable Chem. Eng., 2021, 9(10), 3718–3726 CrossRef CAS.
- N. Nandi, S. Gaurav, P. Sarkar, S. Kumar and K. Sahu, ACS Appl. Bio Mater., 2021, 4(6), 5201–5211 CrossRef CAS PubMed.
- Z. Sun, Z. Chen, J. Luo, Z. Zhu, X. Zhang, R. Liu and Z. Wu, Dyes Pigm., 2020, 176, 108227 CrossRef CAS.
- Y. Qin, Z. Yan, R. Liu, C. Qu, H. Mao, L. Qu and R. Yang, Luminescence, 2021, 36(7), 1584–1591 CrossRef CAS PubMed.
- X. Liu, S. Zhang, H. Xu, R. Wang, L. Dong, S. Gao, B. Tang, W. Fang, F. Hou, L. Zhong and A. Aldalbahi, ACS Appl. Mater. Interfaces, 2020, 12(42), 47245–47255 CrossRef CAS PubMed.
- X. Yang, F. Cui, R. Ren, J. Sun, J. Ji, F. Pi, Y. Zhang and X. Sun, ACS Omega, 2019, 4(7), 12575–12583 CrossRef CAS PubMed.
- Y. Jiao, Y. Gao, Y. Meng, W. Lu, Y. Liu, H. Han, S. Shuang, L. Li and C. Dong, ACS Appl. Mater. Interfaces, 2019, 11(18), 16822–16829 CrossRef CAS PubMed.
- J. Du, Y. Yang, T. Shao, S. Qi, P. Zhang, S. Zhuo and C. Zhu, J. Colloid Interface Sci., 2021, 587, 376–384 CrossRef CAS PubMed.
- C. Ke, T. Lu and J. Chen, Biosens. Bioelectron., 2020, 151, 111965 CrossRef CAS.
- G. Hu, L. Ge, Y. Li, M. Mukhtar, B. Shen, D. Yang and J. Li, J. Colloid Interface Sci., 2020, 579, 96–108 CrossRef CAS.
- Y. Cui, R. Liu, F. Ye and S. Zhao, Nanoscale, 2019, 11, 9270–9275 RSC.
- H. Liu, Y. Sun, Z. Li, J. Yang, A. A. Aryee and L. Qu, Nanoscale, 2019, 11, 8458–8463 RSC.
- J. Gu, X. Li, Z. Zhou, W. Liu, K. Lia, J. Gao, Y. Zhao and Q. Wang, Nanoscale, 2019, 11, 13058–13068 RSC.
- M. Zan, C. Li, D. Zhu, L. Rao, Q. Meng, B. Chen, W. Xie, X. Qie, L. Li, X. Zeng, Y. Li, W. Dong and W. Liu, J. Mater. Chem. B, 2020, 8, 919–927 RSC.
- K. Chen, W. Qing, W. Hu, M. Lu, Y. Wang and X. Liu, Sens. Actuators, A, 2019, 213, 228–234 CAS.
- M. Wang, Y. Wan, K. Zhang, Q. Fu1, L. Wang, J. Zeng, Z. Xia and D. Gao, Anal. Bioanal. Chem., 2019, 411, 2715–2727 CrossRef CAS PubMed.
- W. Yao, N. Wu, Z. Lin, J. Chen, S. Li, S. Weng, L. Zhang, A. Liu and X. Lin, Microchim. Acta, 2017, 184, 907–914 CrossRef CAS.
- W. Song, W. Duan, Y. Liu, Z. Ye, Y. Chen, H. Chen, S. Qi, J. Wu, D. Liu and L. Xiao, Anal. Chem., 2017, 89(24), 13626–13633 CrossRef CAS PubMed.
- Y. Ding, X. Gong, Y. Liu, W. Lu, Y. Gao, M. Xian, S. Shuang and C. Dong, Talanta, 2018, 189, 8–15 CrossRef CAS PubMed.
- S. Konar, B. N.-P. Kumar, M. K. Mahto, D. Samanta, M. A.-S. Shaik, M. Shaw, M. Mandal and A. Pathak, Sens. Actuators, B, 2019, 286, 77–85 Search PubMed.
- Y. Hu, Z. Gao, J. Yang, H. Chen and L. Han, J. Colloid Interface Sci., 2019, 538, 481–488 CrossRef CAS PubMed.
- Y. Jia, Y. Hu, Y. Li, Q. Zeng, X. Jiang and Z. Cheng, Microchim. Acta, 2019, 186, 84 CrossRef PubMed.
- Q. Huang, Q. Li, Y. Chen, L. Tong, X. Lin, J. Zhu and Q. Tong, Sens. Actuators, B, 2018, 276, 82–88 CrossRef CAS.
- Y. Gao, Y. Jiao, W. Lu, Y. Liu, H. Han, X. Gong, M. Xian, S. Shuang and C. Dong, J. Mater. Chem. B, 2018, 6, 6099–6107 RSC.
- P. Gong, L. Sun, F. Wang, X. Liu, Z. Yan, M. Wang, L. Zhang, Z. Tian, Z. Liu and J. You, Chem. Eng. Sci., 2019, 356, 994–1002 CrossRef CAS.
- Y. Zhou, J. Won, J. Lee and Y. Yoon, Chem. Commun., 2011, 47, 1997–1999 RSC.
- M. Yang, Y. Song, M. Zhang, S. Lin, Z. Hao, Y. Liang, D. Zhang and P. R. Chen, Angew. Chem., Int. Ed., 2012, 51(31), 7674–7679 CrossRef CAS PubMed.
- W. Song, W. Duan, Y. Liu, Z. Ye, Y. Chen, H. Chen, H. Qi, J. Wu, D. Liu, L. Xiao, C. Ren and X. Chen, Anal. Chem., 2017, 24, 13626–13633 CrossRef PubMed.
- L. Zeng, W. Jiang, L. Liu, S. Song and H. Kuang, Food Agric. Immunol., 2018, 29(1), 121–132 CrossRef CAS.
- S. Zhu, Q. Meng, L. Wang, L. Zhang, Y. Song, H. Jin, K. Zhang, H. Sun, H. Wang and B. Yang, Angew. Chem., Int. Ed., 2013, 52(14), 3953–3957 CrossRef CAS PubMed.
- Y. Sun, M. Zhang and Z. Fang, Trends Food Sci. Tech., 2019, 105, 468–482 CrossRef.
- S. Chakravarty, B. Gogoi, B. Mandal, N. Bhardwaj and N. S. Sarma, Biosens. Bioelectron., 2018, 112, 18–22 CrossRef CAS PubMed.
- H. Fang, J. Kang and D. Zhang, Microb. Cell Fact., 2017, 16, 15 CrossRef PubMed.
- Y. Menga, Y. Jiaoa, Y. Zhanga, W. Lua, X. Wanga, S. Shuanga and C. Dong, J. Hazard. Mater., 2018, 112, 18–22 Search PubMed.
- A. Ojida, H. Nonaka, Y. Miyahara, S. Tamaru, K. Sada and I. Hamachi, Angew. Chem., Int. Ed., 2006, 45(33), 5518–5521 CrossRef CAS PubMed.
- X. F. Yang, Q. Huang, Y. Zhong, Z. Li, H. Li, M. Lowry, J. O. Escobedo and R. M. Strongin, Chem. Sci., 2014, 5, 2177–2183 RSC.
- S. J. Li, Y. J. Fu, C. Y. Li, Y. F. Li, L. H. Yi and J. O. Yang, Anal. Chim. Acta, 2017, 994, 73–81 CrossRef CAS PubMed.
- (a) E. M. Farre, P. Geigenberger and L. Willmitzer, Plant Physiol., 2000, 123, 681–688 CrossRef CAS PubMed; (b) K. Jiang, S. Sun, L. Zhang, Y. Lu, A. Wu, C. Cai and H. Lin, Angew. Chem., Int. Ed., 2015, 54, 5360–5363 CrossRef CAS PubMed.
- H.-F. Lu, M.-M. Zhang, D. Wu, J.-L. Huang, L.-L. Zhu, C.-M. Wang and Q.-L. Zhang, Sens. Actuators, B, 2018, 258, 461–469 CrossRef CAS.
- L. Feng, Y. Wu, D. Zhang, X. Hu, J. Zhang, P. Wang, Z. Song, X. Zhang and W. Tan, Anal. Chem., 2017, 89(7), 4077–4084 CrossRef CAS PubMed.
- (a) A. Khan, A. A.-P. Khan, A. M. Asiri, M. A. Rub, M. M. Rahman and S. Ab Ghani, Microchim. Acta, 2014, 181, 1049–1057 CrossRef CAS; (b) A. Kalkal, R. Pradhan, S. Kadian, G. Manik and G. Packirisamy, ACS Appl. Bio Mater., 2020, 3, 4922–4932 CrossRef CAS PubMed; (c) S. Javanbakht and H. Namazi, Doxorubicin Loaded Carboxymethyl Cellulose/Graphene Quantum dot Nanocomposite Hydrogel Films as a potential Anticancer Drug Delivery System, Elsevier B.V., Amsterdam, The Netherlands, 2018, vol. 87, ISBN 4133340191 Search PubMed.
- J. Dong, K. Wang, L. Sun, B. Sun, M. Yang, H. Chen, Y. Wang, J. Sun and L. Dong, Sens. Actuators, B, 2018, 256, 616–623 CrossRef CAS.
- Z. Fan, S. Zhou, C. Garcia, L. Fan and J. Zhou, Nanoscale, 2017, 9, 4928–4933 RSC.
- Z. Qu, W. Na, X. Liu, H. Liu and X. Su, Anal. Chim. Acta, 2017, 997, 52–59 CrossRef PubMed.
- H. Liu, W. Na, Z. Liu, X. Chen and X. Su, Biosens. Bioelectron., 2017, 92, 229–233 CrossRef CAS PubMed.
- X. Liu, W. Na, H. Liu and X. Su, Biosens. Bioelectron., 2017, 98, 222–226 CrossRef CAS PubMed.
- N. Li, A. Than, J. Chen, F. Xi, J. Liu and P. Chen, Biomater. Sci., 2018, 6, 779–784 RSC.
- H. Liu, N. Li, H. Zhang, F. Zhang and X. Su, Talanta, 2018, 189, 190–195 CrossRef CAS PubMed.
- Q. Ren, L. Ga and J. Ai, ACS Omega, 2019, 4(14), 15842–15848 CrossRef CAS PubMed.
- H. Safardoust-Hojaghan, O. Amiri, M. Hassanpour, M. Panahi-Kalamuei, H. Moayedi and M. Salavati-Niasari, Food Chem., 2019, 295, 530–536 CrossRef CAS PubMed.
- S. Ge, J. He, C. Ma, J. Liu, F. Xi and X. Dong, Talanta, 2019, 199, 581–589 CrossRef CAS PubMed.
- Y. Zhang, X. Yang, Y. Pu, W. Cheng, S. Lin, Z. Shao and X. Liao, J. Fluoresc., 2019, 29, 541–548 CrossRef CAS PubMed.
- X. Zhu, Z. Zhang, Z. Xue, C. Huang, Y. Shan, C. Liu, X. Qin, W. Yang, X. Chen and T. Wang, Anal. Chem., 2017, 89(22), 12054–12058 CrossRef CAS PubMed.
- Z. Wang and Z. Fan, Sens. Actuators, A, 2018, 189, 195–201 CAS.
- T.-T. Xu, J.-X. Yang, J.-M. Song, J.-S. Chen, H.-L. Niu, C.-J. Mao, S.-Y. Zhsng and Y.-H. Shen, Sens. Actuators, B, 2017, 243, 863–872 CrossRef CAS.
- L. Chen, C. Wu, P. Du, X. Feng, P. Wu and C. Cai, Talanta, 2017, 164, 100–109 CrossRef CAS.
- E. J. Llorent-Martínez, G. M. Durán, Á. Ríos and A. Ruiz-Medina, Anal. Bioanal. Chem., 2018, 410, 391–398 CrossRef PubMed.
- S. A.-O. Gomes, C. S. Vieira, D. B. Almeida, J. R. Santos-Mallet, R. F.-S. Menna-Barreto, C. L. Cesar and D. Feder, Sensors, 2011, 11(12), 11664–11678 CrossRef CAS.
- (a) D. Kumar, M. M. Rahman and S. Devadason, Appl. Nanosci., 2013, 3, 453–459 CrossRef; (b) A. M. Dennis, W. J. Rhee, D. Sotto, S. N. Dublin and G. Bao, ACS Nano, 2012, 6, 2917–2924 CrossRef CAS PubMed; (c) J. Saha, A. Datta Roy, D. Dey, D. Bhattacharjee and S. Arshad Hussain, Mater. Today-Proc., 2018, 5, 2306–2313 CrossRef CAS; (d) U. Resch-Genger, M. Grabolle, S. Cavaliere-Jaricot, R. Nitschke and T. Nann, Nat. Methods, 2008, 5, 763 CrossRef CAS PubMed; (e) Y. Q. Li, L. Sun, J. Qian, L. L. Long, H. N. Li, Q. Liu and J. R. Cai, Biosens. Bioelectron., 2017, 92, 26–32 Search PubMed; (f) C. Han and H. Li, Small, 2008, 4, 1344–1350 CrossRef CAS PubMed; (g) T. Jin, F. Fujii, H. Sakata, M. Tamura and M. Kinjo, Chem. Commun., 2005, 4300–4302 RSC.
- J. Chen, S. Jiang, M. Wang, X. Xie and X. Su, Sens. Actuators, B, 2021, 339, 129910 CrossRef CAS.
- P. Chen, S. Yan, E. Sawyer, B. Ying, X. Wei, Z. Wub and J. Geng, Analyst, 2019, 144, 1147–1152 RSC.
- (a) J. Jiménez-López, S. S.-M. Rodrigues, D. S.-M. Ribeiro, P. Ortega-Barrales, A. Ruiz-Medina and J. L.-M. Santos, Sens. Actuators, A, 2019, 212, 246–254 Search PubMed; (b) J. Guo, Y. Zhang, Y. Luo, F. Shen and C. Sun, Talanta, 2014, 125, 385–392 CrossRef CAS.
- L. L. Zhou, F. Ji, T. Zhang, F. Wang, Y. Li, Z. Yu, X. Jin and B. Ruan, Talanta, 2019, 197, 444–450 CrossRef CAS PubMed.
- Y. Lva, F. Wang, N. Lib, R. Wub, J. Lib, H. Shenb, L. S. Lib and F. Guo, Sens. Actuators, B, 2019, 301, 127118 CrossRef.
- Y. Wang, M. Yang, Y. Ren and J. Fan, Microchim. Acta, 2019, 185(5), 1–9 Search PubMed.
- A. Chen, X. Peng, Z. Pan, K. Shao, J. Wang and M. Fan, J. Agric. Food Chem., 2018, 66(25), 6431–6438 CrossRef CAS PubMed.
- G. Mao, M. Du, X. Wang, X. Ji and Z. He, Analyst, 2018, 143, 5295–5301 RSC.
- X. Lu, C. Wang, J. Qian, C. Ren, K. An and K. Wang, Anal. Chim. Acta, 2019, 1047, 163–171 CrossRef CAS PubMed.
- J. Li, H. Wu, I. Santana, M. Fahlgren and J. P. Giraldo, ACS Appl. Mater. Interfaces, 2018, 34(10), 28279–28289 CrossRef PubMed.
- M. Tang, J. Pi, Y. Long, N. Huang, Y. Cheng and H. Zheng, Sens. Actuators, A, 2018, 201, 82–87 CAS.
- (a) W. Xu, Y. Xiong, W. Lai, Y. Xu, C. Li and M. Xie, Biosens. Bioelectron., 2014, 56, 144–150 CrossRef CAS PubMed; (b) S. Bagdeli, A. H. Rezayan, R. A. Taheri, M. Kamali and M. Hosseini, J. Lumin., 2017, 192, 932–939 CrossRef CAS.
- Ł. Rodzik-Czałka, J. Lewandowska-Łańcucka, V. Gatta, I. Venditti, I. Fratoddi, M. Szuwarzyński, M. Romek and M. Nowakowska, J. Colloid Interface Sci., 2017, 514, 479–490 CrossRef PubMed.
- D. Bhattacharyya, P. K. Sarswat and M. L. Free, Vacuum, 2017, 146, 606–613 CrossRef CAS.
- H. Liu, M. Li, L. Jiang, F. Shen, Y. Hu and X. Ren, Sens. Actuators, A, 2017, 173, 105–113 CAS.
- N. Verma, A. Kumar Singh and N. Saini, Sens. Bio-Sens. Res., 2017, 15, 41–45 CrossRef.
- R. K. Ratnesh and M. S. Mehata, Sens. Actuators, A, 2022, 273, 120943 Search PubMed.
- Z. Sheng and L. Chen, Anal. Bioanal. Chem., 2017, 409, 6081–6090 CrossRef CAS PubMed.
- M. S. Yazdanparast, W. R. Jeffries, E. R. Gray and E. J. McLaurin, J. Funct. Biomater., 2017, 8(3), 36 CrossRef.
- Z. Wei, H. Li, S. Liu, W. Wang, H. Chen, L. Xiao, C. Ren and X. Chen, Anal. Chem., 2019, 91(24), 15477–15483 CrossRef CAS PubMed.
- S. E. Bohndiek, M. I. Kettunen, D. E. Hu, B. W. C. Kennedy, J. Boren, F. A. Gallagher and K. M. Brindle, J. Am. Chem. Soc., 2011, 133(30), 11795–11801 CrossRef CAS PubMed.
- Q. Chen, M. G. Espey, A. Y. Sun, C. Pooput, K. L. Kirk, M. C. Krishna, D. B. Khosh, J. Drisko and M. Levine, Proc. Natl. Acad. Sci. U. S. A., 2008, 105(32), 11105–11109 CrossRef CAS PubMed.
- M. S. Pepe, R. Etzioni, Z. Feng, J. D. Potter, M. L. Thompson, M. Thornquist, M. Winget and Y. Yasui, J. Natl. Cancer Inst., 2001, 93(14), 1054–1061 CrossRef CAS PubMed.
- U. A. Kiernan, K. A. Tubbs, D. Nedelkov, E. E. Niederkoer and R. W. Nelson, FEBS Lett., 2003, 537(1-3), 166–170 CrossRef CAS.
- E. T. H. Yeh and J. T. Willerson, Circulation, 2003, 107, 370–372 CrossRef PubMed.
- E. C. Murphy and A. J. Friedman, J. Am. Acad. Dermatol., 2019, 81(6), 1379–1386 CrossRef CAS PubMed.
- S. R. Ali, Y. Ma, R. R. Parajuli, Y. Balogun, Y. C. Lai and H. He, Anal. Chem., 2007, 79, 2583–2587 CrossRef CAS PubMed.
- S. S. An, K. Jongsung and A. S. Reddy, Int. J. Nanomed., 2015, 10, 113–119 CrossRef PubMed.
- B. F. Boeve, Parkinsonism Relat. Disord., 2012, 18, 41–44 CrossRef.
- G. Mao, M. Du, X. Wang, X. Ji and Z. He, Analyst, 2018, 143, 5295–5301 RSC.
- W. B. Shim, H. Mun, H. A. Joung, J. A. Ofori, D. H. Chung and M. G. Kim, Food Control, 2014, 36, 30–35 CrossRef CAS.
- F. Rolland, E. Baena-Gonzalez and J. Sheen, Annu. Rev. Plant Biol., 2006, 57, 675–709 CrossRef CAS PubMed.
- (a) C. I.-L. Justino, T. A.-P. Rocha-Santos, S. Cardoso and A. C. Duarte, Trends Anal. Chem., 2013, 47, 27–36 CrossRef CAS PubMed; (b) C. I.-L. Justino, T. A.-P. Rocha-Santos and A. C. Duarte, Trends Anal. Chem., 2010, 29, 1172–1183 CrossRef CAS; (c) B. I. Kharisov, H. V.-R. Dias and O. V. Kharissova, Arabian J. Chem., 2014, 12, 1234–1246 CrossRef; (d) B. Liu, W. Wang, J. Wang, J. Zhang, Y. Zhang, K. Xu and F. Zhao, J. Nanopart. Res., 2019, 21, 48 CrossRef; (e) S. Wang, Y. Zhao, H. Xue, J. Xie, C. Feng, H. Li, D. Shi, S. Muhammad and Q. Jiao, Mater Lett., 2018, 223, 186–189 CrossRef CAS; (f) R. Li, M. Cai, Z. Xie, Q. Zhang, Y. Zeng, H. Liu, G. Liu and W. Lv, Appl. Catal., B, 2019, 244, 974–982 CrossRef CAS; (g) C. Wang, J. Li, R. Tan, Q. Wang and Z. Zhang, Analyst, 2019, 144, 1831–1839 RSC; (h) W. Ma, N. Wang, L. Yang, M. Lv, Z. Zhu and S. Li, J Mater Sci. Mater. Electron., 2020, 31, 8761–8772 CrossRef CAS.
- C. G.-C. M. Netto, H. E. Toma and L. H. Andrade, J. Mol. Catal. B: Enzym., 2013, 85–86, 71–92 CrossRef CAS.
- Z. Xian, L. Zhang, Y. Yu, B. Lin, Y. Wang, M. Guo and Y. Cao, Microchim. Acta, 2021, 188, 65 CrossRef CAS PubMed.
- K. Liu, J. Su, J. Liang and Y. Wu, RSC Adv., 2021, 11, 28375–28380 RSC.
- G. Huanan, W. Qiaoyan and L. Shuping, Sens. Actuators, A, 2022, 271, 120866 CAS.
- D. Navadeepthy, M. Thangapandian, C. Viswanathan and N. Ponpandian, Nanoscale Adv., 2020, 2, 3481–3493 RSC.
- J. Lu, H. Zhang, S. Li, S. Guo, L. Shen, T. Zhou, H. Zhong, L. Wu, Q. Meng and Y. Zhang, Inorg. Chem., 2020, 59(5), 3152–3159 CrossRef CAS PubMed.
- J. Lian, Y. He, N. Li, P. Liu, Z. Liu and Q. Liu, Inorg. Chem., 2021, 60, 1893–1901 CrossRef CAS PubMed.
- S. Luo, Y. Liu, H. Rao, Y. Wang and X. Wang, Anal. Biochem., 2017, 538, 26–33 CrossRef CAS PubMed.
- A. Untereiner and L. Y. Wu, Antioxid. Redox Signal., 2017, 28, 1463–1482 CrossRef PubMed.
- F. A. Kappi, G. A. Papadopoulos, G. Z. Tsogas and D. L. Giokas, Talanta, 2017, 172, 15–22 CrossRef CAS PubMed.
- F. A. Kappi, G. Z. Tsogas, A.-M. Routsi, D. C. Christodouleas and D. L. Giokas, Anal. Chim. Acta, 2018, 1036, 89–96 CrossRef CAS PubMed.
- Z. Xu, L. Li, K. Li, M.-L. Chen, J. Tu, W. Chen, S.-H. Zhu and Y.-H. Cheng, Microchim. Acta, 2021, 188(12), 421 CrossRef CAS PubMed.
- (a) E. Petryayeva and U. J. Krull, Anal. Chim. Acta, 2011, 706, 8–24 CrossRef CAS PubMed; (b) K. Shanmugaraj and M. Ilanchelian, Microchim. Acta, 2016, 183, 1721–1728 CrossRef CAS; (c) M. C. Daniel and D. Astruc, Chem. Rev., 2004, 104, 293–346 CrossRef CAS PubMed; (d) C. Han, K. Xu, Q. Liu, X. Liu and J. Li, Sens. Actuators, B, 2014, 202, 574–582 CrossRef CAS.
- S. Karakuş, N. Taşaltın, C. Taşaltın and N. B. Üllen, J. Inorg. Organomet. Polym., 2021, 31, 3726–3739 CrossRef.
- U. Nishan, A. Niaz, N. Muhammad, M. Asad, A.-U.-H. A. Shah, N. Khan, M. Khan, S. Shujah and A. Rahim, Arab. J. Chem., 2021, 14, 103164 CrossRef CAS.
- U. Gu, S. Kanwa, S. Tabassum, M. A. Gilani and A. Rahim, Microchim. Acta, 2020, 187, 135 CrossRef PubMed.
- U. Nishan, R. Gul, N. Muhammad, M. Asad, A. Rahim, M. Shah, J. Iqbal, J. Uddin, A.-U.-H. A. Shah and S. Shujah, Microchem. J., 2020, 159, 105382 CrossRef CAS.
- S. Sahu, S. Sharma, T. Kant, K. Shrivas and K. K. Ghosh, Sens. Actuators, A, 2020, 246, 118961 Search PubMed.
- D. J. Fraser-Pitt, D. K. Mercer, D. Smith, A. Kowalczuk, J. Robertson, E. Lovie, P. Perenyi, M. Cole, M. Doumith, R. L. R. Hill, K. L. Hopkins, N. Woodford and D. A. O’Neila, Infect. Immun., 2018, 86(6), e00947 CrossRef CAS PubMed.
- B. R. Khalkho, R. Kurrey, M. K. Deb, K. Shrivas, S. S. Thakur, S. Pervez and V. K. Jain, Heliyon, 2020, 6, e03423 CrossRef PubMed.
- J. H. Park, K. Yu, J.-Y. Min, Y.-H. Chung and J. Y. Yoon, Bull. Korean Chem. Soc., 2021, 42, 767 CrossRef CAS.
- H.-F. Lu, M.-M. Zhang, D. Wu, J.-L. Huang, L.-L. Zhu, C.-M. Wang and Q.-L. Zhang, Sens. Actuators, B, 2018, 258, 461–469 CrossRef CAS.
- S. M. Shaban, B.-S. Moon, D.-G. Pyun and D.-H. Kim, Colloids Surf., B, 2021, 205, 111835 CrossRef CAS PubMed.
- C. Chen, G. Zhang, P. Ni, Y. Jiang, Y. Lu and Z. Lu, Microchim. Acta, 2019, 186, 348 CrossRef PubMed.
- F. Xiang, J. Li and Z. Liu, Analyst, 2019, 144, 7057–7063 RSC.
- S. Naqvi, H. Anwer, S. W. Ahmed, A. Siddiqui, M. R. Shah, S. Khaliq, A. Ahmed and S. A. Ali, Sens. Actuators, A, 2020, 229, 118002 CAS.
- A. Thomas, U. Sivasankaran and K. G. Kumar, Sens. Actuators, A, 2018, 188, 113–119 CAS.
- S. Davidovic, V. Lazic, I. Vukoje, J. Papan, S. P. Anhrenkiel, S. Dimitrijevic and J. M. Nedeljkovi, Colloids Surf., B, 2017, 160, 184–191 CrossRef CAS PubMed.
- S. Mohammadi and G. Khayatian, Sens. Actuators, A, 2017, 185, 27–34 CAS.
- Y. Gao, Y. Wu and J. Di, Sens. Actuators, A, 2017, 173, 207–212 CAS.
- S. Rostami, A. Mehdinia and A. Jabbari, Sens. Actuators, A, 2017, 180, 204–210 CAS.
- N. D. Nguyen, T. V. Nguyen, A. D. Chu, H. V. Tran, L. T. Tran and C. D. Huynh, Arab. J. Chem., 2018, 11(7), 1134–1143 CrossRef CAS.
- M. T. Alula, L. Karamchand, N. R. Hendricks and J. M. Blackburn, Anal. Chim. Acta, 2018, 1007, 40–49 CrossRef CAS PubMed.
- J. Gao, M. Jia, Y. Xu, J. Zheng, N. Shao and M. Zhao, Talanta, 2018, 189, 129–136 CrossRef CAS PubMed.
- S. Basiri, A. Mehdinia and A. Jabbari, Colloids Surf., A, 2018, 545, 138–146 CrossRef CAS.
- W. Hou, X. Liua, Q. Lu, M. Liu, Y. Zhang and S. Yao, Colloids Surf., B, 2018, 162, 118–125 CrossRef CAS PubMed.
- S. Liu and S. Pang, Microchim. Acta, 2018, 185, 426 CrossRef PubMed.
- M. Maruthupandy, G. Rajivgandhi, T. Muneeswaran, T. Vennila, F. Quero and J.-M. Song, Int. J. Biol. Macromol., 2019, 121, 822–828 CrossRef CAS PubMed.
- G. G. Carbone, A. Serra, A. Buccolieri and D. Manno, Heliyon, 2019, 5(11), e02887 CrossRef PubMed.
- S. Yousefi and M. Saraji, Sens. Actuators, A, 2019, 213, 1–5 CAS.
- L. Li, J. Wang and Z. Chen, Microchim. Acta, 2020, 187, 18 CrossRef CAS PubMed.
- C. Manikkaraja, S. Mahboob, K. A. Al-Ghanim, D. Rajesh, K. Selvaraj, M. Sivakumar, F. Al-Misned, Z. Ahmed and G. Archunan, J. Photochem. Photobiol., B, 2020, 203, 111747 CrossRef CAS PubMed.
- L. R. Feksa, V. C. Rech, D. A. Silna Melo, M. Wajner, C. S. DutraFilho, A. T. Souza Wyse and C. M.-D. Wannmacher, Metab. Brain Dis., 2008, 23, 81–93 CrossRef PubMed.
- K. Shanmugaraj, T. Sasikumar, C. H. Campos, M. Ilanchelian, R. V. Mangalaraja and C. C. Torres, Sens. Actuators, A, 2020, 236, 118281 CAS.
- K. Shanmugaraj and M. Ilanchelian, Microchim. Acta, 2016, 183, 1721–1728 CrossRef CAS.
- R. A. Gatenby and R. J. Gillies, Nat. Rev. Cancer, 2004, 4, 891 CrossRef CAS PubMed.
- Y.-C. Yeh, B. Creran and V. M. Rotello, Nanoscale, 2012, 4(6), 1871–1880 RSC.
- (a) A. Khan, R. Rashid, G. Murtaza and A. Zahra, Trop. J. Pharm. Res., 2014, 13(7), 1169–1177 CrossRef CAS; (b) W. Haiss, N. T.-K. Thanh, J. Aveyard and D. G. Fernig, Anal. Chem., 2007, 79, 4215–4221 CrossRef CAS PubMed; (c) V. Amendola, R. Pilot, M. Frasconi, O. M. Maragò and M. A. Latì, J. Phys.: Condens. Matter, 2017, 29, 203002 CrossRef PubMed; (d) M. B. Thygesen and K. J. Jensen, Carbohydrate-modified gold nanoparticles, in Carbohydrate Nanotechnology, ed. K. J. Stine, John Wiley & Sons, New York, 2016, pp. 79–98 Search PubMed.
- H. Seto, M. Harada, H. Sakamoto, H. Nagaura, T. Murakami, I. Kimura, Y. Hirohashi and H. Shinto, Adv. Powder Technol., 2020, 31(9), 4129–4133 CrossRef CAS.
- M. Basak, S. Mitra, S. K. Agnihotri, A. Jain, A. Vyas, M. L.-B. Bhatt, R. Sachan, M. Sachdev, H. B. Nemade and D. Bandyopadhyay, ACS Appl. Bio Mater., 2021, 4, 5378–5390 CrossRef CAS PubMed.
- P. M. Castillo, F. J. Fernández-Acejo, J. M. Carnerero, R. Prado-Gotor and A. Jimenez-Ruiz, Nanomaterials, 2021, 11, 612 CrossRef CAS PubMed.
- S. Khurana, S. Kukreti and M. Kaushik, Sens. Actuators, A, 2021, 246, 119039 CAS.
- Y. Zhang, H. Xu, Y. Yang, F. Zhu, Y. Pu, X. You and X. Liao, J. Photochem. Photobiol., A, 2021, 411, 113195 CrossRef CAS.
- Ö. K. Ko, A. Üzer and R. Apak, Microchim. Acta, 2020, 187, 586 CrossRef PubMed.
- P. Siyal, A. Nafady, Sirajuddin, R. Memona, S. T.-H. Sherazi, J. Nisar, A. A. Siyal, M. R. Shah, S. A. Mahesar and S. Bhagat, Spectrochim. Acta A Mol. Biomol. Spectrosc., 2021, 254, 119645 CrossRef CAS PubMed.
- Y. Zhang, M. Yang, Z. Shao, H. Xu, Y. Chen, Y. Yang, W. Xu and X. Liao, Microchem. J., 2020, 158, 105327 CrossRef CAS.
- J. Peng, N. Zhou, Y. Zhong, Y. Su, L. Zhao and Y.-T. Chang, Microchim. Acta, 2019, 186, 618 CrossRef PubMed.
- W. Dong, R. Wang, X. Gong and C. Dong, Anal. Bioanal. Chem., 2019, 411, 6687–6695 CrossRef CAS PubMed.
- Z. Zhang, T. Liu, S. Wang, J. Ma, T. Zhou, F. Wang, X. Wang and G. Zhang, J. Photochem. Photobiol., 2019, 370, 89–93 CrossRef CAS.
- W. Dong, R. Wang, X. Gong, W. Liang and C. Dong, Sens. Actuators, A, 2019, 213, 90–96 CAS.
- S. S. Memon, A. Nafady, A. R. Solangi, A. M. Al-Enizi, Sirajuddin, M. R. Shah, S. T.-H. Sherazi, S. Memon, M. Arain, M. I. Abro and M. I. Khattak, Sens. Actuators, B, 2018, 259, 1006–1012 CrossRef CAS.
- H. S. Aldewachi, N. Woodroofe, S. Turega and P. H.-E. Gardiner, Talanta, 2017, 169, 13–19 CrossRef CAS PubMed.
- X. Fu, X. Fu, Q. Wang, L. Sheng, X. Huang, M. Ma and Z. Cai, Int. J. Biol. Macromol., 2017, 103, 1155–1161 CrossRef CAS PubMed.
- X. Fu, D. Gu, S. Zhao, N. Zhou and H. Zhang, J. Fluoresc., 2017, 27(5), 1597–1605 CrossRef CAS PubMed.
- K. A. Rawat, J. R. Bhamore, R. K. Singhal and S. K. Kailasa, Biosens. Bioelectron., 2017, 15(88), 71–77 CrossRef PubMed.
- J. Li, X. Rao, F. Xiang, J. Wei, M. Yuan and Z. Liu, Analyst, 2018, 143, 2083–2089 RSC.
- F. Qu, C. Sun, X. Lv and J. You, Microchim. Acta, 2018, 185, 359 CrossRef PubMed.
- C. Kong, L. Gao and Z. Chen, Microchim. Acta, 2018, 185, 488 CrossRef PubMed.
- H. Xing, T. Wei, X. Lin and Z. Dai, Anal. Chim. Acta, 2018, 1042, 71–78 CrossRef CAS PubMed.
- Y. Jiao, Q. Liu, H. Qiang and Z. Chen, Microchim. Acta, 2018, 185, 452 CrossRef.
- M. Iarossi, C. Schiattarella, I. Rea, L. D. Stefano, R. Fittipaldi, A. Vecchione, R. Velotta and B. D. Ventura, ACS Omega, 2018, 3, 3805–3812 CrossRef CAS PubMed.
- F. Sang, X. Zhang, J. Liu, S. Yin and Z. Zhang, Sens. Actuators, A, 2019, 217, 122–127 CAS.
- R. Zhu, J. Song, Y. Zhou, P. Lei, Z. Li, H.-W. Li, S. Shuang and C. Dong, Talanta, 2019, 204, 294–303 CrossRef CAS PubMed.
- Y. Li, J. Cai, F. Liua, H. Yang, Y. Lin, S. Lia, X. Huang and L. Lin, Talanta, 2019, 201, 82–89 CrossRef CAS PubMed.
- Z. Zhou, W. Liu, Y. Wang, F. Ding, X. Liu, Q. Zhao, P. Zou, X. Wang and H. Rao, Microchim. Acta, 2019, 186, 272 CrossRef PubMed.
- B. Zhao, J. Yan, D. Wang, Z. Ge, S. He, D. He, S. Song and C. Fan, Small, 2013, 9, 2595–2601 CrossRef CAS PubMed.
- L. Mi, Y. Wen, D. Pan, Y. Wang, C. Fan and J. Hu, Small, 2009, 5, 2597–2600 CrossRef CAS PubMed.
- Q. Liu, L. Li, Y. Zhao and Z. Chen, Microchim. Acta, 2018, 185, 301 CrossRef PubMed.
- J. G. March, B. M. Simonet and F. Grases, J. Chromatogr. B: Biomed. Sci. Appl., 2001, 757, 247–255 CrossRef CAS.
- W. Zhang, H. Gu, L. Xi, Y. Zhang, Y. Hu and T. Zhng, Energy Procedia, 2012, 17, 1641–1647 CrossRef CAS.
- R. Das, H. Sugimoto, M. Fujii and P. K. Giri, ACS Appl. Mater. Interfaces, 2020, 12(4), 4755–4768 CrossRef CAS PubMed.
- (a) G. Liang, H. Wang, H. Shi, H. Wang, M. Zhu, A. Jing, J. Liand and G. Li, J. Nanobiotechnol., 2020, 18, 154 CrossRef PubMed; (b) J. Isokuortti, I. Kiiski, T. Sikanen, N. Durandin and T. Laaksonen, J. Mater. Chem. C, 2022, 10, 4871–4877 RSC.
- (a) M. Wang, G. Abbineni, A. Clevenger, C. Mao and S. Xu, Nanomedicine, 2011, 7(6), 710–729 CrossRef CAS PubMed; (b) R. M. Rich, D. L. Stankowska, B. P. Maliwal, T. J. Sørensen, B. W. Laursen, R. R. Krishnamoorthy, Z. Gryczynski, J. Borejdo, I. Gryczynski and R. Fudala, Anal. Bioanal. Chem., 2013, 405, 2065–2075 CrossRef CAS PubMed; (c) L. Wang, R. Yan, Z. Huo, L. Wang, J. Zeng, J. Bao, X. Wang and Y. Li, Angew. Chem., Int. Ed., 2005, 44, 6054–6057 CrossRef CAS PubMed; (d) C. L. Zhang, Y. X. Yuan, S. M. Zhang, Y. H. Wang and Z. H. Liu, Angew. Chem., Int. Ed., 2011, 50, 6851–6854 CrossRef CAS PubMed; (e) Y. Wu, D. Li, F. Zhou, H. Liang, Y. Liu, W. J. Hou, Q. Yuan, X. B. Zhang and W. H. Tan, Chem. Sci., 2018, 9, 5427–5434 RSC; (f) J. Zhang, S. Wang, N. Gao, D. Feng, L. Wang and H. Chen, Biosens. Bioelectron., 2015, 72, 282–287 CrossRef CAS PubMed.
- S. Li, X. Wei, S. Li, C. Zhu and C. Wu, Int. J. Nanomed., 2020, 15, 9431–9445 CrossRef CAS.
- E. Chen, K. Cai, X. Liu, S. Wu, Z. Wu, M. Ma, B. Chen and Z. Zhao, Anal. Chem., 2021, 93(18), 6895–6900 CrossRef CAS PubMed.
- S. Ghosh, Y. Chang, D. Yang and S. Chattopadhyay, Biosens. Bioelectron., 2020, 155, 112115 CrossRef CAS PubMed.
- P. Ciragil, E. Kurutas and M. Miraloglu, Dis. Markers, 2014, 2014, 269362 Search PubMed.
- Y. You, S. Cheng, L. Zhang, Y. Zhu, C. Zhang and Y. Xian, Anal. Chem., 2020, 92(7), 5091–5099 CrossRef CAS PubMed.
- C. Ding, S. Cheng, C. Zhang, Y. Xiong, M. Ye and Y. Xian, Anal. Chem., 2019, 91(11), 7181–7188 CrossRef CAS PubMed.
- E. S. Tsai, S. F. Himmelsto, L. M. Wiesholler, T. Hirsch and E. A.-H. Hall, Analyst, 2019, 144, 5547–5557 RSC.
- M. Chen, F. Y.-H. Kutsanedzie, W. Cheng, A. A. Agyekum, H. Li and Q. Chen, Microchim. Acta, 2018, 185, 378 CrossRef.
- T. Näreoja, T. Deguchi, S. Christ, R. Peltomaa, N. Prabhakar, E. Fazeli, N. Perälä, J. M. Rosenholm, R. Arppe, T. Soukka and M. Schaeferling, Anal. Chem., 2017, 89(3), 1501–1508 CrossRef PubMed.
- S. Du, J. Hernández-Gil, H. Dong, X. Zheng, G. Lyu, M. Bañobre-López, J. Gallo, L. Sun, C. Yan and N. J. Long, Dalton Trans., 2017, 46, 13957–13965 RSC.
- H. Chen, A. Fang, L. He, Y. Zhang and S. Yao, Talanta, 2016, 164, 580–587 CrossRef PubMed.
- H. Li, H. Dong, M. Yu, C. Liu, Z. Li, L. Wei, L. DongSun and H. Zhang, Anal. Chem., 2017, 89(17), 8863–8869 CrossRef CAS PubMed.
- P. Zimmet, K. G. Alberti and J. Shaw, Nature, 2001, 414, 782–787 CrossRef CAS PubMed.
- Q. Zhang, B. Wu, D. Zhong, X. Zhan and G. Wang, Macromol. Rapid Commun., 2016, 37(24), 2052–2056 CrossRef CAS PubMed.
- (a) K. Sun, Y. Tang, Q. Li, S. Yin, W. Qin, J. Yu, D. T. Chiu, Y. Liu, Z. Yuan, X. Zhang and C. Wu, ACS Nano, 2016, 10(7), 6769–6781 CrossRef CAS PubMed; (b) L. Liu, Q. Zhang, J. Wang, L. Zhao, L. Liu and Y. Lu, Sens. Actuators, B, 2019, 297, 126801 CrossRef CAS; (c) B. Zhang, F. Wang, H. Zhou, D. Gao, Z. Yuan, C. Wu and X. Zhang, Angew. Chem., Int. Ed., 2019, 58, 2744–2748 CrossRef CAS PubMed; (d) Y. Liu, T. T. Li, C. X. Ling, Z. L. Wang, L. Jin, Y. X. Zhao, Z. Chen, S. Li, Y. Deng and N. Y. He, Chin. Chem. Lett., 2019, 30, 2359–2362 CrossRef CAS.
- C. Wu, T. Schneider, M. Zeigler, J. Yu, P. G. Schiro, D. R. Burnham, J. D. McNeill and D. T. Chiu, J. Am. Chem. Soc., 2010, 132(43), 15410–15417 CrossRef CAS PubMed.
- G. Huanan, W. Qiaoyan and L. Shuping, Sens. Actuators, A, 2022, 271, 120866 CAS.
- C. Wu and D. T. Chiu, Angew. Chem., Int. Ed., 2013, 52(11), 3086–3109 CrossRef CAS PubMed.
- S. Z. Du, Z. Sun, M. Qing, L. Wang, Q. Tang, J. Zhou, H. Q. Luo and N. B. Li, ACS Appl. Nano Mater., 2021, 4, 6872–6880 CrossRef CAS.
- Y. Fan, J. Yao, M. Huang, C. Linghu, J. Guo and Y. Li, Food Chem., 2021, 359, 129962 CrossRef CAS PubMed.
- Y. Huang, L. Deng, D. Siu, X. Huang and J. Ren, Analyst, 2021, 146, 3623–3632 RSC.
- J. Sun, N. Chen, X. Chen, Q. Zhang and F. Gao, Anal. Chem., 2019, 91, 12414–12421 CrossRef CAS PubMed.
- J. Wang, C. Zheng, X. Tan, A. Zheng, Y. Zeng, Z. Zhang, X. Zhang and X. Liu, Microchim. Acta, 2019, 186, 568 CrossRef CAS PubMed.
- P. Chen, I. Ilyas, S. He, Y. Xing, Z. Jin and C. Huang, Molecules, 2019, 24(16), 2923 CrossRef CAS PubMed.
- B. Bao, Z. Yang, Y. Liu, Y. Xu, B. Gu, J. Chen, P. Su, L. Tong and L. Wang, Biosens. Bioelectron., 2019, 126, 129–135 CrossRef CAS PubMed.
- Q. Zhang, Z. Zhang, X. Hu, J. Sun and F. Gao, ACS Appl. Mater. Interfaces, 2022, 14, 179–190 CrossRef CAS PubMed.
- S. Wang, M. Huang, J. Hua, L. Wei, S. Lin and L. Xiao, Nanoscale, 2021, 13, 4946–4955 RSC.
- Z. Gong, Z. Wei, Y. Liu and L. Xiao, J. Nanopart. Res., 2022, 24, 3 CrossRef CAS.
- J. Sun, H. Mei and F. Gao, Biosens. Bioelectron., 2017, 91, 70–75 CrossRef CAS PubMed.
- X. Cai, Z. Fang, J. Dou, A. Yu and G. Zhai, Curr. Med. Chem., 2013, 20, 2572–2582 CrossRef CAS PubMed.
- P. A. Jones and D. Takai, Science, 2001, 293, 1068–1070 CrossRef CAS PubMed.
- D. Akhmedov, M. Braun, C. Mataki, K. Park, T. Pozzan, K. Schoonjans, P. Rorsman, C. Wollheim and A. Wiederkehr, FASEB J., 2010, 11, 4613–4626 CrossRef PubMed.
- J. Sun, P. Ling and F. Gao, ACS Anal. Chem., 2017, 89(21), 11703–11710 CrossRef CAS PubMed.
- S. Kato, P. J. Burke, T. H. Koch and V. M. Bierbaum, Anal. Chem., 2001, 73, 2992–2997 CrossRef CAS PubMed.
- K. Wang, L. Jiang, F. Zhang, Y. Wei, K. Wang, H. Wang, Z. Qi and S. Liu, Anal. Chem., 2018, 90, 14056–14062 CrossRef CAS PubMed.
- D. Strausak, J. F.-B. Mercer, H. H. Dieter, W. Stremmel and G. Multhaup, Brain Res. Bull., 2001, 55(2), 175–185 CrossRef CAS.
- K. Z. Huang, M. H. Liu, X. B. Wang, D. S. Cao, F. Gao, K. C. Zhou, W. Wang and W. B. Zeng, Tetrahedron Lett., 2015, 56(24), 3769–3773 CrossRef CAS.
- Y. Tang and G.-F. Jiang, New J. Chem., 2017, 41(14), 6769–6774 RSC.
Footnote |
| † These authors contributed equally. |
| This journal is © The Royal Society of Chemistry 2022 |