
 Open Access Article
 This Open Access Article is licensed under a
 Creative Commons Attribution 3.0 Unported Licence
Chemical structure and dissolution behaviour of CaO and ZnO containing alkali-borosilicate glass†
Adam J.
Fisher
a,
Hao
Ding
a,
Prashant
Rajbhandari
a,
Brant
Walkley
 b,
Lewis R.
Blackburn
a,
Martin C.
Stennett
a,
Russell J.
Hand
a,
Neil C.
Hyatt
a,
Michael T.
Harrison
c and
Claire L.
Corkhill
*a
b,
Lewis R.
Blackburn
a,
Martin C.
Stennett
a,
Russell J.
Hand
a,
Neil C.
Hyatt
a,
Michael T.
Harrison
c and
Claire L.
Corkhill
*a
aNucleUS Immobilisation Science Laboratory, Department of Materials Science and Engineering, University of Sheffield, Sheffield, S1 3JD, UK. E-mail: c.corkhill@sheffield.ac.uk
bDepartment of Chemical and Biological Engineering, University of Sheffield, S1 3JD, UK
cNational Nuclear Laboratory, Sellafield, Seascale, Cumbria CA20 1PG, UK
First published on 10th January 2022
Abstract
Within the context of the UK's radioactive waste vitrification programme, which utilises a lithium-sodium borosilicate glass modified with CaO and ZnO to immobilise high level nuclear waste, an investigation was undertaken to evaluate the effects on the structure and chemical durability of altering the CaO to ZnO ratio. Using a 6-component simplified alkali aluminoborosilicate glass, replacement of CaO by ZnO, even in moderate amounts, had a marked effect on the glass structure. Zn K-edge EXAFS identified that Zn existed within two distinct environments, both containing Zn in tetrahedral coordination. At high CaO content, Zn was coordinated in a “hardystonite-like” (Ca2ZnSi2O7) environment, while higher ZnO content induced destabilization and nano-scale phase separation occurred, forming discrete tri-clusters of Si/Al–O–Zn in a “willemite-like” (Zn2SiO4) environment. The presence of these environments was corroborated by thermal analysis and 29Si MAS NMR data. Despite this phase separation, glasses with higher ZnO content were found to exhibit the lowest normalized dissolution rates under dilute conditions, as determined using the Single-Pass Flow-Through methodology. Chemical structure analysis indicates that such behaviour is a result of enhanced polymerization of the glass network in the presence of Zn, and a reduced propensity for Si–O–Zn bond hydrolysis in water, resolving a long-running literature debate on the role of Zn on the dissolution of glass in the forward rate. Evidence is presented that indicates the phase-separated regions dissolve at somewhat different rates. These results enhance understanding of CaO![[thin space (1/6-em)]](https://www.rsc.org/images/entities/char_2009.gif) :ZnO-containing glass behaviour, important to assess the long-term safety of radioactive waste management and disposal strategies.
:ZnO-containing glass behaviour, important to assess the long-term safety of radioactive waste management and disposal strategies.
Introduction
High level radioactive waste derived from reprocessing of spent nuclear fuel in the UK is immobilised within a lithium–sodium borosilicate glass known as the Mixture Windscale (MW) formulation (5.3Li2O·11.1Na2O·21.9B2O3·61.7SiO2 wt%).1 Recently, a modified base glass composition (‘CaZn’), containing additional Al2O3, ZnO and CaO with a CaO:ZnO molar ratio of 60:40, has been adopted, which was formulated in anticipation of future waste streams arising from post-operational clean-out (POCO) operations, including those rich in molybdate solids.1,2 The addition of CaO allows for increased Mo incorporation via the preferential formation of the chemically durable CaMoO4 phase.3 The new CaZn base glass is currently deployed on one of the three operational active vitrification lines at the Sellafield Waste Vitrification Plant and a full transition to all three lines is expected in the future.4
The addition of ZnO at low concentrations (<5 wt%) to alkali/alkaline earth borosilicate glasses has a marked preference for the formation of four-fold coordinated tetrahedral [ZnO4]2− units,5–7 which are charge compensated by alkali/alkaline earth elements that would otherwise be playing a network modifying/charge compensating role, thus reducing the number of non-bridging-oxygen (NBOs) atoms.8,9 Such [ZnO4]2− units perform a network-forming role, polymerising the glass network by corner-sharing oxygen atoms with network forming SiO4 tetrahedra, forming Si–O–Zn linkages.7,10 However, with increasing ZnO:modifier ratio, a proportion of ZnO has been reported to adopt six-fold octahedral coordination and act as a network-modifier.8,11,12
While the influence of ZnO on glass structure is generally well understood, its impact on glass dissolution behaviour is less well constrained, with studies showing both improved,13–20 and on the contrary, reduced durability when compared with Zn-free counterpart compositions.21–23 Some studies suggest that Si–O–Zn linkages increase resistance to hydrolysis,5,17,19–21,24 while others postulate that the formation of zinc silicate clays drive silica dissolution.21–23 Both may be correct, depending upon the reaction progress of the dissolution reaction, however, when CaO is also added to alkali-borosilicate glass, the effects on durability have not been elucidated.
In contrast to ZnO, the addition of CaO to the borosilicate glass network may be detrimental during the regime of dissolution where conditions are dilute, depending on the overall glass composition. For example, in aluminoborosilicate glasses containing alkali and alkaline-earth cations, Na+ is more likely to act as a charge compensator for BO4− units than Ca2+. Hence, Ca2+ tends to create more NBOs than Na+ in such glasses.25 Glasses containing a high proportion of CaO are, however, generally accepted to exhibit high durability under saturated conditions, due to the passivating nature of the Ca-silicate gel layers formed e.g.26–30
In this study, we aim to elucidate the combined influence of CaO and ZnO on alkali-borosilicate glass structure, and how this influences the durability under dilute dissolution conditions. Using a suite of 6-component simplified glass compositions, representative of the base glass used for UK high-level waste immobilisation, the effect of altering the CaO:ZnO ratio on the glass network structure is investigated using Extended X-ray Absorption Fine Edge Structure (EXAFS) at the Zn K-edge and 27Al, 11B and 29Si Magic Angle Spinning Nuclear Magnetic Resonance Spectroscopy (MAS NMR). The forward rate of dissolution obtained under dilute conditions (i.e. precluding solution saturation effects), of each glass composition was determined to elucidate the structure-dissolution relationship of CaO and ZnO-containing glasses.
Experimental
Glass synthesis
Six lithium alkali-aluminoborosilicate glasses, referred to herein as CaxZny, where x and y are the molar ratio (in %) of CaO and ZnO, respectively, were fabricated by mixing the oxide precursors (Al(OH)3) (>99.9% Acros), H3BO3 (>99.9% Merck), CaCO3 (96% Fluka), LiCO3 (99.5% Analar), Na2CO3 (98% Alfa Aesar), SiO2 (99%) and ZnO (99% Aldrich) and melting at 1200 °C for 5 h in a platinum crucible, with 4 h of stirring using a platinum paddle. The as-cast ingots, of 2.5 × 2.5 × 10 cm, were then annealed for 1 h at 450 °C, and then cooled to room temperature at a rate of 5 °C min−1. Each glass bar was clear, homogenous and amorphous, with no crystal inclusions, as confirmed by X-ray diffraction (XRD) on < 75 μm glass powders (ESI† Fig. S1). The glass compositions are shown in Table 1, as determined by Inductively Coupled Plasma-Atomic Emission Spectroscopy (ICP-AES, Spectros Ciros Vision), following HF digest of crushed glass powder.| Oxide | Ca100Zn0 | Ca80Zn20 | Ca60Zn40 | Ca40Zn60 | Ca20Zn80 | Ca0Zn100 | ||||||
|---|---|---|---|---|---|---|---|---|---|---|---|---|
| wt% | mol% | wt% | mol% | wt% | mol% | wt% | mol% | wt% | mol% | wt% | mol% | |
| SiO2 | 53.2 | 53.6 | 51.0 | 51.9 | 51.2 | 52.5 | 45.4 | 47.1 | 46.0 | 48.1 | 43.9 | 46.4 |
| B2O3 | 22.3 | 19.4 | 23.3 | 20.5 | 22.5 | 19.9 | 25.3 | 22.7 | 23.8 | 21.5 | 24.4 | 22.3 |
| Al2O3 | 3.7 | 2.2 | 3.7 | 2.2 | 3.7 | 2.2 | 4.0 | 2.5 | 4.0 | 2.5 | 3.9 | 2.4 |
| Na2O | 7.8 | 7.6 | 7.9 | 7.8 | 7.7 | 7.7 | 8.0 | 8.1 | 7.9 | 8.0 | 7.9 | 8.1 |
| Li2O | 3.5 | 7.1 | 3.5 | 7.2 | 3.5 | 7.2 | 3.8 | 7.9 | 3.8 | 8.0 | 3.9 | 8.3 |
| ZnO | — | — | 3.0 | 2.3 | 5.8 | 4.4 | 9.4 | 7.2 | 12.5 | 9.7 | 15.9 | 12.4 |
| CaO | 9.4 | 10.1 | 7.6 | 8.3 | 5.5 | 6.1 | 4.1 | 4.6 | 2.0 | 2.2 | 0.1 | 0.1 |
| Total | 99.9 | 100.0 | 100.0 | 100.2 | 99.9 | 100.0 | 100.0 | 100.1 | 100.0 | 100.0 | 100.0 | 100.0 |
| Measured ZnO/CaO + ZnO | 0.000 | 0.198 | 0.419 | 0.610 | 0.815 | 0.992 | ||||||
| Density (± 0.01)/g cm−3 | 2.58 | 2.60 | 2.63 | 2.64 | 2.69 | 2.71 | ||||||
Glass powders for dissolution experiments were obtained by crushing the glass ingots and sieving to obtain particles in the 75–150 μm diameter range. Ultrasonic washing in isopropanol (six repetitions of three minute bursts) was performed to remove fine fragments and the washed glass powders were then dried in an oven at 90 °C for 1 h. Particles of < 75 μm diameter were used in all characterisation techniques.
Glass characterisation and structure analysis
Density measurements were made using a Micrometrics Accupyc II 1340 helium pycnometer, and are reported in Table 1. Differential Thermal Analysis (DTA) was performed on a TA SDT Instrument Q600 v20.9 to determine the glass transition (Tg) temperature. Data were collected over the temperature range 22–1300 °C at a rate of 10 °C min−1. A single ramping profile was deployed. The glass transition temperature was determined by the extrapolation of the tangents at the points of interest.Glass particles were imaged pre- and post-dissolution using Scanning Electron Microscopy (SEM, Hitachi TM3030) coupled with Energy Dispersive Spectroscopy (EDS, Bruker Quantax). Pristine and post-dissolution glass powders were mounted on a carbon tab for imaging. XRD was performed using a Bruker D2 Phaser X-ray Diffractometer, using Kα (λ = 1.5418 Å) radiation generated from a Cu target at a working voltage of 30 kV and 10 mA. A Ni filter and a Lynx-Eye position sensitive detector were used. An angular range 10° < 2θ < 70° with a 0.02° step size progressing at 0.17° min−1 were applied, with a total scan time of 180 minutes. The samples were rotated at frequency of 10 Hz.
Solid-state MAS NMR spectra were acquired for each glass composition at the EPSRC UK National Solid-State NMR Service at Durham University. The 29Si NMR spectra were collected using a Varian VNMRS 400 (9.4 T) spectrometer at 79.44 MHz using a probe for 6 mm o.d. zirconia rotors and a spinning speed of 6 kHz, a pulse width of 4 μs, a relaxation delay of 240 s and with a minimum of 200 scans. The 27Al and 11B NMR spectra were collected on the same instrument, at 104.20 and 128.30 MHz, respectively, using a probe for a 4 mm o.d. zirconia rotor. The spinning speed was 13 kHz and a pulse width of 1 μs, a relaxation delay of 0.2 s, and a minimum of 6000 scans. The reference materials used were tetramethylsilane (29Si), 1 M Al(NO3)3(aq) (27Al) and BF3 (11B). Spectral deconvolution was performed for the 11B spectra only, using QuadFit.31
X-Ray Absorption Spectroscopy (XAS), including X-ray Absorption Near Edge Structure (XANES) and Extended X-ray Absorption Fine Structure (EXAFS) measurements, was performed at the Zn K-edge at Diamond Light Source (UK) using B18 beamline and at the National Synchrotron Light Source II using the BMM beamline. Data were collected on pellets of glass powder pressed with PEG (polyethylene glycol) to a thickness equivalent to 1 absorption length. Measurements were performed in transmission mode at room temperature, with an energy range of 9460–10658 eV. The raw data were normalised and a Fourier transform applied over the k-range 3.0–12.0 Å−1 using Athena and Artemis, parts of the Demeter software package.32 The fitting was conducted by fixing the amplitude reduction factor at S02 = 0.95, using the same Debye–Waller factors for all paths comprising the first oxygen shell, and refining the interatomic distance and coordination numbers simultaneously.
Glass dissolution analysis
The ASTM C1662-18 Single-Pass Flow-Through (SPFT) standard test method was used to obtain dissolution rate data for the compositions Ca100Zn0, Ca60Zn40 and Ca0Zn100 under dilute conditions, which are maintained by replenishing the dissolution medium at a high flow-rate.31 Dissolution rates were obtained at 40 °C in duplicate, at a flow-rate to surface area ratio of log10[(q/S)/m s−1] = −6.78, corresponding to a syringe pump flow-rate of 80 mL d−1. This was determined to be appropriate to give dissolution rates independent of flow rate.33 The dissolution media was buffered to pHRT 9 (pH40C 8.67) using 0.05 M tris hydroxymethyl aminomethane (TRIS) added to ultra-high quality water (18.2 MΩ cm), adjusted to the desired pH values with 15 M HNO3. Effluent samples were collected at two day intervals and flow-rates were determined gravimetrically. The leachate solution was acidified with 1 vol% HNO3 to avoid precipitation of secondary phases prior to elemental concentration analysis with ICP-OES (ThermoScientific iCAPDuo6300).
The SPFT experiment duration was 37 days, which was sufficient to calculate the normalised dissolution rates after the attainment of forward rate conditions, according to:
 | (1) |
Forward rate conditions were defined as having at least three dissolution rate measurements that did not deviate by more than 15% from their mean value and where the sample had lost no more than 30% of its original surface area. The mean dissolution rate from ≥ 3 measurements in the forward rate for each test was then recorded.34 In eqn (1), ri represents the normalised mass loss of glass based on the release of element i (g m−2 d−1), where i is Al, B, Ca, Na, Si and Zn, Ci the concentration of element i in the effluent solution (mg L−1), Ci,o the background concentration of element i from the input buffer solution (mg L−1), q the solution flow-rate (m s−1), S the effective surface area of the powdered glass sample (m2) equal to 5.53 × 10⁻³ m2, and fi the mass fraction of element i in the glass (unitless) given by eqn (2):
 | (2) |
Since S changes, albeit by a small amount, throughout the duration of the experiment as the glass dissolves, a surface area correction model was applied to calculate the change in S over the experimental time period. This correction determined the mass of glass mj (g) that remained at each time interval (j):
 | (3) |
 | (4) |
Determination of the experimental uncertainty of the dissolution rates accounted for the uncertainty associated with each parameter described in eqn (1). For these uncorrelated random errors, the standard deviation of a function f(xi) is given by:
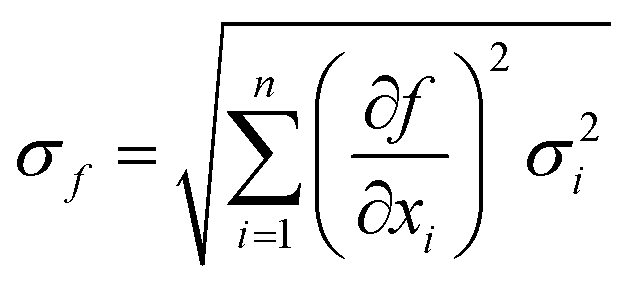 | (5) |
 gives:
 | (6) |
Results and discussion
Glass structure prediction using an extended Dell–Bray model
A series of calculations were performed using an extended Dell–Bray35 borosilicate glass model modified for alkali aluminoborosilicate glass.36,37 It was further adapted in the present study to include CaO and ZnO, to predict the influence of altering the CaO:ZnO molar ratio on the simplified glass composition structure.38 These predictions were aided by the acquisition of the B species contribution from 11B MAS NMR spectral deconvolution (discussed in detail later). A range of parameters were calculated using the analysed molar content of oxide species in each glass composition (Table 1). For brevity, details of the calculations used to support NMR deconvolution are given in the ESI.† All of the results are detailed in Table 2.
| Ca100Zn0 | Ca80Zn20 | Ca60Zn40 | Ca40Zn60 | Ca20Zn80 | Ca0Zn100 | |
|---|---|---|---|---|---|---|
| a See Table 5. b Formed after all [ZnO4]2− is charge compensated – Q3 was not predicted in the Zn-rich glasses if it is assumed that Zn is playing a fully network-forming role. | ||||||
| R eff (eqn (7)) | 1.17 | 0.92 | 0.72 | 0.48 | 0.29 | 0.08 |
| K (S2, ESI) | 2.76 | 2.54 | 2.64 | 2.08 | 2.24 | 2.08 |
| R max (S3, ESI) | 0.67 | 0.66 | 0.66 | 0.63 | 0.64 | 0.63 |
| R dl (S4, ESI) | 1.19 | 1.13 | 1.16 | 1.02 | 1.06 | 1.02 |
| R dl2 (S5, ESI) | 4.76 | 4.54 | 4.64 | 4.08 | 4.24 | 4.08 |
| BO3 Predicted fraction (S9, ESI) | 0.10 | 0.34 | 0.34 | 0.52 | 0.71 | 0.92 |
| BO3 Measured fractiona | 0.32 | 0.37 | 0.37 | 0.41 | 0.44 | 0.48 |
| BO4 Predicted fraction (S6–S8, ESI) | 0.90 | 0.66 | 0.66 | 0.48 | 0.29 | 0.08 |
| BO4 Measured fractiona | 0.68 | 0.63 | 0.63 | 0.59 | 0.56 | 0.52 |
| BO4 Prediction accuracy (S10, ESI) (fraction) | 0.76 | 0.95 | 0.95 | 0.81 | 0.52 | 0.15 |
| R2O + CaO/mol% | 24.8 | 23.2 | 20.9 | 20.5 | 18.3 | 16.5 |
| R2O + CaO available for [ZnO4]2− & Si(Q3) charge balance (eqn (9))/mol% | 9.46 | 8.13 | 6.14 | 4.71 | 3.75 | 2.49 |
| [ZnO4]2− left non-charge balanced (eqn (10))/mol% | — | — | — | 2.49 | 5.90 | 9.91 |
| Q3b (eqn (11))/mol% | 9.46 | 5.88 | 1.75 | 0.00 | 0.00 | 0.00 |
| Q4(X) (predicted) (eqn (12))/fraction | 0.82 | 0.84 | 0.88 | 0.95 | 0.88 | 0.79 |
The Reff, the ratio of charge compensating species to borate (eqn (7)), remained <1 for all compositions except Ca100Zn0. Accordingly, the concentration of BO3 species, induced by the deficit in alkali/alkali-earth cations, was predicted to increase as more ZnO is added at the expense of CaO (Table 2).
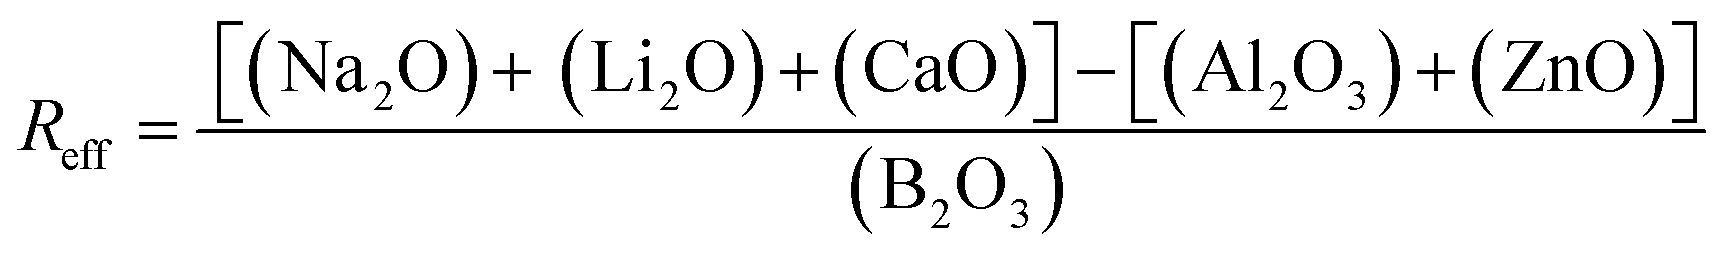 | (7) |
The amount of alkali oxide associated with the silicate network (R2O (Si)) was determined by a modification of the equation developed by El-Damrawi et al.:39
| R2O(Si) = R2O − {R2O[BO4(B2O3)] + R2O[Al2O3]} | (8) |
| R2O + CaO(Si/Zn) = (R2O + CaO) − {R2O[BO4(B2O3)] + R2O[Al2O3]} | (9) |
| Znunbalanced = ZnO − (R2O + CaO) − {R2O[BO4(B2O3)] + R2O[Al2O3]} | (10) |
The fraction of Si Q3 and Q4[X] species (where X = network forming Al, B or Zn bonded to a Si tetrahedra (Si–O–X)) can be predicted according to eqn (11) and (12). The Zn-rich compositions (Ca0Zn100, Ca20Zn80 and Ca40Zn60) were predicted to contain no Q3 species, in contrast to the CaO-rich compositions (Ca60Zn40, Ca80Zn20 and Ca100Zn0), which showed an increase in predicted Q3 with increasing CaO content (Table 2); this is concurrent with non-bridging oxygen formation and network depolymerisation associated with the addition of Ca2+ as a network modifier instead of Zn2+. The prediction of Q4[X], however, did not show a clear trend with the changing CaO:ZnO ratio. The lowest value occurred for the Zn-rich end member Ca0Zn100 and continued in the trend Ca0Zn100 < Ca100Zn0 < Ca80Zn20 < Ca60Zn40 = Ca20Zn80 < Ca60Zn40. This makes it difficult to hypothesise the nature of the non-charge-balanced Zn species in the glass network; noting that it has previously been found that Zn can also act as an intermediate species in glasses with low alkali concentration or substantial Zn content,6,9,41 with ZnO6 octahedra in a modifying role.12 The structural behaviour of Zn in the CaxZny series is, therefore, investigated through the application of Zn K-edge XAS.
| Q3 = {(R2O + CaO) − {R2O[BO4(B2O3)] + R2O[Al2O3]}} − SiO2 | (11) |
 | (12) |
Effect of CaO![[thin space (1/6-em)]](https://www.rsc.org/images/entities/h3_char_2009.gif) :ZnO ratio on Zn coordination and local environment
:ZnO ratio on Zn coordination and local environment
X-Ray Absorption Near Edge Spectroscopy (XANES) spectra collected at the Zn K-edge show that the shape and the absorption edge positions (E0) of the CaxZny glass series have some similarities with that of Zn in willemite (Zn2SiO4) and hardystonite (Ca2ZnSi2O7) chemical environments (Fig. 1). The intensities of the two peaks, which form the crest of the absorption edge, change systematically with the CaO:ZnO ratio, indicating that a gradual change in the local chemical environment of Zn occurs when this ratio is altered, in agreement with both the extended Dell–Bray model structure predictions and MAS NMR measurements.
 | ||
| Fig. 1 XANES spectra for the CaxZny glass series, compared with the Zn standards willemite (Zn2SiO4) and hardystonite (Ca2ZnSi2O7). | ||
The k3-weighted EXAFS spectra and corresponding Fourier Transform (FT) of the glass series were fitted as shown in Fig. 2. The corresponding data for the Zn-silicate standards is shown in ESI† Fig. S2. A model, of one O-shell and one Si-shell, was applied and the results of the structural parameter refinement are summarized in Table 3. The main peak observed for all compositions was fitted with approximately four oxygen atoms at a distance of ∼1.94 Å. This indicates that, for all glass compositions, Zn2+ was present in four coordinated sites as a network-former. This effectively rules out the hypothesis that uncharged Zn species occur as octahedrally coordinated ZnO6 in a network modifying role in this suite of glass samples.
 | ||
| Fig. 2 Extended X-ray Absorption Fine Structure (EXAFS) spectra in radial space and the corresponding k3-weighted EXAFS for the CaxZny glass series, for: (a) Ca80Zn20, (b) Ca60Zn40, (c) Ca40Zn60, (d) Ca20Zn80 and (e) Ca0Zn100. | ||
| S O 2 | R-factor | First-shell | Second-shell | |||||
|---|---|---|---|---|---|---|---|---|
| N1 | Zn–O (Å) | σ 2 (10−2 Å2) | N2 | Zn–Si (Å) | σ 2 (10−2 Å2) | |||
| Ca80Zn20 | 0.78 | 0.017 | 4.68 ± 0.45 | 1.937 ± 0.009 | 0.61 ± 0.13 | 3.22 ± 3.93 | 2.953 ± 0.033 | 2.76 ± 2.15 |
| Ca60Zn40 | 0.78 | 0.019 | 4.40 ± 0.41 | 1.939 ± 0.011 | 0.56 ± 0.13 | 2.05 ± 2.35 | 2.982 ± 0.040 | 1.81 ± 1.90 |
| Ca40Zn60 | 0.78 | 0.019 | 4.28 ± 0.39 | 1.941 ± 0.010 | 0.57 ± 0.13 | 1.88 ± 2.11 | 2.994 ± 0.040 | 1.69 ± 1.78 |
| Ca20Zn80 | 0.78 | 0.019 | 4.23 ± 0.40 | 1.940 ± 0.011 | 0.93 ± 0.13 | 1.85 ± 2.01 | 2.993 ± 0.043 | 1.65 ± 1.73 |
| Ca0Zn100 | 0.78 | 0.020 | 4.06 ± 0.38 | 1.943 ± 0.010 | 0.56 ± 0.13 | 1.41 ± 1.52 | 3.019 ± 0.043 | 1.36 ± 1.56 |
| Zn2SiO4 | 0.78 | 0.010 | 4 | 1.947 ± 0.007 | 0.44 ± 0.11 | 2 | 3.244 ± 0.053 | 1.63 ± 0.88 |
| 4 (Si) | 3.036 ± 0.021 | 0.76 ± 0.21 | ||||||
| Ca2ZnSi2O7 | 0.78 | 0.028 | 4 | 1.938 ± 0.010 | 0.38 ± 0.08 | 4 (O) | 3.284 ± 0.010 | 0.38 ± 0.08 |
| 8 (Ca) | 3.843 ± 0.019 | 1.18 ± 0.23 | ||||||
Subtle changes in the glass structure were evident with the change in CaO:ZnO ratio. Notably, both the Zn–O and Zn–Si nearest neighbour mean scattering distances were found to subtly increase as the proportion of ZnO in CaxZny was increased. This was concurrent with a systematic reduction in the mean coordination number of Zn, albeit within the limit of precision. At lower ZnO values, the Zn–O distance was similar to that of the ZnO and CaO-containing silicate mineral, hardystonite (Ca2ZnSi2O7), in which bridging oxygens are corner shared by one tetrahedrally-coordinated Zn atom and two Si atoms as shown in Fig. 3a.42 The mean Zn–Si scattering distance in the composition containing the most Ca (Ca80Zn20) was determined to be somewhat shorter than that of the Zn–Si bond length in hardystonite (2.953 ± 0.033 Å, compared with 3.284 ± 0.019 Å, respectively); the reason for this difference could be the presence of smaller alkali elements (Na, Li) in the glass silicate network in the place of Ca within the mineral lattice.
 | ||
| Fig. 3 Schematic showing the different zinc silicate network arrangements hypothesised to occur in the CaxZny glass series. (a) The hardystonite-like environment (Ca2ZnSi2O7), where bridging oxygens are corner shared by one Zn tetrahedron and one Si tetrahedron; and (b) the willemite-like environment (Zn2SiO4), where bridging oxygens are corner shared by two Zn and one Si tetrahedron in “tri-clusters” of Zn–O–Si/Al, highlighted by dashed lines. Green triangles are SiO4 tetrahedra, purple triangles ZnO4 tetrahedra, white circles bridging oxygens, grey circles non-bridging oxygen, and blue circles alkali/alkaline earth elements. | ||
In the Zn-rich compositions (e.g. Ca20Zn80 and Ca0Zn100), the increase in Zn–O mean scattering distance is consistent with Zn in a willemite (Zn2SiO4)-like coordination. In this mineral, bridging oxygens are corner shared by two Zn and one Si tetrahedra in “tri-clusters” of Zn–O–Si with longer average Zn–O and Zn–Si distances (1.947 ± 0.007 Å and 3.244 ± 0.053 Å, respectively) than hardystonite (Table 3 and Fig. 3b).43,44 If Al is found to be in tetrahedral coordination, a second tri-cluster arrangement should also be possible, Zn–O–Al. Evidence for the presence of such tri-clusters in the Zn-rich compositions of the CaxZny series – which have been established to nucleate within the glass network as small rigid rings surrounded by clusters of alkali/alkaline earth ions45 – is further underpinned by the apparent trend of reduction in Zn coordination number with increasing Zn concentration. This indicates a transition towards a higher degree of long-range order within the glass structure, concurrent with the formation willemite-like tri-clusters. Given that the mean scattering distances for the highest ZnO-containing glass compositions were somewhat lower than that of willimite, this suggests that the willemite-like tri-clusters are distributed within the wider alkali borosilicate network, containing Zn in a hardystonite-like environment, as shown in Fig. 3b. These data are therefore suggestive of nano-scale phase separation in the Zn-rich glass compositions, which contain Zn in both “willemite-like” and “hardystonite-like” environments.
The extended Dell–Bray structure calculations support this finding, and predict that for the highest ZnO glass compositions in the CaxZny series, there is insufficient alkali/alkaline earth present to charge balance [ZnO4]2− species, which must then acquire charge by a different mechanism. Differential thermal analysis (Fig. 4 and Table 4) also shows evidence that two distinct phases are present for the higher ZnO-containing glass compositions, which exhibited two glass transition (Tg) temperatures. Analysis by XRD (ESI† Fig. S1) revealed no crystalline phases in any of the compositions, therefore it could be concluded that the two different Zn-silicate containing environments arise from phase separation rather than de-vitrification (i.e. they remain amorphous rather than forming crystalline phases). This is consistent with literature on similar Zn-bearing glass compositions, which were reported to be phase separated.12,20,46 It is notable that the Tg of the second phase (Tg2, Table 4) in the high ZnO glasses occurs at a higher temperature than that of the first phase, reflecting the difference between a willemite-like structure and a hardystonite-like structure.
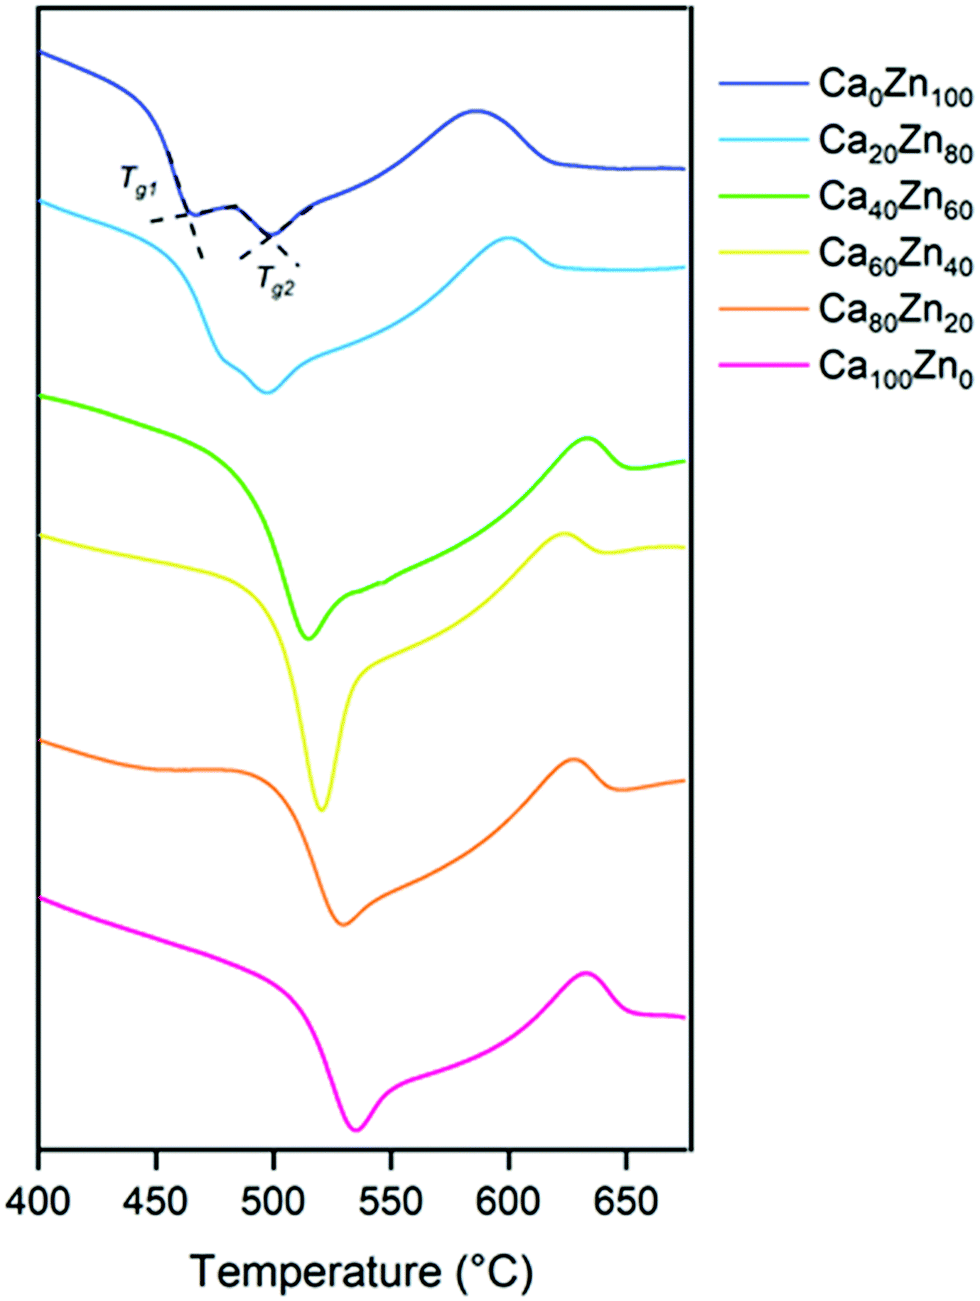 | ||
| Fig. 4 Differential thermal analysis traces for the CaxZny lithium alkali-borosilicate glass series, focussing on the glass transition range. The acquisition of Tg (°C) from linear extrapolation of the tangent points for Ca0Zn100 is illustrated. | ||
| Ca100Zn0 | Ca80Zn20 | Ca60Zn40 | Ca40Zn60 | Ca20Zn80 | Ca0Zn100 | ||
|---|---|---|---|---|---|---|---|
| Temperature/°C | T g1 | 534 | 528 | 520 | 514 | 480 | 465 |
| T g2 | — | — | — | — | 498 | 500 | |
| T c1 | 634 | 629 | 623 | 610 | 600 | 588 | |
| T c2 | — | — | — | — | 715 | 675 |
The DTA data also show that the transition temperature of the glassy phase present in all of the compositions, Tg1, decreased with increasing ZnO content. Given the change in chemical environment of Zn evidenced by EXAFS analysis, this tends to suggest that the addition of ZnO reduces the polymerisation of the hardystonite-like environment, i.e., effectively forming the second glass phase (willemite-like) at the expense of the connectivity of the first glass phase (hardystonite-like).
Quantification of the effect of CaO:ZnO ratio on Al, B and Si local environments
According to 27Al NMR measurements (Fig. 5), aluminium was observed to be entirely in four-fold coordination forming tetrahedral ([4]Al) units across the entire CaxZny glass series. This is indicated by the 27Al peak maximum occurring at an observed chemical shift, δobs,Al, of between 50–80 ppm.45 In agreement with similar alkali-aluminoborosilicate glass compositions,35,47–50 this confirms that there is sufficient alkali and alkaline earth species in the CaxZny series to fully charge compensate all [AlO4]−. A long tail in the 27Al NMR data has been reported to represent the presence of AlO5 units,51 which may play a charge balancing role; however, if present, these species are likely to be in extremely low quantity. A higher field measurement would be required to deconvolute these data further.
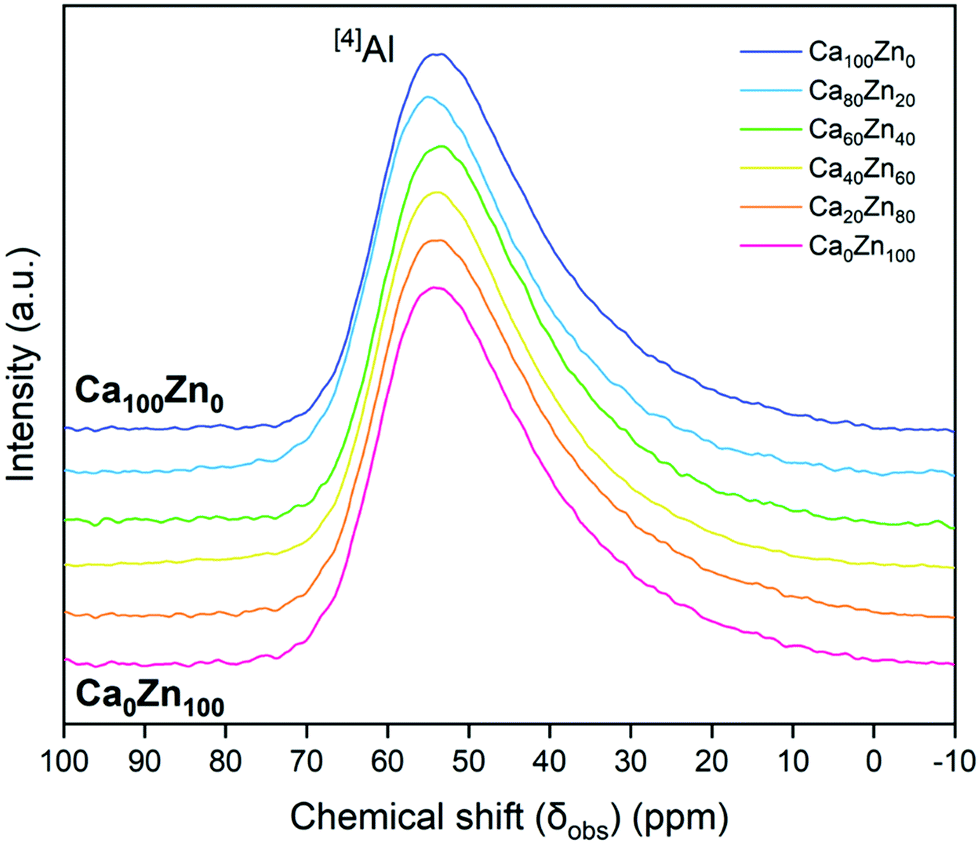 | ||
| Fig. 5 27Al MAS NMR spectra for the CaxZny glass series. | ||
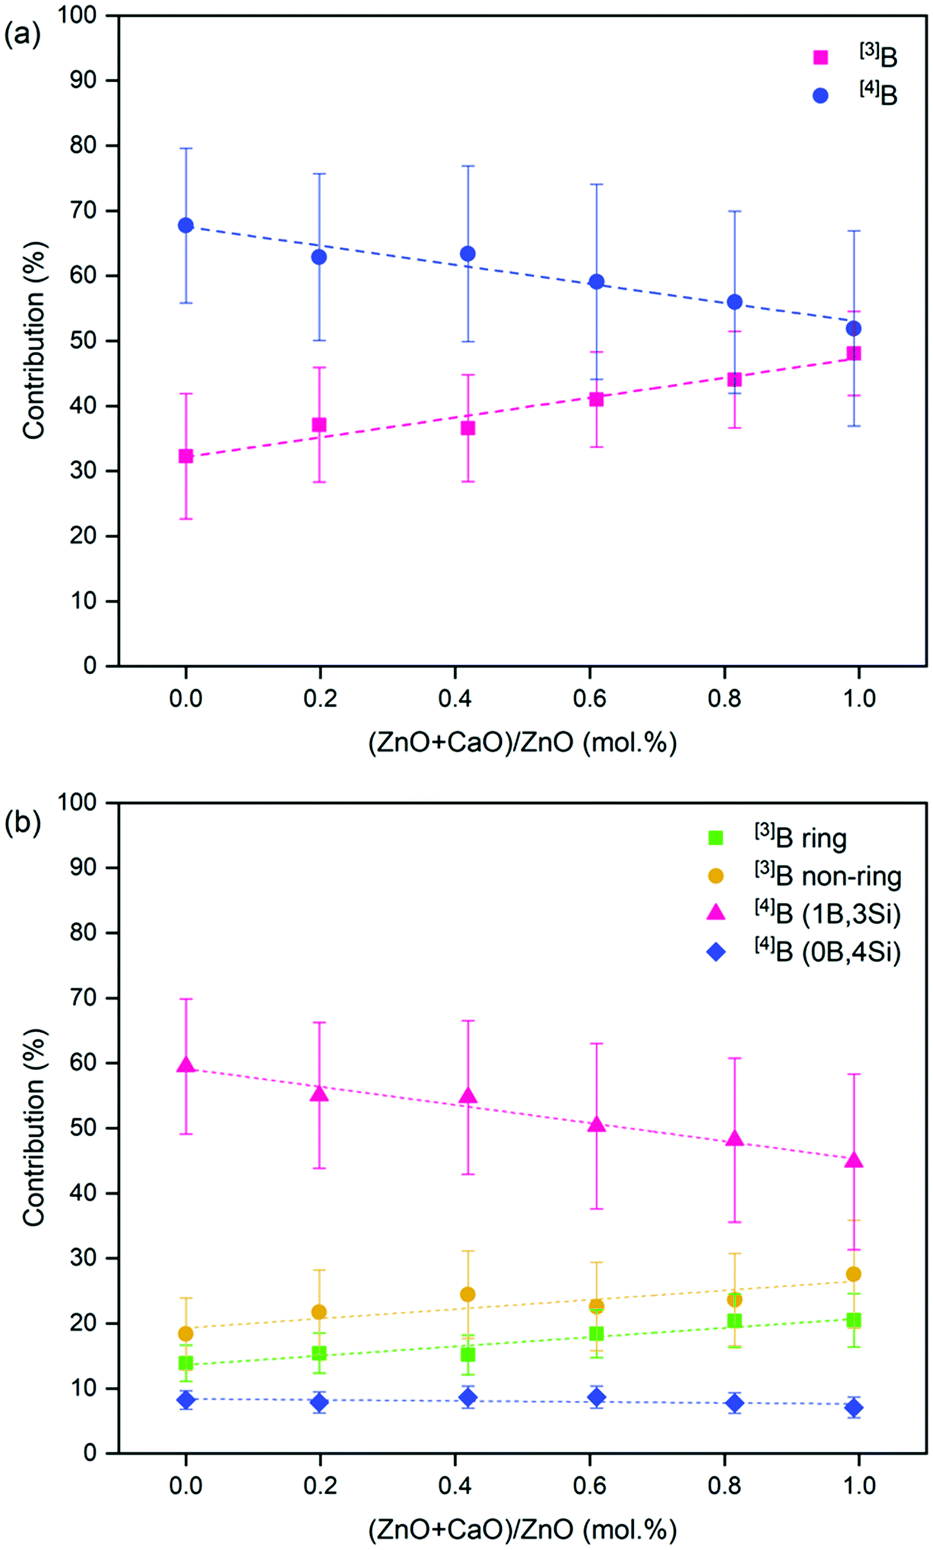
The 11B MAS NMR spectra (Fig. 6) were deconvoluted into four contributions related to: (i) ring and (ii) non-ring [3]B (BO3), and two [4]B (BO4) environments related to (iii) (1B, 3Si) and (iv) (0B, 4Si) (ESI† Table S1) according to Parkinson et al.52 and Backhouse et al.,53 who studied similar simple glass compositions. Quantification of the B speciation was provided by the integral of each fit, whereby values were corrected for the loss of intensity from the [3]B contributions to the spinning sidebands. The fraction of [3]B and [4]B contributions for each of the CaxZny compositions are shown in Table 5 and Fig. 7.
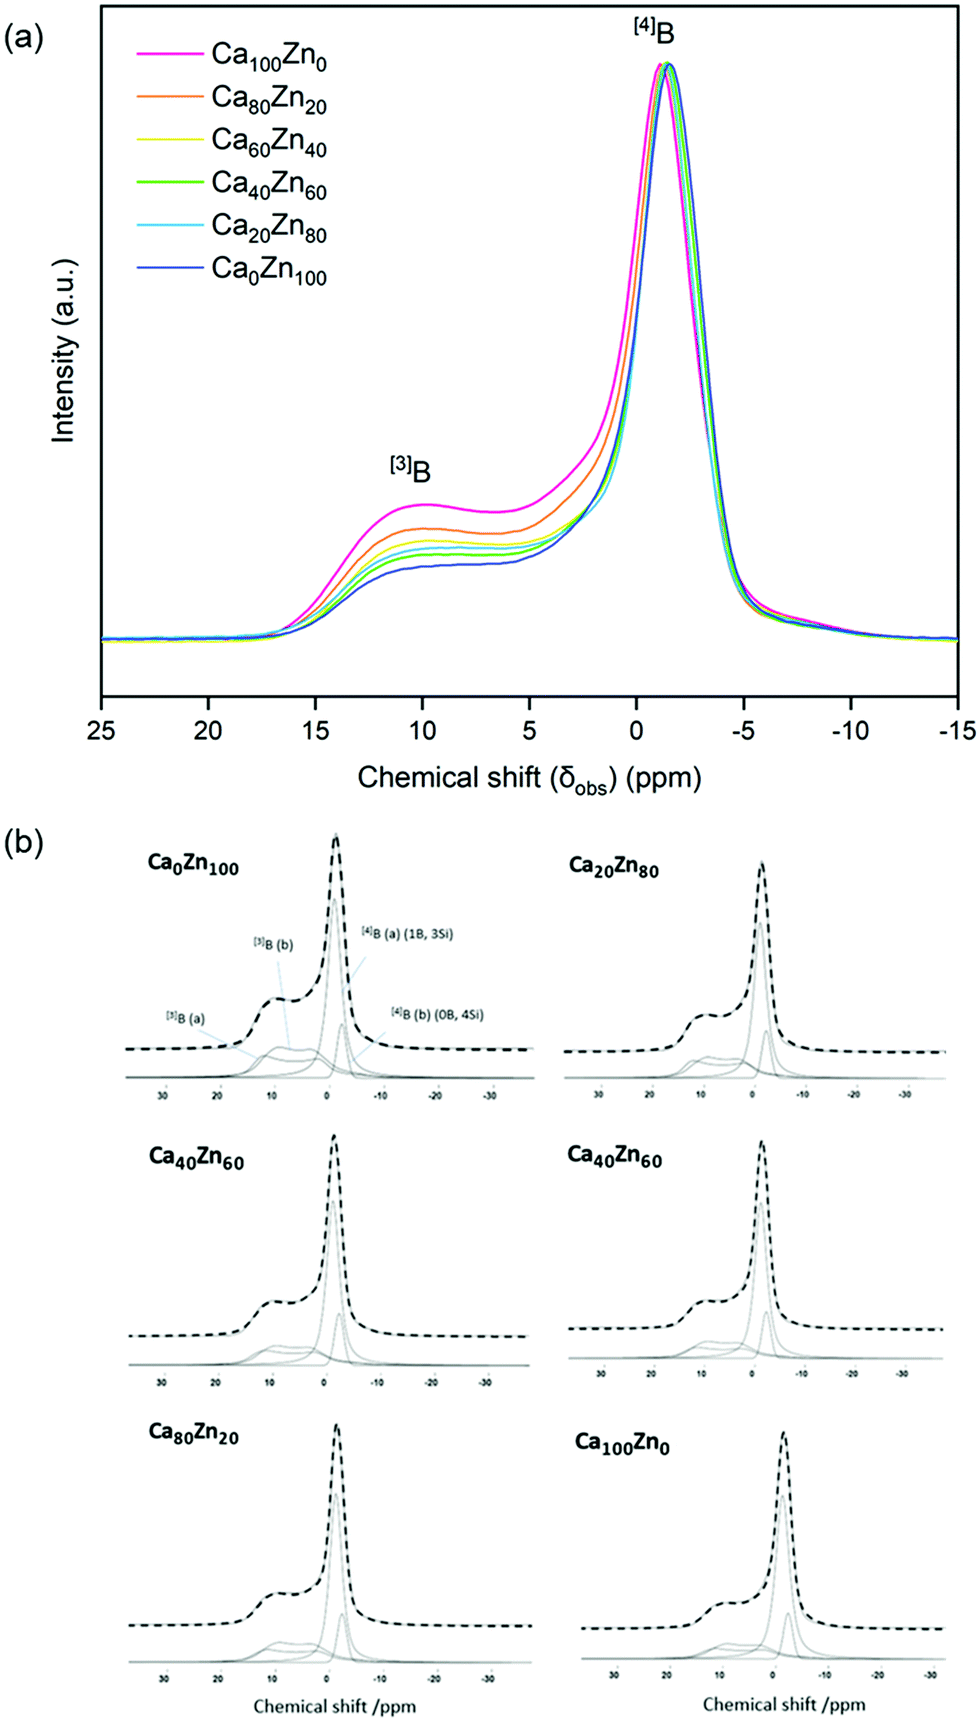 | ||
| Fig. 6 11B MAS NMR spectra for the CaxZny glass series. (a) Stacked 11B MAS NMR for each glass composition; and (b) spectral deconvolution, with the dashed line indicating the applied fit. | ||
| Composition | B Species | Chemical shift (ppm) (±1) | C Q MHz (±0.2) | Rel% (±2) | Rel% Error | Total% [3]B/[4]B | Total ± % | ηQ (±0.1) |
|---|---|---|---|---|---|---|---|---|
| Ca0Zn100 | [3]B (a) ring | 16.8 | 2.7 | 20.49 | 0.2 | 48.1 | 9.6 | 0.4 |
| [3]B (b) non-ring | 14.5 | 2.7 | 27.58 | 0.2 | 0.3 | |||
| [4]B (a) (1B, 3Si) | −0.8 | — | 44.83 | — | 51.9 | 10.4 | — | |
| [4]B (b) (0B, 4Si) | −2.2 | — | 7.09 | — | 1.4 | — | ||
| Ca20Zn80 | [3]B (a) ring | 16.8 | 2.7 | 20.42 | 0.4 | 44.1 | 8.8 | 0.4 |
| [3]B (b) non-ring | 14.5 | 2.7 | 23.64 | 0.3 | 0.3 | |||
| [4]B (a) (1B, 3Si) | −1 | — | 48.17 | — | 56.0 | 11.2 | — | |
| [4]B (b) (0B, 4Si) | −2.2 | — | 7.78 | — | 1.6 | — | ||
| Ca40Zn60 | [3]B (a) ring | 16.8 | 2.7 | 18.4 | 0.4 | 41.0 | 8.2 | 0.4 |
| [3]B (b) non-ring | 14.6 | 2.7 | 22.59 | 0.3 | 0.3 | |||
| [4]B (a) (1B, 3Si) | −1.1 | — | 50.32 | — | 59.0 | 11.8 | — | |
| [4]B (b) (0B, 4Si) | −2.25 | — | 8.69 | — | 1.7 | — | ||
| Ca60Zn40 | [3]B (a) ring | 16.8 | 2.7 | 15.16 | 0.4 | 36.6 | 7.3 | 0.4 |
| [3]B (b) non-ring | 14.6 | 2.7 | 21.43 | 0.3 | 0.3 | |||
| [4]B (a) (1B, 3Si) | −1.2 | — | 54.74 | — | 63.4 | 12.7 | — | |
| [4]B (b) (0B, 4Si) | −2.3 | — | 8.66 | — | 1.7 | — | ||
| Ca80Zn20 | [3]B (a) ring | 16.9 | 2.7 | 15.42 | 0.4 | 37.1 | 7.4 | 0.4 |
| [3]B (b) non-ring | 14.6 | 2.7 | 21.7 | 0.3 | 0.3 | |||
| [4]B (a) (1B, 3Si) | −1.15 | — | 55.03 | — | 62.9 | 12.6 | — | |
| [4]B (b) (0B, 4Si) | −2.3 | — | 7.86 | — | 1.6 | — | ||
| Ca100Zn0 | [3]B (a) ring | 16.9 | 2.7 | 13.89 | 0.4 | 32.3 | 6.5 | 0.4 |
| [3]B (b) non-ring | 14.4 | 2.7 | 18.39 | 0.3 | 0.3 | |||
| [4]B (a) (1B, 3Si) | −1.3 | — | 59.49 | — | 67.7 | 13.5 | — | |
| [4]B (b) (0B, 4Si) | −2.3 | — | 8.23 | — | 1.6 | — |
 | ||
| Fig. 7 Deconvolution of the 11B MAS NMR spectra for the CaxZny glass series. Showing (a) total [3]B and [4]B contribution; and (b) the proportion of individual [3]B and [4]B contributions. | ||
The total integrated spectral deconvolution of the [3]B and [4]B regions showed that as the ZnO content increased, there was a general trend towards increasing [3]B units and decreasing [4]B units (Fig. 7a). In agreement with the extended Dell–Bray model predictions (Table 2), compositions with greater CaO content should contain a higher proportion of [4]B, consistent with the contribution of Ca2+ towards charge balancing boron.25 The increase in [3]B with increasing ZnO concentration may also be due to the requirement for charge compensation of the [ZnO4]2− tetrahedra, resulting in less alkali available to convert [3]B to [4]B units.36 The [4]B (0B, 4Si) contribution was found to be invariant with respect to the CaO:ZnO ratio, however, the [4]B (1B, 3Si) contribution was observed to decrease with increasing ZnO content.
Although the trends observed for the B speciation determined by NMR were in agreement with those predicted by the extended Dell–Bray model (Table 2), their absolute values were far from agreement for the ZnO-rich compositions (particularly Ca0Zn100 and Ca20Zn80). Notwithstanding the errors associated with spectral deconvolution of 11B NMR, this indicates that the model does not accurately describe the CaO:ZnO system once phase separation starts to occur. This is most obviously seen in the Ca0Zn100 and Ca20Zn80 glasses where the Dell–Bray model predicts approximately 2 times and 1.5 times the amount of BO3 determined from the deconvoluted 11B spectra.
The 29Si MAS NMR spectra (Fig. 8) showed that there was a tendency towards a more negative isotropic chemical shift, δiso,Si, with increasing ZnO content, from a peak position δiso,Si = −90.5 ± 0.5 ppm for Ca100Zn0 to δiso,Si = −93 ± 0.5 ppm for Ca0Zn100. This behaviour is concurrent with the presence of more polymerised Si environments in the higher ZnO-containing compositions, as might be expected from the presence of a phase-separated willemite-like environment within the glass structure. The FWHM of the 29Si MAS NMR signal also increased with increasing ZnO content. Such broadening is concurrent with chemical shift dispersion around nominally equivalent Qn(X) type Si tetrahedra (where X = network forming Al, B or Zn) with slightly different chemical shifts caused by variation in bond angle and bond length.46,54 Such behaviour is likely to result from the presence of two distinct silicate networks containing Zn. Due to this broadening, it was not possible to further deconvolute the data into individual Qn species, therefore it is not possible to comment on the accuracy of the extended Dell–Bray model predictions for the Q3 and Q4 species contributions to the glass structure.
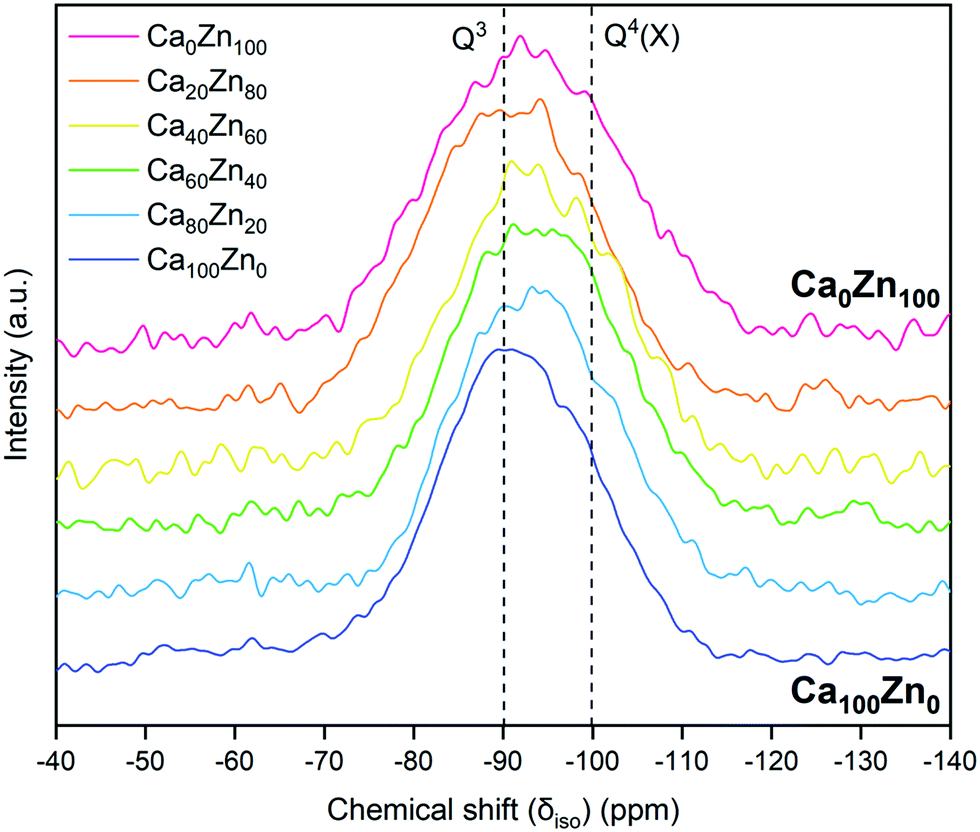 | ||
| Fig. 8 29Si MAS NMR spectra for the CaxZny glass series overlaid with chemical shifts approximately representative of Q3 and Q4(X) (where X is a network former other than Si) species. Indicative location of Q3 and Q4(X) species are shown. | ||
Structure-dissolution relationship of CaO:ZnO containing glasses
The forward dissolution rate of the glass compositions, i.e., the rate of dissolution independent of solution feedback effects, derived under dynamic conditions, was found to decrease with increasing ZnO content (Fig. 9 and Table 6). For example, the normalised dissolution rate of Si (NRSi) of Ca0Zn100 was approximately 7.5 times lower than that of Ca60Zn40, and 14 times lower than Ca100Zn0 after the attainment of steady-state dissolution after approximately 30 days. The enhanced Si durability of the ZnO-rich composition relative to the CaO-rich composition is concurrent with the 29Si MAS NMR data, which indicate that the silicate network for Ca0Zn100 is more polymerised than that of Ca100Zn0. Greater silicate network polymerisation, involving the presence of phase-separated willemite-like tri-clusters of Si–O–Zn, should enhance the chemical resistance to hydrolysis of Si–O–X bonds (where X = network former).5,17–21 This conclusion is supported by comparison with the International Simple Glass (ISG), a standard 6-component alkali borosilicate glass,55 which possesses a more negative δSi MAS NMR peak shift than the CaxZny glass series, of −97 ppm.56,57 Accordingly, the NRSi (Fig. 9d) indicates that the ISG is more durable than the glasses investigated in the present study.58,59
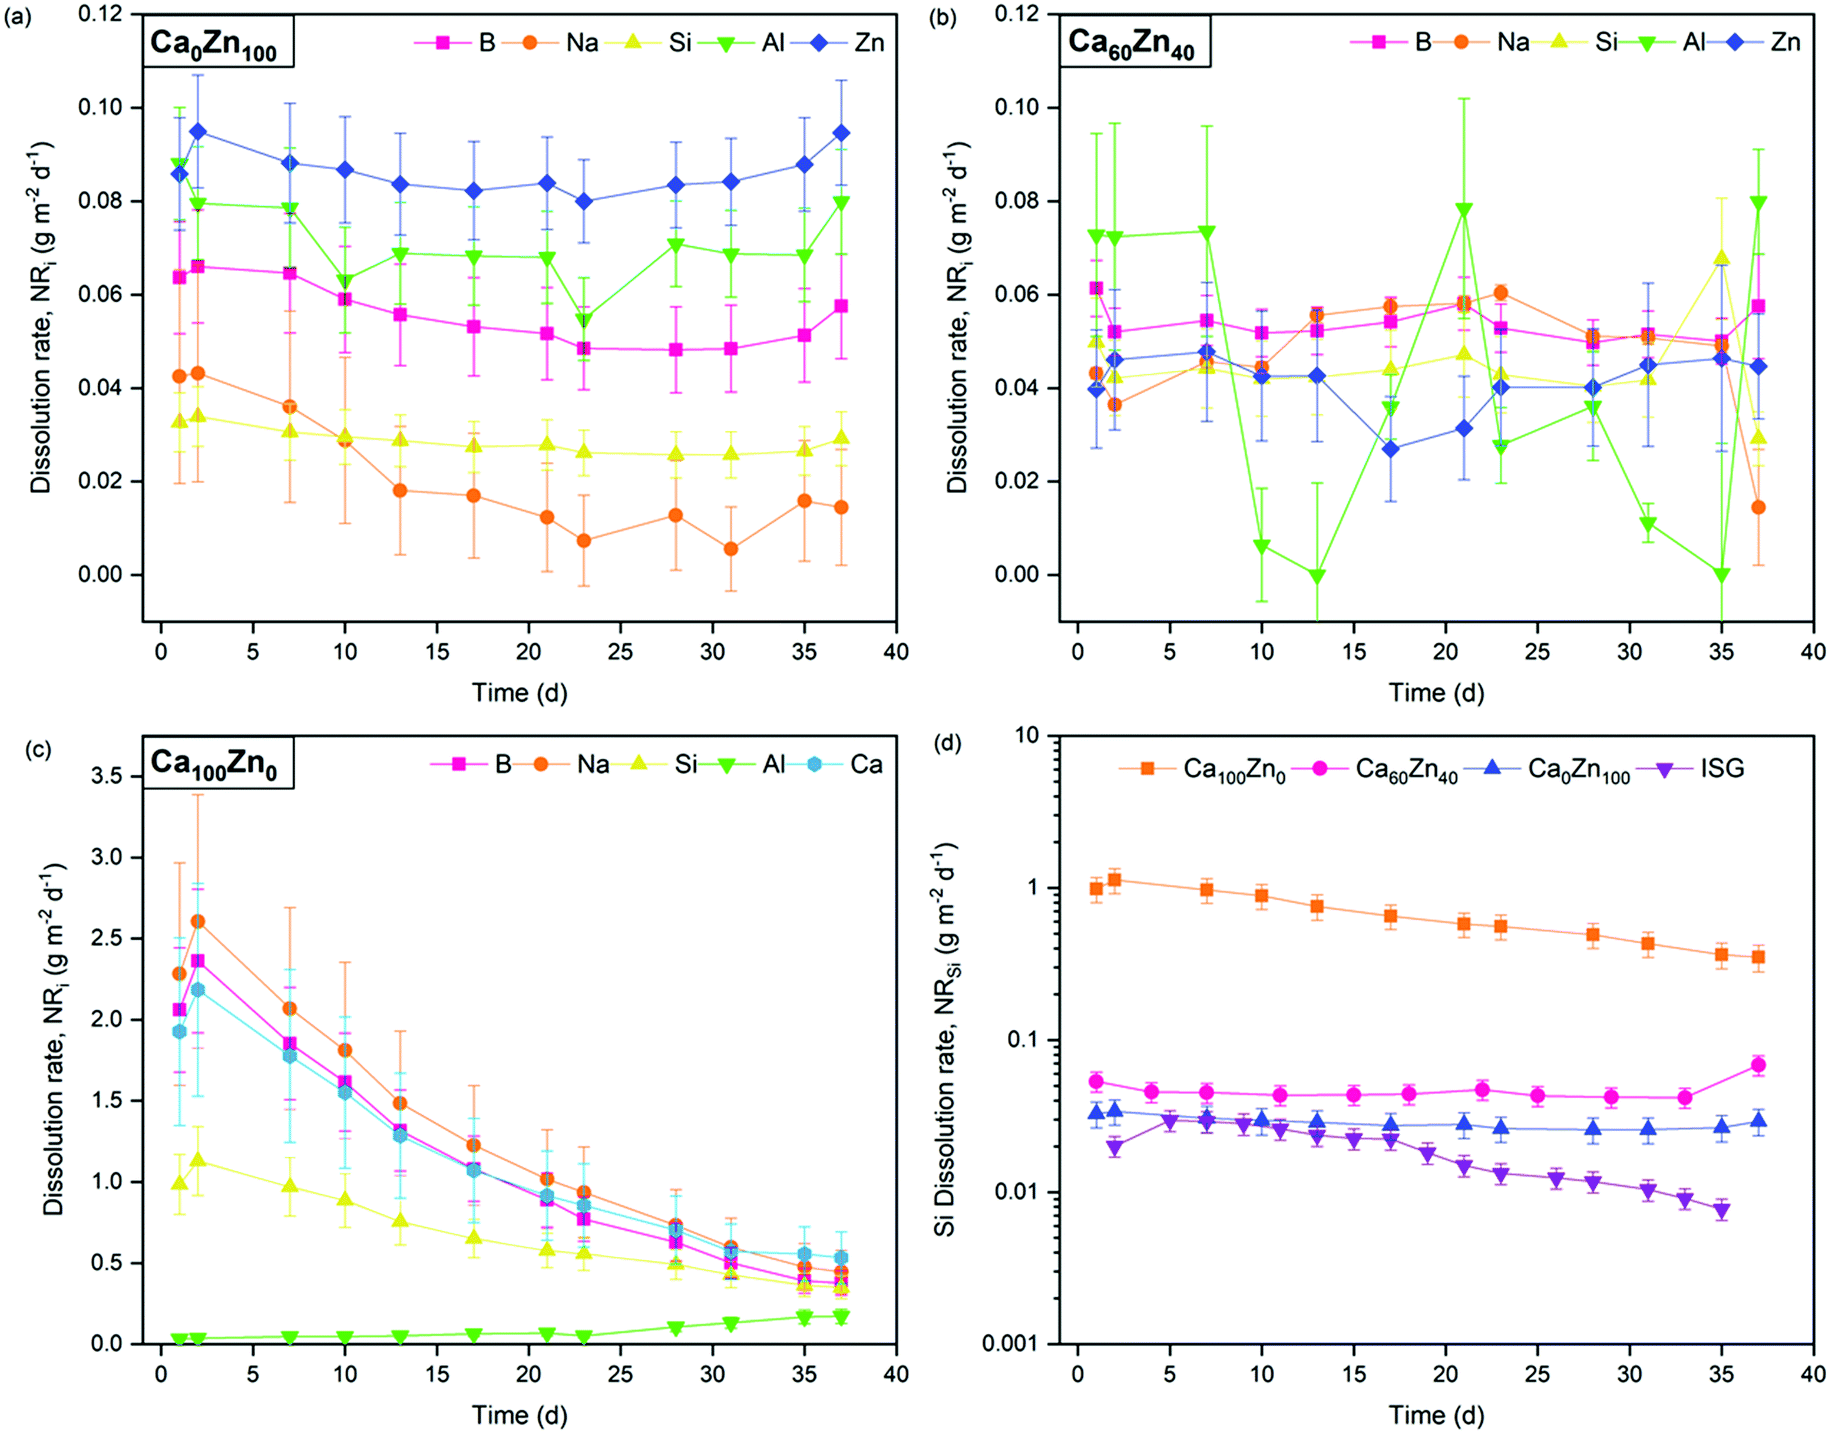 | ||
| Fig. 9 Normalised dissolution rate (NRi) of elements released from the CaxZny glass compositions during dynamic dissolution experiments. Showing (a) Ca0Zn100; (b) Ca60Zn40; (c) Ca100Zn0; and (d) the NRSi of all three CaxZny compositions investigated, compared with the International Simple Glass.58,59 The scatter in Al data in (b) is attributed to the proximity of Al concentrations to the detection limit of the instrument. | ||
| Ca100Zn0 | Ca60Zn40 | Ca0Zn100 | |
|---|---|---|---|
| Steady state average concentrations (mg L−1, ± 5%) | |||
| B | 1.85 | 1.33 | 0.24 |
| Si | 5.67 | 0.70 | 0.40 |
| Na | 0.72 | 0.58 | 0.06 |
| Al | 0.23 | — | 0.14 |
| Zn | n/a | 0.14 | 0.72 |
| Ca | 2.62 | 0.14 | n/a |
| Steady state dissolution rate (g m−2 d−1) | |||
| B | 0.38 ± 0.07 | 0.053 ± 0.005 | 0.049 ± 0.009 |
| Si | 0.36 ± 0.07 | 0.048 ± 0.01 | 0.026 ± 0.005 |
| Na | 0.46 ± 0.07 | 0.050 ± 0.01 | 0.021 ± 0.006 |
| Al | 0.17 ± 0.10 | — | 0.066 ± 0.011 |
| Zn | n/a | 0.039 ± 0.01 | 0.086 ± 0.015 |
| Ca | 0.54 ± 0.08 | 0.048 ± 0.01 | n/a |
The NRB of Ca0Zn100 was also lower than that of Ca100Zn0, confirming that the observations of improved Si durability with increased ZnO content extended to the wider borosilicate glass network. This resolves one part of a long-running debate on the role of Zn in the dissolution of glass; that Zn improves the durability in the forward rate of dissolution.
While the NRSi in the ZnO end-member was 14 times lower than that of the CaO equivalent, the NLB was only ∼7.5 times lower. This incongruent dissolution behaviour for the Ca0Zn100 composition is also evidenced in the NLZn, which was greater than NLB and NLSi by a factor of 1.8 and 3.3, respectively. Similarly, the NLNa was lower than for the other elements. Such incongruency in the intrinsic glass dissolution rate determined under dilute conditions, in agreement with the present study, has previously been associated with phase separated materials.60 The observation of a more rapid NLZn than the other elements in Ca0Zn100 suggests that, despite the formation of willemite-like clusters that improve the overall silicate network durability, Zn still exists in the wider glass structure within the hardystonite-like environment, which appears to be leached into solution.
In accordance with the incongruent dissolution behaviour, post-dissolution examination of glass particles revealed that the ZnO-containing glasses exhibited channel-like dissolution features, which were not evident for Ca100Zn0 (Fig. 10). These dissolution features, similar to those observed for ISG and attributed to localised chemical attack in alkali-rich regions,60–62 are further evidence that one of the separate Zn-containing glass environments dissolved more rapidly than the other. Given that the thermal analysis data indicated that the “willemite-like” glass environment was formed at the expense of the connectivity of the “hardystonite-like” environment, and that the Si leach rates of Ca0Zn100 were significantly lower than Ca100Zn0, it is suggested that the willemite-like Zn-silicate environment is more durable than the hardystonite-like environment. Moreover, if the presence of these clusters induces the segregation of alkali/alkaline-earth elements around the edges of the cluster, these regions may preferentially dissolve due to (i) depolymerisation of the network associated with an increase in non-bridging oxygens in these regions; and/or (ii) local increase in pH due to preferential corrosion of alkali/alkaline earth elements. Further studies focusing on longer-term durability experiments are necessary to fully determine the role of these structural alterations on the glass dissolution behaviour.
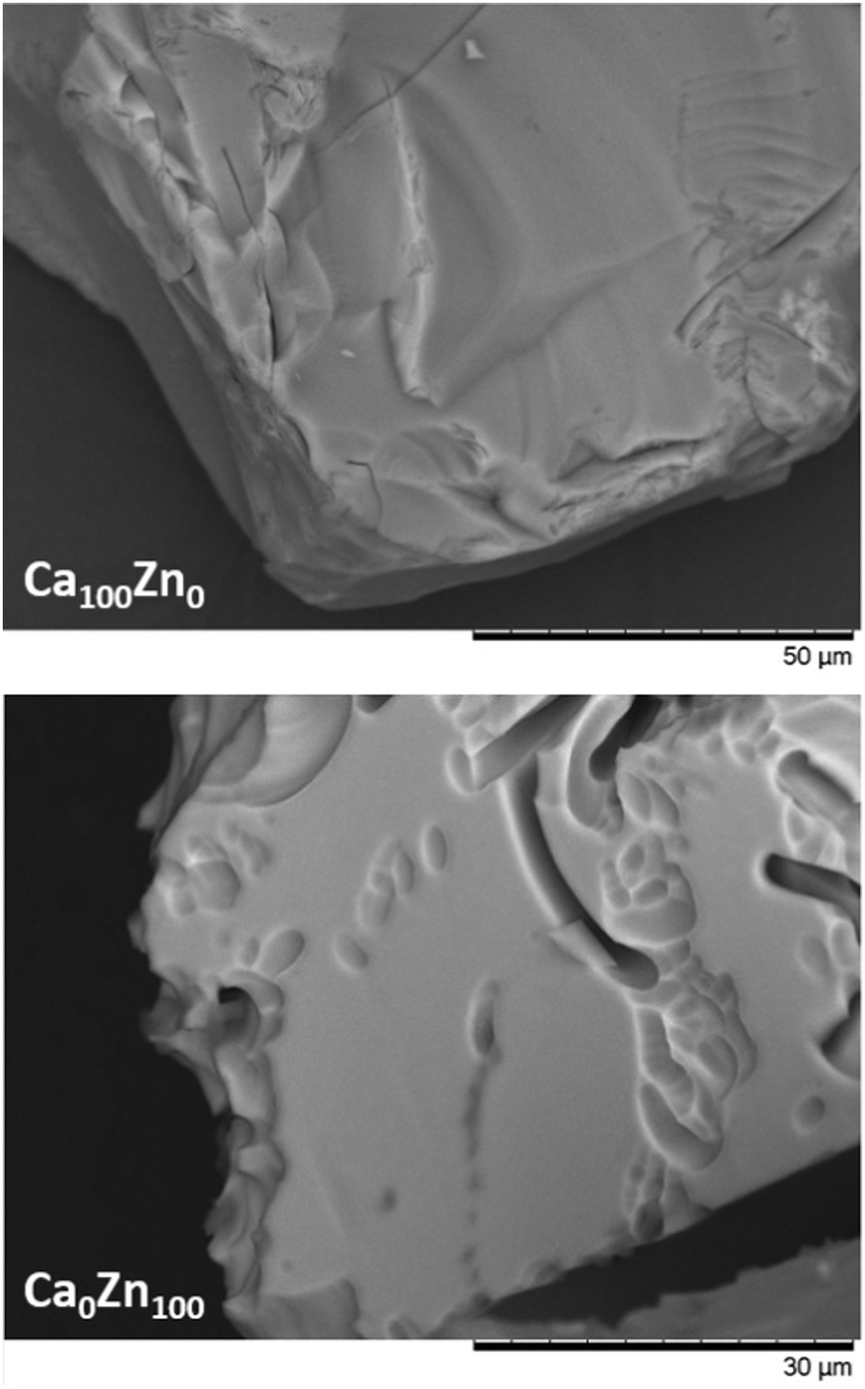 | ||
| Fig. 10 Scanning Electron Microscopy images of Ca100Zn0 and Ca0Zn100 obtained after dissolution under dynamic conditions. | ||
Conclusions
The effect of relatively small (<10 mol%) changes to the CaO:ZnO ratio of a simplified alkali aluminoborosilicate glass, formulated on the basis of a UK nuclear waste glass composition, was investigated. The molar replacement of CaO by ZnO had a marked effect on the glass structure, which was predicted using a Dell–Bray model that was extended to include ZnO. Zn K-edge EXAFS suggested that two distinct Zn environments, both containing Zn in tetrahedral coordination, were present as a function of CaO:ZnO ratio. At high CaO content Zn was coordinated in a “hardystonite-like” (Ca2ZnSi2O7) environment, while higher ZnO content induced destabilization of the hardystonite-like environment to form tri-clusters of Si/Al–O–Zn in a “willemite-like” (Zn2SiO4) environment. Spectral broadening in the 29Si MAS NMR data of the ZnO-rich compositions indicated that multiple environments were present, while thermal analysis directly evidenced two distinct glassy phases in the highest ZnO-rich glasses. The changes in the glass structure were reflected in the chemical durability, with forward dissolution rates obtained under dilute conditions. Glasses with greater ZnO content exhibited higher durability, suggested to arise from Si incorporation in willemite-like tri-clusters. Phase separation was exemplified by incongruent dissolution behaviour, resulting in highly localised corrosion features, hypothesised to arise from preferential dissolution of the hardystonite-like glass phase.
Data availability
Data will be made available upon reasonable request to the corresponding author.Conflicts of interest
There are no conflicts of interest to declare.Acknowledgements
The authors wish to acknowledge the UK Engineering and Physical Science Research Council (under Grant numbers EP/L015390/1, EP/N017870/1 and EP/N017374/1) and Radioactive Waste Management Ltd. for funding. This research utilised the HADES/MIDAS63 and PLEIADES facilities at the University of Sheffield established with financial support from EPSRC and BEIS, under grant numbers EP/T011424/1 and EP/V035215/1. Collection of Zn K-edge XAS data was performed at Diamond Light Source beamline B18, under Proposal SP17243, with kind assistance from Giannantonio Cibin. Zn K-edge XAS data were also acquired, with the kind assistance of Dr Bruce Ravel, at beamline BMM of the National Synchrotron Light Source II, a U.S. Department of Energy (DOE) Office of Science User Facility Operated for the DOE office of Science by Brookhaven National Laboratory under Contract No. DE-SC0012704. Solid-state NMR spectra were obtained at the EPSRC UK National Solid-state NMR Service at Durham; we thank Dr David Apperley for his generous assistance in data collection and Dr Dale Prentice for his support in the interpretation of the results.References
- B. F. Dunnett, Summary of the development of a Ca/Zn borosilicate glass for vitrification of high molybdenum waste, NNL, 2013, 13(1), 12642 Search PubMed.
- M. T. Harrison and G. C. Brown, Mater. Lett., 2018, 221, 154–156 CrossRef CAS.
- B. F. Dunnett, N. R. Gribble, R. Short, E. Turner, C. J. Steele and A. Riley, Glass Technol.: Eur. J. Glass Sci. Technol., Part A, 2012, 53, 166–171 CAS.
- M. T. Harrison, A scoping trial of the effect of groundwater composition on short-term dissolution rates of Ca/Zn glasses, NNL, 2020, 15242(2), 1–33 Search PubMed.
- D. A. McKeown, I. S. Muller, A. C. Buechele and I. L. Pegg, J. Non-Cryst. Solids, 2000, 261, 155–162 CrossRef CAS.
- G. Lusvardi, G. Malavasi, L. Menabue, M. C. Menziani, U. Segre, M. M. Carnasciali and A. Ubaldini, J. Non-Cryst. Solids, 2004, 345–346, 710–714 CrossRef.
- N. J. Cassingham, M. C. Stennett, P. A. Bingham and N. C. Hyatt, Int. J. Appl. Glass Sci., 2011, 2, 343–353 CrossRef CAS.
- M. Le Grand, A. Y. Ramos, G. Calas, L. Galoisy, D. Ghaleb and F. Pacud, J. Mater. Res., 2000, 15, 2015–2019 CrossRef CAS.
- M. M. Smedskjaer, R. E. Youngman and J. C. Mauro, J. Non-Cryst. Solids, 2013, 381, 58–64 CrossRef CAS.
- D. Holland, B. G. Parkinson, M. M. Islam, A. Duddridge, J. M. Roderick, A. P. Howes and C. R. Scales, Appl. Magn. Reson., 2007, 32, 483–497 CrossRef CAS.
- G. Calas, L. Cormier, L. Galoisy and P. Jollivet, C. R. Chim, 2002, 5, 831–843 CrossRef CAS.
- S. Petrescu, M. Constantinescu, E. M. Anghel, I. Atkinson, M. Olteanu and M. Zaharescu, J. Non-Cryst. Solids, 2012, 358, 3280–3288 CrossRef CAS.
- J. C. Tait and C. D. Jensen, J. Non-Cryst. Solids, 1982, 49, 363–377 CrossRef CAS.
- R. A. Lewis, S. Myhra, R. L. Segall, R. S. T. C. Smart and P. S. Turner, J. Non-Cryst. Solids, 1982, 53, 229–313 CrossRef.
- G. Calestani, A. Montenero, E. Ferraguti, G. Ingeletto and M. Bettinelli, J. Non-Cryst. Solids, 1986, 84, 452–462 CrossRef CAS.
- G. Ennas, A. Musinu, G. Piccaluga, A. Montenero and G. Gnappi, J. Non-Cryst. Solids, 1990, 125, 181–185 CrossRef CAS.
- T. R. Stechert, M. J. D. Rushton and R. W. Grimes, J. Am. Ceram. Soc., 2013, 96, 1450–1455 CrossRef CAS.
- H. Zhang, C. L. Corkhill, P. G. Heath, R. J. Hand, M. C. Stennett and N. C. Hyatt, J. Nucl. Mater., 2015, 462, 321–328 CrossRef CAS.
- N. J. Cassingham, C. L. Corkhill, M. C. Stennett, R. J. Hand and N. C. Hyatt, J. Nucl. Mater., 2016, 479, 639–646 CrossRef CAS.
- E. R. Vance, D. J. Gregg, I. Karatchevtseva, G. J. Griffiths, K. Olufson, G. J. Rees and J. V. Hanna, J. Nucl. Mater., 2017, 494, 37–45 CrossRef CAS.
- S. Gin, P. Frugier, P. Jollivet, F. Bruguier and E. Curti, Int. J. Appl. Glass Sci., 2013, 4, 371–382 CrossRef CAS.
- H. Aréna, N. Godon, D. Rébiscoul, R. Podor, E. Garcés, M. Cabie and J.-P. Mestre, J. Nucl. Mater., 2016, 470, 55–67 CrossRef.
- A. J. Fisher, M. T. Harrison, N. C. Hyatt, R. J. Hand and C. L. Corkhill, MRS Adv., 2020, 5, 103–109 CrossRef CAS.
- G. D. Mea, A. Gasparotto, M. Bettinelli, A. Montenero and R. Scaglioni, J. Non-Cryst. Solids, 1990, 84, 443–451 Search PubMed.
- J. Wu and J. F. Stebbins, J. Non-Cryst. Solids, 2009, 355, 556–562 CrossRef CAS.
- T. Chave, P. Frugier, S. Gin and A. Ayral, Geochim. Cosmochim. Acta, 2011, 75, 4125–4139 CrossRef CAS.
- S. Mercardo-Depierre, F. Angeli, F. Frizon and S. Gin, J. Nucl. Mater., 2013, 441, 402–410 CrossRef.
- C. A. Utton, R. J. Hand, P. A. Bingham, N. C. Hyatt, S. W. Swanton and S. J. Williams, J. Nucl. Mater., 2013, 435, 112–122 CrossRef CAS.
- C. A. Utton, R. J. Hand, N. C. Hyatt, S. W. Swanton and S. J. Williams, J. Nucl. Mater., 2013, 442, 33–45 CrossRef CAS.
- C. L. Corkhill, N. J. Cassingham, P. G. Heath and N. C. Hyatt, Int. J. Appl. Glass Sci., 2013, 4, 341–356 CrossRef CAS.
- T. F. Kemp and M. E. Smith, Solid State Nucl. Magn. Reson., 2009, 35, 243–252 CrossRef CAS PubMed.
- B. Ravel and M. Newville, J. Synchrotron Radiat., 2005, 12, 537–541 CrossRef CAS PubMed.
- A. J. Fisher, Dissolution of UK Vitrified High-Level Radioactive Waste Containing Zinc and Calcium, PhD thesis, The University of Sheffield, 2021 Search PubMed.
- ASTM International. ASTM C1662-18: Standard Practice for Measurement of the Glass Dissolution Rate using the Single-Pass Flow-Through Test Method (SPFT), 2018.
- W. J. Dell, P. J. Bray and S. Z. Xiao, J. Non-Cryst. Solids, 1983, 58, 1–16 CrossRef CAS.
- L.-S. Du and J. F. Stebbins, J. Non-Cryst. Solids, 2005, 351, 3508–3520 CrossRef CAS.
- K. Janutcha, T. To, M. S. Bødker, T. Rouxel and M. M. Smedskjaer, J. Am. Ceram. Soc., 2018, 102, 4520–4537 CrossRef.
- G. Calas, L. Galoisy, L. Cormier, G. Ferlat and G. Lelong, Procedia Mater. Sci., 2014, 7, 23–31 CrossRef CAS.
- G. El-Damrawi, W. Mueller-Warmuth, H. Doweidar and I. A. Gohar, Phys. Chem. Glasses, 1993, 34, 52–60 CAS.
- L. Cormier, D. Ghaleb, J.-M. Delaye and G. Calas, Phys. Rev. B: Condens. Matter Mater. Phys., 2000, 61, 14495–14499 CrossRef CAS.
- T. Dumas and J. Petiau, J. Non-Cryst. Solids, 1986, 81, 201–210 CrossRef CAS.
- S. J. Louisnathan, Z. Kristallogr., 1969, 130, 427–437 CrossRef CAS.
- M. A. Simonov, P. A. Sadnomirskii, Y. U. K. Egorov Tismenko and N. V. Belov, Dokl. Akad. Nauk, 1977, 237, 581–588 CAS.
- K. H. Klaska, J. C. Eck and D. Pohl, Acta Crystallogr., Sect. B: Struct. Sci., 1978, B34, 3324–3325 CrossRef CAS.
- W. Helwig, E. Soignard and J. A. Tyburczy, J. Non-Cryst. Solids, 2016, 452, 312–319 CrossRef CAS.
- M. Goswami, G. P. Kothiyal, L. Montagne and L. Delevoye, J. Solid State Chem., 2008, 181, 269–275 CrossRef CAS.
- G. Engelhardt and D. Michel, High-resolution solid-state NMR of silicates and zeolites. Central Institute of Physical Chemistry, Academy of Science of the German Democratic Republic, Berlin & Department of Physics, Karl Marx University, Leipzig, German Democratic Republic, John Wiley & Sons, 1987, pp. 143–146 Search PubMed.
- J. G. Darab, J. C. Linehan and B. P. McGrail, Mater. Res. Soc. Symp. Proc., 1999, 337, 1 Search PubMed.
- J. G. Darab, X. Feng, J. C. Linehan and P. A. Smith, Composition-structure relationships in model Hanford low-level waste glasses, Environmental Issues and Waste Management Technologies. II–Ceramic Transactions, American Ceramic Society, Westerville, OH, 1997 Search PubMed.
- E. M. Pierce, L. R. Reed, W. J. Shaw, B. P. McGrail, J. P. Icenhower, C. F. Windisch, E. A. Cordova and J. Broady, Geochim. Cosmochim. Acta, 2010, 74, 2634–2654 CrossRef CAS.
- J. F. Stebbins, S. Kroeker, S. Keun Lee and T. J. Kiczenski, J. Non-Cryst. Solids, 2000, 275, 1–6 CrossRef CAS.
- B. G. Parkinson, D. Holland, M. E. Smith, A. P. Howes and C. R. Scales, J. Phys.: Condens. Matter, 2007, 19, 415114 CrossRef CAS PubMed.
- D. J. Backhouse, C. L. Corkhill, N. C. Hyatt and R. J. Hand, J. Non-Cryst. Solids, 2019, 512, 41–52 CrossRef CAS.
- R. J. Kirkpatrick, K. A. Smith, S. Schramm, G. Turner and W. H. Yang, Ann. Rev. Earth Planet. Sci., 1985, 13, 146–148 CrossRef.
- T. C. Kaspar, J. V. Ryan, C. G. Pantano, J. Rice, C. Trivelpiece, N. C. Hyatt, C. L. Corkhill, C. Mann., R. J. Hand, M. Kirkham., C. L. Crawford, C. M. Jantzen, J. Du., X. Lu, M. T. Harrison, C. Cushman, M. R. Linford and N. J. Smith, npj Mater. Degrad., 2019, 31, 15 CrossRef.
- S. Gin, P. Jollivet, M. Fournier, P. Frugier and T. Charpentier, Nat. Commun., 2015, 6, 6360 CrossRef CAS PubMed.
- F. Angeli, T. Charpentier, P. Jollivet, D. de Ligny, M. Bergler, A. Veber, S. Gin and H. Li, npj Mater. Degrad., 2018, 2, 31 CrossRef.
- J. J. Neeway, P. C. Rieke, B. P. Parruzot, J. V. Ryan and M. R. Asmussen, Geochim. Cosmochim. Acta, 2018, 226, 132–148 CrossRef CAS.
- D. J. Backhouse, A. J. Fisher, J. J. Neeway, C. L. Corkhill, N. C. Hyatt and R. J. Hand, npj Mater. Degrad., 2019, 2, 29 CrossRef.
- J. P. Icenhower, B. P. McGrail, W. J. Shaw, E. M. Pierce, P. Nachimuthu, D. K. Shuh, E. A. Rodriguez and J. L. Steele, Geochim. Cosmochim. Acta, 2008, 72, 2767–2788 CrossRef CAS.
- A. J. Fisher, N. C. Hyatt, R. J. Hand and C. L. Corkhill, MRS Adv., 2019, 4, 993–999 CrossRef CAS.
- C. M. Jantzen, K. G. Brown and J. B. Pickett, Int. J. Appl. Glass Sci., 2010, 1, 38–62 CrossRef CAS.
- N. C. Hyatt, C. L. Corkhill, M. C. Stennett, R. J. Hand, L. J. Gardner and C. L. Thorpe, IOP Conf. Ser. Mater. Sci. Eng., 2020, 818, 012022 CrossRef CAS.
Footnote |
| † Electronic supplementary information (ESI) available. See DOI: 10.1039/d1ma01029h |
| This journal is © The Royal Society of Chemistry 2022 |