
 Open Access Article
 This Open Access Article is licensed under a Creative Commons Attribution-Non Commercial 3.0 Unported Licence
Automated biophysical classification of apoptotic pancreatic cancer cell subpopulations by using machine learning approaches with impedance cytometry†
Carlos
Honrado
 a,
Armita
Salahi
a,
Sara J.
Adair
b,
John H.
Moore
a,
Todd W.
Bauer
b and
Nathan S.
Swami
*ac
a,
Armita
Salahi
a,
Sara J.
Adair
b,
John H.
Moore
a,
Todd W.
Bauer
b and
Nathan S.
Swami
*ac
aElectrical & Computer Engineering, University of Virginia, Charlottesville, USA. E-mail: nswami@virginia.edu
bSurgery, School of Medicine, University of Virginia, Charlottesville, USA
cChemistry, University of Virginia, Charlottesville, USA
First published on 23rd August 2022
Abstract
Unrestricted cell death can lead to an immunosuppressive tumor microenvironment, with dysregulated apoptotic signaling that causes resistance of pancreatic cancer cells to cytotoxic therapies. Hence, modulating cell death by distinguishing the progression of subpopulations under drug treatment from viable towards early apoptotic, late apoptotic, and necrotic states is of interest. While flow cytometry after fluorescent staining can monitor apoptosis with single-cell sensitivity, the background of non-viable cells within non-immortalized pancreatic tumors from xenografts can confound distinction of the intensity of each apoptotic state. Based on single-cell impedance cytometry of drug-treated pancreatic cancer cells that are obtained from tumor xenografts with differing levels of gemcitabine sensitivity, we identify the biophysical metrics that can distinguish and quantify cellular subpopulations at the early apoptotic versus late apoptotic and necrotic states, by using machine learning methods to train for the recognition of each phenotype. While supervised learning has previously been used for classification of datasets with known classes, our advancement is the utilization of optimal positive controls for each class, so that clustering by unsupervised learning and classification by supervised learning can occur on unknown datasets, without human interference or manual gating. In this manner, automated biophysical classification can be used to follow the progression of apoptotic states in each heterogeneous drug-treated sample, for developing drug treatments to modulate cancer cell death and advance longitudinal analysis to discern the emergence of drug resistant phenotypes.
Introduction
Programmed cell death by apoptosis1 serves a key role in the homeostasis of tissues2 and in cell clearance by phagocytes.3 The dysregulation of apoptotic signaling is a hallmark of diseases, such as cancer.4 Specifically in pancreatic cancer5 that is attributed to pancreatic ductal adenocarcinoma or PDAC, which is the third leading cause of cancer death6 and has a 5 year survival rate of less than 6%,7–9 molecular defects in apoptotic signaling cause resistance of cancer cells to cytotoxic therapies by reprogramming of the tumor microenvironment. For an overwhelming majority of patients with PDAC (80%) with a median survival duration of only 3–7 months,10 chemotherapy is the only option to control their disease and prolong survival. However, the highly fibrotic PDAC tumor microenvironment limits chemotherapy drug penetration,11 while efficacy of the drug is limited by mutations, stress responses and metabolic reprogramming in the cancer cells that lead to drug resistance. Given the limited time window for chemotherapy in PDAC, high sensitivity strategies for monitoring of cell phenotypes on physiologically relevant in vitro models or in vivo biopsies, to discern progression of drug-induced apoptotic responses can complement tumor imaging strategies. However, this is limited by the absence of reliable molecular markers of drug sensitivity and resistance,12 which motivates us to consider cellular biophysical metrics to identify apoptosis.13,14Drug-induced cell death by apoptosis and necrosis (including drug-regulated necroptosis or secondary necrosis), as well as drug resistance mechanisms cause characteristic cellular biophysical features.15 Apoptosis usually involves cell shrinkage, chromatin condensation and ruffling of plasma membrane,16 eventually leading to break-up of the cell into apoptotic bodies that are cleared by phagocytosis (Fig. 1A). For apoptosis in PDAC,17 the cell receptor mediated extrinsic pathway is enhanced by intrinsic pathways based on mitochondrial membrane permeabilization to release its proteins and on Ca2+ regulated alteration of the endoplasmic reticulum,5,18 all of which can alter electrical physiology of the cytoplasm. Drug-induced necrosis leads to swelling of organelles and disruption of plasma membrane, but it can be triggered by stimuli shared with extrinsic apoptosis.19,20 The morphological changes associated with drug resistance include the emergence of irregular cell shape in pancreatic cancer,21 larger and irregular-shaped cells of high nucleus to cytoplasm ratio in breast cancer,22,23 spindle-like shapes and diffusive plasma membrane shape24 in colon cancer HCT8 cells and elongated and irregular fibroblastoid morphology for drug-resistant ovarian cancer cells versus that of drug-sensitive cells.25
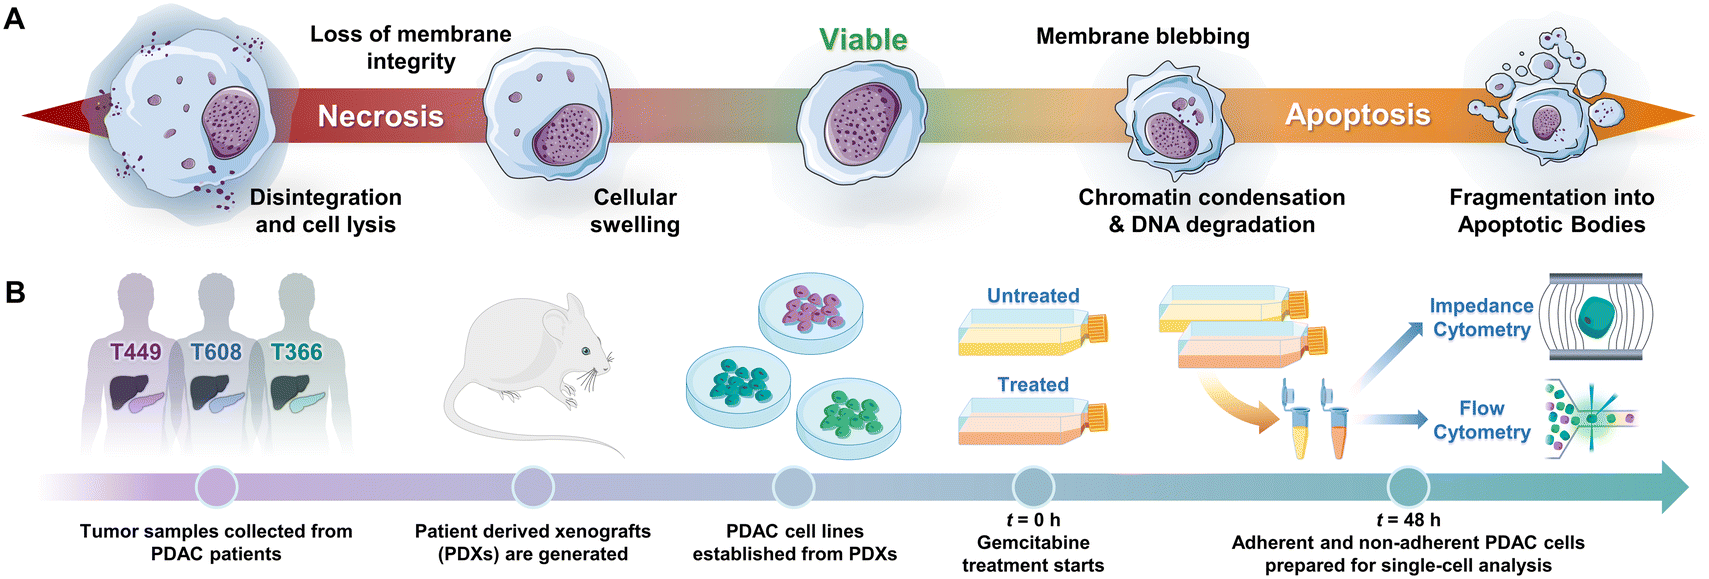 | ||
| Fig. 1 A – Biophysical cellular changes under apoptosis vs. necrosis. B – Experimental protocol to quantify progression of viable cells towards apoptotic and necrotic subpopulations by impedance cytometry of gemcitabine treated patient-derived PDAC cell types. | ||
Cell proliferation assays have traditionally guided in vitro drug sensitivity studies, but these cannot distinguish the cell death mechanism and they cannot be conducted with single-cell sensitivity to quantify the subpopulations in heterogeneous samples. Flow cytometry to quantify phosphatidylserine (PS) on the surface of cells by fluorescent staining with annexin V (AV) can follow apoptosis with single-cell sensitivity,4 while loss of viability under necroptosis can be followed by staining of permeable cells with dyes such as propidium iodide (PI) or DAPI. However, with non-immortalized pancreatic tumors from patient-derived xenografts (PDXs), the high background of non-viable cells in the untreated sample can confound early distinction of drug sensitivity after treatment. Additionally, since AV can be highly expressed by apoptotic cells due to PS exposed on the membrane outer leaflet, as well as by cells with compromised plasma membranes by dye penetration to stain PS naturally present on the membrane inner leaflet, there is the need for other more specific apoptotic markers. Furthermore, given the importance of modulating tumor cell death to prevent an inflammation-driven immunosuppressive microenvironment that is conducive to tumor recurrence,26 there is much interest in techniques capable of distinguishing the progression of apoptotic states, which is not easily accomplished by flow cytometry. Hence, we consider single-cell biophysical cytometry to explore the progression of cellular phenotypes from viable through to various apoptotic states (early to late), and onward to the necroptotic state.
Biophysical cytometry for label-free single cell analysis using electrical, mechanical, and imaging modalities can potentially complement the biochemical information on expression profiles of cell markers obtained from flow cytometry after fluorescent staining. However, biophysical cytometry has typically yielded data of low dimensionality and requires computationally intensive strategies to process data on low event numbers, which has limited its application.27 Impedance cytometry28–30 is an emerging non-invasive, sensitive, and high throughput (300–400 events per s) technique that can provide multiparametric biophysical information, based on disruptions to the magnitude and phase of alternating current flow by single cells or subcellular particles in a microchannel that is followed simultaneously over several frequencies in the 0.5 to 50 MHz range. In this manner, biophysical phenotypes associated with apoptosis or necroptosis, such as shrinkage or swelling can be discerned based on cellular electrical size at low frequency (∼0.5 MHz), while membrane features, ruffles or permeabilization can be discerned based on membrane conductance and capacitance at mid-frequencies (2–10 MHz), and features in the cell interior due to the endoplasmic reticulum, mitochondria, or nucleus can be followed at high frequencies (≥10 MHz) based on the interior conductivity and nucleus to cell size ratio.31 Using size-controlled co-flowing insulating beads for data normalization,32 impedance magnitude (|Z|) and phase (ϕZ) metrics can be quantified and compared across different biological samples over multiple frequencies, so that the dispersions can provide multiparametric information on cell phenotypes.33,34 Furthermore, the frequency spectra of single-cell impedance phenotypes can be fit to dielectric shell models to obtain a biophysical picture to identify each cell type in a heterogeneous sample and gauge the myriad subcellular alterations over a spectrum of drug-induced transformations.35 Prior dielectric approaches have recognized the cell death mechanism,36 trapped specific cells for molecular analysis,37 and classified their drug-induced transformations within the viable, necrotic, and apoptotic categories,38 but subpopulations over the progression of apoptotic alterations were not quantified. Furthermore, quantification of the subpopulations was by manual gating strategies, which is limited by overlap of the respective data clusters, motivating the consideration of automated strategies for impedance data classification. Recent reports have explored automation of impedance-based phenotypic classification, including application of k-means algorithm-based clustering of subpopulations of peripheral blood mononuclear cells,39 support vector machine (SVM) to classify live vs. dead breast cancer cells,40 SVM classifier to quantify eight groups of pollen grains,41 and neural networks to classify different cell types.42,43
Our advancement over this work is the development of optimal positive controls for each cellular phenotypic class over the progression of apoptotic states, so that clustering by unsupervised learning and classification by supervised learning can occur on unknown datasets of heterogeneous cellular systems with closely related and evolving phenotypes. As a result, the relationships between various cellular biophysical metrics, which cannot be easily determined using a standard 1-, 2- or 3-dimensional analysis, can be utilized at a hyperdimensional level to cluster and classify subpopulations in an automated manner. These biophysical metrics can then be utilized for quantifying the drug sensitive phenotypes of cancer cells over the progression of viable, early apoptotic, late apoptotic, and necrotic subpopulations, as obtained through impedance cytometry of pancreatic tumor PDXs under gemcitabine treatment. To validate our automated classification of impedance cytometry data, we compare against flow cytometry after staining for AV and Zombie Near-Infrared (ZNIR; a dye permeable to cells with compromised membranes) to quantify apoptotic and necrotic subpopulations, respectively, while utilizing PDXs with differing degrees of gemcitabine sensitivity to compare the relative proportions at the early apoptotic versus late apoptotic and necrotic stages (Fig. 1B). While machine learning-based classification of impedance cytometry data clusters compares well against flow cytometry for quantification of apoptotic versus necrotic and live cell phenotypes, we infer that impedance cytometry is especially well suited towards discerning the relative intensity of onset of apoptosis, by distinguishing the early versus late apoptosis and necrosis states. Given the importance of modulating cancer cell death for preventing an immunosuppressive tumor microenvironment and the need for label-free tools to repeatedly analyze the same sample to discern drug resistant phenotypes, we envision a key role for ML-based classification of impedance data clusters in following the progression of drug-induced apoptotic phenotypes based on biophysical metrics. The described ML-based procedure for elucidation of the characteristic cellular biophysical metrics will also advance the ability for inline identification and tracking of cell phenotypes in microfluidic devices, to guide the design of phenotype-selective cell isolation systems.
Results
Challenges to discerning the progression of apoptotic states
Patient-derived PDAC tumors MAD 14-449, 08-608 and 09-366, referred to as: T449, T608 and T366, respectively, were enlarged in mice as xenografts.44,45 Gemcitabine is a chemotherapeutic drug for PDAC that inhibits cellular DNA synthesis, leading to fragmentation of DNA and expression of genes that induce the cell death by apoptosis.46 Cell proliferation assays were used to screen the gemcitabine sensitivity in each PDAC cell type (T449 PDX in Fig. 2A and all other cell types in ESI† Fig. S1) using varying levels (0.01, 0.1 and 1 μg mL−1) for different exposure periods (24, 48 and 96 h), with each untreated control maintained in complete medium for the same durations. Cell numbers were estimated using a DNA intercalating fluorescent dye to calculate the % cell proliferation by comparing fluorescence of treated vs. untreated cultures.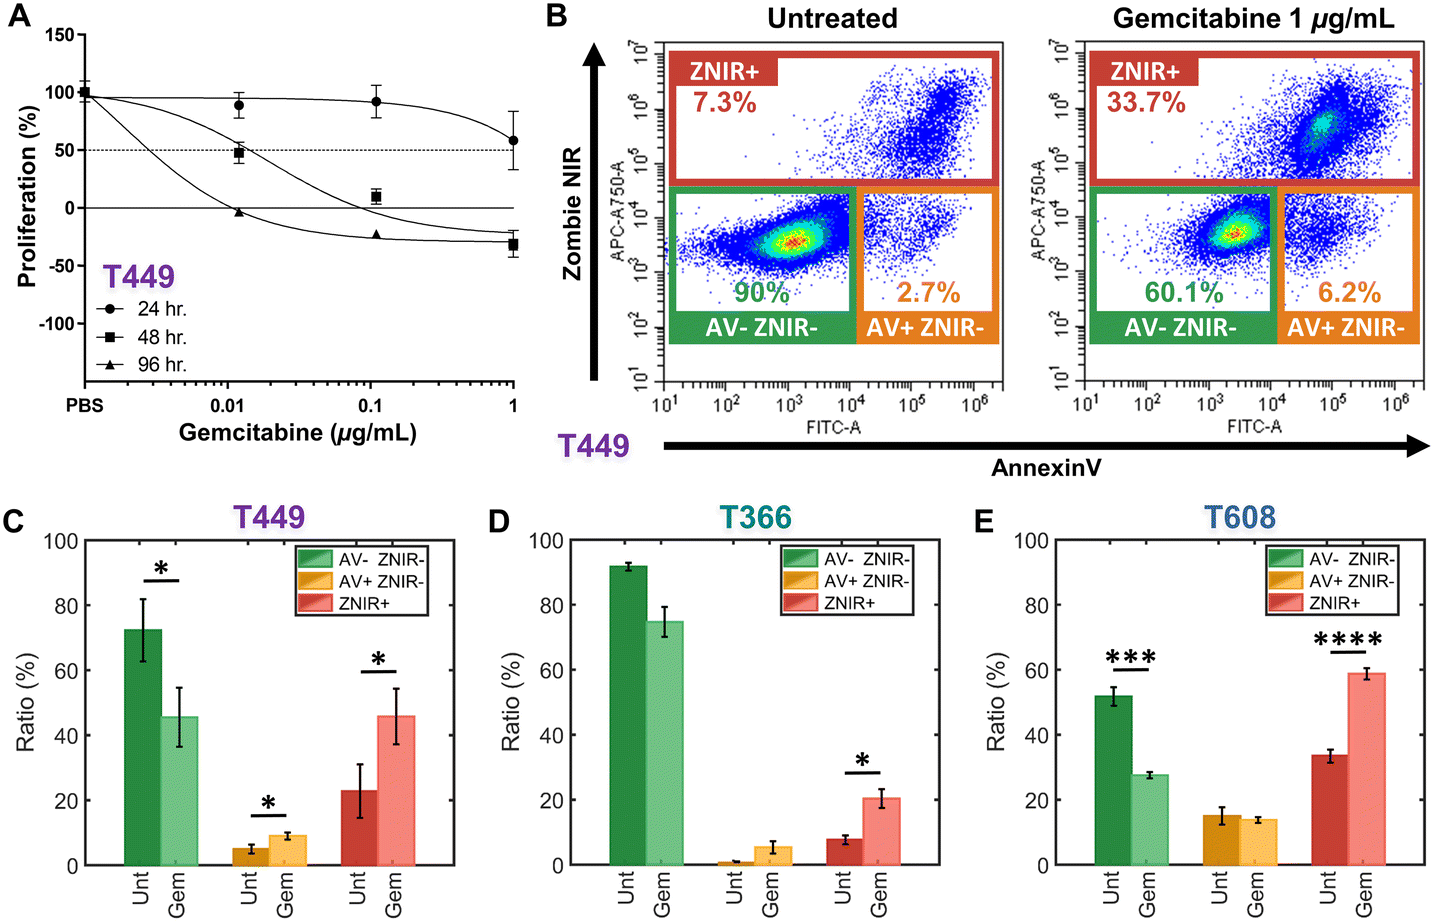 | ||
| Fig. 2 A – Proliferation assays to screen drug sensitivity of PDAC cell types (T449 here and others in ESI†) at varying gemcitabine levels (0.01, 0.1, and 1 μg mL−1) for: 24 h (circle), 48 h (square) and 96 h (triangle). Proliferation (%) is calculated as the relative proliferation under each treated condition compared with untreated for each exposure period and gemcitabine concentration. B – Flow cytometry density scatter plots of annexin V (AV) versus Zombie Near-Infrared (ZNIR) for an untreated control and a gemcitabine treated T449 sample (1 μg mL−1) for 48 h. Subpopulation ratios for gated AV-ZNIR- (viable cells), AV+ZNIR- (apoptotic cells) and ZNIR+ (non-viable cells) for PDAC types T449 (C), T366 (D) and T608 (E). | ||
In this manner, the variations in % proliferation permit classification of the drug sensitivity for each cell type. For T449 and T608 PDXs, treatments at 0.1 or 1 μg mL−1 for 48 h are sufficient to sharply reduce the proliferation to ∼0% or less, indicating their sensitivity to gemcitabine. Moreover, the decrease in cell proliferation for T608 PDXs after 24 h of gemcitabine treatment at 0.1 or 1 μg mL−1 levels, indicates that this cell type is the most sensitive of those in this study. In contrast, T366 PDXs are the most resistant cell type, with no perceptible decrease in cell proliferation below the ∼50% mark, even after the longest drug exposure (96 h) at the highest concentration of this study (1 μg mL−1).
The effect of gemcitabine on each PDAC cell type was measured by flow cytometry to classify apoptotic and necrotic populations, after staining cells with annexin V (AV) to measure phosphatidylserine (PS) as an apoptotic marker47 and with Zombie Near-Infrared (ZNIR) as a cell viability dye to measure membrane integrity and function. The observed subpopulations with fluorescence include (Fig. 2B): AV-ZNIR- events that signify viable cells with an intact membrane and no apoptotic signal, AV+ZNIR- events that signify early apoptotic cells with an uncompromised membrane, and ZNIR+ events that signify non-viable cells with a permeabilized membrane. Based on this, the dose of gemcitabine treatment at 1 μg mL−1 for 48 h for each PDAC cell type is used to quantify the proportions within each of the three subpopulations (Fig. 2C–E). Comparing the untreated control (Unt) and the gemcitabine treated (Gem) samples, the drug sensitive cell types (T449 and T609 PDXs) show a significant reduction (*p < 0.05 and ***p < 0.001, respectively) in the viable fraction (AV-ZNIR-). This occurs as the ratio of apoptotic cells (AV+ZNIR-) increases significantly (*p < 0.05) for T449, and the ratio of non-viable cells (ZNIR+) also increases significantly for T449 and T608 (*p < 0.05 and ****p < 0.0001, respectively). For the drug resistant cell line (T366), there is no significant reduction (p = 0.0598) in ratio of the viable subpopulation, with only a significant (*p < 0.05) increase in the proportion of non-viable cells, likely due to a baseline level of drug sensitivity (apparent in the proliferation studies – ESI† Fig. S1). In general, non-immortalized cells of low passage number that are derived from a primary patient for generating the xenograft renders them to be much more sensitive to in vitro culture conditions, thereby increasing loss of viability over the drug treatment time frame. However, based on the low level of AV+ZNIR- fractions in the control samples and the obvious change in ZNIR+ fractions post-treatment, we can confirm that the onset of apoptosis can be studied after gemcitabine treatment at 1 μg mL−1 for 48 h. It is noteworthy that the ZNIR+ events in this flow cytometry protocol cannot discern the cell proportions at the necrotic state versus those progressing onward from late-stage apoptosis, since AV is highly expressed by apoptotic cells (due to PS on the membrane outer leaflet) and by non-viable cells with compromised membranes (due to PS on the membrane inner leaflet). Hence, we consider biophysical cytometry methods to distinguish phenotypes over the progression of apoptotic states.
Impedance cytometry identifies progression of apoptotic states
The importance of modulating drug action on the tumor to prevent an immunosuppressive microenvironment highlights the need for tools to identify and quantify cellular subpopulations over the progression of apoptotic states and distinguish them versus their progression to the necrotic state.48,49 Specifically, we consider the sensitivity of impedance cytometry for detecting successive degrees of biophysical alterations associated with apoptosis,50,51 that is characterized by cellular shrinkage, plasma membrane blebbing, the mitochondrial markers and the condensation of chromatin. In the absence of phagocytic clearance,52 this gradually progresses to the loss of membrane integrity (also known as “secondary necrosis”); similar to alterations by necrosis,53 that cause cell swelling, loss of plasma membrane integrity, organelle swelling, lysosomal leakage and degradation of the DNA. To create “positive” controls for the respective apoptotic and necrotic subpopulations, we adapted the work from Selzner et al.54 on a series of hypotonic treatments to control the progression of apoptotic states. Specifically, PDAC T449 cells were exposed to deionized (DI) water to release ATP due to cell swelling and enable selective binding to ATP-P2 receptors, so that this purinergic signaling triggers apoptosis due to the activation of different pro-apoptotic proteins. Critically, the cells exposed to DI water are returned to complete medium to allow a recovery or resting period for triggering apoptosis, with the exposure times (in DI) and resting periods (in culture media) varied to create the progression of apoptotic states.Flow cytometry measurements on the T449 PDXs exposed to the varying hypotonic conditions confirm generation of the respective subpopulations progressing from viable (AV-ZNIR- events in (i)) to apoptotic (AV+ZNIR- events in (ii–iv)) to necrotic states (ZNIR+ events in (v)) – Fig. 3A and ESI† Fig. S2. Compared to the predominantly viable cells of the untreated control (>95% AV-ZNIR- events; Fig. 3Ai), cells exposed to hypotonic conditions for 2 min and cultured for 4.5 h (Fig. 3Aii) exhibit high levels of AV staining, but without much change in ZNIR expression. In fact, the proportion of cells in the early apoptotic state (AV+ZNIR-) exhibits a sharp rise from just ∼2.3% in the viable control to >50% after hypotonic treatment. With the same 2 min hypotonic treatment that is maintained for a longer resting period in culture (12 h in Fig. 3Aiii), the early apoptotic fraction is now reduced to ∼21%, while the non-viable fraction (ZNIR+) increases from ∼7% (Fig. 3Aii) to ∼27% (Fig. 3Aiii). This suggests that the ZNIR+ events are likely associated with the continued progression of apoptosis, as expected for higher dose hypotonic treatments,54 rather than to cells in the necrotic state.
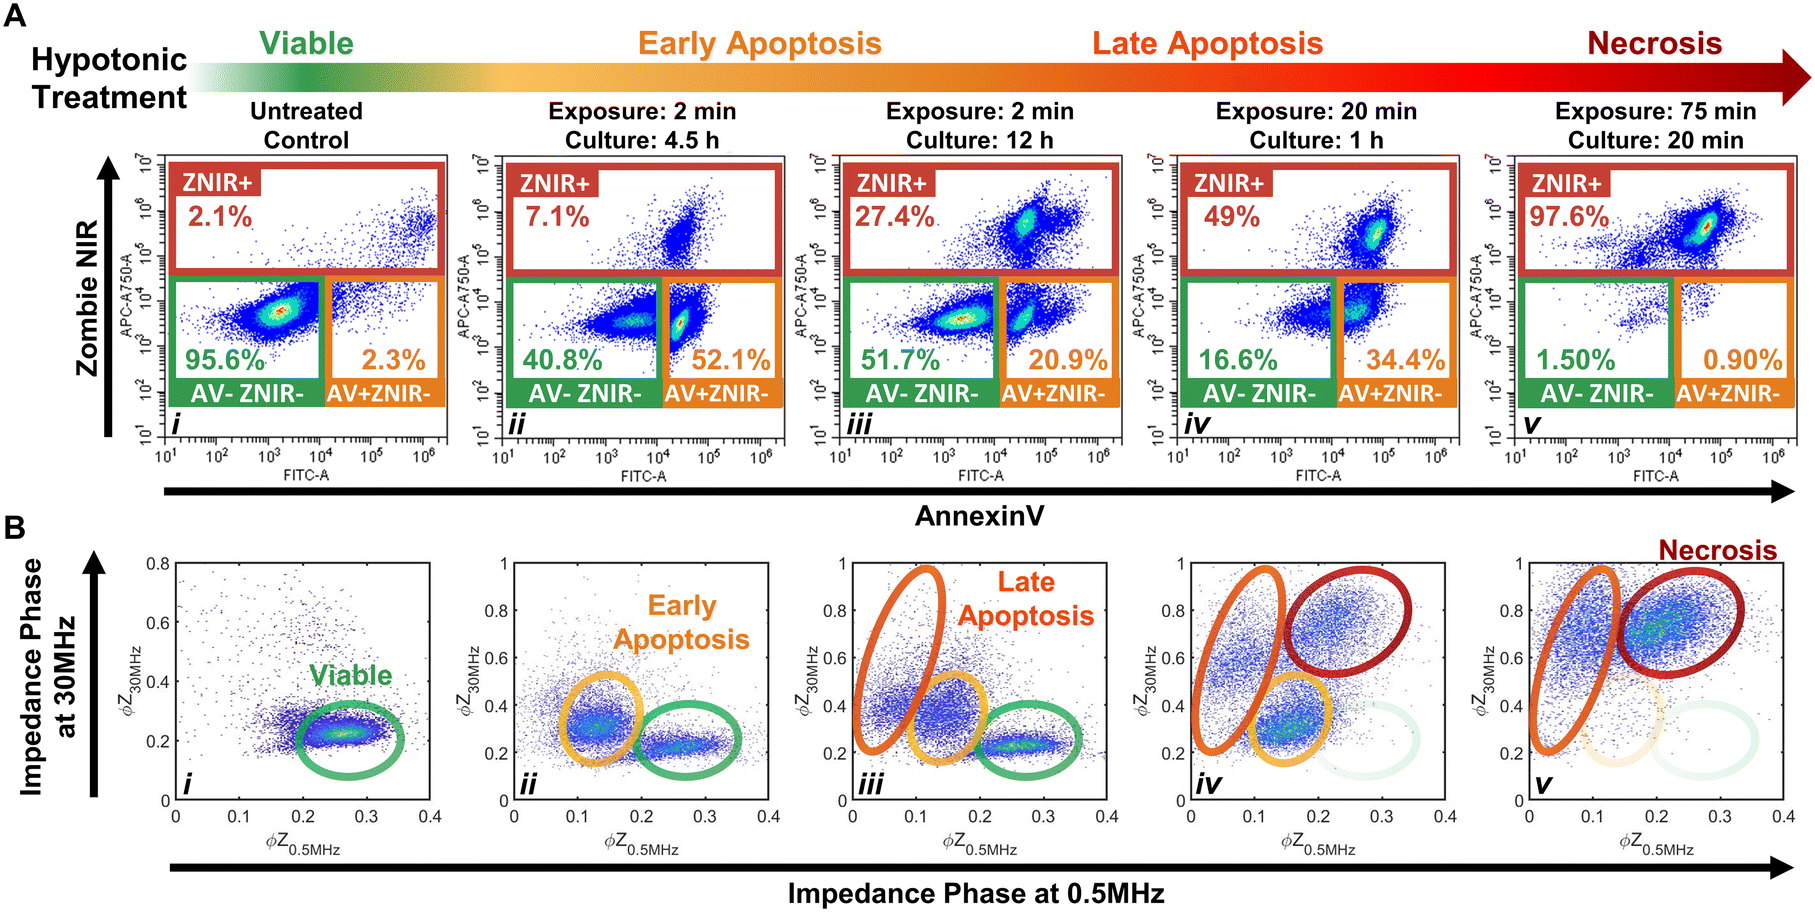 | ||
| Fig. 3 Hypotonic treatment on PDAC T449 to generate positive control subpopulations across the viable (i) to apoptotic (ii–iv) and necrotic (v) progression. A – Density scatter plots of annexin V (AV) versus Zombie Near-Infrared (ZNIR) show that exposing cell cultures to DI water for increasing periods of time induces cells towards apoptosis and necrosis pathways. B – Density scatter plots of impedance phase at 0.5 MHz (ϕZ0.5 MHz) versus impedance phase at 30 MHz (ϕZ30 MHz) show characteristic impedance data clusters corresponding to the respective subpopulations across the viable to apoptotic and necrotic progression for the cell cultures exposed to hypotonic conditions. | ||
Upon increasing the hypotonic exposure to 20 min, but with a shorter resting period (1 h), the proportion of ZNIR+ cells further increase to ∼50%, with the ZNIR- cells presenting clear shifts towards high AV staining (Fig. 3Aiv and S2Aiv†). Finally, upon exposure to a very long hypotonic treatment of 75 min (Fig. 3Av), the great majority of cells (>97%) are found within the non-viable gate, due to necrosis. Hence, we infer that PDAC cells will initiate apoptosis after a short hypotonic dose (AV+ZNIR- events) and that a severe hypotonic dose compromises the membrane (ZNIR+ events), but the intermediate hypotonic doses to advance progression of apoptosis presents the traditional hallmarks of both apoptosis (AV+ZNIR- events) and necrosis (ZNIR+ events). This limits the ability of flow cytometry to distinguish late apoptotic and necrotic cells for quantifying the subpopulations at different apoptotic states.
Multifrequency impedance cytometry of PDAC cells after the same hypotonic treatments was carried out to measure the biophysical phenotypes associated with the respective apoptotic subpopulations (Fig. 3B). Since an intact lipid cell membrane screens the AC field at low frequencies in media of high conductivity (e.g., 1× PBS) to cause insulator-like behavior, the impedance magnitude and phase at 0.5 MHz (|Z0.5 MHz| & ϕZ0.5 MHz) can be used to evaluate alterations in cell size and membrane integrity.30 With increasing frequencies, the capacitive coupling across the cell membrane renders cells to become more conductive, so that at a high enough frequency (e.g., 30 MHz), cell impedance is effectively dominated by the dielectric properties of the cell interior.30 Hence, the impedance phase at 30 MHz (ϕZ30 MHz) can be used to evaluate alterations in electrical physiology of the cell interior. Using co-flowing polystyrene beads (7 μm), the impedance data of cells with conductive interior contents can be gated versus standard-sized beads with insulative contents for normalization to enable quantitative comparison across biological samples and their experimental conditions. Based on this, we analyze the events from individual cells using a plot of normalized impedance phase at low (ϕZ0.5 MHz) versus high (ϕZ30 MHz) frequency. In this plot, viable cells can be delineated by the region of high ϕZ0.5 MHz and low ϕZ30 MHz (Fig. 3Bi), since the cells have an intact plasma membrane that shields the electric field from the cell interior. Following the first hypotonic treatment, a second cluster of events with a lower ϕZ0.5 MHz and somewhat higher ϕZ30 MHzversus the viable population is apparent (Fig. 3Bii). We attribute this cluster to the early apoptotic subpopulation, as previously determined by flow cytometry in the AV+ZNIR- gate (Fig. 3Aii). Characteristic biophysical traits of apoptotic cells, such as size shrinkage that reduces electric field screening would lower ϕZ0.5 MHz, as observed within this data cluster versus the viable population. Similarly, biophysical traits of the interior of apoptotic cells, such as Ca2+ regulated alterations to the endoplasmic reticulum or chromatin condensation to enhance the conductivity of the cell interior would increase ϕZ30 MHz, as observed within this data cluster versus the viable population. Following the second set of hypotonic treatments, an additional cluster of impedance events at even lower ϕZ0.5 MHz and higher increasing ϕZ30 MHz are apparent (Fig. 3Biii). Under the harsher hypotonic treatments, the event numbers in this cluster increase in correlation with decrease in the number of events in the apoptotic gate (Fig. 3Biii–Bv), leading us to attribute the cluster with lowest ϕZ0.5 MHz levels to cells in the late apoptotic stage. This phenotype is likely associated with the disassembly process that is characterized by size reduction, shedding of apoptotic bodies, membrane morphology alterations and interior re-organization. A smaller size and compromised membrane (as part of “secondary necrosis”) would cause further lowering of ϕZ0.5 MHz, while nuclear degradation, organelle fragmentation and a degree of intracellular ionic exchange with the highly conductive buffer would explain the increasing ϕZ30 MHz. After the harshest hypotonic treatments studied herein, another data cluster emerges that is attributed to the necrotic subpopulation (Fig. 3Biv and Bv). The ϕZ0.5 MHz level of this necrotic subpopulation is lower than that of viable cells, but higher than that of late apoptotic cells, while the ϕZ30 MHz level is the highest amongst all the studied subpopulations. We suggest that cellular swelling in necrotic cells likely increases the ϕZ0.5 MHz level for this subpopulation versus cells in the late apoptotic stage, with its permeabilized membrane reducing the ϕZ0.5 MHzversus viable cells, while the higher ϕZ30 MHz is associated with an increase in internal conductivity due to the uncontrolled intake of ions from the conductive buffer in the absence of cell clearance by phagocytosis.
Considering the differences between flow (Fig. 3Aiv) and impedance cytometry (Fig. 3Biv) after the 20 min hypotonic treatment, while flow cytometry indicates that ∼17% of cells remain within the viable gate (AV-ZNIR-) and a majority of these cells exhibit a high level of AV staining that is almost indistinguishable from cells within the early apoptotic gate (AV+ZNIR-), impedance cytometry shows virtually no cells in the region associated with viable cells and a large cluster attributed to cells in the early apoptotic state. This suggests that the cells within the viable gate of the flow cytometry data (Fig. 3Aiv) that are initiated into apoptosis based on a degree of AV expression, do not reach the threshold level of AV expression to locate the cells within the AV+ZNIR- gate. In contrast, for impedance cytometry, since the ϕZ0.5 MHz level is sensitive to alterations in cell size and membrane conformation, it can be used to detect cells transitioning out from the viable state into the early apoptotic phenotype due to the respective hypotonic treatment. Impedance cytometry can also differentiate cells in the late apoptotic versus necrotic states, as independent data clusters (Fig. 3Biv and Bv), whereas they occur as a single data cluster of non-viable cells in flow cytometry (ZNIR+ events in Fig. 3Aiv and Av). As a result, we anticipate some divergences between the respective techniques in classifying and quantifying subpopulations in the viable and early apoptotic gates. In summary, through appropriate choice of frequency and impedance metrics, biophysical properties can be used to detect the progression of viable cells towards early and late apoptotic states, while distinguishing these subpopulations versus necrotic cells, but label-based flow cytometry methods that are reliant on the degree of PS staining for AV expression are not able to independently gate these phenotypes.
Automated clustering to identify subpopulations
Following the identification of viable, early apoptotic, late apoptotic, and necrotic subpopulations after hypotonic treatment based on their electrical physiology that creates distinct data clusters within the ϕZ0.5 MHzvs. ϕZ30 MHz plot, this information is used to quantify proportions of the respective subpopulations after gemcitabine treatment of different PDAC cell types. The key assumption is that cells will present the same biophysical phenotype at any given apoptotic or necrotic stage, regardless of what triggered this response (hypotonic or drug treatment), which is confirmed by our flow cytometry data after annexin V and ZNIR staining. Rather than manual gates on 2D plots to delineate each cluster for quantifying each subpopulation, which adds uncertainty, we utilize dispersion of the data on a multidimensional level by using impedance magnitude and phase metrics over multiple frequencies. This holistic clustering approach is based on unsupervised machine learning methods to automate clustering of data (Fig. 4A) that relies on the specific dispersion of each subpopulation cluster to calculate and catalogue each event within a specific cluster.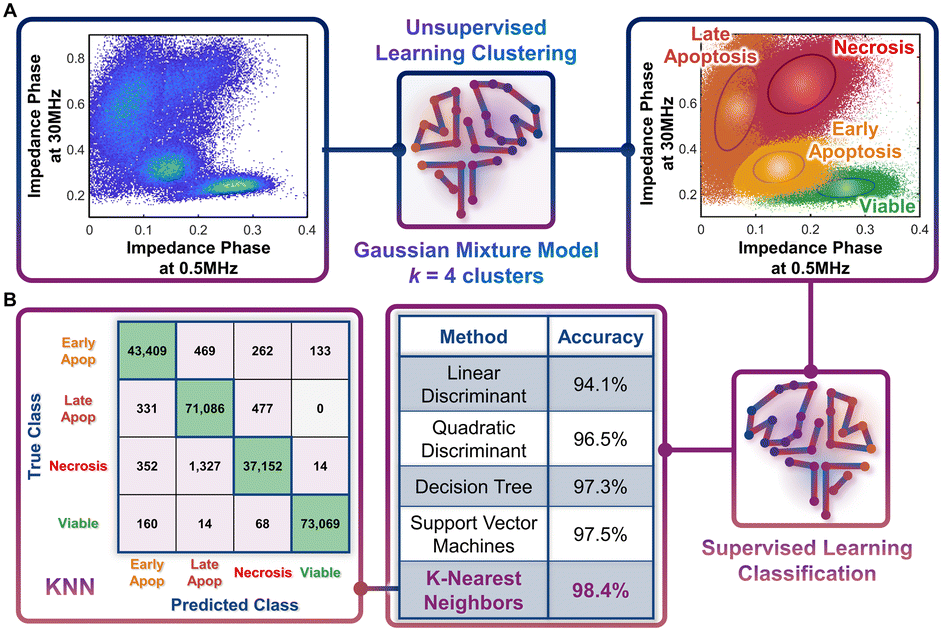 | ||
| Fig. 4 Machine learning strategies. A. Unsupervised learning clustering, and B. Supervised learning classification. A – Density scatter plot of ϕZ0.5 MHzversus ϕZ30 MHz for merged data from the different hypotonic treatment samples were processed by the Gaussian mixture model (GMM), with k = 4 clusters, to identify various subpopulations across the viable to apoptotic and necrotic progression. B – Utilizing the clustered data, various classification methods were tested, with K-nearest neighbors (KNN) presenting the highest accuracy. The confusion matrix for the KNN method shows how the optimal model accurately classifies data. | ||
Based on the type of dispersions observed in the data, we explore the application of a Gaussian mixture model (GMM) for the clustering. GMM algorithms rely on the calculation of probabilities to define the likelihood of a given event to be part of each cluster, so that it is assigned at the end of the algorithm to the cluster with highest probability. As with most unsupervised learning algorithms, GMM requires as input a starting k number of clusters to be identified in the data. Since we observe four data clusters associated with viable, early apoptotic, late apoptotic, and necrotic subpopulations, we assume k = 4. Also, GMM assumes that the cluster dispersions follow Gaussian distributions, which seems consistent to our observations (Fig. 3B). Impedance cytometry data acquired for the T449 PDAC cell line from each hypotonic treatment are merged, so that the four subpopulations are present in the analyzed dataset (Fig. 4A). The metrics of ϕZ0.5 MHz, ϕZ2 MHz and ϕZ30 MHz were used to provide the algorithm with multiparametric information that covers the electrical physiology for cell size (0.5 MHz), membrane integrity (2 MHz) and interior composition (30 MHz). Using this multi-parametric dataset, it is apparent that the GMM algorithm can identify the 4 expected clusters in the data (Fig. 4A – right). In fact, manual gating of the 4 clusters using the plot of ϕZ0.5 MHzversus ϕZ30 MHz (ESI† Fig. S3A), shows a degree of overlap, with a sharp transition between the subpopulations (ESI† Fig. S3B and C) that no longer represents normal distributions of subpopulations. In comparison, the multiparametric assessment used with the GMM algorithm provides a holistic measure of the data dispersion, enabling improved identification of each subpopulation and a true representation of each subpopulation distribution across multiple parameters (ESI† Fig. S3D–F).
Automated classification by supervised learning
The characteristic electrical physiology based on biophysical properties of the four subpopulations (viable, early apoptotic, late apoptotic, and necrotic) is used to assess gemcitabine treated PDAC cell types using supervised machine learning strategies. Supervised learning methods can be used to perform classification tasks of datasets by cataloguing individual events based on their multiple properties. This classification process is reliant on a training step, wherein the algorithm is provided with a known dataset for “learning” the combination of properties that is characteristic of each class present in the data. After the training step, the developed algorithm is tested to assess its overall accuracy. If the algorithm provides a high accuracy, it can then be implemented on unknown datasets, if they share the same list of properties and expected classes. Hence, using the data acquired based on the different hypotonic treatments and the classified clusters identified by the GMM algorithm, we tested different supervised learning algorithms to identify the optimal one for implementation on impedance cytometry data acquired after gemcitabine treatment (Fig. 4B). Each of the tested algorithms provided an accuracy of at least 94%, with the optimal one being the K-nearest neighbors (KNN) algorithm (K = 10; accuracy = 98.4%). In this algorithm, an hyperdimensional distance is calculated between each unknown event and its K nearest neighbors from the known dataset, with the event being classified according to the class with the higher number of K neighbors. With enough iterations performed during the training stage, it is eventually possible to identify the set of properties and conditions that define the hyperparametric boundaries between each class. Hence, for every new unknown event, the KNN algorithm attributes a class to that event, permitting an automated classification process. The high accuracy of the KNN algorithm can be confirmed by analyzing its confusion matrix. In this matrix, it is possible to observe what were the predicted classes from the algorithm versus the true classes. It is apparent that for most cases, the algorithm correctly classified each event. It is also interesting to note that most errors in classification arise due to misclassification of subpopulations that exhibit a high degree of phenotypic similarity. For instance, there are 0 true “late apoptotic” events that are predicted to be “viable” events, and only 14 events that were predicted to be “late apoptotic” that were in fact “viable” events, since these subpopulation types are clearly distinguishable in phenotype. The capability of the KNN algorithm to identify this difference is a good example of its accuracy and gives us confidence in implementation of this specific strategy to drug treated PDAC samples.Quantifying the progression of apoptotic subpopulations
The trained KNN algorithm is then implemented on impedance cytometry data obtained from untreated and gemcitabine treated PDAC cells (Fig. 5), utilizing cell types with differing drug sensitivity (Fig. 2). For all samples, the four subpopulations are apparent (Fig. 5A), albeit at differing ratios (Fig. 5B). The variations in ratios between the untreated and gemcitabine-treated samples follow the previously determined degrees of sensitivity for each cell line (Fig. 2). Specifically, it is possible to confirm that both T449 and T608 are gemcitabine sensitive cell types, presenting significant reductions in their viable fraction (**p < 0.01 & ****p < 0.0001, respect), accompanied by significant increases in their early apoptotic (*p < 0.05 & ***p < 0.001, respectively) and late apoptotic fractions (*p < 0.05 & ****p < 0.0001, respectively). For T608 PDXs, there is also a significant increase in the necrotic fraction (*p < 0.05), which we attribute to the lower baseline for their viability, even in the absence of gemcitabine treatment. There are also some noteworthy trends correlating the impedance cytometry and flow cytometry results (Fig. 2C–E). For T449, the observed significant increase in the ZNIR+ events within the flow cytometry data can be correlated to the data cluster in impedance cytometry data associated with the late apoptotic, rather than the necrotic subpopulation. For T608, we infer that the sharp increase in the proportion of ZNIR+ events in flow cytometry data is closely associated with the significant increase in the late apoptotic fraction determined from impedance cytometry data. For T366, there are no significant decreases in the viable fractions, with the only significant increase (*p < 0.05) occurring for the late apoptotic ratio with gemcitabine treatment. This small increase was also observed in the flow cytometry data (Fig. 2D), but it was associated with an increase (*p < 0.05) in the ZNIR+ sub-population. Hence, T366 is the most resistant cell line among the tested ones, with only a small portion of the cells undergoing gemcitabine-induced apoptosis. The direct comparison between the estimated ratios for each cell line can be found in Fig. 5C. The ratios of late apoptotic and necrotic subpopulations from impedance cytometry were merged to allow for comparison with flow cytometry ZNIR+ subpopulations. While the estimated subpopulation ratios between flow and ML-based impedance cytometry show a degree of similarity (Fig. 5C), the mismatches occur in the situations wherein cell events transition between the flow cytometry gates, as anticipated previously (Fig. 3). These results highlight the ability for automated classification of the drug-induced phenotypes by using machine learning to follow the electrical physiology of PDAC cells under drug treatment.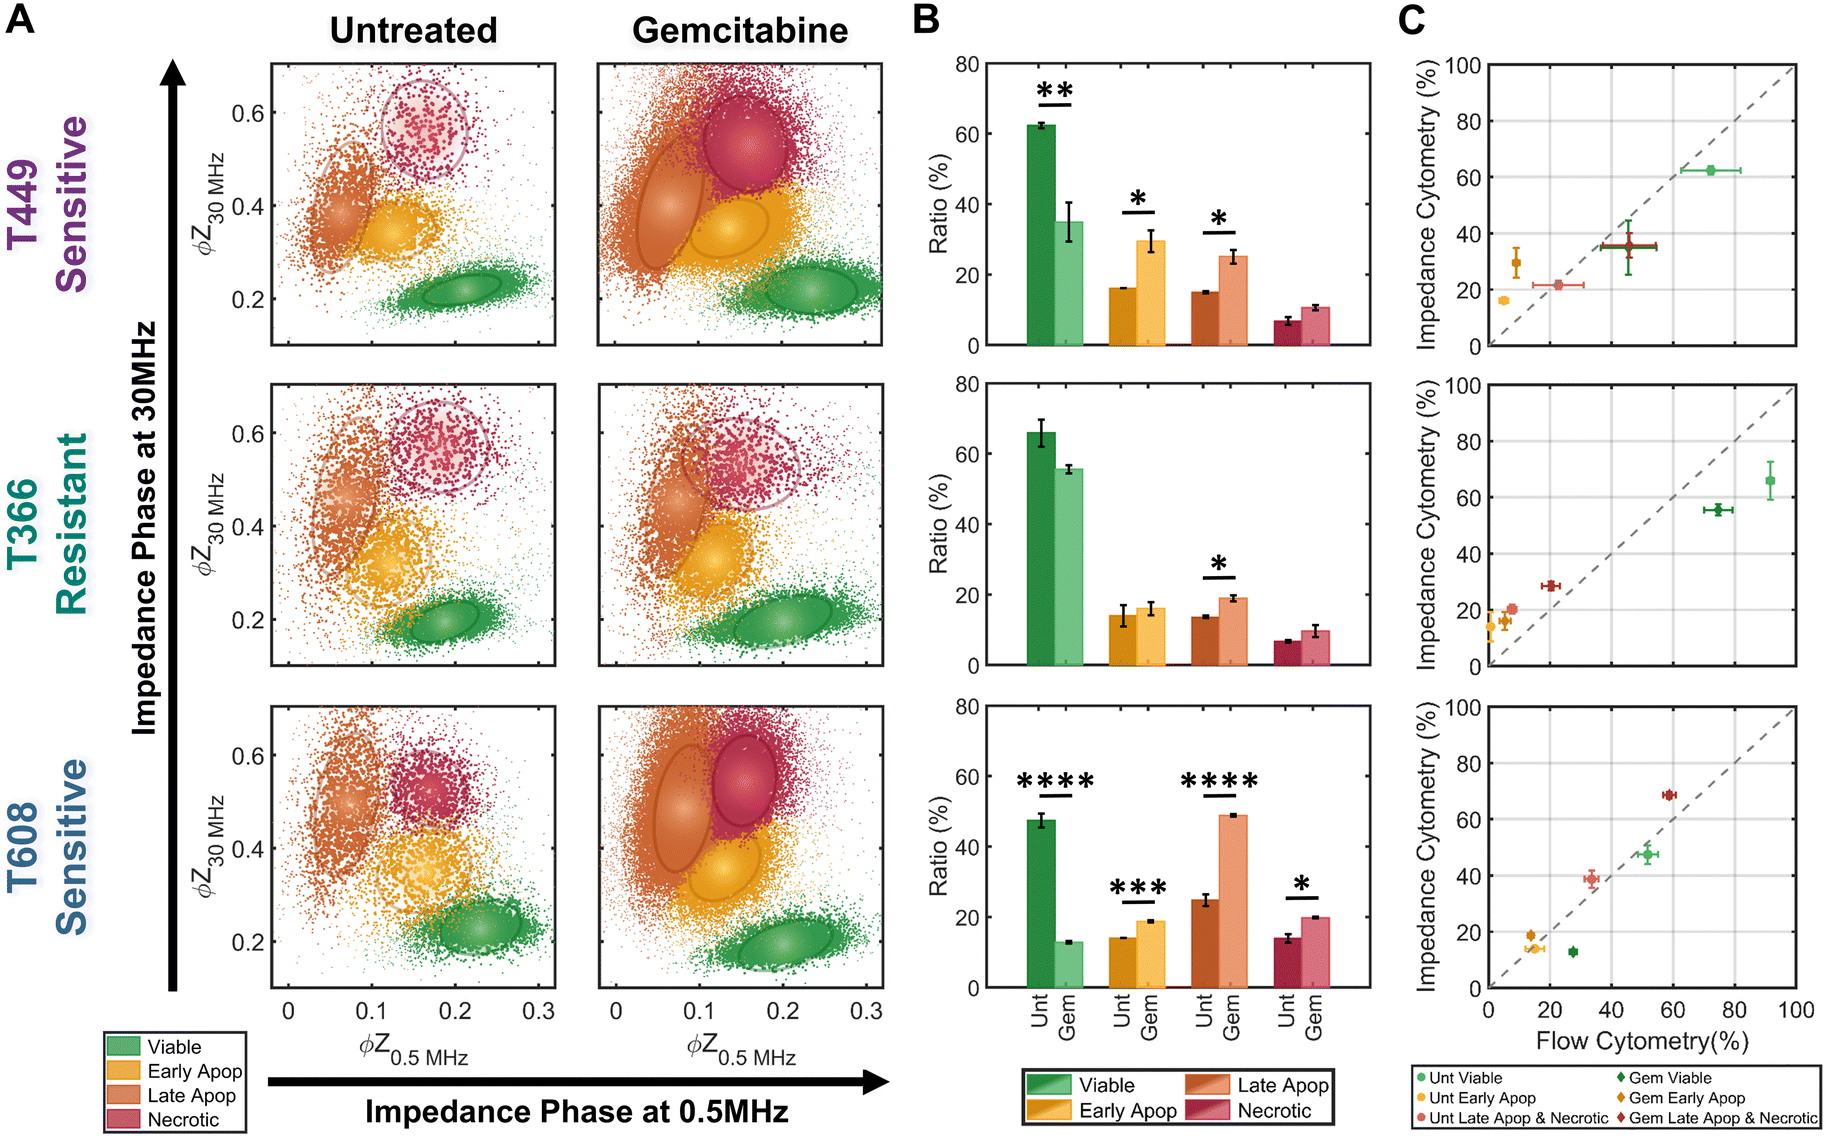 | ||
| Fig. 5 Quantification of subpopulation proportions by supervised learning (KNN method). A – Density scatter plots of ϕZ0.5 MHzversus ϕZ30 MHz for untreated controls and gemcitabine-treated samples for three PDAC cell types (T449, T366 and T608). The KNN-classified sub-populations: viable (green), early apoptotic (yellow), late apoptotic (orange) and necrotic (red). Ellipses contain 50% of all events per sub-population. B – Ratios for KNN-classified sub-populations for each PDAC cell line (n = 3). Statistical significance: *p ≤ 0.05; **p ≤ 0.01, ***p ≤ 0.001 and ****p ≤ 0.00001. C – Comparison between the estimated subpopulation ratios from flow cytometry versus impedance cytometry for each PDAC cell line (n = 3). | ||
Impedance metrics to classify progression of apoptotic states
Based on impedance-based identification of the four subpopulations (viable, early apoptotic, late apoptotic, and necrotic) within the gemcitabine treated PDAC samples, we compare each subpopulation across cell lines to delineate the biophysical impedance metrics relevant to their quantification. This is presented for three PDAC cell types of differing gemcitabine sensitivity: T608 (highly sensitive), T449 (moderately sensitive) and T366 (resistant), using the metrics of electrical diameter (|Z0.5 MHz|1/3) to assess cell size, ϕZ0.5 MHz to assess cell membrane state, and ϕZ30 MHz to assess internal cellular structure and composition (Fig. 6A–C). To better visualize this comparison, Fig. 6D presents a 3D scatter plot of these impedance metrics for a T608 PDX sample, and Fig. 6E presents a schematic overview of the key phenotypic differences between the subpopulations alongside their associated alterations in impedance metrics. The comparisons for the individual cell lines (together with other impedance metrics, such as ϕZ2 MHz and magnitude opacity) can be found in ESI† Fig. S4 for the untreated samples and in Fig. S5† for the gemcitabine-treated samples. Focusing on the necrotic pathway, comparisons between the viable, apoptotic, and necrotic subpopulations in drug-treated samples show statistically significant differences in terms of ϕZ2 MHz, ϕZ18 MHz and ϕZ30 MHz (≤ ***p < 0.001, ****p < 0.0001 & ****p < 0.0001, respectively), as well as clear differences in ϕZ0.5 MHz levels (p ≤ 0.0842). Comparing the necrotic versus viable subpopulations, the reduction in ϕZ0.5 MHz (Fig. 6B) can be attributed to plasma membrane permeabilization, which causes an increase in conductivity of the cell interior to lead to the observed rise in ϕZ30 MHz levels (Fig. 6C), but the known differences in cellular swelling do not cause significant alterations in electrical diameter. In fact, single-shell dielectric models (Fig. S6; ESI† section B) show that while alterations to the cell size do not result in major changes to the impedance phase of cells (Fig. S6B†), the alterations in membrane conductivity (as expected for a compromised plasma membrane) cause clear alterations in ϕZ0.5 MHz (Fig. S6D†). On the other hand, increases in conductivity of the cell interior (due to uncontrolled intake of ions from the conductive buffer) sharply increase the impedance phase at higher frequencies (ϕZ2 MHz, ϕZ18 MHz and ϕZ30 MHz in Fig. S6F†).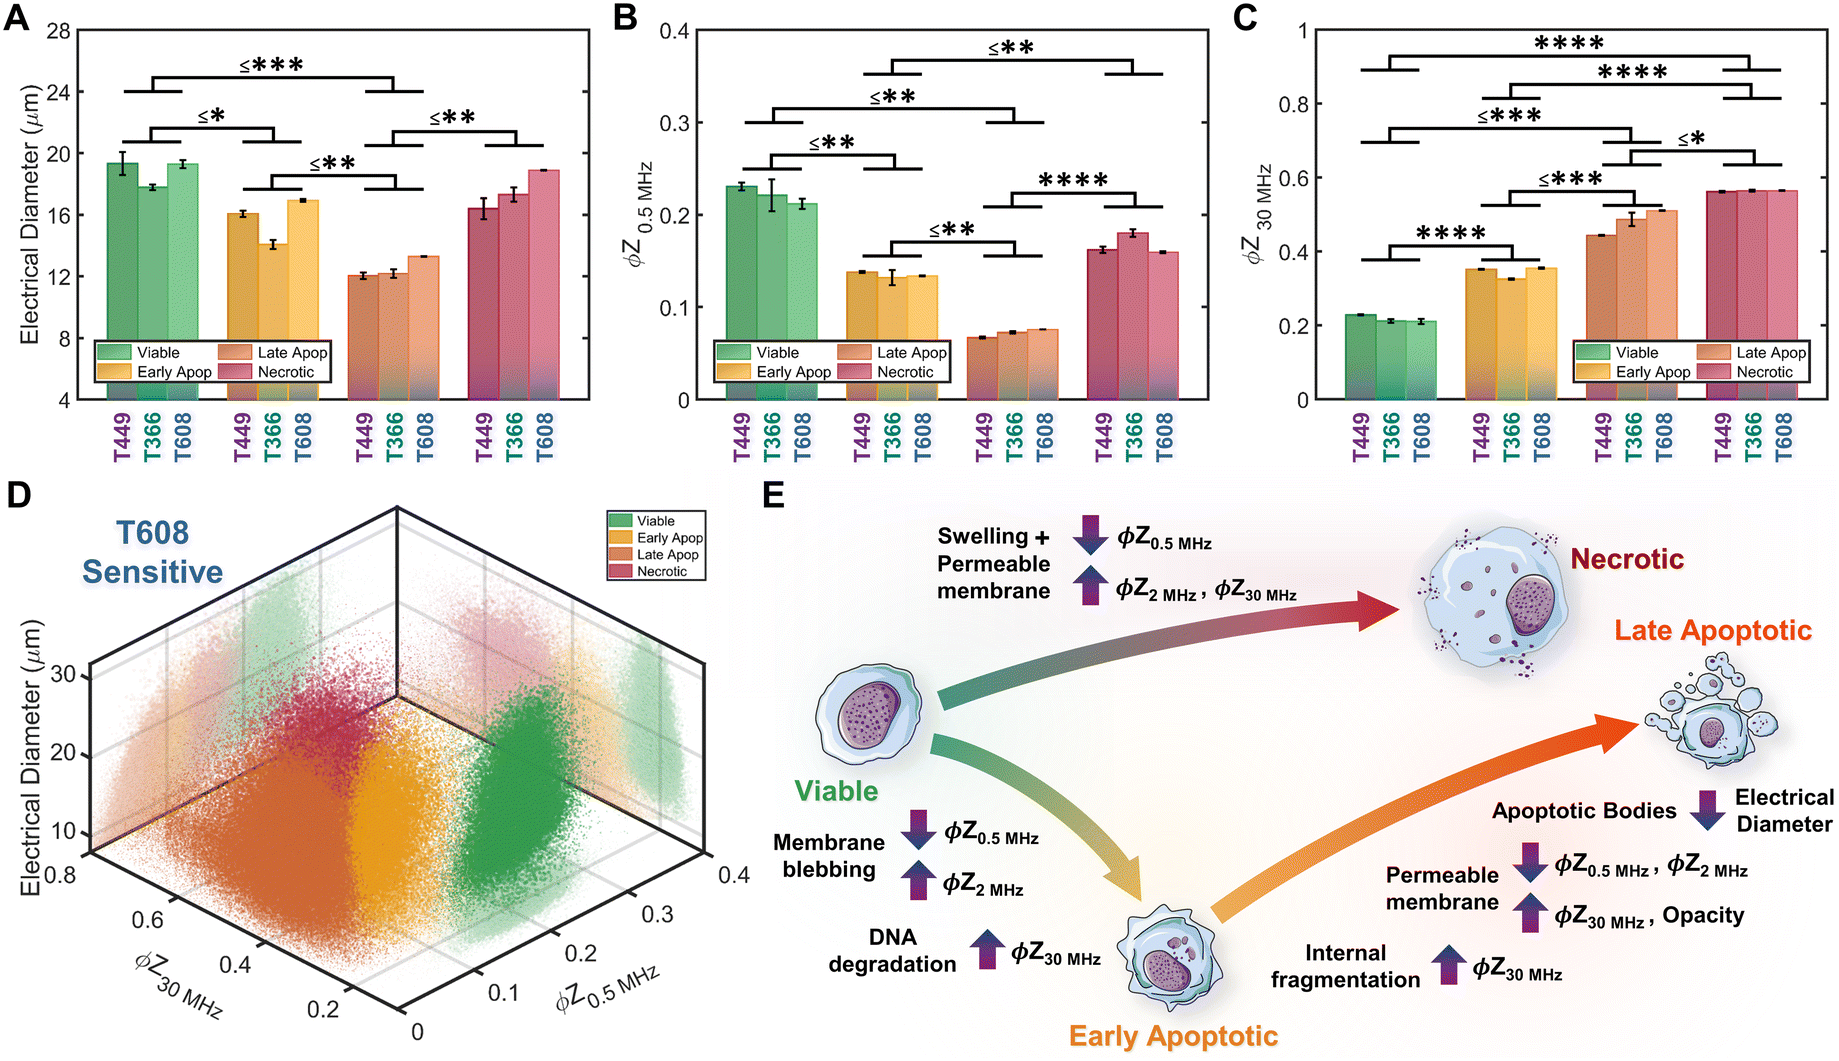 | ||
| Fig. 6 Comparison of biophysical metrics from impedance cytometry: A. electrical diameter, B. impedance phase at 0.5 MHz (ϕZ0.5 MHz) and C. impedance phase at 30 MHz (ϕZ30 MHz) for each PDAC cell type (n = 3 runs). The biophysical properties of each subpopulation (viable, early apoptotic, late apoptotic, and necrotic) can be identified by characteristic combinations of impedance metrics. Statistical significance presented as the highest p-value among the three PDAC types (*p ≤ 0.05; **p ≤ 0.01, ***p ≤ 0.001 and ****p ≤ 0.00001). D – Density scatter plot of ϕZ0.5 MHzversus ϕZ30 MHz and electrical diameter (|Z0.5 MHz|1/3) for a gemcitabine-treated T608 sample. E – Overview of the key biophysical differences between subpopulations and impedance metrics associated with the altered electrical physiology. | ||
Considering the apoptotic versus viable subpopulations in the drug-treated samples, statistically significant differences are apparent within all analyzed metrics (Fig. 6A–C and S5†). The characteristic formation of membrane blebs under apoptosis would increase the surface area of the cell and the capacitance alteration can be related to the increase in membrane permittivity. Based on shell-models (Fig. S6C†), this increase would increase ϕZ2 MHz, while the onset of apoptotic cell shrinkage would reduce ϕZ0.5 MHz (Fig. S6B†). Moreover, the start of chromatin condensation and DNA fragmentation, together with Ca2+ regulated alterations to the endoplasmic reticulum, would increase the conductivity of the cell interior. This would increase ϕZ2 MHz, ϕZ18 MHz and ϕZ30 MHz (Fig. S6E†), as observed with a good degree of significance (****p < 0.0001 & ****p < 0.0001, respectively), assuming an intact plasma membrane for apoptotic cells. Furthermore, statistically significant differences in all analyzed metrics are also apparent between subpopulations at the early-stage apoptosis (cross-validated by AV+ZNIR- expression in flow cytometry) versus the late-stage apoptosis (characterized by AV+ZNIR+ expression in flow cytometry, similar to Fig. 3A(iv)). Continuation of the internal fragmentation, including nuclear and organelle degradation, leads to lowering of the insulating intracellular material, thereby causing an increase in internal conductivity that is reflected in a significant increase in ϕZ18 MHz and ϕZ30 MHz (Fig. 6C and S5D and E†). Furthermore, with the onset of the “secondary necrosis” onward from late apoptosis, the plasma membrane becomes progressively permeabilized to lead to alterations similar to those discussed previously for necrosis, i.e., a significant decrease in both ϕZ0.5 MHz and ϕZ2 MHz (≤ **p < 0.01 & ≤ **p < 0.01, respectively), and a significant increase in ϕZ18 MHz and ϕZ30 MHz (≤ **p < 0.01 & ≤ *p < 0.05, respectively) due to ion exchange between the intracellular and external media. The transition from early to late apoptosis also leads to the formation and shedding of apoptotic bodies that vary in size, shape and composition during drug-induced cellular disassembly for removing fragmented internal components,35 which would lead to a sharp decrease in cell size, as detected by electrical diameter from our simulations (Fig. S6D†) and measured results (Fig. 6A; ≤**p < 0.01), especially in comparison to the viable cell subpopulation (≤***p < 0.001). Comparing the necrotic and late apoptotic subpopulations, while some phenotypic alterations are common, such as the gradual loss of membrane integrity that leads to significant changes in the impedance metrics, there are also key differences between the two states that can be distinguished based on the machine learning strategies. For instance, the formation of membrane blebs and apoptotic bodies within the late apoptotic subpopulation cause differences in electrical diameter and membrane-related metrics (e.g. ϕZ0.5 MHz, ϕZ2 MHz or magnitude opacity) versus the necrotic subpopulation.
Conclusion
Modulating drug-induced pancreatic cancer cell death for prevention of an immunosuppressive tumor microenvironment requires single-cell phenotypic analysis tools capable of distinguishing the intensity of apoptosis using drug-treated samples from patient-derived xenograft (PDX) models. Since flow cytometry after standard staining protocols for apoptosis and viability was unable to distinguish cells over the progression of apoptotic states, we consider distinction of cells in the early apoptotic versus late apoptotic and necrotic states based on the biophysical metrics measured by multifrequency impedance cytometry. Machine learning strategies were used to train for recognition of biophysical metrics from each apoptotic phenotype based on positive controls from hypotonic treatment of the pancreatic tumor cells, so that unsupervised learning can enable subpopulation clustering and supervised learning can be applied on gemcitabine treated pancreatic tumor cells to enable regression and pattern prediction. In this manner, the relative intensity of onset of apoptosis under gemcitabine treatment can be distinguished for pancreatic tumors of differing gemcitabine sensitivity based on the cell proportions in the viable, early apoptotic, late apoptotic, and necrotic states. In comparison to viable cells, those in the early apoptotic state exhibit lowered electrical diameter levels due to cell shrinkage, lowered impedance phase at low frequency (ϕZ0.5 MHz) due to membrane blebbing and a rise in impedance phase at high frequency (ϕZ30 MHz) due to alterations at the cell interior, such as Ca2+ regulated alterations to the endoplasmic reticulum, chromatin condensation and DNA fragmentation. Late apoptotic cells exhibit sharper drops in electrical diameter and impedance phase at low frequency (ϕZ0.5 MHz) versus viable and early apoptotic cells, while continuing to exhibit a rise in impedance phase at high frequency (ϕZ30 MHz). On the other hand, cells at the necrotic state are distinguished from all other phenotypic states based on their much higher impedance phase at high frequency (ϕZ30 MHz), likely due to uncontrolled ion uptake to the cell interior. Interestingly, the onset of late apoptosis versus early apoptotic and necrotic states can be distinguished by impedance metrics, whereas this was not possible by flow cytometry after the standard staining protocols. Upon application of these methods to quantify subpopulations after gemcitabine treatment of pancreatic tumor PDXs, we find cells chiefly at the late apoptotic state for the highly drug-sensitive cell types (T608), while they are distributed over the early and late apoptotic state for the moderately drug-sensitive cell types (T449), and remain predominantly viable for the drug-resistance cell type (T366), with a small proportion detected at the late apoptotic state. This ability to automate phenotypic classification by machine learning strategies, as applied here towards quantifying intensity of apoptosis for modulating drug-induced pancreatic cancer cell death, can form the foundation for studies with heterogeneous drug-treated samples from multicellular tumor models.Methods
Patient-derived pancreatic tumor xenografts and cells
PDAC tumor samples were generated from remnant human tumor surgical pathology specimens collected in collaboration with the University of Virginia Biorepository and Tissue Research Facility, and with the approval of the University of Virginia Institutional Review Board for Health Sciences Research following written informed consent from each patient. Tumors were propagated orthotopically on the pancreata of immunocompromised mice (Fig. 1B). Tumor growth characteristics were measured, samples were collected for genotyping, and xenograft lines were established.44,45 Cells were transduced with firefly luciferase lentivirus (KeraFAST), selected using puromycin and maintained in RPMI 1640 (Thermo Fisher Scientific) with 10% FBS (Gemini Bioproducts) and 2 mM glutamine (complete medium), with fresh aliquots used for experiments.Cell assays and drug treatment
For the proliferation assays, cells (∼3 × 10³) were plated in a 96-well plate in complete medium and allowed to attach overnight. Following one day of growth, the cell number was determined to initiate drug treatment and then replenished after 48 h, as needed for each experiment. PDAC cells were exposed to various doses (0.01 μg mL−1, 0.1 μg mL−1 and 1 μg mL−1) of gemcitabine (University of Virginia clinical pharmacy) for 24 h, 48 h and/or 96 h in complete medium, with control samples being kept under the same time periods. Upon harvest, the CyQUANT® cell proliferation assay (Invitrogen, ThermoFisher) was used to determine the relative cell number, using a plate reader (Biotek). Hypotonic treatments were performed by removing the cell culture medium from culture wells and adding 1 mL of DI water. The exposure period of cells to DI water was varied (2 min, 20 min or 75 min) to generate the progression of subpopulations. After this exposure period, DI water was removed from the wells and fresh complete medium was added. The cell cultures were then incubated and cultured for different time periods (20 min, 1 h, 4.5 h or 12 h), after which the cells were lifted and processed for flow and impedance cytometry. Gemcitabine treatments were performed by exposing cell cultures to 1 μg mL−1 of gemcitabine (University of Virginia clinical pharmacy) for 48 h in complete medium to prepare for cytometry analysis.Sample preparation
Cell culture media, i.e., RPMI 1640 with 10% FBS and 2 mM glutamine (complete medium, Thermo Fisher), post either hypotonic and gemcitabine treatments, were first aspirated and stored, with the remaining adherent cells being washed in 1× PBS (Thermo Fisher) and exposed to 0.5% trypsin in 1× PBS for 5 min at 37 °C. To retrieve both the adherent and non-adherent cells fractions, both the aspirated cell culture medium and trypsinized cells were re-suspended into a total volume of 5 mL DMEM with 10% FBS and 1% pen–strep (Thermo Fisher) and centrifuged at 300 g for 10 min. This sample was then aspirated, the cell pellet (containing both adherent and non-adherent cells) was re-suspended in 1× PBS, 500 mM EDTA (Fisher Scientific), and 0.5% bovine serum albumin (Sigma Aldrich) and filtered through a 100 μm cell strainer. Cells were then counted with a hemocytometer and ∼300![[thin space (1/6-em)]](https://www.rsc.org/images/entities/char_2009.gif) 000 cells from each sample were then analyzed for flow and impedance cytometry measurements concurrently.
000 cells from each sample were then analyzed for flow and impedance cytometry measurements concurrently.
Flow cytometry
After sample preparation, samples were stained with annexin V (FITC; Thermo Fisher Scientific) and Zombie NIRTM (or ZNIR; APC-A750, Biolegend) following the provider instructions, and immediately analyzed. Flow cytometry was carried out using a CytoFLEX flow cytometer (Beckman Coulter), with data being analyzed using CytExpress (Beckman Coulter). The cell population was first gated based on forward (FSC) versus side (SSC) scatter data, to gate events that were too small to be considered cells; and then gated based on SSC Area versus Height, to gate out doublets events. Data from the FITC and APC-A750 filters were then used to plot the expression of annexin V and ZNIR, respectively, with cells being gated according to their viability status.Impedance cytometry
After sample preparation, reference polystyrene beads (7 μm; Sigma) were added to each sample at a concentration of ∼1 × 10⁵ mL−1 and the heterogeneous samples were passed through a microfluidic device (50 μm × 50 μm cross-section) at 50 μL min−1 for measurement using an impedance analyzer (Ampha Z32, Amphasys AG), at four simultaneously applied AC frequency signals (0.5, 2, 18 and 30 MHz) to electrodes patterned within the channel. The impedance signal trains were processed in real time for thresholding to store the single cell data in the form of impedance magnitude (|Z|) and phase (ϕZ) at each frequency.Data and statistical analysis
Data was processed and analyzed using MATLAB (R2018b, MathWorks). Flow and impedance cytometry data was processed to perform comparisons across experimental conditions. For impedance cytometry, the impedance signal of individual cells was normalized against the frequency-independent impedance response of the reference polystyrene beads by dividing the impedance data by the mean impedance data of reference beads. Due to normalization, impedance phase is herein reported in arbitrary units. PDAC cell populations were gated using normalized impedance data at 30 MHz, thereby removing smaller debris and the reference beads from further analysis steps. Normalized impedance magnitude is used to compute the metric of electrical diameter, by calculating |Z0.5 MHz|1/3 (using the polystyrene beads for size reference), and the metric of magnitude opacity, by calculating |Z2 MHz|/|Z0.5 MHz|. Statistical analyses were performed on processed flow and impedance cytometry datasets, with significance level being defined at α < 0.05 for all cases. One-way ANOVA tests were performed to compare datasets based on treatment conditions and cell lines, i.e., assessing whether datasets from untreated and drug treated or from the different cell lines could be assumed to come from samples of the same mean, with the null hypothesis being rejected (p ≪ 0.05). Thus, two sample Students' t-tests were performed to compare individual datasets to assess statistically significant differences between treatment conditions and viability subpopulations.Machine learning
ML strategies were implemented using MATLAB (R2018b, MathWorks) functions and applications. For unsupervised clustering of viability sub-populations, the datasets from the various experimental conditions from hypotonic treatments were merged to obtain a single dataset with the four expected viability sub-populations (data from ϕZ at 0.5, 2 and 30 MHz). Due to the observed 2D Gaussian distributions of the apparent clusters, the Gaussian mixture model (GMM) was implemented using MATLAB's fitgmdist function. The function was set to identify k = 4 sub-populations within the dataset, with the individual sub-populations being attributed a specific class. With each population being classified, a supervised classification algorithm was then trained using MATLAB's Classification Learner application. The dataset comprised of data from ϕZ at 0.5, 2, 18 and 30 MHz, electrical diameter and magnitude opacity, and 5-fold cross validation was used. Different algorithms available in the application library were tested, including linear discriminant, quadratic discriminant, decision tree, support vector machines (SVMs) and K-nearest neighbors (KNN). Confusion matrices for each algorithm were generated to assess the performance of each method. The accuracy of each algorithm was determined by calculating the ratio between the total number of true positives and negatives (i.e., the number of times the classifier accurately predicted the class of an event) and the total number of events. The optimal algorithm was a weighted KNN, with an accuracy of 98.4%, using K = 10 neighbors, the Euclidean distance, and a squared inverse for the distance weight. A weighted KNN typically performs better than a traditional KNN as it gives more weight to the events which are nearby and less weight to events farther away from the event being classified. Moreover, when compared to other, also high performing algorithms, such as SVMs, KNN is typically a much faster method, allowing for high accuracy while saving computation time and complexity. Using MATLAB trainClassifier function to recreate the optimal classification model, the weighted KNN algorithm was then implemented in the datasets from gemcitabine-treated PDAC samples for classification of the viability sub-populations.Conflicts of interest
The authors have no financial interests related to this work.Acknowledgements
This research was supported by the National Center for Advancing Translational Sciences of the National Institutes of Health (NIH) Award Number UL1TR003015, NCI Cancer Center Support Grant P30 CA44579, AFOSR grant FA2386-21-1-4070, NSF Award #2051652, and University of Virginia's Cancer Center Seed Grant program.References
- S. Elmore, Toxicol. Pathol., 2007, 35(4), 495–516 CrossRef CAS PubMed.
- A. Bergsmedh, A. Szeles, M. Henriksson, A. Bratt, M. J. Folkman, A.-L. Spetz and L. Holmgren, Proc. Natl. Acad. Sci. U. S. A., 2001, 98(11), 6407–6411 CrossRef CAS PubMed.
- I. K. Poon, C. D. Lucas, A. G. Rossi and K. S. Ravichandran, Nat. Rev. Immunol., 2014, 14(3), 166–180 CrossRef CAS PubMed.
- B. Méry, J.-B. Guy, A. Vallard, S. Espenel, D. Ardail, C. Rodriguez-Lafrasse, C. Rancoule and N. Magné, J. Cell Death, 2017, 10, 1179670717691251 Search PubMed.
- N. Samm, K. Werner, F. Rückert, H. D. Saeger, R. Grützmann and C. Pilarsky, Cancers, 2011, 3(1), 1–16 CrossRef CAS PubMed.
- L. Rahib, B. D. Smith, R. Aizenberg, A. B. Rosenzweig, J. M. Fleshman and L. M. Matrisian, Cancer Res., 2014, 74(11), 2913–2921 CrossRef CAS PubMed.
- J. M. Herman, M. J. Swartz, C. C. Hsu, J. Winter, T. M. Pawlik, E. Sugar, R. Robinson, D. A. Laheru, E. Jaffee and R. H. Hruban, J. Clin. Oncol., 2008, 26(21), 3503 CrossRef PubMed.
- J. P. Neoptolemos, D. D. Stocken, H. Friess, C. Bassi, J. A. Dunn, H. Hickey, H. Beger, L. Fernandez-Cruz, C. Dervenis and F. Lacaine, N. Engl. J. Med., 2004, 350(12), 1200–1210 CrossRef CAS PubMed.
- A. Jemal, R. Siegel, E. Ward, Y. Hao, J. Xu and M. J. Thun, Cancer statistics 2009, CA Cancer J. Clin., 2009, 59(4), 225–249 CrossRef PubMed.
- M. Amrutkar and I. P. Gladhaug, Cancers, 2017, 9(11), 157 CrossRef PubMed.
- D. Thomas and P. Radhakrishnan, Mol. Cancer, 2019, 18(1), 1–15 CrossRef PubMed.
- A. A. Friedman, A. Letai, D. E. Fisher and K. T. Flaherty, Nat. Rev. Cancer, 2015, 15(12), 747–756 CrossRef CAS PubMed.
- T. G. Cotter, Nat. Rev. Cancer, 2009, 9(7), 501–507 CrossRef CAS PubMed.
- B. A. Carneiro and W. S. El-Deiry, Nat. Rev. Clin. Oncol., 2020, 17(7), 395–417 CrossRef PubMed.
- S. Van Cruchten and W. Van Den Broeck, Anat., Histol., Embryol., 2002, 31(4), 214–223 CrossRef CAS PubMed.
- M. Castedo, J.-L. Perfettini, T. Roumier, K. Andreau, R. Medema and G. Kroemer, Oncogene, 2004, 23(16), 2825–2837 CrossRef CAS PubMed.
- X. Chen, H. J. Zeh, R. Kang, G. Kroemer and D. Tang, Nat. Rev. Gastroenterol. Hepatol., 2021, 18, 804–823 CrossRef PubMed.
- A. Trauzold, H. Wermann, A. Arlt, S. SchuÈtze, H. SchaÈfer, S. Oestern, C. RoÈder, H. Ungefroren, E. Lampe and M. Heinrich, Oncogene, 2001, 20(31), 4258–4269 CrossRef CAS PubMed.
- R. Weinlich, A. Oberst, H. M. Beere and D. R. Green, Nat. Rev. Mol. Cell Biol., 2017, 18(2), 127–136 CrossRef CAS PubMed.
- L. Galluzzi, O. Kepp, F. K.-M. Chan and G. Kroemer, Annu. Rev. Pathol.: Mech. Dis., 2017, 12, 103–130 CrossRef CAS PubMed.
- T. Arumugam, V. Ramachandran, K. F. Fournier, H. Wang, L. Marquis, J. L. Abbruzzese, G. E. Gallick, C. D. Logsdon, D. J. McConkey and W. Choi, Cancer Res., 2009, 69(14), 5820–5828 CrossRef CAS PubMed.
- S. AbuHammad and M. Zihlif, Genomics, 2013, 101(4), 213–220 CrossRef CAS PubMed.
- N. A. Puspita and A. Bedford, Int. J. Integr. Health Sci., 2017, 5(1), 8–14 CrossRef.
- A. Pasqualato, A. Palombo, A. Cucina, M. Mariggiò, L. Galli, D. Passaro, S. Dinicola, S. Proietti, F. D'Anselmi and P. Coluccia, Exp. Cell Res., 2012, 318(7), 835–846 CrossRef CAS PubMed.
- X. Zhu, H. Shen, X. Yin, L. Long, C. Xie, Y. Liu, L. Hui, X. Lin, Y. Fang and Y. Cao, Oncogene, 2016, 35(3), 323–332 CrossRef CAS PubMed.
- L. Buscail, B. Bournet and P. Cordelier, Nat. Rev. Gastroenterol. Hepatol., 2020, 17(3), 153–168 CrossRef CAS PubMed.
- K. C. Lee, J. Guck, K. Goda and K. K. Tsia, Trends Biotechnol., 2021, 39, 1249–1262 CrossRef CAS PubMed.
- K. C. Cheung, M. Di Berardino, G. Schade-Kampmann, M. Hebeisen, A. Pierzchalski, J. Bocsi, A. Mittag and A. Tárnok, Cytometry, Part A, 2010, 77(7), 648–666 CrossRef PubMed.
- T. Sun and H. Morgan, Microfluid. Nanofluid., 2010, 8(4), 423–443 CrossRef CAS.
- C. Honrado, P. Bisegna, N. S. Swami and F. Caselli, Lab Chip, 2021, 21(1), 22–54 RSC.
- C. Honrado, N. Michel, J. H. Moore, A. Salahi, V. Porterfield, M. J. McConnell and N. S. Swami, ACS Sens., 2020, 6(1), 156–165 CrossRef PubMed.
- D. Spencer and H. Morgan, ACS Sens., 2020, 5(2), 423–430 CrossRef CAS PubMed.
- D. C. Spencer, T. F. Paton, K. T. Mulroney, T. J. Inglis, J. M. Sutton and H. Morgan, Nat. Commun., 2020, 11(1), 1–11 CrossRef PubMed.
- J. H. Moore, A. Salahi, C. Honrado, C. Warburton, C. A. Warren and N. S. Swami, Biosens. Bioelectron., 2020, 166, 112440 CrossRef CAS PubMed.
- C. Honrado, S. J. Adair, J. H. Moore, A. Salahi, T. W. Bauer and N. S. Swami, Adv. Biol., 2021, 2100438 CrossRef CAS PubMed.
- E. A. Henslee, R. M. T. Serrano, F. H. Labeed, R. I. Jabr, C. H. Fry, M. P. Hughes and K. F. Hoettges, Analyst, 2016, 141(23), 6408–6415 RSC.
- M. Li and R. K. Anand, Chem. Sci., 2019, 10(5), 1506–1513 RSC.
- A. De Ninno, R. Reale, A. Giovinazzo, F. R. Bertani, L. Businaro, P. Bisegna, C. Matteucci and F. Caselli, Biosens. Bioelectron., 2020, 150, 111887 CrossRef CAS PubMed.
- J. Schütt, D. I. Sandoval Bojorquez, E. Avitabile, E. S. Oliveros Mata, G. Milyukov, J. Colditz, L. G. Delogu, M. Rauner, A. Feldmann and S. Koristka, Nano Lett., 2020, 20(9), 6572–6581 CrossRef PubMed.
- K. Ahuja, G. M. Rather, Z. Lin, J. Sui, P. Xie, T. Le, J. R. Bertino and M. Javanmard, Microsyst. Nanoeng., 2019, 5(1), 1–11 CrossRef CAS PubMed.
- M. D'Orazio, R. Reale, A. De Ninno, M. A. Brighetti, A. Mencattini, L. Businaro, E. Martinelli, P. Bisegna, A. Travaglini and F. Caselli, IEEE Trans. Biomed. Eng., 2021, 69(2), 921–931 Search PubMed.
- Y. Feng, Z. Cheng, H. Chai, W. He, L. Huang and W. Wang, Lab Chip, 2022, 22(2), 240–249 RSC.
- F. Caselli, R. Reale, A. De Ninno, D. Spencer, H. Morgan and P. Bisegna, Lab Chip, 2022, 22(9), 1714–1722 RSC.
- J. B. Stokes, S. J. Adair, J. K. Slack-Davis, D. M. Walters, R. W. Tilghman, E. D. Hershey, B. Lowrey, K. S. Thomas, A. H. Bouton and R. F. Hwang, Mol. Cancer Ther., 2011, 10(11), 2135–2145 CrossRef CAS PubMed.
- D. M. Walters, J. M. Lindberg, S. J. Adair, T. E. Newhook, C. R. Cowan, J. B. Stokes, C. A. Borgman, E. B. Stelow, B. T. Lowrey and M. E. Chopivsky, Neoplasia, 2013, 15(2), 143–155 CrossRef CAS PubMed.
- P. Huang and W. Plunkett, In Induction of apoptosis by gemcitabine, Semin. Oncol., 1995, 19–25 CAS.
- M. Van Engeland, L. J. Nieland, F. C. Ramaekers, B. Schutte and C. P. Reutelingsperger, Cytometry, Part A, 1998, 31(1), 1–9 CrossRef CAS.
- N. Walker, B. Harmon, G. Gobe and J. Kerr, Patterns of cell death, Methods and achievements in experimental pathology, 1988, vol. 13, pp. 18–54 Search PubMed.
- S. L. Fink and B. T. Cookson, Infect. Immun., 2005, 73(4), 1907–1916 CrossRef CAS PubMed.
- J. F. Kerr, A. H. Wyllie and A. R. Currie, Br. J. Cancer, 1972, 26(4), 239–257 CrossRef CAS PubMed.
- G. K. Atkin-Smith and I. K. Poon, Trends Cell Biol., 2017, 27(2), 151–162 CrossRef CAS PubMed.
- M. T. Silva, FEBS Lett., 2010, 584(22), 4491–4499 CrossRef CAS PubMed.
- G. Majno and I. Joris, Am. J. Pathol., 1995, 146(1), 3 CAS.
- N. Selzner, M. Selzner, R. Graf, U. Ungethuem, J. Fitz and P. Clavien, Cell Death Differ., 2004, 11(2), S172–S180 CrossRef CAS PubMed.
Footnote |
| † Electronic supplementary information (ESI) available: Cell proliferation assays (Fig. S1), flow cytometry (Fig. S2) and impedance cytometry (Fig. S3 and S4), as well as dielectric shell model are available. See DOI: https://doi.org/10.1039/d2lc00304j |
| This journal is © The Royal Society of Chemistry 2022 |