DOI:
10.1039/D1LC01087E
(Paper)
Lab Chip, 2022,
22, 793-804
Speeding up reconstruction of 3D tomograms in holographic flow cytometry via deep learning†
Received
30th November 2021
, Accepted 15th January 2022
First published on 19th January 2022
Abstract
Tomographic flow cytometry by digital holography is an emerging imaging modality capable of collecting multiple views of moving and rotating cells with the aim of recovering their refractive index distribution in 3D. Although this modality allows us to access high-resolution imaging with high-throughput, the huge amount of time-lapse holographic images to be processed (hundreds of digital holograms per cell) constitutes the actual bottleneck. This prevents the system from being suitable for lab-on-a-chip platforms in real-world applications, where fast analysis of measured data is mandatory. Here we demonstrate a significant speeding-up reconstruction of phase-contrast tomograms by introducing in the processing pipeline a multi-scale fully-convolutional context aggregation network. Although it was originally developed in the context of semantic image analysis, we demonstrate for the first time that it can be successfully adapted to a holographic lab-on-chip platform for achieving 3D tomograms through a faster computational process. We trained the network with input–output image pairs to reproduce the end-to-end holographic reconstruction process, i.e. recovering quantitative phase maps (QPMs) of single cells from their digital holograms. Then, the sequence of QPMs of the same rotating cell is used to perform the tomographic reconstruction. The proposed approach significantly reduces the computational time for retrieving tomograms, thus making them available in a few seconds instead of tens of minutes, while essentially preserving the high-content information of tomographic data. Moreover, we have accomplished a compact deep convolutional neural network parameterization that can fit into on-chip SRAM and a small memory footprint, thus demonstrating its possible exploitation to provide onboard computations for lab-on-chip devices with low processing hardware resources.
Introduction
Digital holography (DH) in microscopy is a label-free computational imaging technique able to provide a posteriori multiple refocusing capability and quantitative phase-contrast imaging.1–3 Thanks to these features, DH has been successfully employed in a variety of biomedicine applications,4 including cancer cell identification and characterization,5–7 diagnostics of blood diseases,8–11 inflammations12 and infectious diseases,13–15 study of cell motility and migration,16 and marker-free detection of lipid droplets (LDs).17 The possibility to probe biological samples from different directions leads to the full 3D label-free imaging achieved by holographic tomography technology,18,19 which represents the leading edge of biological inspection at the single-cell level. The combination of compact holographic microscopy and flow cytometry allows the high-throughput screening of cells flowing in microfluidic channels, thus permitting biological specimens to be studied in their natural environment for point-of-care diagnostics at the lab-on-a-chip scale.20–22 Recently, the possibility to perform the 3D tomographic reconstruction of rotating cells under flow cytometry conditions has been investigated for a variety of applications,23–31 such as blood anaemia detection,23 cancer cell identification,25 label-free liquid biopsy,29 intracellular nanoparticle inspection,30 and plant cell biology.31 However, when a very large number of digital holograms has to be recorded by a flow cytometry assay, the numerical holographic reconstruction process becomes the bottleneck that prevents reliable and exploitable applications at the lab-on-a-chip scale due to the demanding algorithms and the huge computational time. In fact, it is well known that, in DH microscopy, the complete processing pipeline to retrieve the quantitative phase map (QPM) reconstruction from a digital hologram consists of several steps,2,3 namely zero-order and twin-image suppression, numerical refocusing, aberration correction, and finally, phase unwrapping. Actually, in off-axis DH, the suppression of undesired diffraction orders is essentially made by real-time methods based on Fourier spectrum filtering,32 while iterative phase retrieval algorithms need to be employed for in-line recording schemes.33 The numerical refocusing is usually solved by first reconstructing a stack of images, obtained by varying the reconstruction distance, and then a suitable image sharpness metric is computed on each reconstruction, in which the maximum or minimum value corresponds to the in-focus distance depending on the nature of the object. To date, a large variety of metrics has been proposed to perform the in-focus reconstruction automatically.16,34 Of course the channel height might influence the computational burden of this step, since it sets the volume to be digitally scanned to look for the sample best focus plane. The phase aberration compensation step can be achieved with fitting-based processing35 or by acquiring a reference hologram (i.e. without the sample in the imaged field of view (FOV)) to be subtracted36 to the aberrated phase image. Finally, the phase unwrapping is performed to correct phase jumps caused by the imaged objects that introduce an optical path difference larger than 2π. Usually, accurate and robust methods are based on global image unwrapping algorithms37 that can be very time consuming, especially depending on the level of speckle noise in the recorded digital hologram. Therefore, to speed up the phase unwrapping, it is advisable to use a preliminary denoising algorithm.38 Definitely, depending on the hologram size (i.e., the number of pixels of the sensor camera) and the imaging configuration (i.e., in-line or off-axis) the entire processing pipeline to reconstruct one single QPM from the recorded digital hologram can take minutes on a basic desktop computer.
To cope with these computational limitations, recently, deep convolutional neural networks (DCNNs) have been employed to speed up the holographic processing pipeline.39,40 In particular, the numerical refocusing step is addressed as a DCNN-based in-focus distance regression problem,41,42 or through DCNNs for classification.43 The phase aberration compensation has been solved by using a simplified version of the U-Net model44 for the background detection and subtraction.45 Instead, DCNNs inspired by the ResNet model46 have been employed for both the automatic phase aberration compensation47 and phase unwrapping process.48 Recently, by suitably adapting the encoder–decoder models, it has been demonstrated that the entire holographic reconstruction process can be skipped, thus enabling the direct reconstruction from raw holograms without any prior knowledge about the imaging parameters.49–53 Despite the remarkable results achieved in these works in terms of the accuracy about recovering QPMs from digital holograms, such DCNN architectures usually employ tens of millions learnable parameters and need a remarkable amount of memory to store them. Here we propose for the first time in DH a multi-scale context aggregation network (CAN)54 that was originally developed in the context of semantic image analysis.55 The network operates on input–output image pairs to approximate an operator's action, hence we train such a fully-convolutional DCNN to reproduce the end-to-end holographic reconstruction process. CANs applied to DH have shown to guarantee accuracy in approximating image processing operators, thus achieving interactive rates on high-resolution images and a constant runtime. This latter feature points out that such networks are potentially deployable within the constraint of compact devices. In our work we have investigated the trade-off between the input image sizes, network deepness and runtime to achieve a compact DCNN parameterization that can fit into on-chip SRAM and a small memory footprint,56 thus making it possible to provide onboard computations for lab-on-chip devices with low processing hardware resources. We demonstrate that the proposed approach allows a single QPM reconstruction in 168 ms at a constant runtime, thus making tomographic reconstructions available in a few seconds instead of tens of minutes, while preserving the high-resolution content of tomographic data, i.e. over 98.5% accuracy with respect to the corresponding ground-truth.
Materials and methods
Holographic recording and numerical processing
In order to perform the holographic recording of flowing cells, we used a DH microscope in off-axis configuration employing a Mach–Zehnder interferometric configuration, as sketched in Fig. 1A. In particular, we coupled a 532 nm laser source (Laser Quantum Torus 532) with a 750 mW output power. A polarizing beam splitter (PBS) separates the laser beam into an object and a reference wave. The reference beam is transmitted, while the object beam is reflected. In addition, to balance the ratio between the intensities of the object and reference beams without changing their polarization, two half-wave plates (HWPs) are placed in front of and behind the PBS. The object beam illuminates the cells while flowing within a microfluidic channel (Microfluidic ChipShop 10![[thin space (1/6-em)]](https://www.rsc.org/images/entities/char_2009.gif) 000107 – 200 μm × 1000 μm × 58.5 mm), and the scattered radiation is collected by a microscope objective (MO1) (Zeiss Plan-Apochromat 40× – NA = 1.3 – oil immersion) and sent to a tube lens (TL1). The reference beam passes through a beam expander shaped by a microscope objective and a second tube lens (MO2 and TL2). Then, both beams are recombined by a beam splitter cube (BS) with a non-zero angle between them because of the off-axis configuration, and the resulting interference fringe pattern is recorded using a CMOS camera (Genie Nano-CXP Cameras – 5120 × 5120 pixels, 4.5 μm pixel) at 30 fps. An example of a recorded digital hologram is shown in Fig. 1B. Within the microfluidic channel, a laminar flow is generated by an automatic syringe pump (CETONI Syringe Pump neMESYS 290N) with a flow rate set at 50 nl s−1. It is a low-pressure system that allows high-precision and pulsation-free dosing of liquids on a nanolitre scale, thus ensuring a very homogeneous flow. Cells not flowing at the centre of the microchannel undergo a velocity gradient due to the parabolic velocity profile. Therefore, while flowing, cells experience rotation thanks to the hydrodynamic forces of the laminar stream.25
000107 – 200 μm × 1000 μm × 58.5 mm), and the scattered radiation is collected by a microscope objective (MO1) (Zeiss Plan-Apochromat 40× – NA = 1.3 – oil immersion) and sent to a tube lens (TL1). The reference beam passes through a beam expander shaped by a microscope objective and a second tube lens (MO2 and TL2). Then, both beams are recombined by a beam splitter cube (BS) with a non-zero angle between them because of the off-axis configuration, and the resulting interference fringe pattern is recorded using a CMOS camera (Genie Nano-CXP Cameras – 5120 × 5120 pixels, 4.5 μm pixel) at 30 fps. An example of a recorded digital hologram is shown in Fig. 1B. Within the microfluidic channel, a laminar flow is generated by an automatic syringe pump (CETONI Syringe Pump neMESYS 290N) with a flow rate set at 50 nl s−1. It is a low-pressure system that allows high-precision and pulsation-free dosing of liquids on a nanolitre scale, thus ensuring a very homogeneous flow. Cells not flowing at the centre of the microchannel undergo a velocity gradient due to the parabolic velocity profile. Therefore, while flowing, cells experience rotation thanks to the hydrodynamic forces of the laminar stream.25
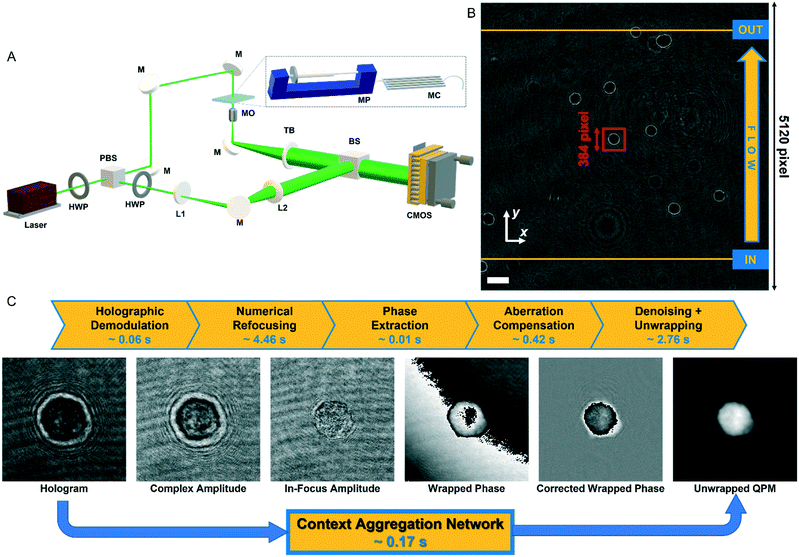 |
| | Fig. 1 Holographic recording and QPM retrieval. (A) DH microscope in off-axis configuration. HWP – half-wave plate; PBS – polarizing beam splitter; L1, L2 – lens; M – mirror; MO – microscope objective; MP – microfluidic pump; MC – microfluidic channel; TL – tube lens; BS – beam splitter; CMOS – camera. (B) Digital hologram recorded by the DH setup in A with cells flowing along the y-axis from the input line to the output line used for detecting them (see Video S1†). The scale bar is 50 μm. (C) Holographic processing pipeline to compute the QPM of a cell from the corresponding holographic ROI selected in B (red box). The standard operations are reported at the top with the corresponding computational times. | |
Each recorded hologram is pre-processed with the aim of detecting and tracking each flowing cell within the FOV. In particular, due to the inherent contrast between cells and their background in the digital hologram (see Fig. 1B), a threshold-based method is exploited to detect the frames in which a cell enters and exits the FOV by passing through the input and output lines shown in yellow in Fig. 1B. The microfluidic pump ensures that cells flow along the y-axis with a quasi-uniform speed while keeping about the same x-position according to the reference system reported in Fig. 1B.
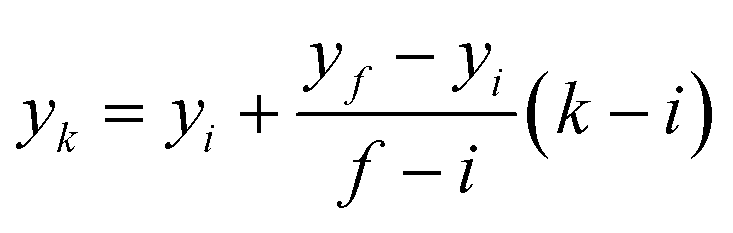
Therefore, the x-coordinates of the intermediate positions are computed as the mean value between the detected input and output x-coordinates, while the corresponding y-coordinates are computed by assuming a uniform movement between the input and the output lines, i.e.
| |  | (1) |
where
k =
i, …,
f is the intermediate frame index ranging from the detected input frame
i and output frame
f, and
yi and
yf are the
y-coordinates of the fixed input and output lines, respectively. Then a sliding patch with a size of 384 × 384 pixels is centred on these raw positions (see the red box in
Fig. 1B and Video S1
†) that are finally refined through the weighted centroid method after retrieving the corresponding QPMs.
16 In summary, the video sequence of 5120 × 5120 pixels holographic images turns into several sequences of 384 × 384 pixels sub-holograms, each of them containing the cell during its rotation. Finally, each sub-hologram is numerically reconstructed by implementing the processing pipeline summarized in
Fig. 1C. In particular, the suppression of undesired diffraction orders is made by Fourier spectrum filtering to select and centre the real diffraction order (
i.e., hologram demodulation in
Fig. 1C). Afterwards, the numerical refocusing is achieved by searching the in-focus distance through the minimization of the Tamura coefficient (TC).
16 The propagation of the demodulated hologram at such a distance provides the in-focus complex amplitude from which the phase-contrast image is obtained by calculating its argument. The residual optical aberrations, superposed to the retrieved phase-contrast image, are subtracted by using a reference hologram, acquired without the sample in the imaged FOV.
35 Finally, we employ the two-dimensional windowed Fourier transform filtering as the denoising method
57 and the PUMA algorithm for the unwrapping.
58 The entire processing pipeline takes about 8 seconds to run for one single position of a single cell. The processing is then repeated for all the different positions occupied by the cell while it flows along the FOV. After having computed the QPMs of the same cell, the corresponding rolling angles are estimated from its transversal positions.
27 Finally, the tomographic reconstruction is performed by using the filtered back projection algorithm.
23
Sample preparation
Mouse embryonic fibroblasts NIH-3T3 were cultured in Dulbecco's modified Eagle's medium (DMEM) containing 4.5 g L−1D-glucose and supplemented with 10% fetal bovine serum (FBS) (Life Technologies, Carlsbad, CA, USA), 100 units per mL penicillin and 100 μg mL−1 streptomycin (Sigma, St. Louis, MO). Then they were harvested from the tissue culture flasks by incubation with a 0.05% trypsin–EDTA solution (Sigma, St. Louis, MO) for 5 min. After centrifugation and resuspension in phosphate buffered saline (PBS), the cells were injected into the microfluidic channel at a final concentration of 2 × 10⁵ cells per mL. In order to ensure the right conditions for the cell culture medium during the manipulation outside a CO2 incubator, the addition of 20 mM HEPES (Sigma-Aldrich) was made to provide extra buffering capacity.
CAN architecture
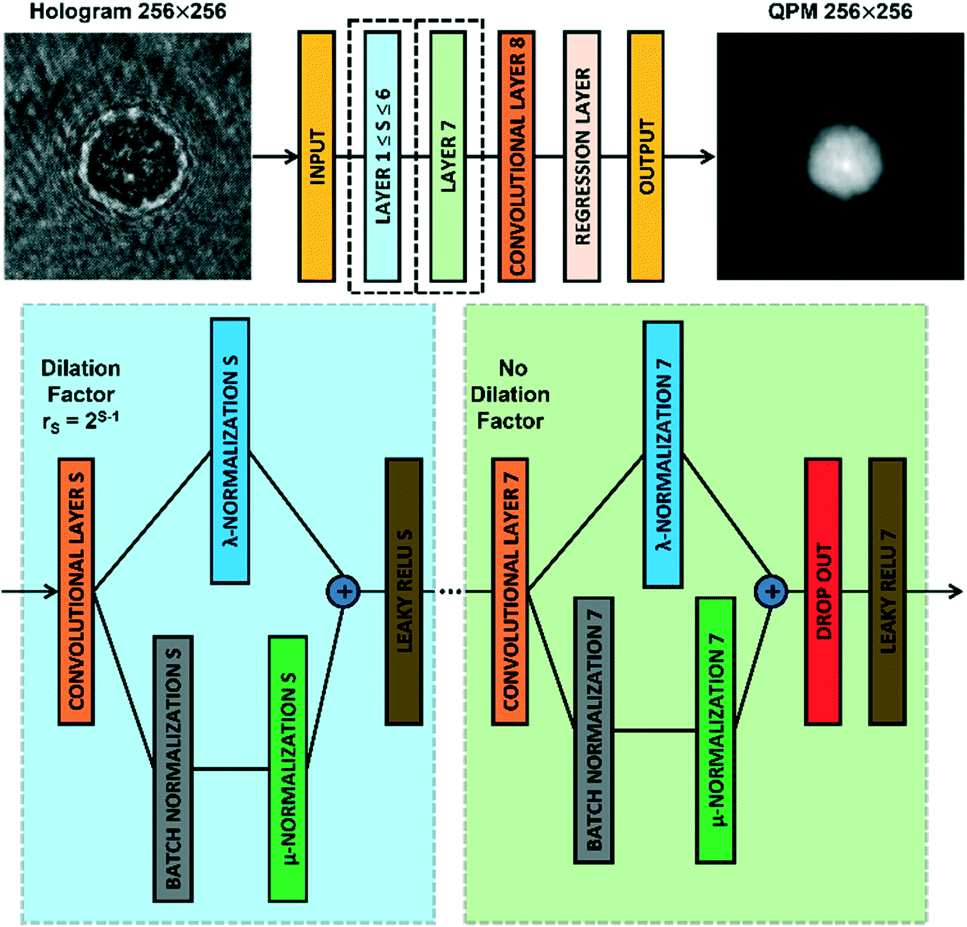
The CAN architecture sketched in Fig. 2 has been trained to reconstruct the QPM from the recorded digital hologram.54 The CAN is a fully convolutional network as the resolution of the input (i.e., M × M) is not changed throughout the layers of the network up to the output layer. The network has a depth d = 8 and all the convolutional layers CLS, with 1 ≤ S ≤ d, have a width w. In particular, the layers CLS, with 1 ≤ S ≤ d − 1, are based on w 3 × 3 kernels and are followed by a Leaky ReLU nonlinearity,59 while the last layer CLd employs w 1 × 1 kernels with no nonlinearity. Let xS be the output of a convolutional layer CLS, with 1 ≤ S ≤ d − 1. The input yS of the successive Leaky ReLU layer is computed through an adaptive normalization process as followswhere BN is the batch normalization operator60 and λS and μS ∈ R are learnable scalar weights. Thanks to the adaptive normalization step, the batch normalization layer is strengthened and the overall model can better approximate the phase retrieval operator. More importantly, the full-resolution intermediate layers allow aggregating the global context of the input image through a multi-scale analysis due to the several dilation factors rS of the convolutional layers CLS. In particular, the dilation factor rS increases as 2S−1 for S = 1, …, d − 2, while the layer CLd−1 has no dilation. Hence, the receptive field expands exponentially with the network's depth, thus including the multi-scale global context despite the compactness of the CAN architecture. In fact, the number of learnable parameters of the model with the described configuration is very low with respect to the tens of millions of parameters of the classical encoder–decoder networks like the U-Net. Furthermore, the network requests a small memory during the forward step because there are no skip connections across non-consecutive layers.61 For these reasons, the CAN model is expected to be accurate (due to aggregation of the multi-scale global context), fast (due to the compactness of the architecture), and particularly suited for on board computing (due to the small memory requested).54 Of course, these three properties depend on the settings of the width w and the input size M. In Table 1, a comparison among different network configurations is reported to identify a suitable trade-off. In fact, the memory occupation increases with the width w, while the prediction time increases with both the width w and the input size M. Obviously, the smallest and fastest configuration is w = 32 and M = 64, which allows reaching a video-rate QPM prediction with a 214 kB memory occupation. However, as shown in Fig. 1B, the whole cell information is contained in a 384 × 384 region of interest (ROI), which means that a downsampling up to 64 × 64 leads to an excessive loss of resolution. On the other hand, the most accurate configuration is w = 128 and M = 512, which however requires megabytes for the memory occupation and seconds for the QPM prediction. Therefore, an intermediate configuration is more suitable with respect to our DH recording system. We choose w = 64 and M = 256, since it allows computing a QPM in 168 ms by occupying only 818 kB of memory (due to just 223183 parameters) with a negligible resolution loss with respect to the original ROI size.
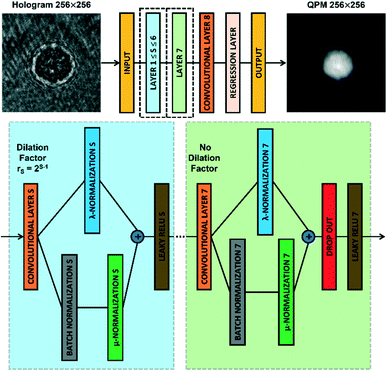 |
| | Fig. 2 CAN model. Sketch of the CAN architecture for the end-to-end prediction of the QPM from the recorded digital hologram. Layers 1–7 are zoomed in the dotted boxes. | |
Table 1 Comparison among different CAN configurations. Prediction times (in milliseconds) obtained by varying the width w (and then the memory occupation) and the input size M. The selected configuration is using italic text for the result
|
|
w = 32 |
w = 64 |
w = 128 |
| 214 kB |
818 kB |
3231 kB |
|
M = 64 |
36 |
43 |
57 |
|
M = 128 |
49 |
69 |
36 |
|
M = 256 |
94 |
168
|
333 |
|
M = 512 |
258 |
547 |
1207 |
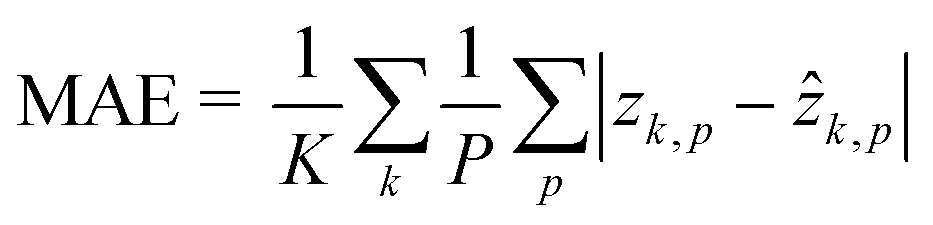
The dataset for training the neural network has been created by considering the NIH-3T3 cell line. For multiple flowing cells, hundreds of 5120 × 5120 holograms have been recorded. For each cell within the FOV, a 384 × 384 ROI has been cropped from the recorded hologram around the cell to preserve all the diffraction information useful for the autofocusing operator. Hence, the corresponding QPM has been computed through the conventional holographic processing. Then, the hologram and the corresponding QPM have been resized to 256 × 256 thus becoming the input and the target of the network, respectively. In particular, the training set and the validation set have been created by randomly selecting respectively 4000 and 1000 images from 100 flowing and rotating cells. To train the network, some hyperparameters have been tuned. In particular, the Leaky ReLU coefficient has been set to 0.2, and a dropout operation has been added to layer 7 with a 0.5 factor to improve the generalization property of the network. Moreover, a mini-batch with 100 observations has been used. Finally, the ADAM optimizer62 has been employed to learn the parameters by minimizing the mean absolute error (MAE)63 computed as follows by the final regression layer
| |  | (3) |
where
K is the number of observations in the mini-batch,
P is the number of pixels
p in an image,
z is an output image, and
ẑ is the corresponding target image.
It is worth noting that, in addition to the input size M and the width w, the performances of the CAN also depend on the setting of the depth d. To select the best d, a mini-training of the network has been repeated at different depth values, i.e. the training of the network realized for 50 epochs with a quarter of the overall dataset and a mini-batch made of 25 observations. The original CAN architecture was demonstrated to obtain the best results with d = 9 in approximating image processing operators.54 Instead, in our phase retrieval problem we fixed d = 8 in order to avoid the too large dilation factor r7 = 64 (instead of the maximum r6 = 32 in the d = 8 case) that could have caused excessive smoothing of the QPM output at the cost of even more parameters.
Results
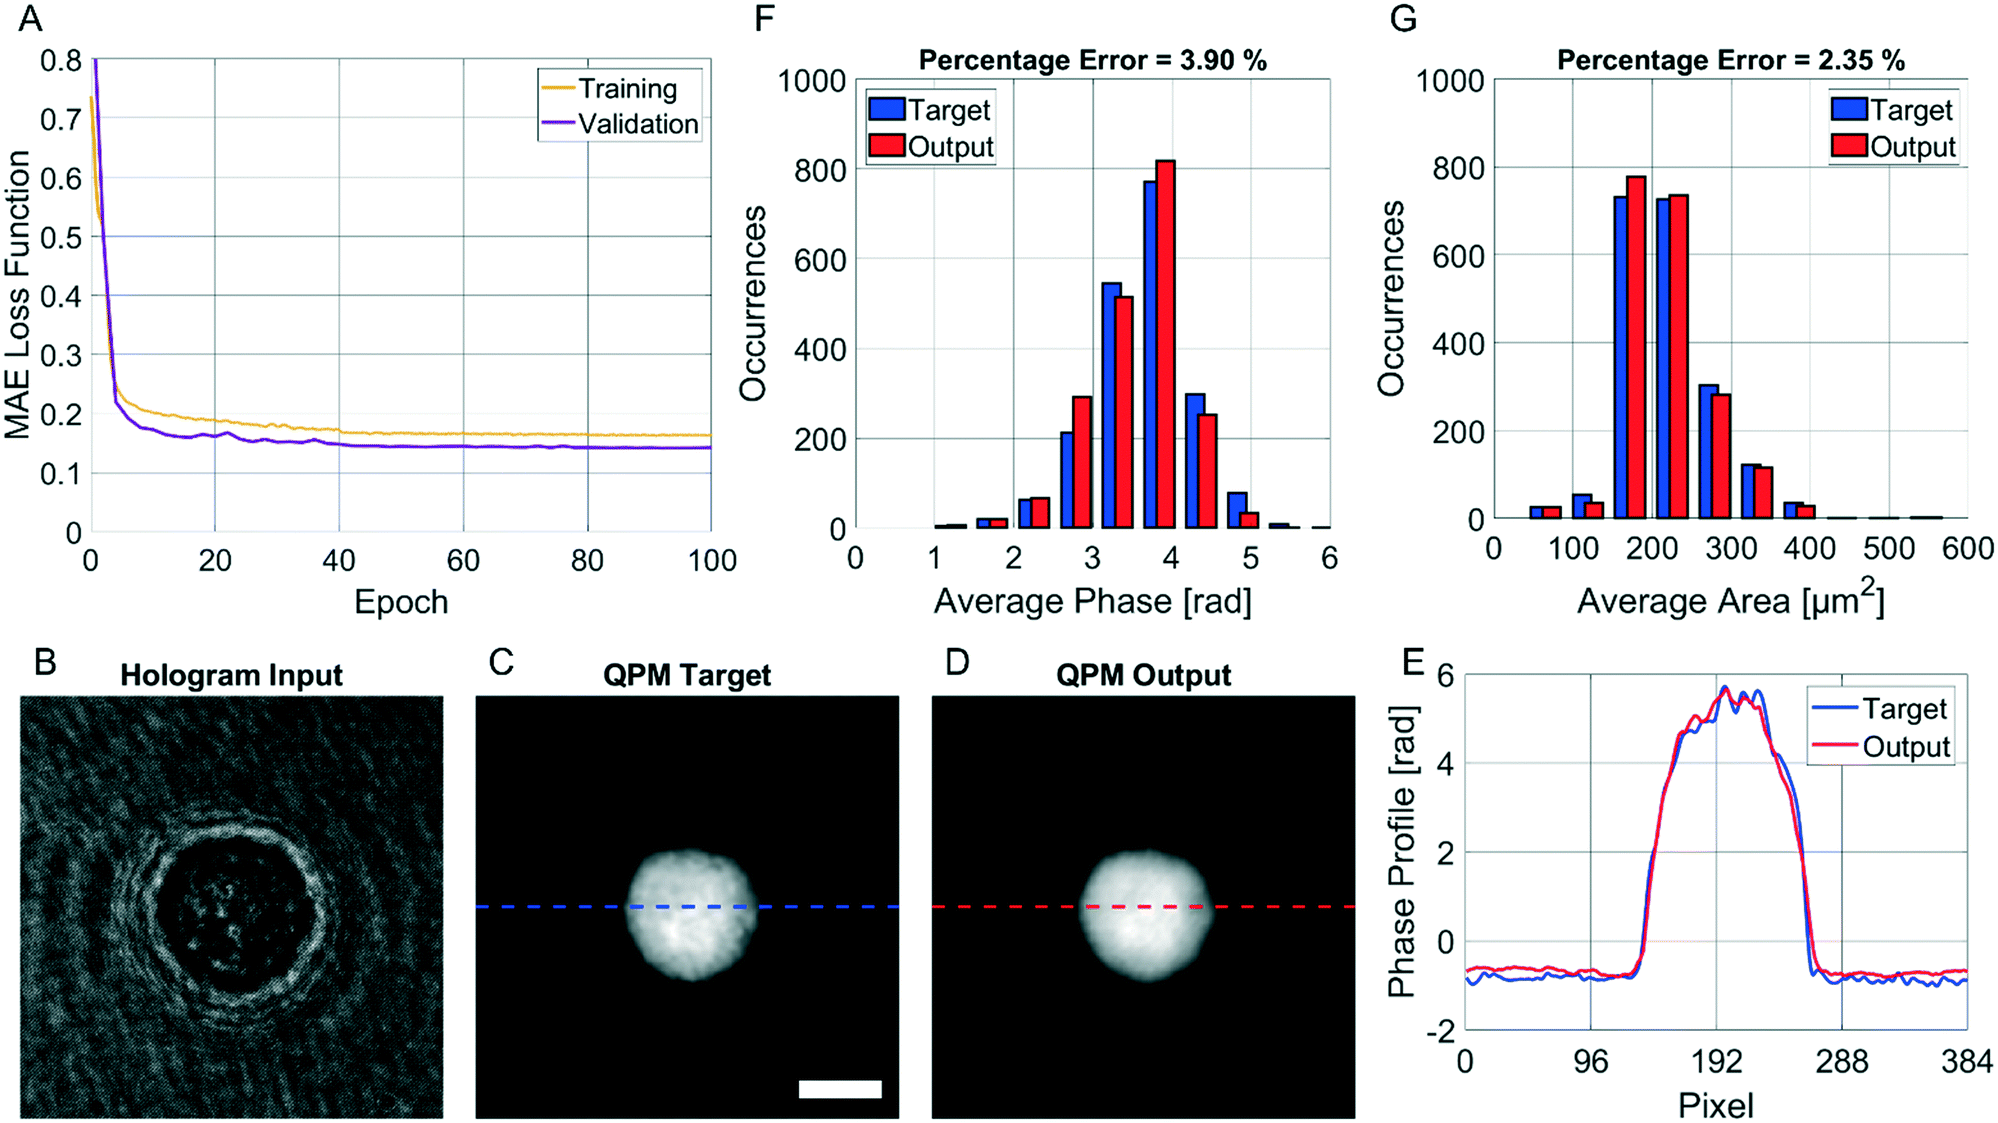
The CAN model has been trained for 100 epochs by using an Intel® Core™ i9-9900K CPU with a 64Gb RAM through the Matlab® 2021a environment. The training step has required about 92 h. However, as shown in Fig. 3A, the loss function curves of both the training and validation sets drop quickly after a few epochs, and they saturate at around the 50th epoch. Therefore, the training time can be safely halved. The correctness in the QPM restoration has been evaluated by computing the structural similarity index measure (SSIM)64 between the target QPM and the predicted QPM reported at the original 384 × 384 size. In particular, the trained CAN model allows reaching a 0.962 ± 0.013 accuracy measured over the 4000 images of the training set and a 0.961 ± 0.015 accuracy measured for the 1000 images of the validation set. Moreover, a test set has been created by randomly selecting other 2000 images (not used to feed the network during the training step), achieving a 0.961 ± 0.013 accuracy, thus indicating the substantial generalization capability of this network. In Fig. 3B–D we show an observation belonging to the test set, made of the input (i.e., the holographic ROI), the target (i.e., the QPM obtained by the standard processing), and the output (i.e., the QPM computed by the network), respectively, in which an average SSIM of 0.961 is obtained. Besides the numerical assessment of the regression performance, a comparison between phase profiles is also reported in Fig. 3E. This clearly shows the proficiency of the CAN in the realm of DH to preserve not only the mere cell morphology, but also the quantitative content of its 2D phase-contrast map. It is worth remarking that such a process is also very fast. In fact, the trained model takes about 0.17 seconds to get from the hologram the unwrapped QPM. In contrast, by the conventional holographic process, the same operation takes about 7.71 seconds, which is notably longer (i.e. about 45 times).
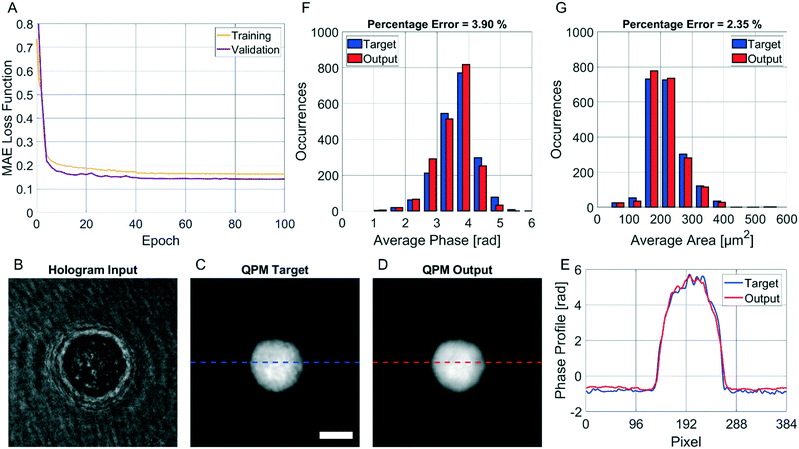 |
| | Fig. 3 Assessment of the QPM reconstruction by deep learning. (A) MAE loss function computed at different epochs from the training set (yellow) and the validation set (violet). (B–D) Input, target, and output, respectively, of the trained CAN model containing a test cell. The SSIM between the target and the output is 0.961. The scale bar is 10 μm. (E) Phase profiles of the QPM target (blue) and QPM output (red) selected from the lines highlighted in C and D, respectively. (F and G) Comparison between the histograms of the average phase and the average area, respectively, computed from the QPM targets (blue) and the QPMs outputs (red) of each cell belonging to the test set. The percentage error between the measured features is reported at the top. | |
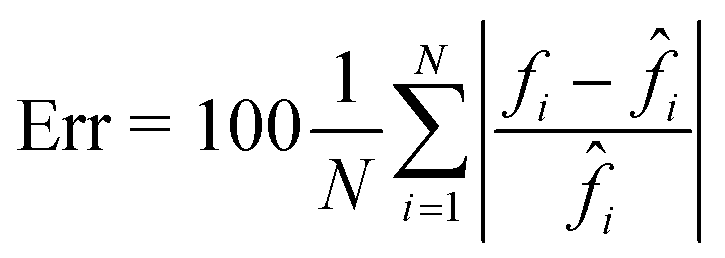
This property is crucial in flow cytometry systems, since it allows analysing a much larger number of cells in the same time-period, thus enabling statistically relevant studies about specific cell populations. In fact, from the QPMs, 2D label-free features can be measured for diagnostic purposes.5–17 As a consequence, a further way to validate the architecture we propose consists of checking whether the QPM outputs lead to the same features that would be measured from the corresponding QPM targets. To this aim, the 2000 cells belonging to the test set have been segmented from the background within the QPMs. The average phase and the average area have been computed for each cell in both the target and the output cases, and the corresponding histograms are compared in Fig. 3F and G, respectively. To quantify the matching between the histograms, the percentage error has been computed as follows
| |  | (4) |
where
N is the number of observations,
f is a feature computed from the output image, and
![[f with combining circumflex]](https://www.rsc.org/images/entities/i_char_0066_0302.gif) i
i is the same feature computed from the corresponding target image. In the case of the average cell phase, we obtained a 3.90% error, while in the case of the average cell area, we obtained a 2.35% error.
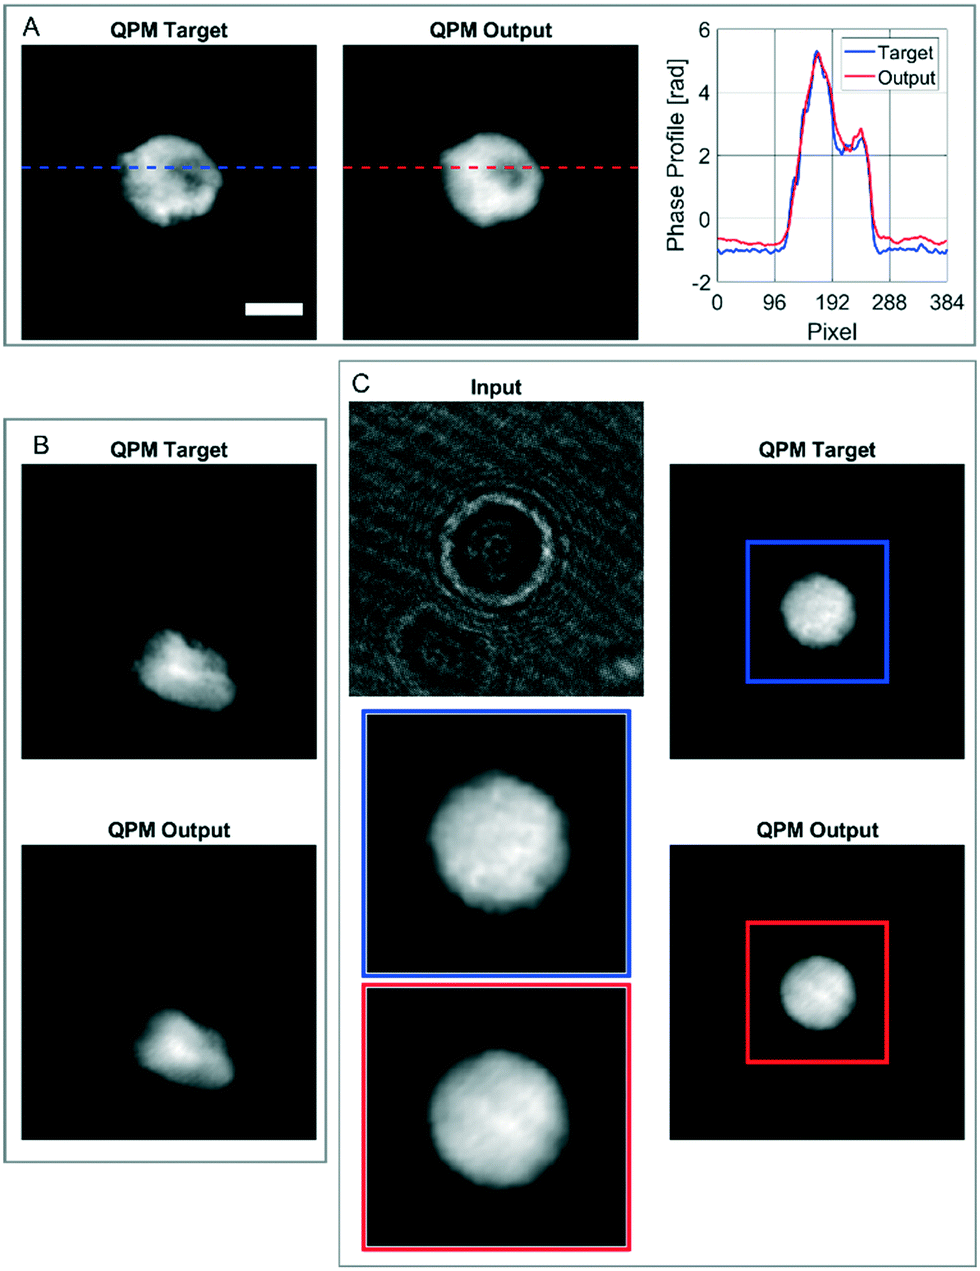
Performances of the trained network in non-conventional cases
In order to further assess the performances of the CAN architecture in correctly reconstructing the QPM, here we show some particular cases in which the network works surprisingly well, thus supporting its generalization property. In fact, the model has been trained by using single live spherical-like cells centred in their ROIs, as shown in Fig. 3B–D. An example is reported in Fig. 4A, in which the phase-contrast maps of a dead cell are shown after reconstruction with the conventional method and the proposed one. A healthy cell has a convex phase profile, while a dead cell loses its content thus resulting in an internal phase concavity.65 The phase profiles plotted in Fig. 4A highlight that the network prediction is accurate in reproducing also the phase concavity, even though the network model had never received this kind of image as an example during the training step. Moreover, as the cells are suspended in the microfluidic flow, they usually have a spherical shape. However, when the cell suffers from stress conditions, it could exhibit a distorted shape, and the reconstruction architecture should be able to reproduce it in order to be reliable for diagnostics. Remarkably, also in this case the network correctly predicts the QPM, as shown in Fig. 4B. It is worth remarking that, besides not being spheroid-like shaped, the cell in Fig. 4B is not centred in its ROI, unlike all the cells used in the training set. Finally, in the case reported in Fig. 4C, the network is even able to exceed the performances of the standard processing. In fact, in this case the presence of a severely out-of-focus object near the analysed cell and overlapping with its ROI perturbs the minimization of the TC in the autofocusing process, thus resulting in a wrong estimation of the focal distance.
 |
| | Fig. 4 Assessment of the CAN performances in some particular cases. (A) QPM target and QPM output of a dead cell, with the phase profile corresponding to the highlighted lines. (B) QPM target and QPM output of a distorted cell, not centred in its ROI. (C) Input, QPM target, and QPM output of a cell not refocused well by the standard holographic processing (blue box), but rightly refocused by the CAN network (red box). The scale bar is 10 μm. | |
This is clearly visible in Fig. 4C, where the zoomed QPM target shows residual diffraction rings near the cell contour, i.e. the cell is incorrectly returned out-of-focus by the conventional method. Instead, as displayed in the zoomed QPM output, the proposed network is able to accurately refocus the cell. The highlighted special cases, in addition to the results reported in the previous section, underline that the network has learned the right mathematical operator that converts a hologram into the corresponding QPM.
3D tomographic imaging
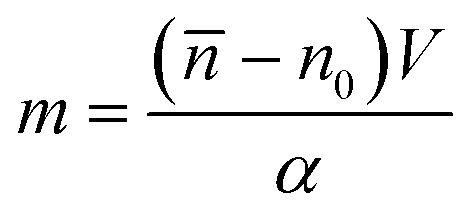
It is well known that phase-contrast values can be interpreted as the integral of the refractive index (RI) contrast along the optical axis. Therefore, in a QPM, the information about the 3D RI spatial distribution and that about the 3D morphology are coupled in the same 2D image.4 Starting from the different QPMs recorded at multiple viewing angles around the flowing and rolling cell, this two information can be decoupled, thus permitting the reconstruction of the corresponding 3D RI tomogram.23 In tomographic flow cytometry (TFC), the sample rotation is exploited while keeping the light probe and the optical system fixed. Thus, one of the main advantages of TFC with respect to the more conventional holographic tomography techniques is its potentially higher throughput. However, so far, this property has not been exploited in full, because the heavy computational burden of holographic processing turns up to significantly slow down the tomographic reconstruction, thus leading to very few cells as the output of each TFC experiment. In fact, to reconstruct the 3D tomogram of each cell, on average more than 200 holographic ROIs must be processed to obtain the corresponding QPMs. To test the potentiality of the proposed network in the TFC framework, we have reconstructed 65 tomograms by using both the standard and the DCNN based approaches to recover the QPMs. In particular, 65 cells correspond to 14462 recorded holograms, whose QPM retrieval takes about 31 hours by using the standard processing and only 41 minutes by exploiting the CAN model, i.e. the CAN inference can do the same task using only the 2% of the time required for the conventional method. In Fig. 5A we show the central slices of the 3D RI tomograms of the same cell, respectively reconstructed from the QPMs obtained in the standard processing modality and through the proposed network. A great similarity has been reached, as also underlined by the good agreement between the RI profiles reported in Fig. 5B. A further proof is the high symmetry of the corresponding RI violin histogram in Fig. 5C, which is a visual representation of the 0.997 SSIM computed between the two tomograms. As well as in the 2D case, also in the 3D case it is important to preserve the truthfulness of the statistical measurements, especially their adherence to the quantitative ground-truth. To this aim, in Fig. 5D and E we report the histograms of the average RI and the equivalent radius (i.e., the radius of a sphere having the same volume of the analysed cell) calculated for the 65 reconstructed tomograms, where 0.07% and 0.70% percentage errors are obtained, respectively. An important quantitative feature that can be inferred from the 3D RI tomogram is the dry mass.66
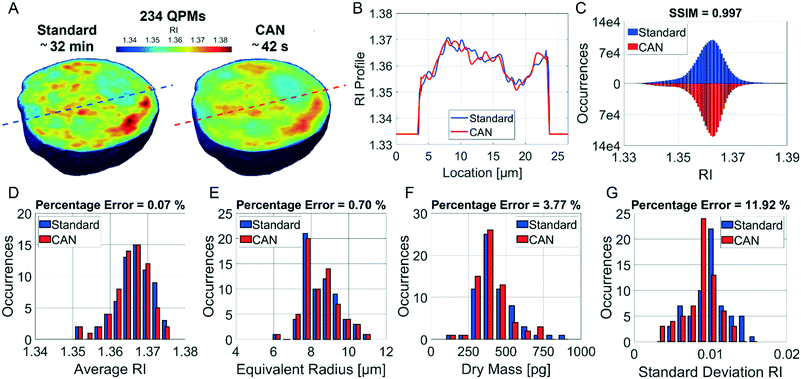 |
| | Fig. 5 Assessment of the tomographic reconstruction by deep learning. (A) Central slice of the 3D RI tomogram reconstructed from 234 QPMs retrieved (on the left) in the standard way in about 32 min and (on the right) by the CAN model in about 42 s. (B) RI profile corresponding to the lines highlighted in A from the standard tomogram (blue) and the CAN tomogram (red). (C) Violin histogram of the 3D RI distribution about the standard tomogram (blue) and the CAN tomogram (red) in A, in which the SSIM is reported at the top. (D–G) Comparison between the histograms of the average RI, the equivalent radius, the dry mass, and the standard deviation RI, respectively, computed from 65 standard tomograms (blue) and CAN tomograms (red). The percentage error between the measured features is reported at the top. | |
It is defined as the mass of the cell in the absence of water content, i.e.
| |  | (5) |
where
![[n with combining macron]](https://www.rsc.org/images/entities/i_char_006e_0304.gif)
is the cell average RI,
n0 is the RI of the surrounding medium,
V is the cell volume, and
α is the RI increment, which is 0.2 mL g
−1 for a nucleated cell.
67 The dry mass can be considered a bioindicator of the health state of the cell as it is related to its biophysical properties. Therefore, the fast and accurate quantification of the dry mass for a large number of cells could encourage further developments of TFC-based diagnostic applications in biomedicine.
68 For this reason, the low percentage error of 3.77% obtained in the case of the dry mass reported in
Fig. 5F by using the CAN architecture acquires even more importance. As a counterweight to the abovementioned advantages of the reported results, a limitation can be recognized in the partial loss of internal RI contrast. This effect is clearly visible in the central slice comparison in
Fig. 5A, and is quantified as a percentage error of 11.92% about the RI standard deviation in
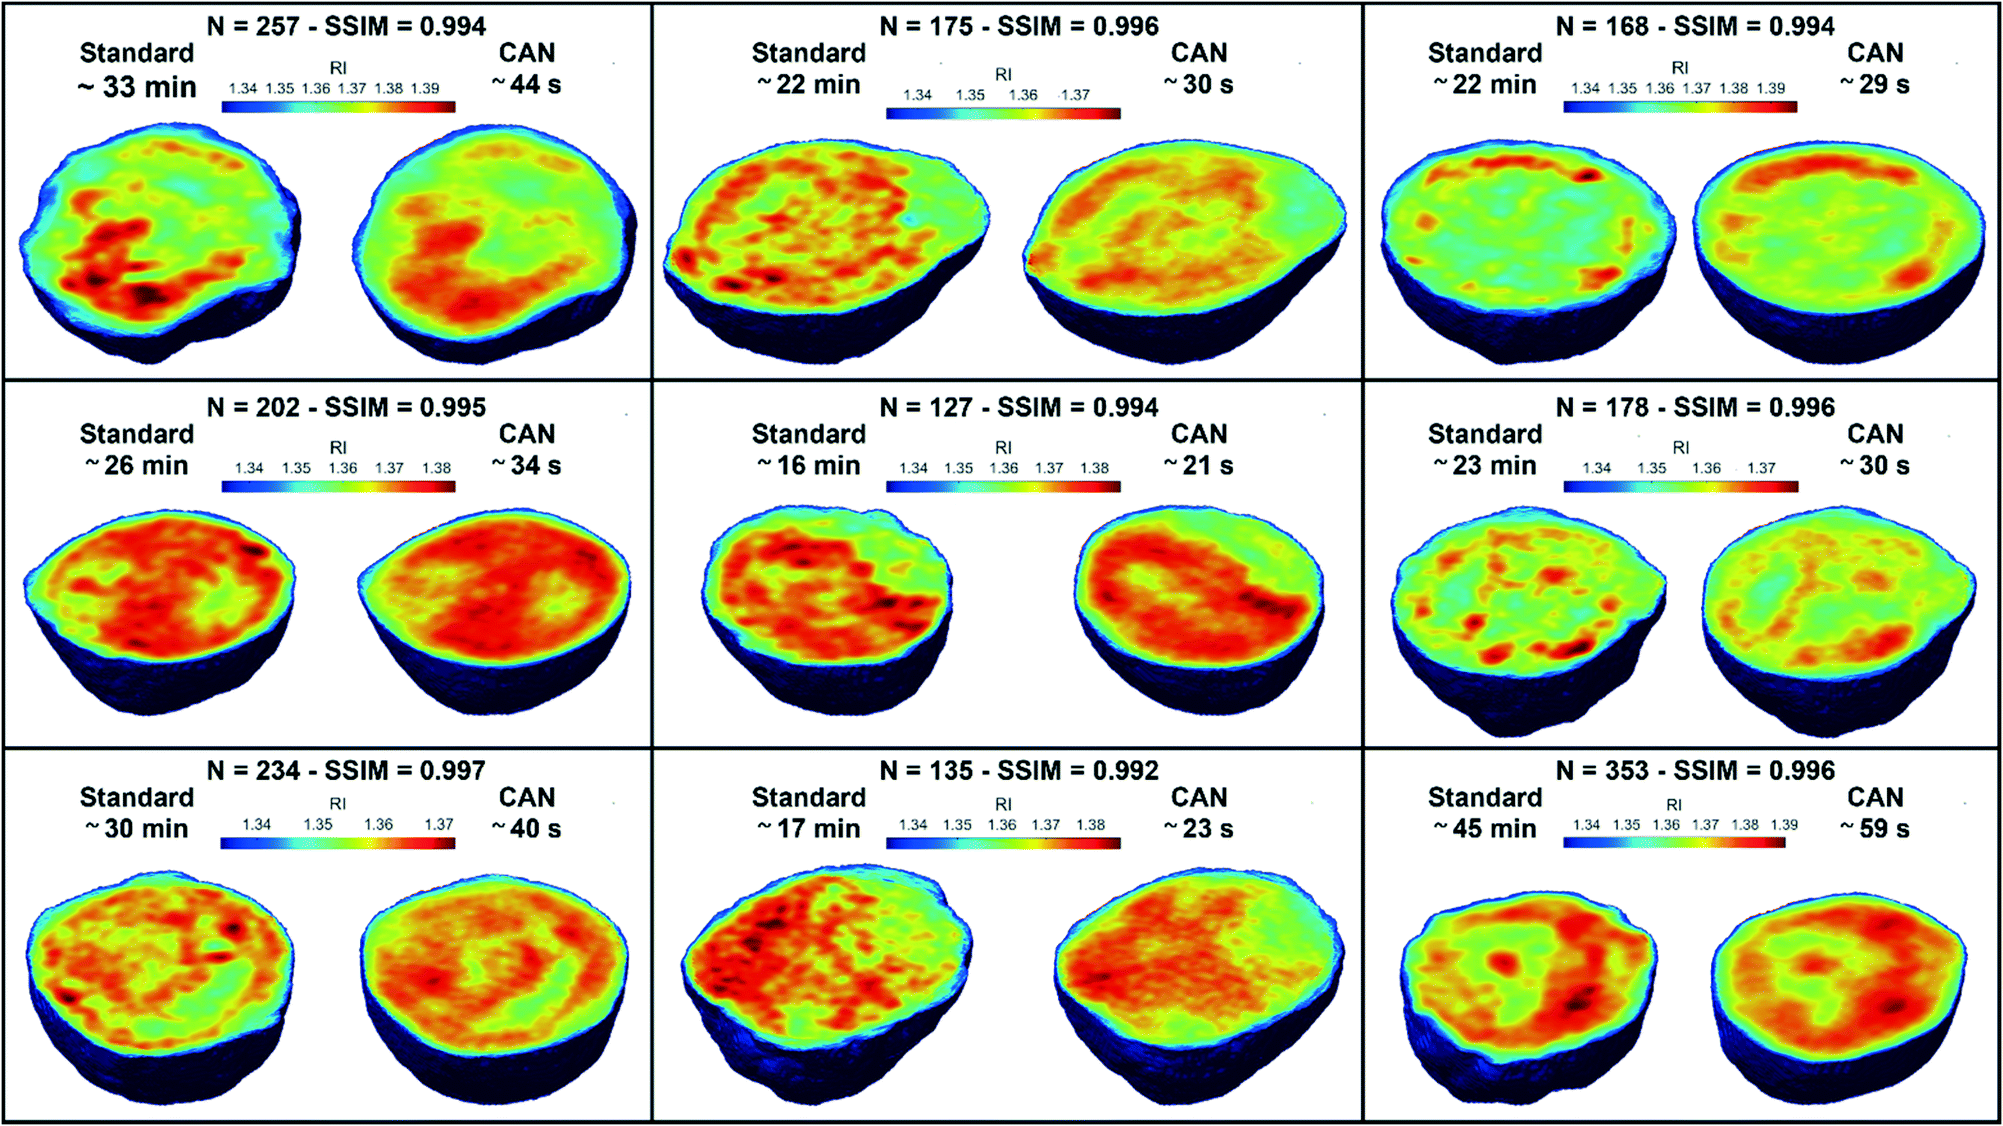
Fig. 5G, where we notice a shift to lower values of the histogram obtained from DCNN processing with respect to the standard one. Finally, 9 3D RI tomograms are reported in
Fig. 6 to show a greater variety of cases about the typical tomographic performances in terms of both reproducibility and computational time. In order to assess the ability of the network to preserve high frequency features, in
Fig. 7 we analyze an NIH-3T3 cell in which LDs are clearly visible inside and distinguishable from the surrounding cytoplasm. In fact, in the QPM target shown in
Fig. 7A, two LDs can be recognized at the highest phase values. The same LDs can be equally well observed in the corresponding QPM output in
Fig. 7B, even if with a slightly reduced contrast, as shown in the phase profile reported in
Fig. 7C. As a consequence, the same property can be found in the corresponding 3D case in
Fig. 7D–F. In particular, the two LDs are well defined at the highest RIs in the standard tomogram in
Fig. 7D. Instead, they become more widespread in the CAN tomogram in
Fig. 7E, as can be also inferred from the RI profiles reported in
Fig. 7F. However, despite the loss of contrast, both
Fig. 7E and F point out that LDs can be segmented even in the 3D RI tomogram reconstructed through the neural network.
69 Moreover, the SSIM between the two tomograms is very high (
i.e., 0.996), thus confirming that the global content is preserved and only the fine details at the high frequencies are lost. Therefore, the 11.92% error in
Fig. 5G can be related to the loss of details (
i.e., high frequencies) due to the employment of the network, which partially limits an intracellular analysis. However, in
Fig. 5D–F the CAN architecture has been demonstrated to provide a fast and accurate measurement of the global cellular features from the 3D RI tomograms, which can be exploited for diagnostic purposes in on-chip implementations.
68 Therefore, using the network output or the result of the conventional pipeline would provide similar results in terms of global features and thus the same diagnostic response.
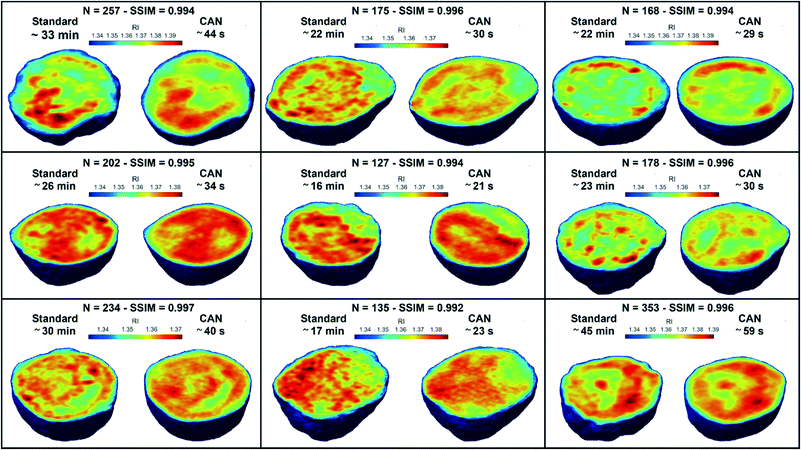 |
| | Fig. 6 3D tomographic reconstructions. Comparison between the central slices of 9 3D RI tomograms reconstructed by using the QPMs obtained through the standard holographic processing (on the left) and the CAN model (on the right). For each cell, the number of QPMs, the SSIM between the tomograms, and the computational time of the standard phase retrieval and the CAN-based phase retrieval are reported at the top. | |
 |
| | Fig. 7 Assessment of the CAN performances in visualizing intracellular LDs. (A and B) QPM target and QPM output, respectively, with two LDs visible at the highest phase values. The scale bar is 5 μm. (C) Phase profile of the QPM target (blue) and QPM output (red) selected from the lines highlighted in A and B, respectively, passing through LDs. (D and E) Central slice of the 3D RI tomogram reconstructed by the standard method and the CAN method, respectively, with two LDs visible at the highest RI values. The SSIM between the tomograms is reported below. (F) RI profile corresponding to the lines highlighted in D and E from the standard tomogram (blue) and the CAN tomogram (red), respectively, passing through LDs. | |
In order to analyze a possible diagnostic application, in Fig. 8 we assess the ability of the network to preserve the 3D morphological differences between a healthy cell and a distorted cell. The QPM target and the QPM output of the distorted cell shown in Fig. 4B have been used to reconstruct the corresponding standard and CAN tomograms, respectively. The 3D shape of the distorted cell obtained through the standard method in Fig. 8A is very similar to the corresponding one obtained through the CAN method in Fig. 8B. Moreover, the 3D shape of the distorted cell is significantly different from the quasi-spherical shape of a healthy cell shown in Fig. 8C and D, obtained from the standard and CAN tomograms, respectively. An example of a quantitative descriptor of the 3D morphology is the sphericity, which is 1 in the case of a perfect spherical cell, otherwise less than 1 in the case of a non-spherical cell. In fact, it is defined as the ratio between the surface area of a sphere having the same volume of the analyzed cell and the surface area of the cell. The box plot in Fig. 8E regarding the sphericity of the standard and CAN tomograms of 65 healthy cells allows us to quantify the 3D morphological similarity between the standard and CAN shapes. The slightly greater median value and the smaller standard deviation of the CAN sphericity, with respect to the standard one, can be explained again with the loss of details about the external surface introduced by the DCNN (see Fig. 8A–D) that leads to smaller surface areas. However, the red asterisks in Fig. 8E point out that the 3D morphological difference between the distorted and healthy cells can be easily recognized also in the CAN case, thus preserving the diagnostic potentiality of the TFC tool.
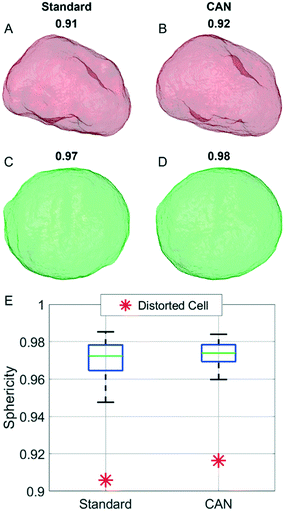 |
| | Fig. 8 Assessment of the CAN performances in discerning between healthy and distorted cells. (A and B) External shape of the 3D RI tomogram of a distorted cell reconstructed by the standard method and the CAN method, respectively. (C and D) External shape of the 3D RI tomogram of a healthy cell reconstructed by the standard method and the CAN method, respectively. In A–D, the sphericity is reported at the top. (E) Box plot of the sphericity of the standard and CAN tomograms of 65 healthy cells compared to the sphericity of the distorted cell in A and B (red asterisks). | |
In summary, a trade-off between high speed/small memory and high-frequency preservation exists. To enhance the high-frequency content of the QPM output for enabling an intracellular analysis, the CAN width w should be increased (see the analysis in the ESI† and in Fig. S1), but at the cost of a greater number of parameters. In such a case, with the same hardware resources, the training and the prediction time would become longer, and the network would require a bigger memory occupation, as discussed in Table 1. Therefore, this means that the width of the network must be tuned according to the specifications of the tool to be implemented.
Conclusions
In this paper we have proposed a DCNN to reach very fast processing in obtaining tomographic reconstruction of flowing and rotating cells in a holographic flow cytometry system. In particular, we have implemented, for the first time in holographic imaging, a suitable DCNN architecture, namely the CAN, able to guarantee high prediction accuracy, constant runtime and very low memory usage. In fact, by investigating the trade-off among the aforementioned properties, we have allowed the computing of a single QPM in 168 ms, with a negligible loss of details and with a trained model that occupies only 818 kB of memory. By employing the proposed DCCN based reconstruction method on a sequence of QPMs of the same rotating cell, we have demonstrated the possibility to recover its tomogram in a few seconds instead of tens of minutes, while essentially preserving the high-content information of tomographic data.
The reported results point out very good agreement between data measured using the conventional DH processing and the quantitative parameters measured from the network output, substantially showing their equivalence for diagnostic purposes. Besides, the network has been demonstrated to be able to outperform the conventional DH processing in all the cases where the presence of multiple objects within the same ROI can determine a failure of the autofocusing algorithms. The proposed DCNN model provides enough compactness and computing velocity to fit into on-chip SRAM, opening the possibility of performing onboard computations, which is a highly demanded property for lab-on-chip devices with low processing hardware resources.
Author contributions
D. S., L. M., and V. B. set the holographic flow cytometry system and were responsible for the holographic acquisitions; M. M. prepared the biological samples and contributed to the experiments; D. P. was in charge of the data analysis and numerical results. All the authors contributed to critical discussion of the results and contributed to writing of the manuscript. P. M. and P. F. conceptualized and supervised the research.
Conflicts of interest
There are no conflicts to declare.
Acknowledgements
This work was funded by project PRIN 2017, Morphological Biomarkers for early diagnosis in Oncology (MORFEO) Prot. 2017N7R2CJ.
References
-
P. Ferraro, A. Wax and Z. Zalevsky, Coherent Light Microscopy, Springer Series in Surface Sciences, Springer, 2011, vol. 46 Search PubMed.
- M. K. Kim, SPIE Rev., 2010, 1, 018005 Search PubMed.
- Y. Cotte, F. Toy, P. Jourdain, N. Pavillon, D. Boss, P. Magistretti, P. Marquet and C. Depeursinge, Nat. Photonics, 2013, 7, 113–117 CrossRef CAS.
- Y. K. Park, C. Depeursinge and G. Popescu, Nat. Photonics, 2018, 12, 578–589 CrossRef CAS.
- B. Kemper, D. D. Carl, J. Schnekenburger, I. Bredebusch, M. Schäfer, W. Domschke and G. von Bally, J. Biomed. Opt., 2006, 11, 034005–034008 CrossRef PubMed.
- Z. El-Schich, A. L. Mölder and A. Gjörloff Wingren, Appl. Sci., 2018, 8(7), 1027 CrossRef.
- A. V. Belashov, A. A. Zhikhoreva, T. N. Belyaeva, A. V. Salova, E. S. Kornilova, I. V. Semenova and O. S. Vasyutinskii, Cell, 2021, 10, 2587 CrossRef PubMed.
- S. Cho, S. Kim, Y. Kim and Y. K. Park, Trends Biotechnol., 2011, 30(2), 71–79 CrossRef PubMed.
- F. Yi, I. Moon and B. Javidi, Biomed. Opt. Express, 2016, 7, 2385–2399 CrossRef PubMed.
- L. Miccio, P. Memmolo, F. Merola, P. A. Netti and P. Ferraro, Nat. Commun., 2015, 6, 6502 CrossRef CAS PubMed.
- M. Mugnano, P. Memmolo, L. Miccio, F. Merola, V. Bianco, A. Bramanti, A. Gambale, R. Russo, I. Andolfo, A. Iolascon and P. Ferraro, Anal. Chem., 2018, 90, 7495–7501 CrossRef CAS PubMed.
- P. Lenz, D. Bettenworth, P. Krausewitz, M. Brückner, S. Ketelhut, G. von Bally, D. Domagk and B. Kemper, Integr. Biol., 2013, 5, 624–630 CrossRef PubMed.
- Y. Park, M. Diez-Silva, G. Popescu, G. Lykotrafitis, W. Choi, M. S. Feld and S. Suresh, Proc. Natl. Acad. Sci. U. S. A., 2008, 105, 13730–13735 CrossRef CAS PubMed.
- T. O'Connor, J.-B. Shen, B. T. Liang and B. Javidi, Opt. Lett., 2021, 46, 2344–2347 CrossRef PubMed.
- N. Goswami, Y. R. He, Y.-H. Deng, C. Oh, N. Sobh, E. Valera, R. Bashir, N. Ismail, H. Kong, T. H. Nguyen, C. Best-Popescu and G. Popescu, Light: Sci. Appl., 2021, 10, 176 CrossRef CAS PubMed.
- P. Memmolo, L. Miccio, M. Paturzo, G. Di Caprio, G. Coppola, P. A. Netti and P. Ferraro, Adv. Opt. Photonics, 2015, 7, 713–755 CrossRef.
- L. ShenemanI, G. Stephanopoulos and A. E. Vasdekis, PLoS One, 2021, 16(4), e0249196 CrossRef PubMed.
- V. Balasubramani, A. Kuś, H.-Y. Tu, C.-J. Cheng, M. Baczewska, W. Krauze and M. Kujawińska, Appl. Opt., 2021, 60, B65–B80 CrossRef PubMed.
- D. Jin, R. Zhou, Z. Yaqoob and P. T. C. So, J. Opt. Soc. Am. B, 2017, 34, B64–B77 CrossRef CAS PubMed.
- H. Zhu, S. O. Isikman, O. Mudanyali, A. Greenbauma and A. Ozcan, Lab Chip, 2013, 13, 51–67 RSC.
- F. Merola, P. Memmolo, L. Miccio, V. Bianco, M. Paturzo and P. Ferraro, Proc. IEEE, 2015, 103(2), 192–204 CAS.
- V. Bianco, B. Mandracchia, V. Marchesano, V. Pagliarulo, F. Olivieri, S. Coppola, M. Paturzo and P. Ferraro, Light: Sci. Appl., 2017, 6, e17055 CrossRef CAS PubMed.
- F. Merola, P. Memmolo, L. Miccio, R. Savoia, M. Mugnano, A. Fontana, G. D'Ippolito, A. Sardo, A. Iolascon, A. Gambale and P. Ferraro, Light: Sci. Appl., 2017, 6, e16241 CrossRef CAS PubMed.
- F. Merola, P. Memmolo, L. Miccio, M. Mugnano and P. Ferraro, Methods, 2018, 136, 108–115 CrossRef CAS PubMed.
- M. M. Villone, P. Memmolo, F. Merola, M. Mugnano, L. Miccio, P. L. Maffettone and P. Ferraro, Lab Chip, 2018, 18, 126–131 RSC.
- N. C. Pégard, M. L. Toth, M. Driscoll and J. W. Fleischer, Lab Chip, 2014, 14, 4447–4450 RSC.
- D. Pirone, P. Memmolo, F. Merola, L. Miccio, M. Mugnano, A. Capozzoli, C. Curcio, A. Liseno and P. Ferraro, Appl. Opt., 2021, 60, A277–A284 CrossRef PubMed.
- A. Kleiber, D. Kraus, T. Henkel and W. Fritzsche, Lab Chip, 2021, 21, 3655–3666 RSC.
- L. Miccio, F. Cimmino, I. Kurelac, M. M. Villone, V. Bianco, P. Memmolo, F. Merola, M. Mugnano, M. Capasso, A. Iolascon, P. L. Maffettone and P. Ferraro, View, 2020, 1, 20200034 CrossRef.
- D. Pirone, M. Mugnano, P. Memmolo, F. Merola, G. C. Lama, R. Castaldo, L. Miccio, V. Bianco, S. Grilli and P. Ferraro, Nano Lett., 2021, 21(14), 5958–5966 CrossRef CAS PubMed.
- Z. Wang, V. Bianco, D. Pirone, P. Memmolo, M. M. Villone, P. L. Maffettone and P. Ferraro, Light: Sci. Appl., 2021, 10, 187 CrossRef CAS PubMed.
- P. Memmolo, V. Renò, E. Stella and P. Ferraro, Appl. Opt., 2019, 58, G155–G161 CrossRef PubMed.
- T. Latychevskaia, J. Opt. Soc. Am. A, 2019, 36, D31–D40 CrossRef CAS PubMed.
- S. K. Mohammed, L. Bouamama, D. Bahloul and P. Picart, Appl. Opt., 2017, 56, F158–F166 CrossRef PubMed.
- C. Trujillo, R. Castañeda, P. Piedrahita-Quintero and J. Garcia-Sucerquia, Appl. Opt., 2016, 55, 10299–10306 CrossRef PubMed.
- W. Zhou, Y. Yu and A. Asundi, Opt. Lasers Eng., 2009, 47(2), 264–270 CrossRef.
- J. Bioucas-Dias, V. Katkovnik, J. Astola and K. Egiazarian, Appl. Opt., 2008, 47, 5358–5369 CrossRef PubMed.
- S. Montrésor, P. Memmolo, V. Bianco, P. Ferraro and P. Picart, J. Opt. Soc. Am. A, 2019, 36, A59–A66 CrossRef PubMed.
- G. Barbastathis, A. Ozcan and G. Situ, Optica, 2019, 6, 921–943 CrossRef.
- Y. Rivenson, Y. Wu and A. Ozcan, Light: Sci. Appl., 2019, 8, 85 CrossRef PubMed.
- Z. Ren, Z. Xu and E. Y. Lam, Optica, 2018, 5, 337–344 CrossRef.
- K. Jaferzadeh, S.-H. Hwang, I. Moon and B. Javidi, Biomed. Opt. Express, 2019, 10, 4276–4289 CrossRef PubMed.
- T. Pitkäaho, A. Manninen and T. J. Naughton, Appl. Opt., 2019, 58, A202–A208 CrossRef PubMed.
-
O. Ronneberger, P. Fischer and T. Brox, U-net: Convolutional networks for biomedical image segmentation, in International Conference on Medical Image Computing and Computer-Assisted Intervention, 2015, pp. 234–241 Search PubMed.
- T. Nguyen, V. Bui, V. Lam, C. B. Raub, L.-C. Chang and G. Nehmetallah, Opt. Express, 2017, 25, 15043–15057 CrossRef PubMed.
-
K. He, X. Zhang, S. Ren and J. Sun, Deep residual learning for image recognition, in IEEE Conference on Computer Vision and Pattern Recognition, 2016, pp. 770–778 Search PubMed.
- W. Xiao, L. Xin, R. Cao, X. Wu, R. Tian, L. Che, L. Sun, P. Ferraro and F. Pan, Lab Chip, 2021, 21(7), 1385–1394 RSC.
- G. Dardikman-Yoffe, D. Roitshtain, S. K. Mirsky, N. A. Turko, M. Habaza and N. T. Shaked, Biomed. Opt. Express, 2020, 11, 1107–1121 CrossRef PubMed.
- Y. Rivenson, Y. Zhang, H. Günaydın, D. Teng and A. Ozcan, Light: Sci. Appl., 2018, 7, 17141 CrossRef CAS PubMed.
- H. Wang, M. Lyu and G. Situ, Opt. Express, 2018, 26, 22603–22614 CrossRef PubMed.
- Z. Ren, Z. Xu and E. Y. Lam, Adv. Photonics, 2019, 1(1), 016004 Search PubMed.
- K. Wang, J. Dou, Q. Kemao, J. Di and J. Zhao, Opt. Lett., 2019, 44, 4765–4768 CrossRef PubMed.
- T. Zeng, H. K.-H. So and E. Y. Lam, Opt. Express, 2020, 28, 4876–4887 CrossRef PubMed.
-
Q. Chen, J. Xu and V. Koltun, Fast Image Processing with Fully-Convolutional Networks, in Proceedings of the 2017 IEEE Conference on Computer Vision, 2017, pp. 2516–2525 Search PubMed.
-
F. Yu and V. Koltun, Multi-scale context aggregation by dilated convolutions, in International Conference on Learning Representations, 2016 Search PubMed.
-
S. Han, H. Mao and W. J. Dally, Deep compression: Compressing deep neural networks with pruning, trained quantization and Huffman coding, in International Conference on Learning Representations, 2016 Search PubMed.
- Q. Kemao, Appl. Opt., 2004, 43, 2695–2702 CrossRef PubMed.
- J. Bioucas-Dias and G. Valadão, IEEE Trans. Image Process., 2007, 16, 698–709 Search PubMed.
-
A. L. Maas, A. Y. Hannun and A. Y. Ng, Rectifier nonlinearities improve neural network acoustic models, in Proceedings of the 30th International Conference on Machine Learning, 2013 Search PubMed.
-
S. Ioffe and C. Szegedy, Batch normalization: Accelerating deep network training by reducing internal covariate shift, in Proceedings of the 30th International Conference on Machine Learning, 2015 Search PubMed.
-
X. Mao, C. Shen and Y.-B. Yang, Image restoration using very deep convolutional encoder-decoder networks with symmetric skip connections, in Proc. Adv. Neural Inf. Process. Syst., 2016, pp. 2802–2810 Search PubMed.
-
D. P. Kingma and J. L. Ba, Adam: A Method for Stochastic Optimization, in International Conference on Learning Representations, 2015 Search PubMed.
- H. Zhao, O. Gallo, I. Frosio and J. Kautz, IEEE Trans. Comput. Imaging, 2017, 3, 47–57 Search PubMed.
- W. Zhou, A. C. Bovik, H. R. Sheikh and E. P. Simoncelli, IEEE Trans. Image Process., 2004, 13, 600–612 CrossRef PubMed.
- M. Mugnano, P. Memmolo, L. Miccio, S. Grilli, F. Merola, A. Calabuig, A. Bramanti, E. Mazzon and P. Ferraro, J. Biophotonics, 2018, 11, e201800099 CrossRef PubMed.
- T. Zangle and M. Teitell, Nat. Methods, 2014, 11(12), 1221–1228 CrossRef CAS PubMed.
- G. Popescu, Y. Park, N. Lue, C. Best-Popescu, L. Deflores, R. R. Dasari, M. S. Feld and K. Badizadegan, Am. J. Physiol., 2008, 295(2), C538–C544 CrossRef CAS PubMed.
- Y. Liu, P. Y. Liu, L. K. Chin, W. Ser, H. F. Chen, C.-M. Hsieh, C.-H. Lee, K.-B. Sung, T. C. Ayi, P. H. Yap, B. Liedberg, K. Wang, T. Bourouina and Y. Leprince-Wang, Lab Chip, 2016, 16, 634–644 RSC.
-
D. Pirone, D. Sirico, L. Miccio, V. Bianco, M. Mugnano, D. Del Giudice, G. Pasquinelli, S. Valente, S. Lemma, L. Iommarini, I. Kurelac, P. Memmolo and P. Ferraro, bioRxiv, 2021, DOI:10.1101/2021.12.09.471789.
Footnote |
| † Electronic supplementary information (ESI) available. See DOI: 10.1039/d1lc01087e |
|
| This journal is © The Royal Society of Chemistry 2022 |

 Open Access Article
 This Open Access Article is licensed under a Creative Commons Attribution-Non Commercial 3.0 Unported Licence
 ab,
Daniele
Sirico
ab,
Daniele
Sirico