 Open Access Article
Mapping the protonation states of the histidine brace in an AA10 lytic polysaccharide monooxygenase using CW-EPR spectroscopy and DFT calculations†
Peter J.
Lindley
 ,
Alison
Parkin
 ,
Gideon J.
Davies
 and
Paul H.
Walton
 *
*
Department of Chemistry, University of York, Heslington, York, YO10 5DD, UK. E-mail: paul.walton@york.ac.uk
First published on 4th November 2021
Abstract
The active site of the polysaccharide-degrading lytic polysaccharide monooxygenase (LPMO) enzyme features a single copper ion coordinated by a histidine brace. The primary coordination sphere of the copper contains several ligating atoms which are bonded to ionisable protons (e.g. OH2, NH2), the pKas of which are unknown. Using a combination of CW-EPR X-band spectroscopy over a range of pH values and DFT calculations, we show that the active site of a chitin-active AA10 LPMO can exist in three different protonation states (pKa1 = 8.7, pKa2 ∼ 11.5), representing the ionisation of the coordinating groups. The middle pH species (fully formed at pH ∼ 10.5) is proposed to be Cu(II)(His)2(OH)2 (N2O2 coordination) with a decoordinated R–NH3+ group at the amino terminus. This species also sees a rotation of the SOMO equatorial plane from the canonical histidine brace plane, whereby the nominal Cu d(x2 − y2)-orbital has rotated some 45° along the His–Cu(II)–His axis, driven by the elongation and decoordination of the amino group. The highest pH species (>12) is proposed to exist as a Cu(II)–azanide, in which the NH2 of the amino terminus has been deprotonated. The high pH means that this species is unlikely to be biologically relevant in the catalytic cycle of AA10 LPMOs.
Introduction
Lytic polysaccharide monooxygenases (LPMOs) are copper-containing enzymes which catalyse the oxidative cleavage of glycosidic bonds within polysaccharides.1–3 The active site of LPMOs has been shown by crystallography to contain a single copper ion coordinated in a T-shaped configuration by a ‘histidine brace’, which consists of an N-terminal histidine chelating to the copper via its NH2 and π–N imidazole atoms, along with the τ–N atom of a further histidine.4 In the copper(II) resting state, the structures further show that one or two exogenous ligands, usually water or hydroxide, occupy the remaining copper coordination sites.LPMOs are divided into auxiliary activity (AA) families in the Carbohydrate Active enZyme (CAZy) database (www.cazy.org) based on sequence similarity, where so far eight distinct classes have been characterised (AA9–11, AA13–17).1,2,5–10 The number of exogenous ligands is partly dependent on the genomic class of the LPMO. For instance, structures of AA9-classified enzymes exhibit a single water/hydroxide to give a planar N3O coordination geometry around the copper, whereas chitin-active AA10-classified enzymes appear to show the copper(II) in a distorted square-pyramidal N3O2 geometry, where two exogenous water/hydroxide ligands complete the coordination sphere, as depicted in Fig. 1. In both the AA9 and AA10 cases, EPR spectroscopy has established that the SOMO is dominated by the d(x2 − y2) orbital, requiring the ligand field of the copper to have a large sigma-bonding component in the equatorial plane of the metal ion. In the case of AA9 LPMOs, the coordination geometry of the Cu is best described as axially elongated, whereas in the case of AA10 LPMOs, EPR spectroscopy has shown ca. 3% of d(z2) mixing into the largely d(x2 − y2) SOMO, commensurate with a distorted square-pyramidal geometry.11,12
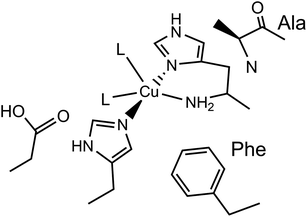 | ||
| Fig. 1 Active site of a chitin-active AA10 LPMO, depicting the histidine brace exogenous ligands (L) ligating to the Cu(II) ion, and conserved residues. | ||
In chitin-active AA10 LPMOs, the large number of ionisable protons of the ligands, which coordinate to the copper ion in the histidine brace (NH2, 2 × H2O), opens up the possibility that the copper(II) centre exhibits a range of different protonation states, some of which may be relevant to the enzyme’s catalytic cycle. Indeed, this reasoning has extended as far as suggesting that the amino terminus can deprotonate itself to form a copper(II)–azanide bond, the σ-donating power of which is expected to be high and possibly capable of stabilising a high valent copper species.13 Such a species may be a key intermediate in the catalytic cycle which is capable of abstracting a hydrogen atom from the polysaccharide substrate.2,14 As such, determining the different degrees of protonation of the active site is germane to any discussion about the catalytic mechanisms of LPMOs.
It is in this context that we aimed to establish the nature of the different protonation states of the active site of an AA10 LPMO from the bacterium Bacillus licheniformis, Bl(AA10).15 To this end, we employed CW-EPR spectroscopy in conjunction with DFT calculations to show that the active site exists in three distinct protonation states across the pH range 6.5 to 12.5. We further show that the highest pH species is most likely to be the copper(II)–azanide species proposed earlier,2,13 but that it only exists at pH outside the usual biological range, and is not a biologically relevant species for the resting state of the enzyme.
Results and discussion
Preparation and purity of Bacillus licheniformis AA10 LPMO
Samples of this enzyme were prepared in Escherichia coli (BL21 competent cells) via periplasmic expression, previously reported by Courtade et al.16 Crude protein was obtained from the periplasm by osmotic shock and further purified using a 5 mL HiTrap® DEAE FF anion exchanger, eluting with a NaCl gradient from 0–500 mM over 90 column volumes. LPMO-containing fractions were collected and further purified on a Superdex S75 gel filtration column (GE Life Sciences).The purity of Bl(AA10) was established by gel electrophoresis, which displayed a clear and single band at ca. 20 kDa (ESI†). For the subsequent EPR experiments, it was important to determine that all copper in the sample was bound stoichiometrically to the active site of the enzyme. On this basis, a single equivalent of Cu was added to the enzyme from a solution of 10 mM CuSO4 prior to size exclusion chromatography, from which any uncoordinated metal ions were separated from the purified enzyme.
CW-EPR X-band spectroscopy
A sample of Bl(AA10) (0.4 mM) was prepared in a mixed buffer system of MES, CHES, HEPES and CAPS, each at 5 mM. These buffers were chosen for their known poor-coordination properties toward metal ions and, when used synchronously, buffer a wide range of pHs. The pH of the solution was adjusted up and down by the addition of dilute solutions of NaOH and H2SO4, respectively. The pH of the resulting solution at room temperature was determined using a calibrated Fisherbrand™ Accumet™ AE150 Benchtop pH Meter, from which 12 samples from pH 6.5 to 12.5 were prepared in 0.5 pH unit steps. To verify that the pH extremes did not denature the protein, EPR spectra were collected on samples starting at pH 6.5 and then raising to pH 12.5, and then recollected on the same sample at a lower pH, indeed restoring the previous species.At each pH, the sample was rapidly (<2 s) cooled17 to 150 K and its CW-EPR X band spectrum collected.‡ The trend of the EPR spectra shows a qualitative change across the pH range, in which it is evident that all species have a spectral envelope which is consistent with a predominantly d(x2 − y2) SOMO, showing that the Cu(II) ion at all pHs has a ligand field dominated by sigma donation in its equatorial plane (Fig. 2). Spin quantification by double integration of the spectra also shows that there are no redox processes that occur at the active site across the pH range (ESI†).
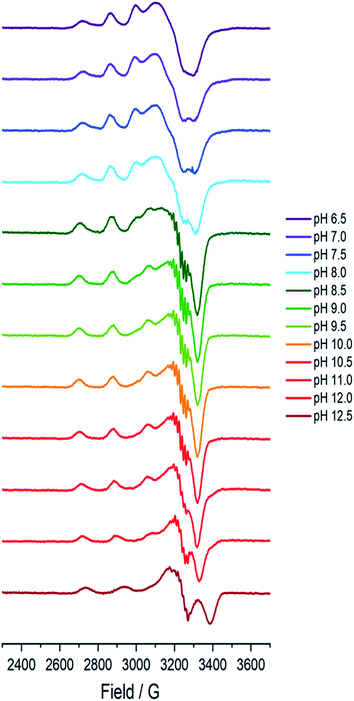 | ||
| Fig. 2 Frozen solution X-band EPR spectra (150 K) of Bl(AA10) (0.4 mM) in a mixed buffer of MES, CHES, HEPES and CAPS (5 mM each) between pH 6.5 and 12.5. | ||
Analysis of EPR spectra and distribution of pH dependent species
Between pHs 6.5 and 8.0, a single species is seen to dominate the spectrum, as evidenced by a single set of Cu hyperfine split peaks at low field (g3 = 2.260, A3 = 445 MHz). Increasing the pH leads to the formation of a new set of peaks in the low field region (g3 = 2.233, A3 = 554 MHz) along with distinctive superhyperfine coupling around g = 2.07, commensurate with the formation of a second distinct species, the concentration of which is maximised at pH 10.5. A further increase in pH to 12.5 sees the formation of a further set of peaks in the low field region (g3 = 2.180, A3 = 614 MHz), consistent with the formation of a third distinct species. This final species is not fully formed at pH 12.5 but is dominant at that pH. The total number of species across the pH range was assessed using singular value decomposition analysis of the collected spectra (ESI†). From this analysis, three principal components emerged, corroborating the qualitative assessment of the pH dependence of the EPR spectra.On the basis of the three components (species 1, 2 and 3), we sought to deconvolute the series of spectra. Given the clear separation between the different species across the pH range, it was assumed that the spectrum at pH 6.5 represented 100% of a single complex. Indeed, it was possible to simulate (with EasySpin) the lowest pH species (pH 6.5) with a single set of spin-Hamiltonian parameters (Fig. 3a and Table 1). The same was also true of the spectra collected at pH 10.5 and 12.5 (Fig. 3b and c, respectively, Table 1). In performing the simulation of species 3, we noted the appearance of a significant ‘overshoot’ feature which appears at high field in the species at pH 12.5. Such a feature has in the past been confused with an anomalously low g1 value.18
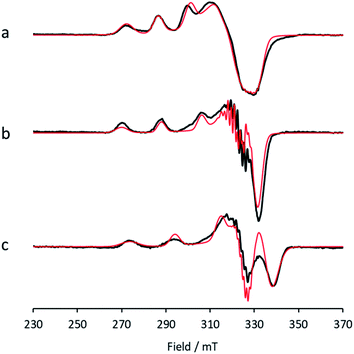 | ||
| Fig. 3 X-band EPR (a) low pH species 1, with simulation (red), (b) intermediate pH species 2, with simulation (red), (c) high pH species 3, with simulation (red). | ||
| Species | g values | Hyperfine coupling constants/MHz | b 2/% | ||||
|---|---|---|---|---|---|---|---|
| g 1 | g 2 | g 3 | |A1| | |A2| | A 3 | ||
| 1 | 2.030 | 2.125 | 2.260 | 60 | 90 | −445 | 3.6 |
| 2 | 2.044 | 2.069 | 2.233 | 60 | 76 | −554 | 0.8 |
| 3 | 2.038 | 2.062 | 2.180 | 70 | 90 | −614 | 0.9 |
Once spin Hamiltonian parameters of each species were obtained, it was possible to simulate the mixed species spectra (pHs 7 to 9.5 and >10.5) to determine the species distributions at each pH, from which the pKas of species 1 (low pH) and species 2 (middle pH), and the stoichiometry of protons for each ionisation, were determined using standard methods (ESI†). The deprotonation of species 1 to 2 occurs with a pKa of 8.7 and is a single proton step. The deprotonation of species 2 to 3 occurs with a pKa of ∼11.5 and is also a single proton step.
Ligand field analyses of spin Hamiltonian parameters
The collected spin Hamiltonian parameters of the three species are shown in Table 1. In all cases, the g values follow the pattern of g1 < g2 ≪ g3, confirming a SOMO with a high d(x2 − y2) character. Some d(z2) mixing is evident for all species from the differences in the values of g1 and g2. The degree of mixing, b2, can be calculated from the standard perturbative EPR formulae as described by Hitchman et al.,19 which give the molecular orbital coefficients, a and b, for the SOMO defined in eqn (1) (Table 1).| ψ(SOMO) = aψ(x2 − y2) + bψ(z2) | (1) |
This mixing is low for species 2 and 3, revealing that the ligand field around the Cu in each of these is close to axial four-fold symmetry (note that this does not necessarily translate into a four-fold axial symmetry of the identity of the coordinating atoms, as different coordinating atoms may have similar ligand field parameters). For species 1, more mixing is evident (b2 = 3.6%), which is in-line with previous EPR studies on AA10 LPMOs11 and the subsequent structures of these enzymes, which exhibit a distorted square pyramidal geometry around the copper ion (Fig. 1), where the exogenous ligands are two water/hydroxide molecules, one of which forms a Cu–O bond of ca. 1.9 A, and the other a more distant bond of 2.2 A.20
Taking the value of g3 as a measure of the relative ligand field strengths in the equatorial plane of the copper, it is evident that this ligand field increases significantly moving from species 1 to 2 to 3, and—moreover, from the values of d(z2) mixing—that the ligand field in species 2 and 3 is relatively evenly distributed amongst the ligating atoms of the equatorial plane, suggestive of a near four-fold symmetric planar arrangement of the equatorial ligand field. Indeed, corroborating such a ligand field, the increase in A3 value from species 1 to 2 is also known to be associated with a change in the Fermi coupling as the coordination number of the copper drops from five to four.15 Without access to the d–d electronic transition energies, it is not possible to be more precise about the nature of the ligand field; nevertheless the trend in increasing ligand field around the equatorial plane is evident from the relative spin-Hamiltonian parameters.
Further information about the ligand field in species 2 can be obtained from the clearly delineated Cu–N superhyperfine coupling (Fig. 3b). This coupling could be accurately simulated with the inclusion of two nitrogen atoms (14N, I = 1) in the spin Hamiltonian, in which each N atom couples to the copper with a principal coupling value of 40 MHz. This value is similar to those already known for the Cu–His coupling constants seen in other LPMOs.17,21 The simulation of species 2 could be adequately performed with the inclusion of two N nuclei, incommensurate with the expected N3 coordination of the histidine brace. Additionally, the g3 and A3 values of species 2 place it squarely within those expected for a CuN2O2 coordination geometry on a canonical Peisach–Blumberg plot.22
In assigning a putative structure to species 2, it is informative to consider previous EPR studies on the substrate-bound state of chitin-active AA10 enzymes. These species have been well characterised as having a planar CuN3O coordination geometry with a gz value of 2.205 and an Az value of ∼620 MHz.15,23 On this basis, a similar axial CuN3O (sq. pl) ligand field is unlikely for species 2, given the discrepancies in the gz and Az values. This difference in the spin Hamiltonian parameters necessitates an alternative ligand field assignment for species 2. Thus, taking together the Cu spin Hamiltonian values and superhyperfine couplings, a more likely scenario is one in which the NH2 group of the histidine brace is decoordinated from the copper (see DFT calculations below) and the coordination sphere around the Cu is made up of two histidines and two water/hydroxide ligands (see below for further discussion).
The spin Hamiltonian parameters for species 3 are distinct from those of other known LPMOs, which is particularly evident in the value of g3 (2.18), which is lower than all known values, including the situation in which a chloride ion has entered the coordination sphere of the copper (g3 = 2.23). Given the low value, we are directed towards the proposal that the ligand field around the copper in species 3 is one that is highly σ-donating, causing a large separation in the d(x2 − y2) and d(xy) orbital energies. Such a strong σ donation might be expected of a Cu–azanide interaction, which would arise from the recoordination of the –NH3+ amino terminus in species 2 which had been doubly deprotonated to give a –NH− ligating group. Commensurate with this proposal is the simulation of the superhyperfine coupling in species 3, which could only be satisfactorily achieved with the inclusion of three nitrogen atoms in the spin Hamiltonian with principal coupling constants of 35, 35 and 33 MHz (see DFT calculations below).
From the overall ligand field analysis, a hypothesis emerges for the nature of species 1, 2 and 3 and the pH-dependent ionisation processes between them. The hypothesis is depicted in Fig. 4, in which it is shown that species 2 forms via the deprotonation of a coordinating water molecule, followed by the decoordination and subsequent protonation of the –NH2 group, driven by an internal proton transfer process from one of two coordinating water molecules in species 1. The formation of species 3 from species 2, on the other hand, sees the reverse proton transfer from the decoordinated –NH3+ to a coordinated hydroxide with the loss of the resulting water molecule, and the subsequent deprotonation of an N–H proton from the –NH2 and recoordination to the metal as an azanide. In support of such an assignment, the formation of species 3 was accompanied by an unusual colour change from colourless to pale pink (ESI†) due to the formation of a semi-intense absorption band (ε ≈ 2500 M−1 cm−1) centred at 520 nm. The intensity of this band is in keeping with that of a charge transfer transition – likely arising from a ligand to metal charge transfer (LMCT) from the proposed azanide (–NH−) group to the copper (see TD-DFT calculations, ESI†). Thus, the proposed ligand field changes depicted in Fig. 4 are revealed by the differences in the spin Hamiltonian parameters across the species, in which gz decreases and Az increases (going from species 1 to 3), commensurate with an increasing equatorial ligand field.
DFT calculations
Building on the hypothesis depicted in Fig. 4, density functional theory geometry optimisations (uBP86) and EPR calculations (uB3LYP with 38% HF exchange) were performed on the proposed species 1, 2 and 3.In the absence of a high-resolution crystal structure for the Bacillus licheniformis AA10, crystallographic coordinates of the spectroscopically similar enzyme, Bacillus amyloliquefaciens AA10 (PDB 5IJU),20 were used as the basis for these calculations, in keeping with the experiments of Courtade et al.15 Importantly in this regard, the structure of BaAA10 is one of the few LPMO structures in which the copper ion has not been photoreduced from Cu(II) to Cu(I) during the X-ray experiment.24 Accordingly, key residues from the crystallographic coordinates were used for the basis of the calculations for species 1, retaining the primary coordination sphere and supporting residues (full information and coordinates are given in the ESI†). Following standard practice, the spatial coordinates of certain atoms at the periphery of the model were kept fixed throughout the calculation to prevent the unfettered movement of residues. These atoms are depicted in Fig. S7 (ESI†) and were selected on the basis of earlier DFT studies on a closely related LPMO.15
For species 1, the geometry was initially modelled with the inclusion of two ligating water molecules with bond distances based on the positioning of the oxygen atoms in the crystal structure. Notably in this regard, the water situated beneath the histidine brace plane is expected to participate in strong hydrogen bonding with a nearby aspartate residue (glutamate in BaAA10), the potential of which can affect the protonation state and ligating properties of the water molecule. Indeed, upon optimisation, despite the fact that Glu and Asp residues are expected to be deprotonated across the studied pH range owing to the low pKas of their carboxylate groups (pKa = 2–4.5),25 one of the protons bound to the water molecule migrated to the neighbouring carboxylate group (Fig. 5) to give a mixed hydroxide/water coordination at the Cu. Confidence in this structural assignment comes from the resulting geometry of the optimised structure, which is a close match to the crystal structure coordinates. Thus, for species 1, the coordination sphere of the Cu is best described as a distorted square-pyramid, where water and hydroxide act as exogenous ligands.
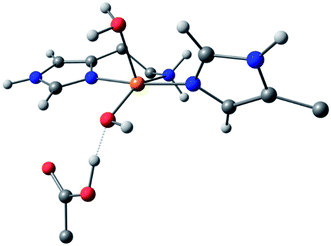 | ||
| Fig. 5 DFT model of species 1 (truncated for clarity) showing the distorted square-pyramidal geometry and hydroxide/water coordination of the exogenous ligands. | ||
While a good match was found between the optimised and experimental structures, the match between the calculated and experimental EPR parameters (Table 2) was only moderate (e.g. calculated g3 = 2.216, experimental g3 = 2.26). Moreover, the calculated Cu hyperfine values, A1 and A2, have relative magnitudes which are opposite to those observed experimentally. Notwithstanding the known difficulties in DFT-calculated EPR parameters matching with those from experiments, the relatively large differences seen between the experimental and calculated EPR parameters for species 1 are a recurring theme in DFT calculations on AA10 LPMO active sites in their Cu(II) resting states, even with careful selection of the basis sets and functionals.26 As such, while the optimised structure of 1 matches well that of the experiment and is likely a good representation of the actual structure, caution must be applied in interpreting the calculated EPR data for species 1, where the reasons for the discrepancies between theoretical and experimental results remain unclear. This situation is in contrast to the calculations of the EPR parameters for species 2 and 3, which give a somewhat closer match to the experimental data (see below).
| Species | g values | Hyperfine coupling constants/MHz | ||||
|---|---|---|---|---|---|---|
| g x | g y | g z | |Ax| | |Ay| | A z | |
| 1 | 2.049 | 2.081 | 2.216 | 110 | 29 | −598 |
| 2 | 2.070 | 2.079 | 2.244 | 94 | 3 | −582 |
| 3 | 2.037 | 2.070 | 2.188 | 15 | 140 | −496 |
Following the ligand field analysis above, species 2 was initially modelled by removing the proton shared between the water and glutamate, and by transferring the proton attached to the second water ligand to the –NH2 group (representing an overall removal of a single proton from species 1, as per the experimental findings). Upon optimisation, the angle between the hydroxide ligands, ∠O–Cu–O, increased from ca. 90° to 157°. The divergence of the hydroxide ligands was also accompanied by the expected decoordination of the now protonated –NH3+ group from the metal and a rotation of the d(x2 − y2) SOMO by ca. 45° (Fig. 6), such that the equatorial plane was now defined by the two hydroxides and the nitrogen atoms of two histidine ligands, thus completing the CuN2O2 coordination geometry expected from the ligand field analysis. The calculated EPR parameters (Table 2) for species 2 reflect the experimental data in that gx and gy are closer in values, and that the value of gz is ca. 2.24.
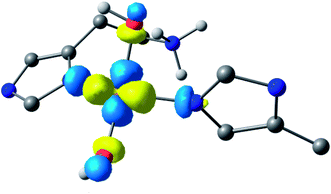 | ||
| Fig. 6 Hypothetical d(x2 − y2) dominated SOMO of species 2 showing that the orbital plane has rotated (the colours denote the orbital phases). | ||
Species 3 was modelled as a Cu(II)–azanide species formed by the expulsion of water from species 2, followed by the further removal of an –NH2 proton, resulting in a short Cu–NH bond of 1.94 A (full computational details can be found in the ESI†). The optimised geometry is best described as CuN3O planar, albeit distorted (∠HN–Cu–O ∼160°). This distortion away from planar has been previously reported for four-coordinate LPMO structures when modelled by DFT.15 The calculated EPR parameters for species 3 match well with those from experiments, most notably in the g3,z value of 2.18. Also, from a spectroscopic perspective, Species 3 exhibits a semi-intense UV/visible absorption band centred at 520 nm (ε ≈ 2500 M−1 cm−1). This band is proposed to arise from a LMCT transition from the proposed azanide group to the Cu, which is corroborated with the TD-DFT calculations (ESI†). Both the d–d and LMCT transition energies appear to be significantly blue-shifted with respect to the experimental transitions. Exact transition energies are known to carry significant error when calculated in this way for open shell systems. Nevertheless, these calculations reveal that an intense absorption band is expected for the Cu(II)–azanide complex proposed as species 3 and its energy is predicted to be positioned between the π–π* and the d–d transitions. The three optimised structures for species 1, 2 and 3 are shown in Fig. 7.
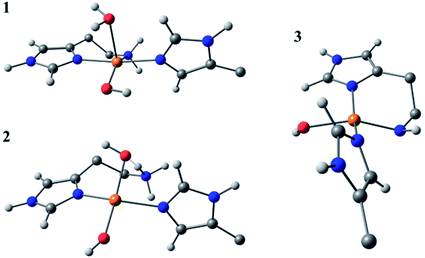 | ||
| Fig. 7 DFT optimised geometries of species 1, 2 and 3. The models are truncated, and certain atoms are hidden for clarity. | ||
Conclusions
Herein, we establish three discrete protonation states for an AA10 LPMO within the pH range of 6.5 to 12.5, two of which are biologically relevant and may be important in the context of the LPMO mechanism. The first species exists at acidic–neutral pH and is believed to be consistent with a 5-coordinate (N3O2), in keeping with the current understanding of the chitin-active AA10 coordination sphere. A second species is formed by deprotonating the ligating water molecule (pKa 8.7); yielding a near-axial EPR spectral envelope (g1 = 2.044, g2 = 2.069 and g3 = 2.233). We hypothesise that this species exists as a N2O2, 4-coordinate ligand field with two hydroxide ligands and an elongated/decoordinated –R-NH3+ following proton transfer from the coordinating hydroxide to the amino terminus. This gives rise to a rotated SOMO which is no longer defined by the chelating histidine brace. The third species formed at a high pH (pKa ∼ 11.5) is proposed to exist as a 4-coordinate, N3O complex, whereby species 2 has lost a water molecule (from the interaction of an OH− and NH3+) and the –NH2 group has been deprotonated to form a Cu(II)–NH azanide complex. The high pH at which this species becomes accessible is outside of that which is biologically relevant and, as such, is unlikely to be pertinent in catalysis.Conflicts of interest
There are no conflicts to declare.Acknowledgements
We acknowledge the University of York for the support of PJL’s PhD studentship. We thank Z. Forsberg, G. Courtade, V. G. H. Eijsink and F. L. Aachmann for providing the clone/cell colonies and purification protocol for the BlAA10 enzyme. GJD thanks the Royal Society for the Ken Murray Research Professorship.Notes and references
- G. Vaaje-Kolstad, B. Westereng, S. J. Horn, Z. Liu, H. Zhai, M. Sørlie and V. G. H. Eijsink, Science, 2010, 330, 219–222 CrossRef CAS PubMed.
- R. J. Quinlan, M. D. Sweeney, L. Lo Leggio, H. Otten, J.-C. N. Poulsen, K. S. Johansen, K. B. R. M. Krogh, C. I. Jørgensen, M. Tovborg, A. Anthonsen, T. Tryfona, C. P. Walter, P. Dupree, F. Xu, G. J. Davies and P. H. Walton, Proc. Natl. Acad. Sci. U. S. A., 2011, 108, 15079–15084 CrossRef CAS PubMed.
- C. M. Phillips, W. T. Beeson, J. H. Cate and M. A. Marletta, ACS Chem. Biol., 2011, 6, 1399–1406 CrossRef CAS PubMed.
- L. Ciano, G. J. Davies, W. B. Tolman and P. H. Walton, Nat. Catal., 2018, 1, 571–577 CrossRef CAS.
- G. R. Hemsworth, B. Henrissat, G. J. Davies and P. H. Walton, Nat. Chem. Biol., 2014, 10, 122–126 CrossRef CAS PubMed.
- V. V. Vu, W. T. Beeson, E. A. Span, E. R. Farquhar and M. A. Marletta, Proc. Natl. Acad. Sci. U. S. A., 2014, 111, 13822–13827 CrossRef CAS PubMed.
- M. Couturier, S. Ladevèze, G. Sulzenbacher, L. Ciano, M. Fanuel, C. Moreau, A. Villares, B. Cathala, F. Chaspoul, K. E. Frandsen, A. Labourel, I. Herpoël-Gimbert, S. Grisel, M. Haon, N. Lenfant, H. Rogniaux, D. Ropartz, G. J. Davies, M.-N. Rosso, P. H. Walton, B. Henrissat and J.-G. Berrin, Nat. Chem. Biol., 2018, 14, 306 CrossRef CAS PubMed.
- F. Sabbadin, G. R. Hemsworth, L. Ciano, B. Henrissat, P. Dupree, T. Tryfona, R. D. S. Marques, S. T. Sweeney, K. Besser, L. Elias, G. Pesante, Y. Li, A. A. Dowle, R. Bates, L. D. Gomez, R. Simister, G. J. Davies, P. H. Walton, N. C. Bruce and S. J. McQueen-Mason, Nat. Commun., 2018, 9, 756 CrossRef PubMed.
- C. Filiatrault-Chastel, D. Navarro, M. Haon, S. Grisel, I. Herpoël-Gimbert, D. Chevret, M. Fanuel, B. Henrissat, S. Heiss-Blanquet, A. Margeot and J.-G. Berrin, Biotechnol. Biofuels, 2019, 12, 55 CrossRef PubMed.
- F. Sabbadin, S. Urresti, B. Henrissat, A. O. Avrova, L. R. J. Welsh, P. Lindley, M. Csukai, J. N. Squires, P. H. Walton, G. J. Davies, N. C. Bruce, S. C. Whisson and S. J. McQueen Mason, Science, 2021, 373, 774–779 CrossRef CAS PubMed.
- G. R. Hemsworth, E. J. Taylor, R. Q. Kim, R. C. Gregory, S. J. Lewis, J. P. Turkenburg, A. J. Parkin, G. J. Davies and P. H. Walton, J. Am. Chem. Soc., 2013, 135, 6069–6077 CrossRef CAS PubMed.
- F. L. Aachmann, M. Sørlie, G. Skjåk-Bræk, V. G. H. Eijsink and G. Vaaje-Kolstad, Proc. Natl. Acad. Sci. U. S. A., 2012, 109, 18779–18784 CrossRef CAS PubMed.
- N. Gagnon and W. B. Tolman, Acc. Chem. Res., 2015, 48, 2126–2131 CrossRef CAS PubMed.
- J.-P. Bacik, S. Mekasha, Z. Forsberg, A. Y. Kovalevsky, G. Vaaje-Kolstad, V. G. H. Eijsink, J. C. Nix, L. Coates, M. J. Cuneo, C. J. Unkefer and J. C. H. Chen, Biochemistry, 2017, 56, 2529–2532 CrossRef CAS PubMed.
- G. Courtade, L. Ciano, A. Paradisi, P. J. Lindley, Z. Forsberg, M. Sørlie, R. Wimmer, G. J. Davies, V. G. H. Eijsink, P. H. Walton and F. L. Aachmann, Proc. Natl. Acad. Sci. U. S. A., 2020, 117, 19178–19189 CrossRef CAS PubMed.
- G. Courtade, S. B. Le, G. I. Sætrom, T. Brautaset and F. L. Aachmann, Carbohydr. Res., 2017, 448, 212–219 CrossRef CAS PubMed.
- G. R. Hemsworth, L. Ciano, G. J. Davies and P. H. Walton, in Methods Enzymol., ed. F. Armstrong, Academic Press, 2018, vol. 613, pp. 63–90 Search PubMed.
- B. Bissaro, I. Isaksen, G. Vaaje-Kolstad, V. G. H. Eijsink and Å. K. Røhr, Biochemistry, 2018, 57, 1893–1906 CrossRef CAS PubMed.
- M. A. Hitchman and R. L. Belford, Inorg. Chem., 1969, 8, 958–965 CrossRef CAS.
- R. C. Gregory, G. R. Hemsworth, J. P. Turkenburg, S. J. Hart, P. H. Walton and G. J. Davies, Dalton Trans., 2016, 45, 16904–16912 RSC.
- K. E. H. Frandsen, T. J. Simmons, P. Dupree, J.-C. N. Poulsen, G. R. Hemsworth, L. Ciano, E. M. Johnston, M. Tovborg, K. S. Johansen, P. von Freiesleben, L. Marmuse, S. Fort, S. Cottaz, H. Driguez, B. Henrissat, N. Lenfant, F. Tuna, A. Baldansuren, G. J. Davies, L. Lo Leggio and P. H. Walton, Nat. Chem. Biol., 2016, 12, 298 CrossRef CAS PubMed.
- J. Peisach and W. E. Blumberg, Arch. Biochem. Biophys., 1974, 165, 691–708 CrossRef CAS PubMed.
- B. Bissaro, B. Streit, I. Isaksen, V. G. H. Eijsink, G. T. Beckham, J. L. DuBois and Å. K. Røhr, Proc. Natl. Acad. Sci. U. S. A., 2020, 117, 1504 CrossRef CAS PubMed.
- A. Paradisi, M. J. Steward, P. Lindley, G. J. Davies and P. H. Walton, in Reference Module in Chemistry, Molecular Sciences and Chemical Engineering, Elsevier, 2020, DOI:10.1016/B978-0-12-409547-2.14928-5.
- M. J. Harms, C. A. Castañeda, J. L. Schlessman, G. R. Sue, D. G. Isom, B. R. Cannon and B. E. García-Moreno, J. Mol. Biol., 2009, 389, 34–47 CrossRef CAS PubMed.
- Y. A. Theibich, S. P. A. Sauer, L. L. Leggio and E. D. Hedegård, Comput. Struct. Biotechnol. J., 2021, 19, 555–567 CrossRef CAS PubMed.
- S. Stoll and A. Schweiger, J. Magn. Reson., 2006, 178, 42–55 CrossRef CAS PubMed.
Footnotes |
| † Electronic supplementary information (ESI) available. See DOI: 10.1039/d1fd00068c |
| ‡ Continuous wave (CW) X-band EPR spectra were obtained using a 100 μL frozen solution of BlAA10 at a concentration of 0.4 mM. Data collection was carried out on a Bruker micro EMX spectrometer using a microwave frequency of ca. 9.3 GHz, modulation amplitude of 4G, modulation frequency of 100 kHz and microwave power of 10.02 mW. Spectra were intensity averaged over three scans and simulated using the EasySpin 5.2.28 (ref. 27) open-source toolbox implemented by MATLAB R2020a software on a desktop PC. Raw EPR data are available at DOI: 10.15124/7a485d50-ea4e-4cd1-8fc2-650057c076af. |
| This journal is © The Royal Society of Chemistry 2022 |

