
 Open Access Article
 This Open Access Article is licensed under a
 Creative Commons Attribution 3.0 Unported Licence
Synthesis and structural characterisation of solid titanium(IV) phosphate materials by means of X-ray absorption and NMR spectroscopy†
Daniela
Rusanova-Naydenova
*a,
Mylène
Trublet
 b,
Wantana
Klysubun
c,
Chanakan
Cholsuk
c,
Dinu
Iuga
d,
Ray
Dupree
d,
Oleg N.
Antzutkin
de and
Ingmar
Persson
*f
b,
Wantana
Klysubun
c,
Chanakan
Cholsuk
c,
Dinu
Iuga
d,
Ray
Dupree
d,
Oleg N.
Antzutkin
de and
Ingmar
Persson
*f
aSunCarbon AB, P. O. Box 726, SE-941 28 Piteå, Sweden
bDepartment of Corrosion, RISE KIMAB, Isafjordsgatan 28A, SE-164 40 Kista, Sweden
cSynchrotron Light Research Institute, 111 Moo 6, University Ave., Muang, Nakhon Ratchasima, 30000, Thailand
dDepartment of Physics, University of Warwick, Coventry CV4 7AL, UK
eChemistry of Interfaces, Luleå University of Technology, SE-97 187 Luleå, Sweden
fDepartment of Molecular Sciences, Swedish University of Agricultural Sciences, P. O. Box 7015, SE-750 07 Uppsala, Sweden. E-mail: ingmar.persson@slu.se
First published on 9th May 2022
Abstract
Solid titanium phosphate, TiP, materials hold great promise for wastewater treatment for removal of metal ions and complexes. A series of TiP materials, synthesised at mild conditions and short reaction times, have been structurally characterised using solid-state X-ray absorption spectroscopy, phosphorus and titanium K edge XANES and EXAFS, and 31P and 47/49Ti NMR spectroscopy. The titanium K edge EXAFS data of α-Ti(HPO4)2·H2O (α-TiP) revealed octahedral coordination of oxygens around titanium. Repeated washing of primary β-/γ-TiP with hydrochloric acid results in formation of a weakly ordered solid, TiO(OH)(H2PO4)·H2O, TiP1-H. The structure of TiP1-H is shown by Ti EXAFS to be a titanyl compound, containing a short Ti![[double bond, length as m-dash]](https://www.rsc.org/images/entities/char_e001.gif) O bond. The analogous data for linked titanium phosphate compounds (LTP) disclosed that inter-linkage occurs between α-TiP and titanyl phosphate units, supported by 31P–31P NOESY NMR data. 47/49Ti NMR and Ti pre-edge XANES show evidence of two different titanium environments in LTP, one very similar to that observed in TiP1-H and a second more symmetric octahedral environment. Data are discussed in terms of induced acidic hydrolyses of titanium(IV) and phosphate counterpart during washings with hydrochloric acid and water. A straightforward relation between synthesis parameters/post synthetic treatment and structural re-arrangement in the materials is established.
O bond. The analogous data for linked titanium phosphate compounds (LTP) disclosed that inter-linkage occurs between α-TiP and titanyl phosphate units, supported by 31P–31P NOESY NMR data. 47/49Ti NMR and Ti pre-edge XANES show evidence of two different titanium environments in LTP, one very similar to that observed in TiP1-H and a second more symmetric octahedral environment. Data are discussed in terms of induced acidic hydrolyses of titanium(IV) and phosphate counterpart during washings with hydrochloric acid and water. A straightforward relation between synthesis parameters/post synthetic treatment and structural re-arrangement in the materials is established.
Introduction
Titanium phosphates (TiPs) are inorganic materials which have been extensively studied for their ability to remove trace metal ions and complexes from aqueous solution. TiPs are therefore strong candidates to be used as the recoverable active material in filters to remove low concentrations of transition and heavy metals ions, including radioactive elements, in industrial wastewaters. Three types of ion-exchange units can be found in TiP systems, hydrogen phosphate (–HPO4), dihydrogen phosphate (–H2PO4), and a mixture of these. It is well-established that the synthetic conditions play a major role for the predominating ion-exchange unit formed, and the degree of crystallinity/long-range order of the TiP material. These are the two most important features affecting the overall sorption performance of TiP materials.1,2 Crystalline TiP materials are often synthesised at relatively high temperatures, up to 250 °C, long reaction times, measured in days, and under autoclave conditions.3–8 When TiPs are formed under considerably milder conditions e.g. at a medium-low temperature with a short reaction time (hours) they are much less well ordered or amorphous. Representative TiPs with well-defined ion-exchange units in crystalline layered materials are α-TiP (α-Ti(HPO4)2·H2O),4,7,9 β-TiP (β-Ti(H2PO4)(PO4))10 and γ-TiP (γ-Ti(H2PO4)(PO4)·2H2O),11 where titanium is octahedrally coordinated with six oxygen atoms. Recently, it has been reported that TiPs could exist in another chemical form, with titanyl, TiO, functional groups in an amorphous TiP sorbent with solely dihydrogen phosphate units, TiO(OH)(H2PO4)·H2O, TiP1-H.2 This compound was obtained upon heating at 60–80 °C for one hour followed by repeated washings of the crude product with hydrochloric acid.2
It is a general observation that the presence of both types of ion-exchange units (–HPO4 and –H2PO4) often leads to fully amorphous TiP materials (aTiP) where the chemical composition may vary for similar synthetic conditions. Furthermore, due to high acidity of the synthesis mixtures, the crude products are often quenched or washed with water. The composition of aforementioned TiP materials proposed from elemental analysis and 31P NMR data include Ti(OH)1.36(HPO4)1.32·2.3H2O,1 TiO1.1(OH)0.58(HPO4)0.2(H2PO4)0.8·0.64H2O,8 Ti(OH)1.2(HPO4)1.28(H2PO4)0.24·2.5H2O12 and TiO1.25(OH)0.47(H2PO4)0.77(HPO4)0.13·2.3H2O.13
Another variety of poorly ordered TiP units is represented in the linked titanium phosphate material (LTP), which is composed of different interlinked exchange units.14 This TiP material has been shown to consist of α-TiP-like and TiP1-H-like units interconnected either by oxo/hydroxo bridges or via inner-sphere H2O-complexation through a common edge of two TiO6 octahedra. This LTP material has shown both good sorption properties and good recovery in column (dynamic) trials with respect to Ni2+-ions.14
The first reported and characterised phosphate compound with a four-valent metal ion was Zr(HPO4)2·H2O.15 Soon thereafter its Ti-analogue, Ti(HPO4)2·H2O, was synthesised.16 It was found that Zr(HPO4)2·H2O has a layered structure, and that at least two different arrangements of the layers occur, denoted as α- and γ-layers.17,18 A single-crystal study of α-Zr(HPO4)2·H2O reported crystallisation in space group P21/c (monoclinic no. 14),19 which later was re-evaluated to the alternative setting P21/n (no. 14),20 where the main difference is in the length of the c-axis, 16.22 and 15.414 Å, and in the β angle, 111.5 and 101.7°, respectively.
The first structural investigation of α-Ti(HPO4)2·H2O and γ-Ti(H2PO4)(PO4)·2H2O was reported by Nørlund Christensen et al.7 Due to the low solubility of Ti(HPO4)2·H2O, only microcrystalline powders were obtained, and powder X-ray diffraction was therefore applied to solve the structures. α-Ti(HPO4)2·H2O crystallises in the space group P21/c with reported Ti–O bond distances in the range 1.911–2.062 Å, mean 2.001 Å, in distorted octahedral configuration, for details see Table S1 in the ESI.† Bruque et al. performed a powder X-ray diffraction study of α-Ti(HPO4)2·H2O and the space group P21/n was chosen to solve the structure.4 They reported Ti–O bond distances in the range 1.844–2.026 Å, mean 1.952 Å, in distorted octahedral configuration. The structure α-Ti(HPO4)2·H2O has also been studied by powder neutron diffraction applying space group P21/n, giving significantly shorter Ti–O bond distances than the X-ray studies, 1.835–1.961 Å, mean 1.916 Å, Table S1 (ESI†).21 Burnell et al. reported a powder X-ray diffraction study where the structure of α-Ti(HPO4)2·H2O was solved with more accurate unit cell parameters choosing space group P21/c.9 The reported Ti–O bond distances were in the range 1.907–1.969 Å, mean 1.944 Å, in octahedral configuration around titanium with somewhat less distortion than in the previously reported structures, Table S1 (ESI†).
Clearfield et al. prepared two zirconium phosphate compounds, and assigned the prefix γ on the dihydrate and β to the anhydrous compound.1531P MAS NMR showed that these compounds contain both phosphate and dihydrogen phosphate ions, γ-Zr(PO4)(H2PO4)·2H2O and β-Zr(PO4)(H2PO4),22 which were confirmed by powder X-ray diffraction studies.23 γ-Ti(PO4)(H2PO4)·2H2O is isostructural with γ-Zr(PO4)(H2PO4)·2H2O as shown by X-ray powder diffraction.20,24 The structure of β-Ti(PO4)(H2PO4) has been determined in two powder X-ray diffraction studies. One study reports crystallisation in space group P21/n,10 while in the other study space group P21 was choosen.11 The octahedral configuration around titanium is distorted with Ti–O bond distances in the range 1.910–1.955 Å (mean 1.932 Å) and 1.839–2.036 Å (mean 1.938 Å), respectively, Table S1 (ESI†).
From these structure reports, it is evident that the TiP materials display rather distorted octahedral oxygen environments around titanium, while the ZrP compounds have close to regular octahedral configuration. A probable reason is that the ionic radius of zirconium(IV) is ca. 0.1 Å larger than the ionic radius of titanium(IV).25 This difference may cause that zirconium(IV) fits better into the close-packed holes formed by the phosphate oxygens than titanium(IV).
A large part of the sorption experiments, at batch and column conditions, involves amorphous or poorly ordered TiP materials in their sodium forms. It has been shown that the sodium forms have higher sorption capacity and pH is stabilised during sorption processes.12,26,27 Even though different TiP materials have displayed very good ion-exchange properties in their sodium forms, detailed structural characterisation of these materials have not yet been reported. This is due to the rather complex system properties related to a partial displacement of protons by sodium ions. The Na-salts are usually obtained via an additional ion-exchange step causing a diminished degree of crystallinity/increased amorphousness of the initially protonated TiP materials.
It has been reported that amorphous TiP materials, aTiP, show similar or larger sorption capacity in comparison to crystalline TiP materials. This has been associated with their larger surface area and interlayer distances related to their ability to incorporate transition metal ions with different size.28 However, due to the poor crystallinity of aTiP systems, the local structure around titanium and phosphorus has been difficult to fully assess using powder diffraction methodology and solid-state 31P NMR spectroscopy.
In this study, the lattice independent method EXAFS29 and solid-state 47/49Ti NMR are applied to gather further insights into the structure around the titanium and phosphorus atoms in a number of TiP materials, previously characterised by 31P MAS NMR. EXAFS provides information about the distances around the absorbing atom out to ca. 5 Å from it. It is a great advantage to study the environments around two atoms in the same compound by EXAFS as the distances between them can be independently confirmed. The XANES region of the X-ray absorption spectrum of titanium is very informative concerning the coordination geometry around titanium. There is a very intense pre-peak of five- and four-coordinated titanium(IV) complexes of 0.4–0.7 and 0.7–1.0 absorption units in a normalised X-ray absorption spectrum, respectively, while for regular octahedral complexes the pre-peak is very weak.30 Furthermore, a strongly distorted octahedron, as in titanyl compounds, has a significantly more intense pre-peak than a titanium compound with a regular octahedral configuration.30 The combined information from XANES and EXAFS on the titanium absorption K-edge is therefore a powerful tool to analyse the structure of the poorly crystalline TiP sorbents.
Phosphorus EXAFS is challenging from a data collection perspective as the total absorption is very large at energies of the phosphorus K absorption edge. As shown in a previous study, accurate measurements can only be performed in transmission mode as the volume radiated in a fluorescence experiment increases significantly with increasing energy due to decreasing total absorption. This cause the fluorescence signal to increase with increasing energy relative to the X-ray beam intensity.31 In this work we attempt to study solid metal (Ti, Na) phosphate compounds where titanium is strongly bound to phosphate units aiming to determine distances beyond the phosphate ion, and to access the structural environment around phosphorus in –HPO4- and –H2PO4-units.
Solid-state 47/49Ti NMR can also give detailed information on titanium speciation in complex TiP matrices. However, it is challenging when applied to the TiP systems because of the great variety of distorted TiO6 geometries. Titanium has two NMR active isotopes, both with low natural abundance, 47Ti (nuclear spin I = 5/2, natural abundance 7.28%) and 49Ti (I = 7/2, 5.51% abundance), and a small gyromagnetic ratio which means the detection sensitivity is low. Furthermore, both isotopes have significant electric quadrupole moments such that, except in the most symmetric environments, NMR spectra are significantly broadened by the second order quadrupole interaction with the linewidth of 47Ti being ∼3.52 times that of 49Ti. In addition, their gyromagnetic ratios are very similar with 47Ti appearing at −267 ppm in the spectrum relative to 49Ti, so that in most cases the quadrupole broadening is such that the spectra of the two isotopes overlap.32 Despite these difficulties 47/49Ti NMR has been used to study a range of materials including the TiO2 polymorphs, a number of titanates33 and α-, β-, and γ-TiP.34
The aim of this study is to determine and characterise the local structure around the titanium and phosphorus atoms in a number of weakly ordered titanium(IV) phosphate compounds synthesised in different ways using phosphorus and titanium K edge EXAFS and solid-state 47/49Ti and 31P MAS NMR. Previously reported 31P MAS NMR and X-ray powder diffraction data are added in an effort to determine relationships between properties and detailed structures. It is of a vital importance to understand this relationship in order to optimise synthetic routes for more efficient and stable TiP materials, and to improve conditions for their utilisation as ion-exchangers. This is the first study where phosphorus K edge EXAFS has been applied to determine the local structure around phosphorus in transition metal phosphate systems and also where 47/49Ti NMR data of titanyl phosphate materials were obtained. In addition, solid-state 2D 31P–31P NOESY NMR data were used to confirm a previously proposed connection between –HPO4 and –H2PO4 units in the inter-linked TiP sample(s) of LTP-type.
Experimental
In order to obtain a better understanding of these materials, ten different samples were studied by X-ray absorption spectroscopy. Five of these were probed with 47/49Ti-NMR, while the others were too disordered to provide any useful data. Depending on the quality of data obtained, some data are included in the ESI.† The compounds considered in this study can be divided into four main groups: (i) samples with titanium in the titanyl form, TiP1-H based, (ii) LTP-based, containing inter-linked α-TiP-like and TiP1-H-like units, (iii) pure phases of microcrystalline α-Ti(HPO4)2·H2O and (iv) fully amorphous TiP (aTiP) as systems for comparison, all synthesised in aqueous solution at mild conditions. A colour code is used for the studied samples in tables and figures to guide the reader, Table 1. The chemical purity of the samples was probed with elemental analyses and powder XRD. The characterisation data of these samples are summarised in Table 1.| Sample no./colour code | Abbreviation | Chemical substance | Characterisation in solid state | Ref. | Notes |
|---|---|---|---|---|---|
| Sample 1/purple | TiP1/TiP1-H | TiO(OH)(H2PO4)·H2O | 31P MAS NMR, pXRD, elemental analysis | 2 and 28 | Weakly ordered |
| Sample 2/red-brownish | Alpha-TiP/α-TiP | α-Ti(HPO4)2·H2O | 31P MAS NMR, pXRD, elemental analysis | 2 | Microcrystalline |
| Sample 3/grey | LTP/LTP-H | Linked units (TiP1 and α-TiP) | 31P MAS NMR, pXRD, elemental analysis | 14 | Long-range order |
| Sample 4/light-blue | Amorphous TiP/aTiP | Different TiP units present | 31P MAS NMR, pXRD | 28 | Featureless pXRD |
| Sample 5/yellow | LTP-Na | Na-exchanged LTP-H | 31P MAS NMR pXRD (ESI,† this work) | 14 | Na2CO3 treatment in aqueous suspension |
| Sample 6/black | LTP-pro, H (processed) | LTP-acid regenerated sorbent/traces of Ni2+ | 31P MAS NMR | 14 | Ni2+-Multiple cycles sorption/desorption |
| Sample 7/pink | TiP1-Na | Na-exchanged TiP1-H | 31P MAS NMR | 2 | Na2CO3 treatment in aqueous suspension |
| Sample 8/light-green | TiP1-Cu | TiP1-Na-equilibrated with Cu2+ ions | No 31P MAS NMR data (paramagnetic effects) | 27 | Batch sorption of CuSO4 on TiP1-Na |
| Sample 9/blue | TiP1-mix | TiP1-Na-equilibrated with transition metal ions mixture | No 31P MAS NMR data (paramagnetic effects) | 36 | Batch sorption of Cu2+, Zn2+, Mn2+, Ni2+ and Co2+ ions |
| Sample 10/green | TiP1-mixCa | TiP1-Na-equilibrated with transition metal ions mixture with Ca2+ | No 31P MAS NMR data (paramagnetic effects) | 36 | Batch sorption of Cu2+, Zn2+, Mn2+, Ni2+, Co2+ and Ca2+ |
General syntheses
All titanium phosphate materials were obtained at mild synthetic conditions. The TiP1-H, α-TiP and LTP-H were synthesised according to the procedures described by Trublet et al.,2,14 using a liquid Ti-source: aqueous TiOSO4·(H2SO4)x solution (Sigma Aldrich), containing 350–400 g L−1 H2SO4, 100 g L−1 TiO2, and 85% phosphoric acid, H3PO4, to adjust the required mole ratio. In brief, for TiP1, 50 mL TiOSO4 aqueous solution was heated to 80 °C for 30 minutes. Phosphoric acid was added to the mixture to a P2O5![[thin space (1/6-em)]](https://www.rsc.org/images/entities/char_2009.gif) :TiO2 molar ratio of 1:1 (H3PO4:TiO2 molar ratio of 2:1), and a white precipitate was formed. The mixture was stirred at 80 °C for another 30 minutes and additional 5 hours at ambient conditions (no heating). The crude product was left to mature for about 10 hours and then dried at 60 °C. The post-synthetic treatment included washings with hydrochloric acid (in order 0.5 and 0.1 mol dm−3), and finally deionised water. The obtained solid was dried again at 60 °C. This compound is referred to as a protonated-form of the sorbent, TiP1-H, in the text.
:TiO2 molar ratio of 1:1 (H3PO4:TiO2 molar ratio of 2:1), and a white precipitate was formed. The mixture was stirred at 80 °C for another 30 minutes and additional 5 hours at ambient conditions (no heating). The crude product was left to mature for about 10 hours and then dried at 60 °C. The post-synthetic treatment included washings with hydrochloric acid (in order 0.5 and 0.1 mol dm−3), and finally deionised water. The obtained solid was dried again at 60 °C. This compound is referred to as a protonated-form of the sorbent, TiP1-H, in the text.
The α-TiP system was obtained at the conditions described above but at P2O5:TiO2 molar ratios larger than 1:1 (at least 1.2:1, a H3PO4:TiO2 molar ratio being greater than 2:1, at least 2.4:1). The Na-exchanged form of TiP1-H, TiP1-Na, was prepared by keeping the white solid TiP1-H for 24 hours in 0.5 mol dm−3 Na2CO3 solution (solid:liquid ratio = 1:50), under stirring, rinsed with deionised water until pH 5.5 was reached and dried at 60 °C. The LTP-H system was obtained at the conditions described above for TiP1-H but with heating for 24 hours (instead of 1 h) at 80 °C. The corresponding LTP-Na system was obtained analogously using 0.5 mol dm−3 Na2CO3 solution. A summary of the compounds and their characterisation is given in Table 1.
It should be noted that an excess of phosphoric acid during the synthesis for H3PO4:TiO2 molar ratios larger than 2:1, resulted in the formation of microcrystalline α-TiP, while a longer reaction time under heating, 24 hours at 80 °C at fixed 2:1 ratio, resulted in the formation of LTP-H sorbent. The TiP1-H substance was also obtained at the fixed 2:1 ratio but only for 1 hour reaction time. It is important to stress that all these compounds were obtained after sequential washings with hydrochloric acid and deionised water as described above. Using a lower temperature, 60–70 °C, and washing with diluted H3PO4 and/or water to final pH of 3.0–3.5 resulted in formation of aTiP.28,35
X-ray absorption data collection
X-ray absorption data were collected at the Synchrotron Light Research Institute (SLRI), Nakhon Ratchasima, Thailand, using the bending magnet beam line 8.37 SLRI operated at 1.2 GeV and a ring current of 80–150 mA. The radiation was monochromatised by an InSb[111] and Ge[220] double crystal monochromator for P and Ti K-edge measurements, respectively. The second monochromator crystal (InSb[111]) was not detuned as it has been shown that the 3rd/1st harmonics intensity ratio of InSb[111] at 2 keV is 0.3%.38 The data were collected in transmission mode using ion chambers with a gentle flow of helium gas. For each sample 3–5 scans were collected and averaged. The spectrum of red phosphorus or metallic titanium was recorded after beam fill and, thereafter at regular intervals assigning the first inflection point to 2145.5 and 4966.0 eV, respectively,39 to energy calibrate the spectra.The solid samples for transmission experiments were prepared by placing a thin layer of a finely ground powder on Nitto polypropylene tape (Nitto Denko Co., Japan) fixed on a plastic frame. The powder was spread out to a very thin layer with a spatula. When it was difficult to get sufficiently thin sample layers, the powders were diluted with boron nitride, BN. The goal was to get an absorption edge step in the range 0.5–1.0. The change in total absorption at the P edge was very large over the EXAFS range, 2–3 absorption units, Fig. S1 (ESI†). It was therefore important to tune the absorption edge step close to 0.5–1.0 as a larger absorption step would cause an even larger change in total absorption over the entire EXAFS range, and a smaller step might increase the noise level in the data.
X-ray absorption data treatment
The EXAFS oscillations were extracted from averaged raw data using standard procedures for pre-edge subtraction, spline removal and data normalisation. In order to obtain quantitative information of the coordination structure of the titanium(IV) and phosphate ions, the experimental k3-weighted EXAFS oscillations were analysed by non-linear least-squares fits of the data to the EXAFS equation, refining the model parameters, number of backscattering atoms, N, mean interatomic distance, R, Debye–Waller factor coefficient, σ2, and the relative ionisation energy, ΔEo. The data analysis was performed using the EXAFSPAK program package.40 The theoretical phases and amplitudes used in the refinements were calculated by the FEFF7 program, version 7.02.41 The standard deviations reported for the refined parameters listed in the Results section (Tables 3 and 4) are those related to the least-squares refinements and no systematic errors were included. In the text, the systemic errors are included in the estimated standard deviations. Variations in the refined parameters obtained using different models and data ranges indicated that the accuracy of the distances given for the separate samples was within ±0.005–0.02 Å, typical for well-defined interactions.| Sample no./colour code | Abbreviation | Chemical substance after acidic wash | δ iso (ppm) | Ref. |
|---|---|---|---|---|
| a Narrow resonance line partially split in two lines near the top: −6.5 and −8.4 ppm. | ||||
| Sample 1/purple | TiP1/TiP1-H | TiO(OH)(H2PO4)·H2O | −7.3 | 2 and 28 |
| Sample 2/red-brownish | Alpha-TiP/α-TiP | α-Ti(HPO4)2·H2O | −18.8 | 2 |
| Sample 3/grey | LTP/LTP-H | Linked units (TiP1 and α-TiP) | −7.0; −18.7 | 14 |
| Sample 4/light-blue | Amorphous TiP/aTiP | Different TiP units are present | +10 to −35 | 28 |
| Sample 5/yellow | LTP-Na | Na-exchanged LTP-H | +5.4 to +2.0 | 14 |
| −14.8 | ||||
| Sample 6/black | LTP-pro, H (processed) | LTP-acid regenerated sorbent/traces of Ni2+ | +10 to −15 | 14 |
| −14.9 | ||||
| Sample 7/pink | TiP1-Na | Na-exchanged TiP1-H | +5.6 and +0.9 | ESI in 2 |
| α-Ti(HPO4)2·H2O | −18.1 | 47 | ||
| TiO(OH)(H2PO4)·2H2O | −7.5a | 45 | ||
| Interaction | N | d | σ 2 | E o | S o 2 | F |
|---|---|---|---|---|---|---|
| Ti(HPO 4 )·H 2 O, α-TiP (sample 2) | ||||||
| P–O | 4 | 1.547(2) | 0.0041(3) | −3.2(5) | 0.80(3) | 15.8 |
| P⋯Ti | 3 | 3.325(9) | 0.0029(12) | |||
| P–O–Ti | 6 | 3.441(9) | 0.0029(10) | |||
| P⋯O | 6 | 4.009(9) | 0.0034(10) | |||
| P⋯O | 12 | 5.72(3) | 0.008(8) | |||
| P⋯Ti | 6 | 5.98(3) | 0.012(3) | |||
| Amorphous TiP, aTiP, (sample 4) | ||||||
| P–O | 4 | 1.529(2) | 0.0028(2) | −4.4(4) | 0.75(3) | 11.4 |
| P⋯Ti | 3 | 3.254(7) | 0.0045(8) | |||
| P–O–Ti | 6 | 3.379(10) | 0.0033(12) | |||
| P⋯O | 6 | 3.70(6) | 0.04(4) | |||
| TiP1-H (sample 1) | ||||||
| P–O | 4 | 1.530(1) | 0.0054(2) | −6.9(3) | 0.85(2) | 8.1 |
| P⋯Ti | 3 | 3.191(6) | 0.0035(10) | |||
| P–O–Ti | 6 | 3.290(6) | 0.0059(12) | |||
| P⋯O | 6 | 3.90(2) | 0.015(3) | |||
| P⋯O | 6 | 4.45(2) | 0.014(3) | |||
| LTP-H (sample 3) | ||||||
| P–O | 4 | 1.530(2) | 0.0023(2) | −7.1(4) | 0.75(3) | 20.3 |
| P⋯Ti | 3 | 3.252(8) | 0.0008(10) | |||
| P–O–Ti | 6 | 3.361(11) | 0.003(1) | |||
| P⋯O | 6 | 3.98(2) | 0.054(2) | |||
| TiP1-mix (sample 9) | ||||||
| P–O | 4 | 1.527(2) | 0.0033(2) | −7.3(4) | 0.82(3) | 8.4 |
| P⋯Ti | 3 | 3.257(10) | 0.010(1) | |||
| P–O–Ti | 6 | 3.384(16) | 0.011(2) | |||
| P⋯O | 6 | 3.78(2) | 0.019(4) | |||
| TiP1-mixCa (sample 10) | ||||||
| P–O | 4 | 1.526(1) | 0.0033(2) | −7.2(3) | 0.82(1) | 12.9 |
| P⋯Ti | 3 | 3.254(8) | 0.010(1) | |||
| P–O–Ti | 6 | 3.377(15) | 0.012(2) | |||
| P⋯O | 6 | 3.76(2) | 0.020(4) | |||
| Interaction | N | d | σ 2 | E o | S o 2 | F |
|---|---|---|---|---|---|---|
| Ti(HPO 4 ) 2 ·H 2 O (s), α-TiP (sample 2) (k = 3–11 Å −1 ) model: 100% TiO 6 | ||||||
| Ti–O | 6 | 1.965(2) | 0.0074(2) | 2.1(2) | 0.88(2) | 9.5 |
| Ti⋯P | 6 | 3.350(4) | 0.0066(6) | |||
| Ti–O–P | 12 | 3.447(4) | 0.0085(7) | |||
| Ti⋯Ti | 6 | 4.687(9) | 0.0202(12) | |||
| Ti–O–P mean angle: 146.4° (146.6°, mean in the crystal structure, ref. 4, 9, 10 and 27) | ||||||
| TiO(OH)(H 2 PO 4 )·H 2 O, TiP1-H (sample 1) (k = 2–12 Å −1 ) model: 100% titanyl | ||||||
| TiO |
1.0 | 1.722(5) | 0.0041(4) | −10.6(4) | 0.88(2) | 9.2 |
| Ti–O | 4 | 1.907(2) | 0.0047(2) | |||
| Ti–O | 1 | 2.41(1) | 0.012(2) | |||
| Ti⋯P | 4 | 3.184(2) | 0.0054(3) | |||
| Ti–O–P | 8 | 3.298(6) | 0.0117(6) | |||
| Ti⋯Ti | 6 | 5.14(4) | 0.037(5) | |||
| Ti–O–P mean angle: 135.5° | ||||||
| Amorphous TiP, aTiP (sample 4) (k = 3–11 Å −1 ) model: 50% titanyl and 50% TiO 6 | ||||||
| TiO |
0.5 | 1.723(6) | 0.0016(9) | −0.1(4) | 0.88(3) | 9.6 |
| Ti–O | 5 | 1.940(3) | 0.0117(6) | |||
| Ti⋯P | 5 | 3.227(3) | 0.0095(3) | |||
| Ti–O–P | 10 | 3.365(4) | 0.0164(5) | |||
| Ti⋯O | 6 | 4.13(2) | 0.036(4) | |||
| Ti⋯Ti | 6 | 5.20(4) | 0.038(5) | |||
| Ti–O–P mean angle: 136.5° | ||||||
| LTP-H (sample 3) (k = 3–10 Å −1 ) model: 37% titanyl and 63% TiO 6 | ||||||
| TiO |
0.5 | 1.716(8) | 0.0036(8) | −7.8(6) | 0.90(2) | 8.1 |
| Ti–O | 5.26 | 1.894(5) | 0.0063(3) | |||
| Ti–O | 0.5 | 2.422(6) | 0.0077(7) | |||
| Ti⋯P | 5 | 3.181(5) | 0.0113(3) | |||
| Ti–O–P | 10 | 3.303(6) | 0.0144(5) | |||
| Ti⋯O | 6 | 3.68(3) | 0.034(5) | |||
| Ti⋯Ti | 6 | 5.16(3) | 0.032(4) | |||
| Ti–O–P mean angle: 136.4° | ||||||
| LTP-Na (sample 5) (k = 3–10 Å −1 ) model: 75% titanyl and 25% TiO 6 | ||||||
| TiO |
0.75 | 1.691(7) | 0.0027(9) | −11.3(7) | 0.85(4) | 12.4 |
| Ti–O | 5 | 1.894(5) | 0.0073(2) | |||
| Ti–O | 0.75 | 2.447(9) | 0.0041(12) | |||
| Ti⋯P | 4.5 | 3.189(5) | 0.0128(9) | |||
| Ti–O–P | 9 | 3.294(9) | 0.029(5) | |||
| Ti⋯O | 6 | 3.65(3) | 0.027(3) | |||
| Ti⋯Ti | 6 | 5.23(2) | 0.023(2) | |||
| Ti–O–P angle angle: 137.1° | ||||||
| LTP-processed, H (sample 6) (k = 3–11 Å −1 ) 100% titanyl | ||||||
| TiO |
1.0 | 1.699(8) | 0.0041(9) | −9.5(7) | 0.83(3) | 11.1 |
| Ti–O | 4 | 1.899(5) | 0.0122(5) | |||
| Ti–O | 1 | 2.414(6) | 0.0064(7) | |||
| Ti⋯P | 4 | 3.162(4) | 0.0089(4) | |||
| Ti–O–P | 8 | 3.292(5) | 0.0186(8) | |||
| Ti⋯O | 6 | 3.73(2) | 0.022(2) | |||
| Ti⋯Ti | 6 | 5.26(2) | 0.030(2) | |||
| Ti–O–P mean angle: 134.8° | ||||||
| TiP1-mix (sample 9) TiO(OH)(H 2 PO 4 )·H 2 O (k = 3–10 Å −1 ) model: 100% titanyl | ||||||
| TiO |
1.0 | 1.692(8) | 0.0047(9) | −9.7(7) | 0.82(2) | 13.6 |
| Ti–O | 4 | 1.897(5) | 0.0079(6) | |||
| Ti–O | 1 | 2.460(9) | 0.0073(2) | |||
| Ti⋯P | 4 | 3.163(7) | 0.0090(10) | |||
| Ti–O–P | 8 | 3.299(8) | 0.0136(12) | |||
| Ti⋯Ti | 6 | 5.26(2) | 0.024(2) | |||
| Ti–O–P mean angle: 134.6° | ||||||
| TiP1-mixCa (sample 10) TiO(OH)(H 2 PO 4 )·H 2 O (k = 3–10 Å −1 ) model: 100% titanyl | ||||||
| TiO |
1.0 | 1.698(5) | 0.0057(6) | −9.6(7) | 0.86(2) | 14.6 |
| Ti–O | 4 | 1.895(3) | 0.0098(6) | |||
| Ti–O | 1 | 2.43(1) | 0.0085(7) | |||
| Ti⋯P | 4 | 3.148(5) | 0.015(1) | |||
| Ti–O–P | 8 | 3.29(1) | 0.023(2) | |||
| Ti⋯Ti | 6 | 5.21(4) | 0.040(5) | |||
| Ti–O–P mean angle: 133.3° | ||||||
Solid-state 47/49Ti and 31P NMR spectroscopy
Solid-state 49Ti/47Ti NMR and 31P 2D NOESY NMR spectra were acquired at ∼20 T using a Bruker Avance Neo 850 MHz spectrometer operating at 47.9 MHz for 49Ti and 344.2 MHz for 31P. Static 49Ti/47Ti NMR spectra were obtained using a 7 mm probe. A weak (70 W corresponding to 13 kHz RF field strength) 2 ms double frequency sweep42 from ±1 MHz to ±200 kHz was used to saturate the satellite transitions followed by a static Hahn echo experiment with 100 μs echo delay. The 90° and 180° pulses were set to 1.625 and 3.33 μs, respectively, using 600 W (corresponding to 38.5 kHz RF field strength). The relaxation delay was 250 ms and depending on the signal-to-noise 30000–150000 acquisitions were co-added. A 4 mm probe spinning at 14 kHz was used for a Magic Angle Spinning (MAS) experiment on 49Ti/47Ti with 164472 acquisitions. The same probe spinning at 8 kHz was used for 31P NOESY experiments on LTP with a mixing time of 6 s and a relaxation delay of 20 s. There were 136 slices with 16 acquisitions per slice and the spectrum was acquired out to 2.8 ms in the indirect dimension. Titanium spectra were referenced using a secondary reference, SrTiO3, with the 49Ti signal set to −843 ppm relative to the primary reference of 49Ti in TiCl4.43 (47Ti signal at −1109 ppm). The 49Ti/47Ti NMR spectra were simulated using dmfit.44
31P MAS NMR data for TiPs were obtained at 162.0 MHz using a Bruker Ascend Aeon WB 400 MHz spectrometer (∼9.4 T). A 4 mm probe spinning at 12 kHz was used. A single-pulse experiment was used with pulse width of 1.5 μs, pulse delay of 5 s, and 64 acquisitions. All 31P NMR data were referenced to solid NH4H2PO4 and reported w.r.t. primary standard reference 85% H3PO4 (0 ppm).
X-ray powder diffraction
The chemical identity of the samples of interest has been confirmed with powder XRD (pXRD) and data have been published elsewhere as summarised in Table S2 (ESI†). The data for LTP-Na along with the related LTP-H pattern are shown in Fig. S2 (ESI†). The pXRD pattern of Na-LTP was recorded using a PANalytical Empyrean diffractometer run in Bragg–Brentano geometry with CuKα radiation (λ = 1.5406 Å). The sample was scanned in the 2θ range 2–70° with a 2θ step size of 0.0260° and a scan step time of 3.3 min.Results
31P NMR data and relation to long and short range order features of TiP systems as characterised by pXRD
The previously reported 31P MAS NMR data of TiP ion-exchange materials are summarised in Table 2 along with the data for reported related TiP analogies. The most important 31P MAS NMR data are shown in Fig. 1. With the exception of amorphous TiP, aTiP, all compounds display rather narrow phosphorus resonance lines indicating the local structure is well ordered despite (from pXRD) poor long range order. The data in Table 2 refer to the final acid and water washed materials. The 31P MAS NMR spectrum of protonated α-TiP displays a single resonance line at −18.8 ppm assigned to –HPO4 exchange units dominating in this material.2 The spectrum of the TiP1-H sample reflects that –H2PO4 is the only exchange unit, seen by a single resonance at −7.3 ppm. The inter-linked TiP substance, LTP-H, shows two resonance lines close to these positions, −7.0 and −18.7 ppm, with an approximate integral ratio of 1:1.
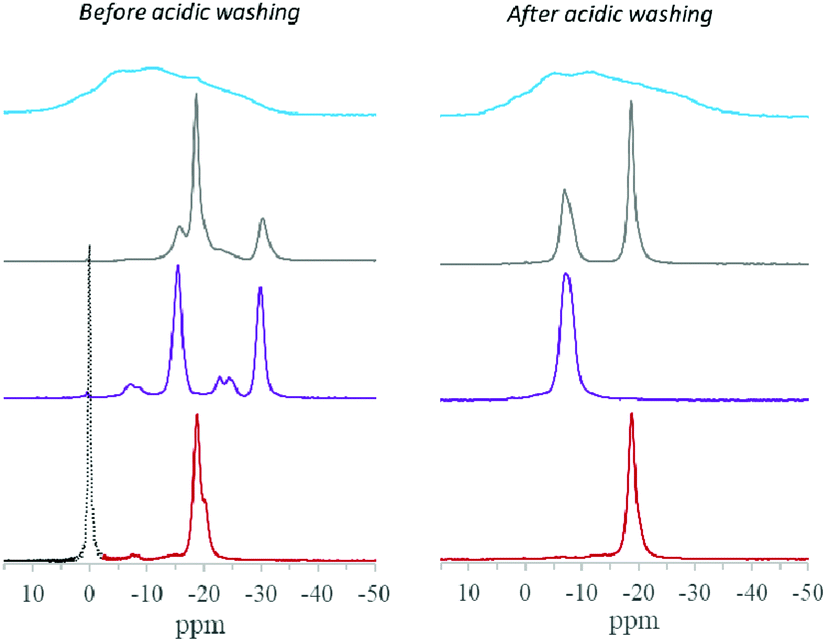 | ||
Fig. 1 Single-pulse 31P MAS NMR spectra of TiP sorbents before the acidic washing with hydrochloric acid and deionised water (left side) and after the post-synthesis treatment (right side) of  – sample 4, – sample 4,  – sample 3, – sample 3,  – sample 1 and – sample 1 and  – sample 2. The presence of residual H3PO4 is indicated by its resonance line (in dash). Data from ref. 38 with permission. It is noteworthy that before acidic washing the 31P NMR data for LTP-H, TiP1-H and α-TiP show presence of primary formed α-/γ-TiP species (for LTP-H), β-/γ-TiP species (for TiP1-H) and mainly α-TiP species (for α-TiP), respectively. – sample 2. The presence of residual H3PO4 is indicated by its resonance line (in dash). Data from ref. 38 with permission. It is noteworthy that before acidic washing the 31P NMR data for LTP-H, TiP1-H and α-TiP show presence of primary formed α-/γ-TiP species (for LTP-H), β-/γ-TiP species (for TiP1-H) and mainly α-TiP species (for α-TiP), respectively. | ||
The TiP1-Na and LTP-Na materials show an additional chemical shift in the corresponding phosphorous sites to lower 31P NMR resonance frequencies (more positive ppm) due to “de-shielding” effects of the exchanged sodium ions in the proximity of the phosphorous sites, Table 2. Line-broadening of the 31P NMR resonance lines in the spectra of these samples has revealed the complex nature of H+-to-Na+ ion-exchange processes lead to a partial, maximum 60%, exchange of proton to sodium sites.35 These processes occur also in the case of α-TiP but to a lesser extent. A broad resonance line with a chemical shift ranging from ca. −19 to −15 ppm has been observed after proton-sodium ion exchange treatment of α-TiP with NaOH.46
It should be noted that the local structure around the 31P sites of –H2PO4 units in inter-linked LTP-Na has changed considerably more (by 12.4 ppm) during the sodium-exchange i.e. for the protonated form, LTP-H, a single 31P resonance line at −7.0 ppm was observed, while it shifts to the positive range up to +5.4 ppm upon Na-exchange and the resonance line becomes broader with additional multiple low-intensity resonance lines encountered.14 For comparison, the changes of the isotropic chemical shift for HPO4-units (primary at −18.7 ppm in LTP-H) are less pronounced upon Na-exchange: an additional 31P resonance a shift of only 3.9 ppm was observed i.e., to −14.8 ppm which is in the range of reported data in ref. 46 (all data are summarised in Table 2). In both cases that is likely due to Na-exchange and/or Na-intercalation into the titanium phosphate matrix.
The corresponding powder XRD data of these materials are shown in Fig. 2 and the first reflection angle and dspacing data are given in Table S2 (ESI†). Powder XRD data clearly show the amorphous nature of the aTiP system, that TiP1-H is weakly ordered and the considerably higher crystallinity of α-TiP. The inter-linked system, LTP-H displays a somewhat different pattern with some reflections being narrower than others indicating significant long-range order.
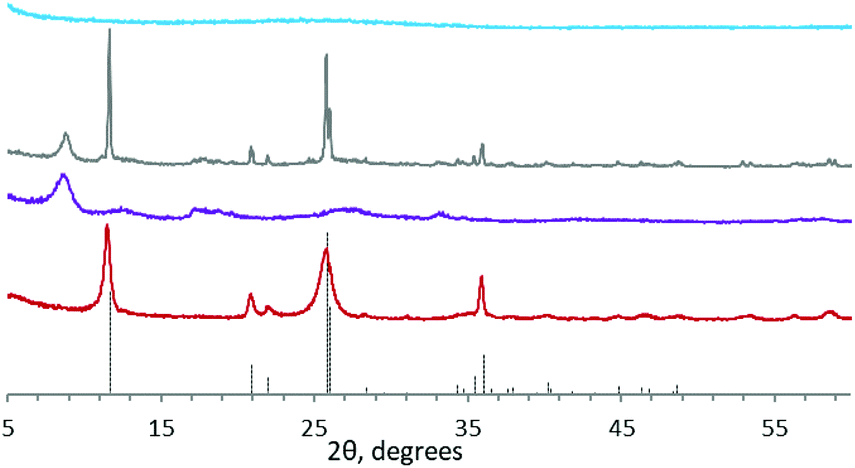 | ||
Fig. 2 Powder XRD patterns of the synthesised TiP products:  – sample 4, – sample 4,  – sample 3, – sample 3,  – sample 1 and – sample 1 and  – sample 2 (adapted from ref. 35). The dotted line represents the referenced pattern of α-TiP (ref. 4). – sample 2 (adapted from ref. 35). The dotted line represents the referenced pattern of α-TiP (ref. 4). | ||
In an attempt to further characterise the LTP-H material and to unambiguously confirm the relations between the different units, a solid-state 31P–31P 2D NOESY NMR48 spectrum was acquired (see Fig. 3).
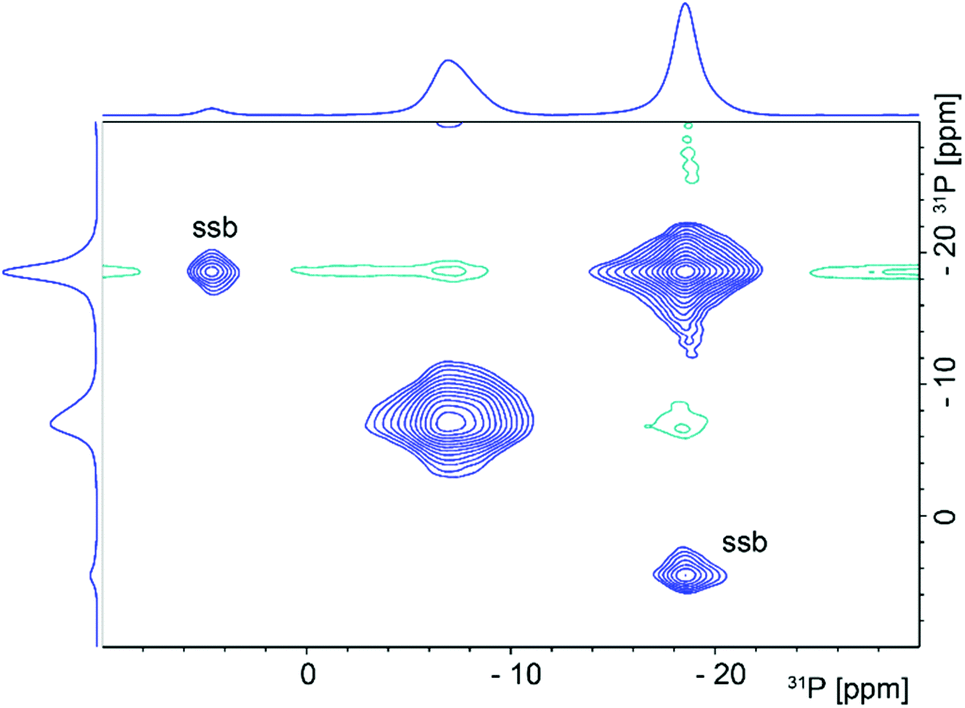 | ||
| Fig. 3 2D 31P–31P NOESY NMR spectrum of LTP (sample 3). The spinning sidebands are indicated by ssb. | ||
Two intense diagonal peaks at ca. −7.4 and −18.6 ppm in the 2D NMR spectrum together with a couple of spinning sidebands (ssb) can be seen. Normally, if the 31P–31P distance is small enough for spin diffusion to occur there would be positive-intensity cross peaks at (−7.4, −18.6) ppm and (−18.6, −7.4) ppm. Such positive cross peaks are not seen but small peaks with negative intensities (in green) at these positions are visible. It is difficult to determine a precise P–P distance due to the lack of standard crystalline samples with two or more 31P sites. However, from the long mixing time, 6 s, needed to observe the cross peaks one would estimate a distance of ca. 5–10 Å which indicates that the signal arises from a single phase material, rather than a mixture of individual phases, α-TiP and TiP1-H, in the sample. Note that in the reported structures of α-, β- and γ-TiP systems, Table S1 (ESI†), the P⋯P distances are in the range 4.2–6.4 Å within the layers, and 5.0–8.0 Å between the layers, respectively.4,7,9,21
In addition, sorption experiments with LTP-Na and TiP1-Na imply regeneration of the sorbent using diluted acid, desorption of metal ions, followed by step of Na2CO3 treatment for conversion to its Na-form. The two powder XRD diffractograms of LTP-H and LTP-Na, Fig. S2 (ESI†) display rather different patterns. The diffractogram for LTP-H has a first broad reflection at 2θ = 8.70° and a second narrow one at 2θ = 11.55°, corresponding to interlayer distances of 10.16 Å and 7.66 Å, respectively. The diffractogram of LTP-Na shows a first narrow reflection at 2θ = 10.51° corresponding to an interlayer distance of 8.41 Å. It is evident that the LTP-H sorbent has undergone a structural rearrangement during the Na-exchange and the interlayer distance has increased.
The LTP-Na material was studied at dynamic conditions for the sorption of nickel(II) ions in a fixed-bed column (sample 5). It was found that the sorbent could be regenerated for at least four cycles with a similar ion-exchange capacity (IEC), and two additional cycles with a slight decrease of the IEC.1431P MAS NMR of LTP-H after the sixth regeneration with diluted hydrochloric acid (sample 6) showed a broader resonance line with a smaller integral intensity in the region of –H2PO4 groups (from +10 to −15 ppm) compared to the primary LTP-H compound (−7 ppm, narrow line). Further analyses revealed that no phosphorus species were hydrolysed during the sorption process, suggesting that the broadness and the lower intensity of the resonance line is attributed to the presence of some paramagnetic nickel(II) left in the material or a structural rearrangement of the material. Similarly, no distinct 31P resonance lines were observed for samples 8, 9 and 10 where presence of different trace amounts of transition metal ions could be associated with the lack of signal. Thus, X-ray absorption remains the only tool to reveal the coordination around the P and Ti in these systems strongly affected by sorption/desorption processes.
Phosphorus K edge XANES spectra
The standard polycrystalline sodium phosphate salts NaH2PO4·H2O, Na2HPO4·7H2O and Na3PO4·12H2O were used in the study as reference material with different protonation of the phosphate groups. The phosphorus XANES spectra of these sodium phosphates with different degree of protonation and selected titanium phosphate sorbents are collected in Fig. 4. Solid NaH2PO4·H2O, Na2HPO4·7H2O and Na3PO4·12H2O show a single sharp transition (“white line”) at 2154.5 eV, marked with thick dash-line in Fig. 4, which is in full agreement with previous studies.49,50 The titanium phosphates investigated here also show a sharp transition at this energy, with the exception of amorphous titanium phosphate (aTiP) where the transition is considerably broader and less intense. In addition, clearly visible transitions at lower energies, 2149.6 and 2152.1 eV defined with thin dash-lines in Fig. 4, are observed in all titanium phosphate compounds studied. The origin of these transitions is due to the density of states of titanium recognised by fitting the P K edge region applying finite differences methods (FDM) and full multiple scattering theory using the FDMNES code.51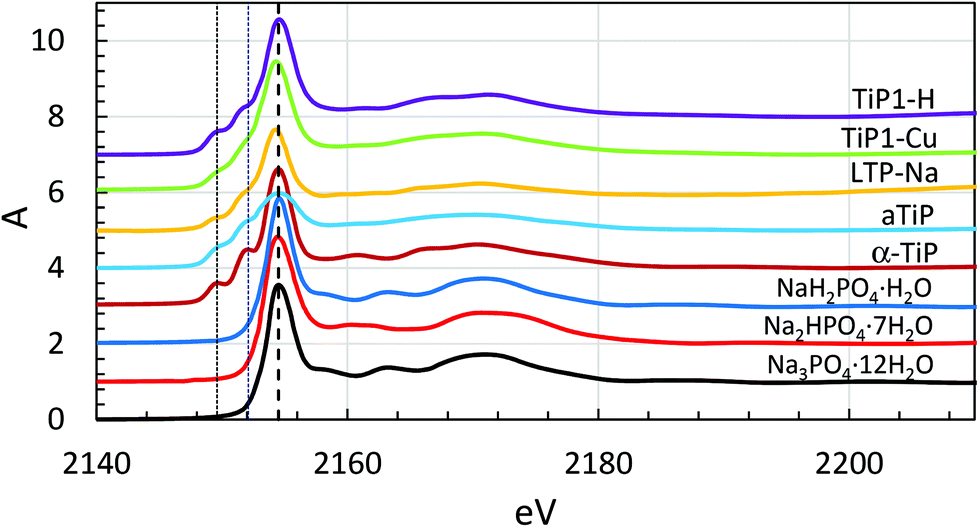 | ||
Fig. 4 Normalised phosphorus K edge XANES absorption edges of solid titanium(IV) and sodium phosphates. Offset steps: 1.0. The help lines are at 2149.6 and 2152.1 eV; sample 1 –  , sample 2 – , sample 2 –  , sample 4 – , sample 4 –  , sample 5 – , sample 5 –  , sample 8 – , sample 8 –  (no data were collected on samples 3, 6, 7, 9 and 10). (no data were collected on samples 3, 6, 7, 9 and 10). | ||
Phosphorus K edge EXAFS
The phosphorus K edge EXAFS spectra of all TiP compounds are similar with P–O bond distances of 1.53(1) Å, and P⋯Ti single scattering and P–O–Ti 3-leg scattering in agreement with the results obtained by Ti EXAFS, see Tables 3 and 4. The refined structure parameters of the studied samples are summarised in Table 3, and the fit of the EXAFS data and the Fourier transforms are shown in Fig. 5 and S3 (ESI†), respectively.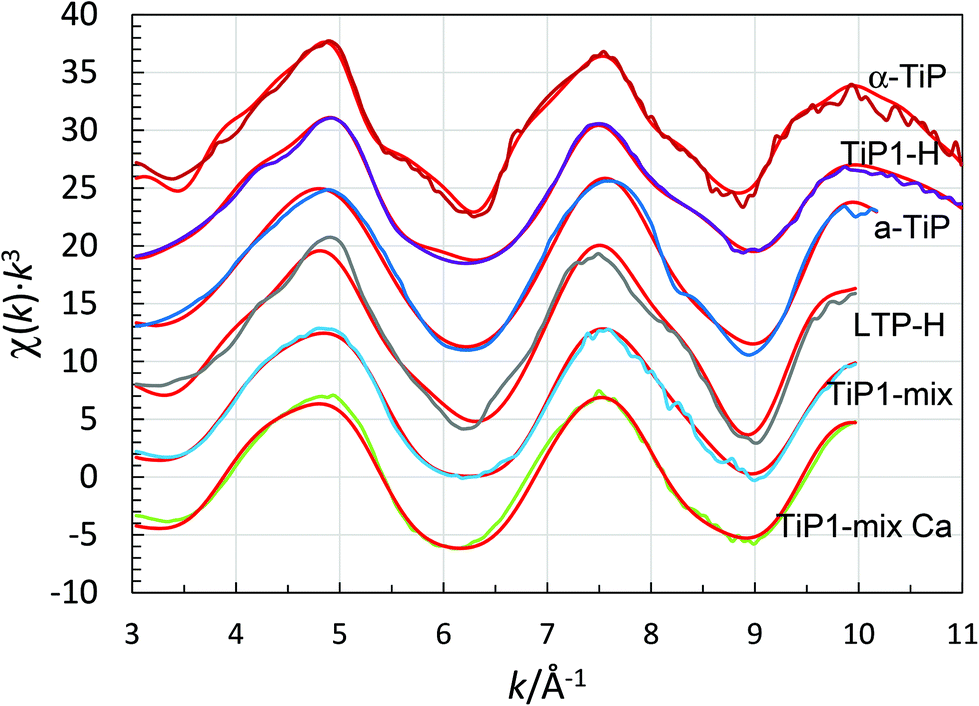 | ||
Fig. 5 Fit of phosphorus K edge EXAFS data of titanium(IV) phosphates, experimental – coloured lines, models with structure parameters from Table 4 – red lines, sample 2 –  (offset: 30), sample 1 – (offset: 30), sample 1 –  (offset: 24), sample 4 – (offset: 24), sample 4 –  (offset: 18), sample 3 – (offset: 18), sample 3 –  (offset: 12), sample 9 – (offset: 12), sample 9 –  (offset: 6), and sample 10 – (offset: 6), and sample 10 –  (no offset). (no offset). | ||
Titanium K edge XANES spectra
The Ti K edge XANES spectra of the samples are shown in Fig. 6 and S4 (ESI†), and a close-up of the pre-edge region in Fig. 7. The intensity of the pre-peak is expected to be low for regular octahedral coordination, and the intensity increases with decreasing symmetry of the coordination around titanium, 0–0.4 absorption units.30 The pre-edge intensity varies substantially between the TiP samples, 0.03–0.30 absorption units, but it strongly indicates that all the TiP samples have essentially six-coordination.30 The lowest intensity was observed for α-TiP, having most symmetrical TiO6 arrangement in comparison to the other TiP materials. The crystal structure of α-TiP has been reported in several studies to have a slightly distorted octahedral configuration around titanium.4,7,9,21 Compounds such as TiP1-H, TiO(OH)(H2PO4)·H2O, with a TiO double bond have a significantly more intense pre-peak as expected due to the lower symmetry around titanium, Fig. 6 and 7. Among these, the compounds containing a metal ion, samples 5–7, 9 and 10, have the most intense pre-peaks indicating a low-symmetrical coordination around titanium, and the pre-peak maxima are close to 4971.0 eV, Fig. 7. It is noteworthy that for all compounds with a pre-peak intensity higher than 0.2, the 49Ti NMR line is so broadened by the quadrupole interaction that no useful data could be obtained, vide infra. The compounds α-TiP, TiP1-H and LTP-H have pre-peak maxima at 4971.5, and of these α-TiP and TiP1-H are viewed as pure. The pre-edge spectrum of α-TiP was regarded as model for octahedral coordination around titanium (TiO6) and TiP1-H as model for titanyl compounds with a short TiO double bond, four Ti–O single bonds perpendicular and a long Ti–O single bond trans to the TiO bond. The pre-peak spectrum of the LTP-H sample was fitted by linear regression of the spectra α-TiP and TiP1-H, and an excellent fit was obtained with 63% TiO6 and 37% titanyl, Fig. S5 (ESI†). The XANES region indicate that the coordination around titanium in the LTP-H sample is dominated by Ti–O single bonds with fairly regular octahedral symmetry around titanium, while the other samples except α-TiP have lower symmetry around titanium and lower charge density on titanium indicating a significant content of titanyl compounds in these compounds. The position of the absorption edge is also affected by the Ti–ligand bonds with a titanyl group reducing the effective charge on titanium more efficiently than Ti–O single bonds, Fig. 6 and S4 (ESI†).
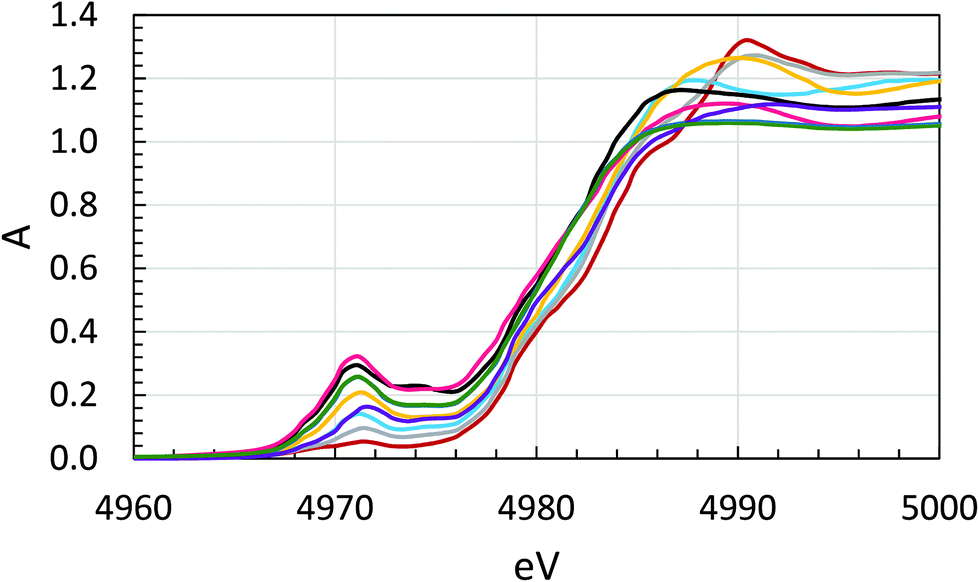 | ||
Fig. 6 Titanium K edge XANES spectra of titanium(IV) phosphates, sample 1 –  , sample 2 – , sample 2 –  , sample 3 – , sample 3 –  , sample 4 – , sample 4 –  , sample 5 – , sample 5 –  , sample 6 – LTP-pro, sample 7 – , sample 6 – LTP-pro, sample 7 –  and sample 9 – and sample 9 –  and sample 10 – and sample 10 –  (overlapping spectra samples 9 and 10), (sample 8 – no data available). (overlapping spectra samples 9 and 10), (sample 8 – no data available). | ||
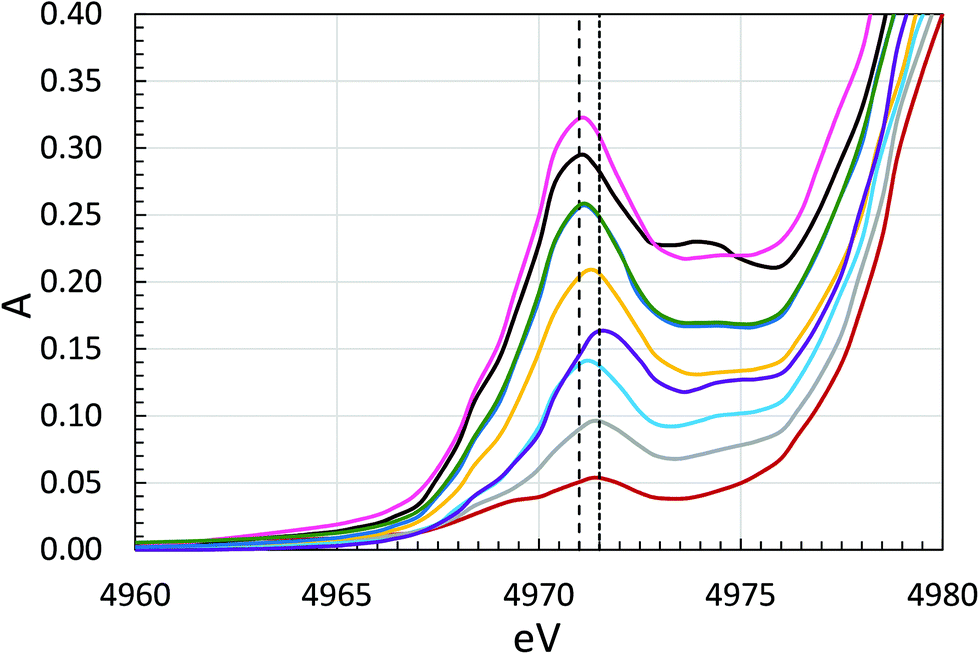 | ||
Fig. 7 Close-up of titanium K pre-edge peak in XANES spectra of titanium(IV) phosphates, sample 1 –  , sample 2 – , sample 2 –  , sample 3 – , sample 3 –  , sample 4 – , sample 4 –  , sample 5 – , sample 5 –  , sample 6 – LTP-pro, sample 7 – , sample 6 – LTP-pro, sample 7 –  , sample 9 – , sample 9 –  and sample 10 – and sample 10 –  (overlapping spectra). Help-lines at 4971.0 and 4971.6 eV show pre-peak maxima for samples 6, 7, 9 and 10, and samples 1–3, respectively. (No data for sample 8 are available.) (overlapping spectra). Help-lines at 4971.0 and 4971.6 eV show pre-peak maxima for samples 6, 7, 9 and 10, and samples 1–3, respectively. (No data for sample 8 are available.) | ||
Titanium K edge EXAFS
The titanium K edge EXAFS spectrum of α-TiP (sample 2) has a significantly different feature than the other samples, Fig. 8. A good fit of α-TiP is obtained by a model of an octahedral configuration of oxygen atoms around titanium at 1.965(6) Å and Ti⋯P single scattering and Ti–O–P 3-leg scattering to the bound hydrogen phosphate ions with a mean Ti–O–P bond angle of 147(2)°, Table 3, which is in excellent agreement with reported crystal structures.4,7,9,21 The structure of TiP1-H (TiO(OH)H2PO4·H2O, sample 1) has a typical titanyl TiO bond distance of 1.72(1) Å, and four Ti–O bond distances in the equatorial plane of a mean of 1.905(5) Å. The mean Ti–O–P bond angle is significantly smaller, 134(2)°, than in α-TiP.
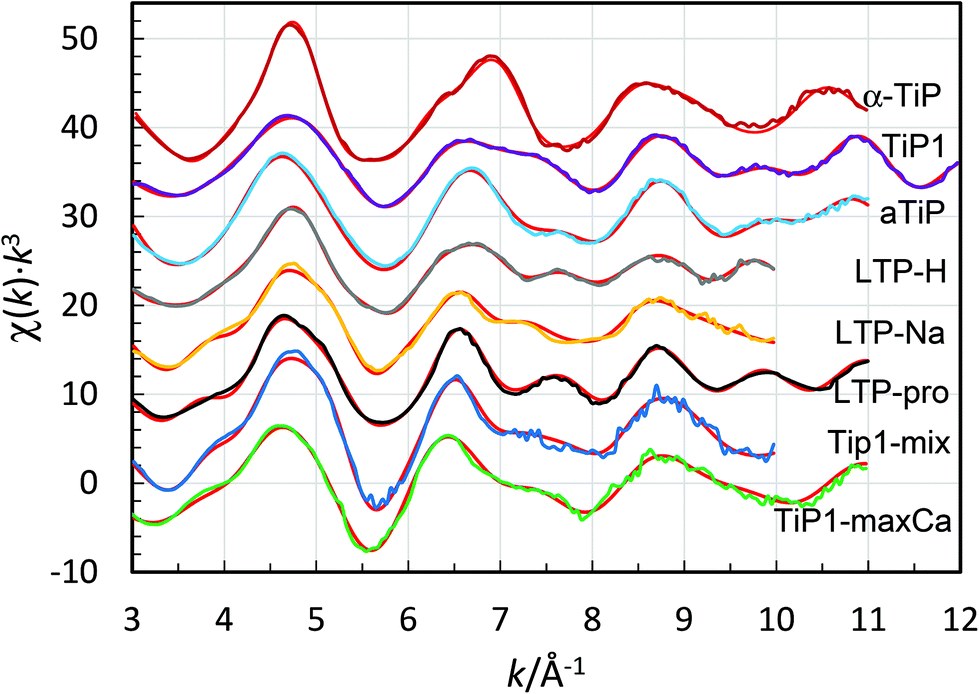 | ||
Fig. 8 Fit of titanium K edge EXAFS data of titanium(IV) phosphates, experimental – colored lines, models with structure parameters (in Table 3) – red lines, sample 2 –  , sample 1 – , sample 1 –  , sample 4 – , sample 4 –  , sample 3 – , sample 3 –  , sample 5 – , sample 5 –  , sample 6 – LTP-pro, sample 9 – , sample 6 – LTP-pro, sample 9 –  , and sample 10 – , and sample 10 –  , and (sample 7 – data of insufficient quality, and no data available for sample 8). The offset between the spectra is 8. , and (sample 7 – data of insufficient quality, and no data available for sample 8). The offset between the spectra is 8. | ||
The other samples have similar Ti EXAFS spectra containing a significant fraction of titanyl groups. The distribution of TiO6 and titanyl sites in sample LTP-H from the pre-edge evaluation, see above, was used as fixed number of distances in the refinement of the EXAFS data. The TiO bond distance has been refined to ca. 1.7 Å, and the Ti–O bond distances at ca. 1.9 Å are a mean of the four Ti–O bonds perpendicular to the titanyl group and the six Ti–O bonds in distorted octahedral coordination. The Ti–O bond distances in octahedral and titanyl compounds have to be refined as one mean distance as the distances are too close to each other to be refined separately. The mean Ti–O bond distances have been refined to 1.90–1.94 Å, with fairly large Debye–Waller coefficients due to different complexes with somewhat different Ti–O bond distances present in the samples. The mean Ti–O–P angle in these compounds are significantly smaller than in α-TiP, on average ca. 136° (ranging from ca. 133° to 138°). The refined structure parameters of these samples are summarised in Table 4, and the fit of the EXAFS data and the Fourier transforms are shown in Fig. 8 and S6 (ESI†), respectively.
Solid-state 47/49Ti NMR spectroscopy
For samples aTiP (sample 4), LTP-Na (sample 5) and TiP1-Na (sample 7) only a very weak, broad line was observed (not shown) indicating that the titanium is in a very non-symmetrical environment, supported by Ti XANES, vide ultra. The static 47/49Ti NMR spectrum of LTP-H (sample 3), shown in Fig. 9, give clear evidence of (at least) two components, a broad (∼30 kHz wide) featureless asymmetric line (site 2) and a much narrower component for which both 49Ti and 47Ti are resolved (site 1). In contrast, for TiP1-H (sample 1) only a broad featureless line was observed which, as can be seen from the overlay, is very similar to the broad component of the LTP-H sample (site 2). A subtraction of the two spectra, also shown in Fig. 9, confirms the similarity of the broad components and allows further analysis of the narrow component.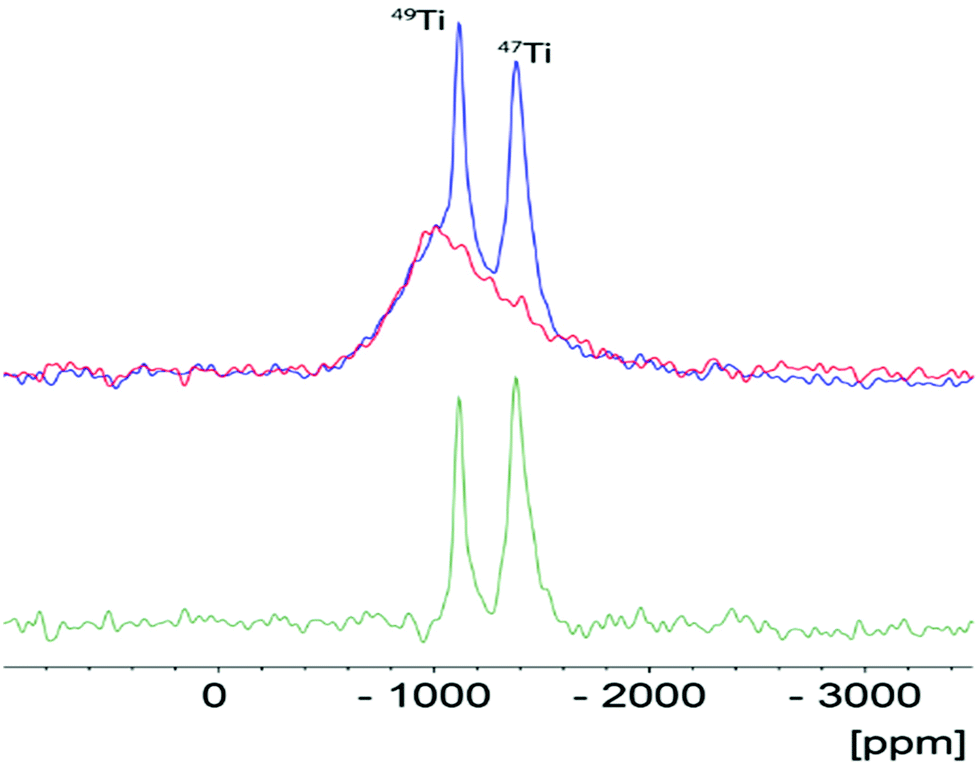 | ||
| Fig. 9 Static titanium NMR spectra of TiP1-H (red) and LTP-H (blue), scaled to the same height, and their difference (green). The resonances from both titanium isotopes, 49Ti and 47Ti, are clearly resolved in the difference spectrum. | ||
By spinning at 14 kHz it was possible to narrow both 47Ti and 49Ti signals for the more symmetric site of LTP-H but only 47Ti for the more distorted site since the linewidth of the 47Ti resonance, being ∼3.5 times that of 49Ti, is much too large to be narrowed. The MAS spectrum is shown in Fig. 10 together with a simulation. The static spectra were also simulated using the quadrupole and shift parameters determined from the MAS simulation, however, it was found that it was necessary to include chemical shift anisotropy (CSA) to obtain a good fit. A simulation of the static spectrum of LTP-H is shown in Fig. S7 (ESI†). There is considerable uncertainty in the precise CSA values, but it is clear that the more symmetric site has, as expected, smaller anisotropy. It is not possible to estimate the relative amounts of the two Ti sites in LTP-H from 47/49Ti NMR, because of the different spins of the two isotopes and because the enhancement of the signal from using a digital frequency sweep42 is dependent on the size of the quadrupolar interaction, which is very different for the two sites. Table 5 summarises the 49Ti NMR parameters for TiP1-H and of the two components for LTP-H samples. Simulation parameters used for the 49Ti and 47Ti static spectrum of LTP-H and corresponding parameters for published titanium and zirconium phosphates can be found in Tables S3 and S4 (ESI†).
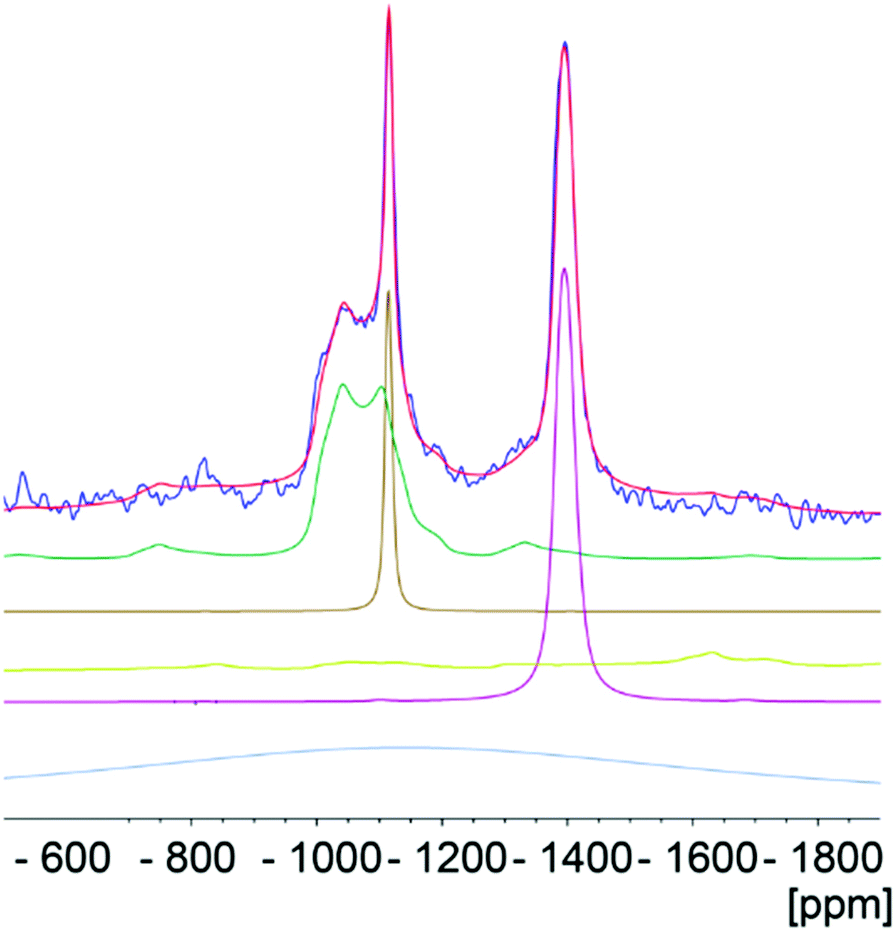 | ||
| Fig. 10 The titanium MAS NMR spectrum spinning at 14 kHz of LTP-H (blue) and a simulation (red) using dmfit.44 The individual contributions to the simulation are shown in green and brown for 49Ti and mauve for 47Ti. The resonance for the large CQ site for 47Ti (yellow-green) is much too broad to be narrowed by spinning at 14 kHz so that it is hardly visible. There is also a weak Gaussian background presumably from a small amount of disordered material which is shown in grey-blue. Neither of these latter two contributions significantly affect the values of δiso or CQ obtained from the simulation. | ||
| Sample | Nucleus | δ iso/ppm | C Q/MHz | η Q | Ref. |
|---|---|---|---|---|---|
| TiP1-H | 49Ti | −990 ± 10 | 8.4 ± 0.4 | 0.35 ± 0.1 | This work |
| LTP-H (site 1) | 49Ti | −1105 ± 5 | 2.6 ± 0.2 | 0.4 ± 0.1 | |
| LTP-H (site 2) | 49Ti | −990 ± 10 | 8.8 ± 0.4 | 0.35 ± 0.1 | |
| α-TiP | 49Ti | −820 ± 20 | 14.3 ± 0.5 | 0.05 ± 0.05 | 34 |
| β-TiP | 49Ti | −1130 ± 20 | 4.0 ± 0.2 | 0.8 ± 0.1 | |
| γ-TiP | 49Ti | −1130 ± 20 | 4.9 ± 0.2 | 0.9 ± 0.1 | |
| α-Na-TiP | 49Ti | −800 ± 20 | 13.5 ± 0.5 | 0.2 ± 0.05 |
Discussion
A closer look at 31P MAS NMR spectra, Fig. 1, reveals that before washings with hydrochloric acid the TiP materials display a number of 31P resonance lines of different widths with isotropic chemical shifts in the range 0 to −30 ppm. Those up to −11 ppm have been attributed to –H2PO4 units in TiP systems, while lines up to −25 ppm have been assigned to –HPO4 units in these materials. The more shifted resonances, up to −35 ppm, correspond to unprotonated –PO4 units in the titanium phosphate matrices.45,47 The amorphous material (aTiP) shows very broad almost featureless spectrum, before and after washing with hydrochloric acid, covering the whole spectral range of phosphate groups/species from fully protonated to fully deprotonated units.The inter-linked system, LTP, before washing, shows presence of at least two types of –HPO4 units, with resonance lines at −15.6 and −18.4 ppm, and a –PO4-like unit, at −30.4 ppm, that can be chemically related back to the presence of α- and γ-like TiP species. After treatment with hydrochloric acid, clearly α-type species are preserved, seen by the −18.7 ppm resonance, and a new compound, LTP-H, containing –H2PO4 units, at −7.0 ppm, is formed.
The TiP1-H spectrum before washing is similar with the presence of various β- and γ-like TiP species, at −15.5, −23 ppm and −29.9 ppm, and smaller amounts of phosphate sites with –H2PO4 origin, at ca. −7 ppm. Although the position of the 31P resonances is slightly different than that for the LTP-H, before washing, the shifts are in the corresponding ranges for titanium(IV) H2PO4-, HPO4- and PO4-like TiP species, respectively. After post-synthesis washings only the new type of titanyl phosphates at −7.3 ppm is observed showing –H2PO4 sites.
The α-TiP material, synthesised under mild conditions, before washing with hydrochloric acid, shows a very low intensity peak at ca. −7 ppm (related to traces of H2PO4 sites present in the sample) and a main 31P resonance line, slightly distorted, at −18.8 ppm. The washing of this system only partially affected the main resonance line making it somewhat more symmetrical. It has become evident that upon washing with a strong acid, the chemical changes in the TiP materials can be related to the formation of new/different compounds while the amounts of the starting TiP compounds are reduced.
Chemically, the synthesis of α-TiP (Ti(HPO4)2·H2O) requires high phosphoric acid concentration and in large excess in comparison to the titanium starting material, TiCl4 or metallic titanium dissolved in concentrated phosphoric acid, and thereby very low pH. Crystallographically, α-TiP has a three-dimensional polymeric structure where two titanium atoms are bridged by two hydrogen phosphate ions forming eight-membered chelate rings, and each titanium binds six hydrogen phosphate oxygen atoms in distorted octahedral fashion. As each titanium participates in three eight-membered chelate rings in a polymeric structure in three dimensions, it forms a very stable structural arrangement.
At the same time titanium(IV) is extremely prone to hydrolysis due to very high charge density and a hydrolysis reaction is likely to take place once the pH of a system starts to increase. In order to avoid hydrolysis of α-TiP in aqueous systems, a sufficient excess of phosphoric acid and sufficiently low pH (e.g. amount of sulfuric acid) are required. Otherwise, the polymeric chelate structure would first loosen then break, meanwhile water molecules can attack the titanium, and a titanyl compound will easily form. At the formation of a TiO bond, the charge density on titanium site will be reduced considerably, and the stability of the system will thereby increase. To best of our knowledge, no crystal structure of any mono-nuclear titanyl phosphate compound has been reported so far. This is in line with the observations in the present study that the titanyl phosphates compounds have a short-range order with low crystallinity.
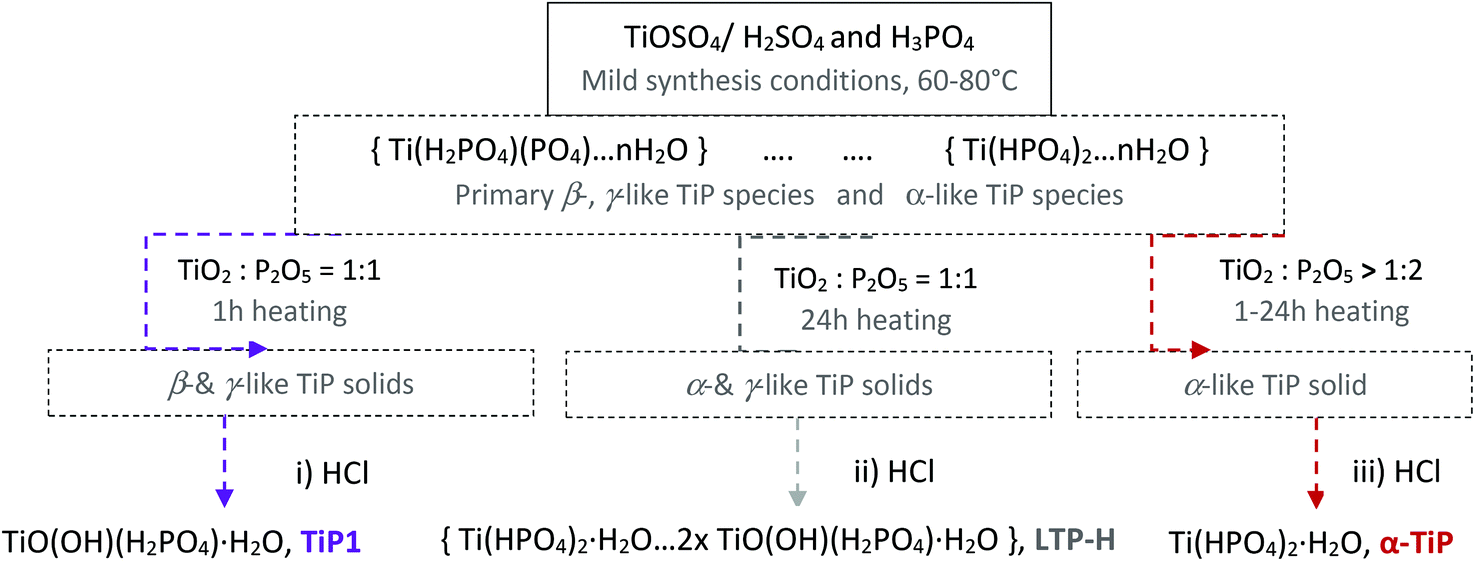
A summary of the proposed chemical changes during the synthesis and washings of TiP compounds is shown in Scheme 1 along with brief explanations for washing process outcomes (i)–(iii).
 | ||
| Scheme 1 Overall representation of suggested chemical changes during synthesis and post-washing steps with hydrochloric acid of different TiP materials, TiP1-H, LTP-H and α-TiP. | ||
(i) Under ![[s with combining low line]](https://www.rsc.org/images/entities/char_0073_0332.gif)
![[h with combining low line]](https://www.rsc.org/images/entities/char_0068_0332.gif)
![[o with combining low line]](https://www.rsc.org/images/entities/char_006f_0332.gif)
![[r with combining low line]](https://www.rsc.org/images/entities/char_0072_0332.gif)
![[t with combining low line]](https://www.rsc.org/images/entities/char_0074_0332.gif) reaction time, one hour, and a
reaction time, one hour, and a ![[l with combining low line]](https://www.rsc.org/images/entities/char_006c_0332.gif)
![[i with combining low line]](https://www.rsc.org/images/entities/char_0069_0332.gif)
![[m with combining low line]](https://www.rsc.org/images/entities/char_006d_0332.gif)
![[e with combining low line]](https://www.rsc.org/images/entities/char_0065_0332.gif)
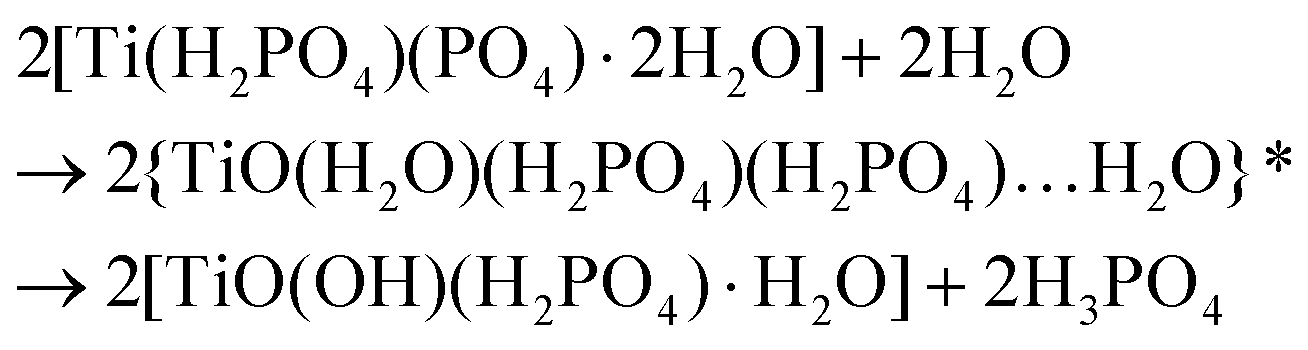
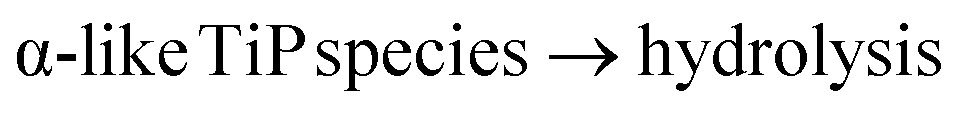
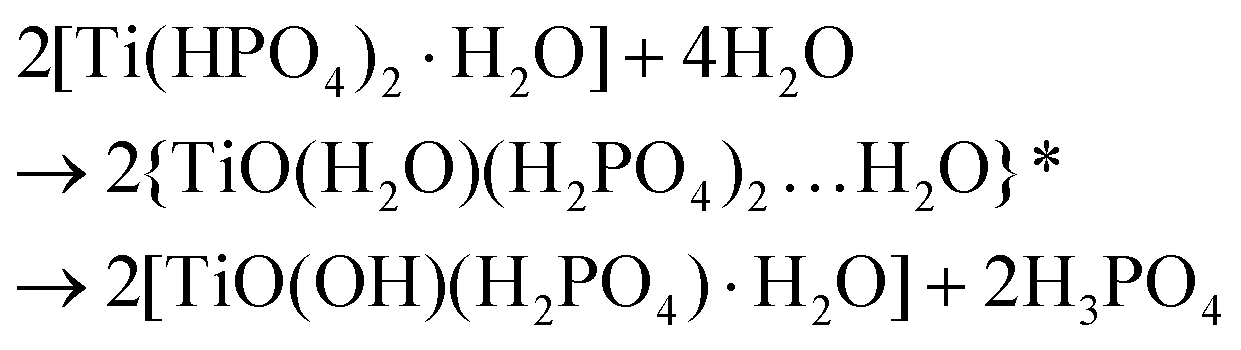
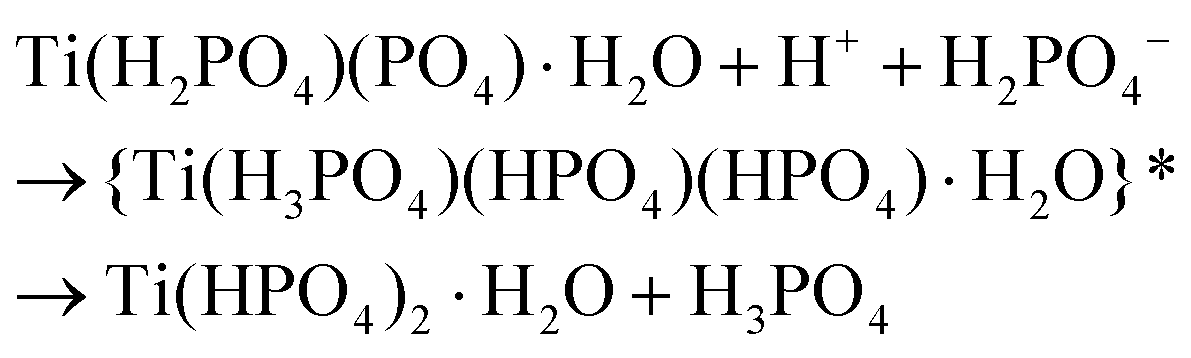
![[d with combining low line]](https://www.rsc.org/images/entities/char_0064_0332.gif) /controlled amount of H3PO4 followed by acidic washings, only TiP1-H is formed. The primary formed solid β- and γ-like TiP species undergo acid-driven re-arrangements/hydrolysis once the pH starts to increase during the acidic washing of the raw material. Thus, the titanium(IV) hydrolysis to TiO, and the –H2PO4 unit appears as a good leaving group and departs as H3PO4 (as seen in 31P MAS NMR data). A possible re-grouping stage is denoted with ‘*’ in the proposed chemical equations below.
/controlled amount of H3PO4 followed by acidic washings, only TiP1-H is formed. The primary formed solid β- and γ-like TiP species undergo acid-driven re-arrangements/hydrolysis once the pH starts to increase during the acidic washing of the raw material. Thus, the titanium(IV) hydrolysis to TiO, and the –H2PO4 unit appears as a good leaving group and departs as H3PO4 (as seen in 31P MAS NMR data). A possible re-grouping stage is denoted with ‘*’ in the proposed chemical equations below.
Furthermore, it could be assumed that the ring-stabilised classic α-TiP species have not had time to fully form, and if α-like TiP species have formed, the species containing –HPO4-like units would have different bond angles and bond lengths in comparison to the pure α-TiP structure (see 31P MAS NMR data in Fig. 1). Similarly, it can be considered for the primary β-/γ-like TiP species and possible chemical rearrangements are proposed below:

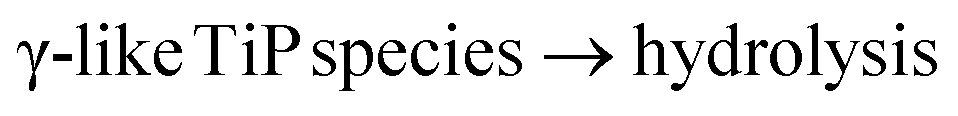
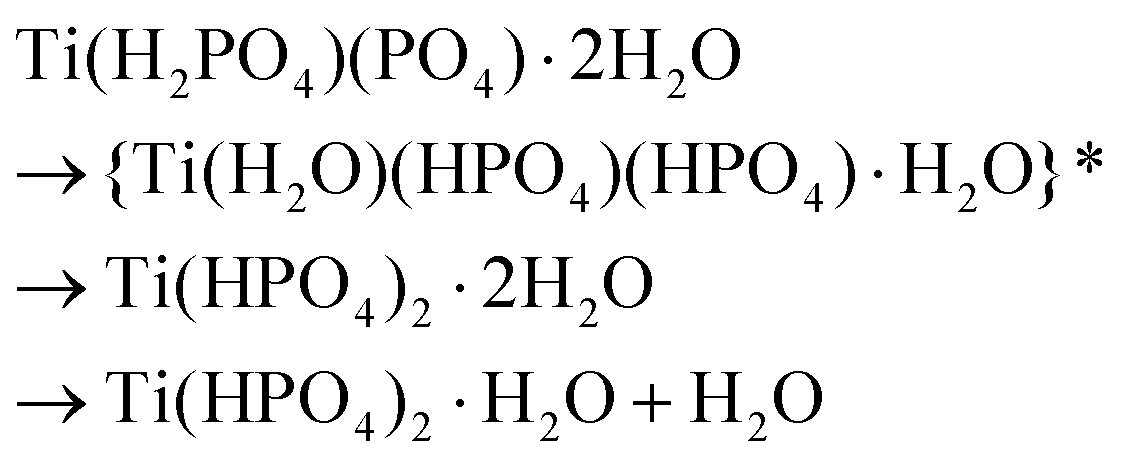
(ii) Under ![[n with combining low line]](https://www.rsc.org/images/entities/char_006e_0332.gif)
![[g with combining low line]](https://www.rsc.org/images/entities/char_0067_0332.gif) reaction time, 24 hours, and a /controlled amount of H3PO4 followed by acidic washing that leads to increasing overall pH, LTP system is formed. The Ti pre-edge intensity, the position of the absorption edge and 47/49Ti NMR strongly indicate that a majority of the titanium sites have octahedral configuration, Fig. 9, 10 and S7 (ESI†). 31P NMR data disclose information about the degree and distribution of protonation of the phosphate groups. The 31P resonance line ratio shows that in the LTP-H sample approximately equal amounts of –H2PO4 and –HPO4 sites are present, Fig. 1. This shows that the linking of octahedral titanium and titanyl sites in LTP-H material results in a distribution of H2PO4− and HPO42− sites being different from the distribution of octahedral and titanyl sites. It follows then that the longer reaction time (time-factor of 24) results in a larger fraction octahedral titanium site at the expense of titanyl ones. It might also be possible that the α-TiP unit is formed from the primary γ-phase species although it is less likely due to insufficient amount of phosphoric acid.
reaction time, 24 hours, and a /controlled amount of H3PO4 followed by acidic washing that leads to increasing overall pH, LTP system is formed. The Ti pre-edge intensity, the position of the absorption edge and 47/49Ti NMR strongly indicate that a majority of the titanium sites have octahedral configuration, Fig. 9, 10 and S7 (ESI†). 31P NMR data disclose information about the degree and distribution of protonation of the phosphate groups. The 31P resonance line ratio shows that in the LTP-H sample approximately equal amounts of –H2PO4 and –HPO4 sites are present, Fig. 1. This shows that the linking of octahedral titanium and titanyl sites in LTP-H material results in a distribution of H2PO4− and HPO42− sites being different from the distribution of octahedral and titanyl sites. It follows then that the longer reaction time (time-factor of 24) results in a larger fraction octahedral titanium site at the expense of titanyl ones. It might also be possible that the α-TiP unit is formed from the primary γ-phase species although it is less likely due to insufficient amount of phosphoric acid.


(iii) Under short or long reaction time with ![[x with combining low line]](https://www.rsc.org/images/entities/char_0078_0332.gif)
![[c with combining low line]](https://www.rsc.org/images/entities/char_0063_0332.gif) of H3PO4 followed by acidic washing, predominantly α-TiP is formed in the raw solid and hence observed as the final product too.
of H3PO4 followed by acidic washing, predominantly α-TiP is formed in the raw solid and hence observed as the final product too.


From these data it is apparent that any TiP species can hydrolyse once the pH of the system is increased. However, the synthesis conditions play a major role in terms of composition and stability of the final compounds. When using this type of soft synthesis conditions, there is a window where α-TiP appears to be the most stable product. It should however be emphasised that at different synthesis conditions (reaction time, and reactant concentrations and ratios) repeated washings of the primary formed α-TiP-like product in water with insufficient levels of phosphoric acid/phosphate and pH to stabilise the classic α-TiP can also result in a stepwise transfer to TiP1-H (TiO(OH)(HPO4)2·H2O) or similar titanyl containing compounds. It follows that the most insoluble TiP materials are the most unaffected and stable ion-exchangers. The chemical transformations displayed in Scheme 1 are supported by the Ti and P K edge EXAFS data obtained for these systems.
The structure parameters of α-TiP obtained by Ti and P K edge EXAFS are in good agreement with the accurate crystallographic study reported,4 including the Ti–O–P angle of 147°, in this study, seen in both Ti and P K edge EXAFS data, see Tables 3 and 4, respectively. The weak pre-peaks in all Ti XANES spectra, 0.1–0.3 absorption units, Fig. 6 and 7, strongly indicates that the basic configuration around titanium in all samples is six-coordination.30 It can be assumed that the pre-peak intensity increases with increasing titanyl content in samples, and thereby a measure of the degree of titanium(IV) hydrolysis. Furthermore, the position of the absorption edge of all samples is at lower energy, 0.5–2 eV, than in α-TiP, Fig. 6. As the charge density on titanium decreases with increasing fraction of titanyl groups in the sample, due to a larger electron transfer in a TiO double bond than in a Ti–O single bond. This is clearly seen in Fig. 6 and 7 that an increasing intensity of the pre-peak is accompanied with a shift in the position of the absorption towards lower energy.
The Ti NMR data show that the local environment around titanium is significantly different to the layered titanium phosphates since the shift of TiP1-H and the broad component of LTP-H are >150 ppm more negative than that of α-TiP.
The titanium reference used for our experiments is SrTiO3, where the structure around titanium is a regular octahedron, has a shift of −843 ppm and a Ti–O bond distance of 1.952 Å.52–54 This can be compared to −990 ppm for the titanyl site in LTP-H and TiP-H (site 2) and −1105 ppm for site 1 in LTP-H assigned to the shorter Ti–O and TiO bond lengths present in these materials and −820 ppm for α-TiP.34 The shift for site 1 from the inter-linking TiO6 unit in LTP-H is similar to γ-TiP suggesting that the mean bond length is similar.33 However, the electric field gradient is much smaller indicating that the local environment is more symmetric than that of γ-TiP. The relatively high symmetry of this site is also evident from the Ti XANES pre-edge peak since, once the contribution from TiP1-H is subtracted, the peak lies well below that of α-TiP.
The idea that the bond lengths (as suggested by the Ti shifts) are more similar to γ-/β-TiP bond lengths can be correlated to the synthesis scheme discussed earlier i.e., that the primary β-/γ-TiP species formed for 1 hour synthesis time can be somewhat more easily fully hydrolysed to titanyl phosphate species (as seen when comparing the 31P NMR data before and after washing).
Under the same restriction of H3PO4 but with a longer synthesis time (24 h) some features of γ-/β-TiP are kept in the product while at the same time the characteristic α-TiP 31P signal (near −20 ppm) becomes considerably stronger (as seen in the data before washing with hydrochloric acid). After acidic washing of the raw material only the titanyl type and the classic ring-stabilised α-TiP type species are seen in the 31P spectrum. Thus, it appears that longer synthesis (with post-washing) leads to the residual γ/β-TiP sites being hydrolysed to titanyl phosphates in the LTP-material and the formation of a new linking-site of TiO6-type between them and the α-TiP-like species. As both systems are obtained when the amount of phosphoric acid is restricted, this suggests a redistribution of the available phosphate groups. Due to the assumed linking between the different kinds of units in LTP-H, the distribution of high- and low-symmetry Ti sites and the distribution between HPO4 and H2PO4 sites do not have to be the same as in pure α-TiP and TiP1 and, in line with the simulations of the intensities of XANES data, the linking between different kinds of Ti sites may cause some phosphate sites to accept a proton, released in the hydrolysis process, in comparison to α-TiP.
The refined mean Ti⋯P and P⋯Ti distances, and the mean P–O bond distances from Ti EXAFS in all compounds except α-TiP give a Ti–O–P bond angle ca. 136° in average. The mean P–O bond distance, ca. 1.53 Å, Table 3, is slightly shorter than in the H2PO4−, HPO42− and PO43− ions in compounds where they do not bind to any metal ion in solid compounds or in aqueous solution, 1.536 Å.31 In the H2PO4− and HPO42− ions and in phosphoric acid, the P–O(–H) bonds are on average 0.049, 0.057 and 0.074 Å, respectively, longer than the P–O bonds.31,55 However, the mean P–O bond distances are the same for the phosphate ions, 1.536 Å, independent of degree of protonation, while the mean P–O bond distance in phosphoric acid is somewhat shorter, 1.530 Å.31,55 An overview of reported crystal structures of titanium(IV) phosphates, Table S1 (ESI†), does not give any indication as to whether the P–O bond of phosphates bound to titanium(IV) are shorter or longer than in uncoordinated phosphate ions.
Conclusions
A series of titanium phosphate, TiP, materials synthesised under mild conditions in water, were characterised in detail using solid-state X-ray absorption spectroscopy (XANES and EXAFS) and solid-state NMR spectroscopy (31P and 47/49Ti). From the increased knowledge of the structural build-up around titanium and phosphorus in the TiP materials it has become possible to find a strong relationship between synthetic conditions and post synthetic treatment on one hand and chemical alternations and structural re-arrangements in the materials on other. In order to obtain further insights into the trace metal absorption properties of the TiP materials sodium-exchanged TiP materials and metal ion loaded TiP materials were also investigated.Systematic cross-analyses of data were performed for α-TiP (α-Ti(HPO4)2·H2O), TiP1-H (TiO(OH)(H2PO4)·H2O) and for the inter-linked titanium phosphate sorbent, LTP-H (also synthesised at similar mild conditions), containing α- and TiP1-like units but with a different distribution of H2PO4− and HPO42− sites than in a mixture of α-TiP and TiP1-H.
From the titanium K XANES pre-edge intensity variation between the titanium phosphate samples it was confirmed that titanium in all TiP samples are six-coordinated. The lowest intensity was observed for α-TiP indicating the most symmetrical TiO6 arrangement. The titanium K edge EXAFS spectrum of α-TiP displayed a significantly different feature from the other sorbents. Excellent agreement with the published crystal structure was obtained with a model of an octahedral coordination of oxygen around titanium at 1.965(6) Å and a Ti–O–P bond angle of 147(2)°. The analysis of the EXAFS data of TiP1-H showed that it has a typical titanyl TiO bond distance of 1.72(1) Å, i.e. a double bond (titanyl phosphate), and four Ti–O bond distances in the equatorial plane with a mean of 1.905(5) Å and a Ti–O–P bond angle of 134(2)°. It has a significantly more intense K edge pre-peak than α-TiP reflecting the lower symmetry around titanium, and a lower absorption edge energy, Fig. 6 and 7.
The LTP-H compound has two sites, an octahedral TiO6 and a titanyl one shown by both titanium XANES and EXAFS and solid-state 47/49Ti NMR. Fitting of the pre-edge feature of LTP-H gave an approximate ratio octahedral:titanyl sites of 2:1. These building blocks are linked together, with the 31P NMR indicating approximately equal amounts of H2PO4− and HPO42− ions. This shows that the linking of octahedral and titanyl units gives a different charge than the pure compounds α-TiP and TiP1-H, and thereby also the distribution of H2PO4− and HPO42− ions. The 49Ti NMR shifts and quadrupole coupling constants of both TiP1-H and LTP-H are significantly different from that of α-TiP indicating, in agreement with Ti XANES, significantly different local environments around titanium in these three TiP materials.
Post-synthetic treatment with hydrochloric acid and water was shown to lead to chemical changes in the TiP compounds with the most stable system adopting titanyl configuration of titanium i.e., acidic hydrolyses of titanium(IV) could occur at any synthesis condition leading to a variety of TiP compounds being formed as final products under mild synthesis conditions. A short reaction time and a limited amount of phosphoric acid resulted in the formation of solely TiP1-H material. A long reaction time and limited amount of phosphoric acid led to formation of inter-linked system, LTP-H. At high excess of H3PO4, independent of the reaction time, predominantly α-TiP is formed.
Author contributions
Rusanova-Naydenova, Trublet and Antzutkin have made the synthetic work and NMR experiments and data analysis, Dupree and Iuga have made NMR experiments and data analysis, and Klysubun, Cholsuk and Persson have made X-ray absorption spectroscopy measurements and data analysis. All authors have participated in the writing of the manuscript.Conflicts of interest
There are no conflicts of interest.Acknowledgements
The UK High-Field Solid-State NMR Facility used in this research was funded by EPSRC and BBSRC (EP/T015063/1), as well as the University of Warwick including via part funding through Birmingham Science City Advanced Materials Projects 1 and 2 supported by Advantage West Midlands (AWM) and the European Regional Development Fund (ERDF). We acknowledge the Swedish Research Council for Environmental, Agricultural Science and Spatial Planning (Formas) for financial support. The NMR equipment at Luleå University of Technology (LTU) is financed by grants from the Foundation in memory of J. C. and Seth M. Kempe, and the LTU laboratory fund. The travelling grant from the Wallenberg Foundation (Sweden) to MT is gratefully acknowledged. We thank Dr. Vasantha Gowda for assistance in the analysis of pXRD patterns of TiP compounds with reported single crystal structures. The Synchrotron Light Research Institute (SLRI), Nakhon Ratchasima, Thailand, is acknowledged for allocation of beam-time and laboratory facilities.References
- M. V. Maslova, D. Rusanova, V. Naydenov, O. N. Antzutkin and L. G. Gerasimova, Synthesis, Characterization, and Sorption Properties of Amorphous Titanium Phosphate and Silica-Modified Titanium Phosphates, Inorg. Chem., 2008, 47, 11351–11360 CrossRef CAS PubMed.
- M. Trublet, D. Rusanova and O. N. Antzutkin, Revisiting syntheses of Ti(IV)/H2PO4-HPO4 functional ion-exchangers, properties and features, New J. Chem., 2018, 42, 838–845 RSC.
- J. Soria, J. E. Iglesias and J. Sanz, Effect of Calcination on Titanium Phosphate Produced by H3PO4 Treatment of Anatase, J. Chem. Soc., Faraday Trans., 1993, 89, 2515–2518 RSC.
- S. Bruque, M. A. G. Aranda, E. R. Losilla, P. Olivera-Pastor and P. Maireles-Torres, Synthesis Optimization and Crystal Structures of Layered Metal(IV) Hydrogen Phosphates, α-M(HPO4)2·H2O (M = Ti, Sn, Pb), Inorg. Chem., 1995, 34, 893–899 CrossRef CAS.
- B. B. Sahu and K. Parida, Cation Exchange and Sorption Properties of Crystalline α-Titanium(IV) Phosphate, J. Colloid Interface Sci., 2002, 248, 221–230 CrossRef CAS PubMed.
- X. Wang, X. Yang, J. Cai, T. Miao, L. Li, G. Li, D. Deng, L. Jiang and C. Wang, Novel Flower-like Titanium Phosphate Microstructures and Their Application in Lead Ion Removal From Drinking Water, J. Mater. Chem. A, 2014, 2, 6718–6722 RSC.
- A. N. Christensen, E. K. Andersen, I. G. G. Andersen, G. Alberti, M. Nielsen and M. S. Lehmann, X-Ray Powder Diffraction Study of Layer Compounds. The Crystal Structure of α-Ti(HPO4)2·H2O and a Proposed Structure for γ-Ti(H2PO4)(PO4)·2H2O, Acta Chem. Scand., 1990, 44, 865–872 CrossRef CAS.
- W. Zhang, R. Koivula, E. Wiikinkoski, J. Xu, S. Hietala, J. Lehto and R. Harjula, Efficient and Selective Recovery of Trace Scandium by Inorganic Titanium Phosphate Ion-Exchangers from Leachates of Waste Bauxite Residue, ACS Sustainable Chem. Eng., 2017, 5, 3103–3114 CrossRef CAS.
- V. A. Burnell, J. E. Readman, C. C. Tang, J. E. Parker, S. Thompson and J. A. Hriljac, Synthesis and structural characterisation using Rietveld and pair distribution function analysis of layered mixed titanium-zirconium phosphates, J. Solid State Chem., 2010, 183, 2196–2204 CrossRef CAS.
- A. M. Krogh Andersen, P. Norby and T. Vogt, Determination of formation regions of titanium phosphates; determination of the crystal structure of beta-titanium phosphate, Ti(PO4)(H2PO4) from neutron powder data, J. Solid State Chem., 1998, 140, 266–271 CrossRef.
- S. Garcia Granda, S. A. Khainakov, A. Espina, J. R. Garcia, G. R. Castro, R. R. Rocha and L. Mafra, Revisiting the thermal decomposition of layered gamma-titanium phosphate and structural elucidaton of its intermediate phase, Inorg. Chem., 2010, 49, 2630–2638 CrossRef CAS PubMed.
- M. V. Maslova, A. S. Chugunov, L. G. Gerasimova and N. V. Konovalova, Acid-base and Sorption Properties of Amorphous Titanium Phosphate, Radiochemistry, 2013, 55, 392–398 CrossRef CAS.
- A. I. Bortun, L. N. Bortun, A. Clearfield, S. A. Khainakov, V. V. Strelko, V. N. Khryashevskii, A. P. Kvashenko and I. Voitko, Synthesis and Characterization of Ion Exchange Properties of Spherically Granulated Titanium Phosphate, Solvent Extr. Ion Exch., 1997, 15, 515–532 CrossRef CAS.
- M. Trublet and D. Rusanova, Complete Column Trials for Water Refinement Using Titanium(IV) Phosphate Sorbents, ACS Sustainable Chem. Eng., 2018, 6, 6157–6165 CrossRef CAS.
- A. Clearfield and J. A. Stynes, New crystalline phases of zirconium phosphate possessing ion-exchange properties, J. Inorg. Nucl. Chem., 1964, 26, 117–129 CrossRef CAS.
- G. Alberti and E. Torracca, Crystalline insoluble salts of polybasic metals – II. Synthesis of crystalline zirconium or titanium phosphate by direct precipitation, J. Inorg. Nucl. Chem., 1968, 30, 317–318 CrossRef CAS.
- A. Clearfield, R. H. Blessing and J. A. Stynes, New crystalline phases of zirconium phosphate possessing ion-exchange properties, J. Inorg. Nucl. Chem., 1968, 30, 2249–2258 CrossRef CAS.
- G. Alberti, Other Group(IV) Acid Salts, in Inorganic Ion Exchange Materials, ed. A. Clearfield, CRC Press, Boca Raton, FL, USA, 1982, ch. 2 Search PubMed.
- A. Clearfield and G. D. Smith, The Crystallography and Structure of α-Zirconium Bis(monohydrogen orthophosphate) Monohydrate, Inorg. Chem., 1969, 8, 431–436 CrossRef CAS.
- J. M. Troup and A. Clearfield, Mechanism of ion exchange in zirconium phosphates. 20. Refinement of the crystal structure of α-zirconium phosphate, Inorg. Chem., 1977, 16, 3311–3314 CrossRef CAS.
- M. A. Salvado, P. Pertierra, S. Garcia Granda, J. R. Garcia, J. Rodriguez and M. T. Fernandez Diaz, Neutron powder diffraction study of α-Ti(HPO4)2·(H2O) and α-Hf(HPO4)2·(H2O); H-atom positions, Acta Crystallogr., Sect. B: Struct. Sci., 1996, 52, 896–898 CrossRef.
- N. J. Clayden, Solid-state nuclear magnetic resonance spectroscopic study of α-zirconium phosphate, J. Chem. Soc., Dalton Trans., 1987, 1877–1881 RSC.
- D. M. Poojary, B. Shpeizer and A. Clearfield, X-ray-Powder Structure and Rietveld Refinement of γ-zirconium phosphate, Zr(PO4)(H2PO4)·2H2O, J. Chem. Soc., Dalton Trans., 1995, 111–113 RSC.
- M. A. Salvado, S. Garcia-Granda and J. Rodriguez, An Investigation on the Structure of γ-Titanium Phosphates from X-ray Conventional Powder Diffraction Data, Mater. Sci. Forum, 1994, 166, 619–623 Search PubMed.
- R. D. Shannon, Revised Effective Ionic Radii and Systematic Studies of Interatomic Distances in Halides and Chalcogenides, Acta Crystallogr., Sect. A: Cryst. Phys., Diffr., Theor. Gen. Crystallogr., 1976, 32, 751–767 CrossRef.
- A. Clearfield, A. I. Bortun, S. A. Khainakov, L. N. Bortun, V. V. Strelko and V. N. Khryaschevskii, Spherically Granulated Titanium Phosphate as Exchanger for Toxic Heavy Metals, Waste Manag., 1998, 18, 203–210 CrossRef CAS.
- M. Trublet, M. V. Maslova, D. Rusanova and O. N. Antzutkin, Sorption performances of TiO(OH)(H2PO4)·H2O in synthetic and mine waters, RSC Adv., 2017, 7, 1989–2001 RSC.
- M. Trublet, M. V. Maslova, D. Rusanova and O. N. Antzutkin, Mild syntheses and surface characterization of amorphous TiO(OH)(H2PO4)·H2O ion-exchanger, Mater. Chem. Phys., 2016, 183, 467–475 CrossRef CAS.
- S. Calvin, XAFS for Everyone, CRC Press, 2013, ISBN: 9781439878637 Search PubMed.
- F. Farges, G. E. Brown, Jr. and J. J. Rehr, Coordination chemistry of Ti(IV) in silicate glasses and melts. 1. XAFS study of titanium coordination in oxide model compounds, Geochim. Cosmochim. Acta, 1996, 60, 3023–3028 CrossRef CAS.
- I. Persson, M. Trublet and W. Klysubun, Structure Determination of Phosphoric Acid and Phosphate Ions in Aqueous Solution Using EXAFS Spectroscopy and Large Angle X-ray Scattering, J. Phys. Chem. A, 2018, 122, 7413–7420 CrossRef CAS PubMed.
- T. J. Bastow, M. A. Gibson and C. T. Forwood, 47/49Ti NMR: hyperfine interactions in oxides and metals, Solid State Nucl. Magn. Reson., 1998, 12, 201–209 CrossRef CAS PubMed.
- D. Padro, V. Jennings, M. E. Smith, R. Hoppe, P. A. Thomas and R. Dupree, Variations of Titanium Interactions in Solid State NMR Correlations to Local Structure, J. Phys. Chem. B, 2002, 106, 13176–13185 CrossRef CAS.
- J. Zhu, N. Trefiak, T. K. Woo and Y. Huang, A 47/49Ti Solid-State NMR Study of Layered Titanium Phosphates at Ultrahigh Magnetic Field, J. Phys. Chem. C, 2009, 113(23), 10029–10037 CrossRef CAS.
- M. Trublet, Titanium(IV) Phosphates: The Next Generation of Wastewater Sorbents, PhD thesis, Luleå University of Technology, 2018, available at https://ltu.diva-portal.org/smash/get/diva2:1238028/FULLTEXT03.pdf Search PubMed.
- M. Trublet, E. Scukins, I. Carabante and D. Rusanova-Naydenova, Competitive Sorption of Metal Ions on Titanium Phosphate Sorbent(TiP1) in Fixed-Bed Columns: A Closed-Mine Waters Study, ACS Sustainable Chem. Eng., 2019, 7, 8145–8154 CrossRef CAS.
- https://www.slri.or.th/en/bl8-xas.html , downloaded February March 8, 2022.
- W. Klysubun, P. Tarawarakarn, N. Thamsanong, P. Amonpattaratkit, C. Cholsuk, S. Lapboonrueng and W. Wongtepa, Upgrade of SRLI BL8 beamline for XAFS spectroscopy in a photon energy range of 1-13 keV, Radiat. Phys. Chem., 2020, 175, 108145 CrossRef CAS.
- A. Thompson, D. Attwood, E. Gullikson, M. Howells, K.-J. Kim, K. Kirz, J. Kortright, I. Lindau, Y. Liu, P. Pianetta, A. Robinson, J. Scofield, J. Underwood, G. Williams and H. Winick, X-ray data booklet, Lawrence Berkley National Laboratory, 2009 Search PubMed.
- G. N. George and I. J. Pickering, EXAFSPAK – A Suite of Computer Programs for Analysis of X-ray Absorption Spectra, SSRL, Stanford, CA, 1993 Search PubMed.
- S. I. Zabinsky, J. J. Rehr, A. Ankudinov, R. C. Albers and M. Eller, Multiple-Scattering Calculations of X-ray Absorption Spectra, Phys. Rev. B: Condens. Matter Mater. Phys., 1995, 52, 2995–3009 CrossRef CAS PubMed.
- D. Iuga and A. P. M. Kentgens, Influencing the satellite transitions of half-integer quadrupolar nuclei for the enhancement of magic angle spinning spectra, J. Magn. Reson., 2002, 158, 65–72 CrossRef CAS.
- S. F. Dec, M. F. Davis, G. E. Maciel, C. E. Bronnimann, J. J. Fitzgerald and S. Han, Solid-state multinuclear NMR studies of ferroelectric, piezoelectric, and related materials, Inorg. Chem., 1993, 32, 955–959 CrossRef CAS.
- D. Massiot, F. Fayon, M. Capron, I. King, S. Le Calve, B. Alonso, J.-O. Durand, B. Bujoli, Z. Gan and G. Hoatson, Modelling one- and two-dimensional solid-state NMR spectra, Magn. Reson. Chem., 2002, 40, 70–76 CrossRef CAS.
- Y. J. Li and M. S. Whittingham, Hydrothermal synthesis of new metastable phases: preparation and intercalation of a new layered titanium phosphate, Solid State Ionics, 1993, 63–65, 391–395 CrossRef CAS.
- S. Roca and C. Airoldi, Crystalline α-titanium(IV) hydrogenphosphate and its sodium- and n-butylammonium-intercalated forms: ion exchange and thermochemistry, J. Chem. Soc., Dalton Trans., 1997, 2517–2524 RSC.
- A. Bortun, E. Jaimez, R. Llavona, J. R. García and J. Rodríguez, Formation of crystalline titanium(IV) phosphates from titanium(III) Solutions, Mater. Res. Bull., 1995, 30(4), 413–420 CrossRef CAS.
- M. H. Levitt, Spin Dynamics: Basics of Nuclear Magnetic Resonance, Wiley, 2001, ISBN: 0471489220, 97804714892211 Search PubMed.
- A. A. Rouff, S. Rabe, M. Nachtegaal and F. Vogel, X-ray Absorption Fine Structure Study of the Effect of Protonation on Disorder and Multiple Scattering in Phosphate Solutions and Solids, J. Phys. Chem. A, 2009, 113, 6895–6903 CrossRef CAS PubMed.
- C. Vogel, C. Rivard, V. Wilken, A. Muskolus and C. Adam, Performance of Secondary P-Fertilizers in Pot Experiments Analyzed by Phosphorus X-ray Absorption Near-Edge Structure (XANES) Spectroscopy, Ambio, 2018, 47(Suppl. 1), S62–S72 CrossRef PubMed.
- O. Bunǎu and Y. Joly, Self-Consistent Aspects of X-Ray Absorption Calculations, J. Phys.: Condens. Matter, 2009, 21, 345501 CrossRef PubMed.
- G. M. Meyer, R. J. Nelmes and J. Hutton, High-resolution (direct space) studies of anharmonic motion associated with the structural phase transition in SrTiO3, Ferroelectrics, 1978, 21, 461–462 CrossRef.
- Y. A. Abramov, V. G. Tsirel’son, V. E. Zavodnik, S. A. Ivanov and I. D. Brown, The chemical bond and atomic displacements in SrTiO3 from X-ray diffraction analysis, Acta Crystallogr., Sect. B: Struct. Sci., 1995, 51, 942–951 CrossRef.
- T. Yamanaka, N. Hirai and Y. Komatsu, Structure change of Ca1-xSrxTiO3 perovskite with composition and pressure, Am. Mineral., 2002, 87, 1183–1189 CrossRef CAS.
- J. Mähler and I. Persson, A Study of the Hydration of the Alkali Metal Ions in Aqueous Solution, Inorg. Chem., 2012, 51, 425–438 CrossRef PubMed.
Footnote |
| † Electronic supplementary information (ESI) available: Summary of solid-state structure determinations of TiP compounds, 49Ti and 47Ti NMR simulations parameters, transmission absorption spectrum of α-TiP, XRD data for TiP and diffractograms of LTP-H and LTP-Na, titanium K edge XANES spectra of TiP compounds, Fourier transforms of TiP compounds and fits of phosphorus/titanium K edge EXAFS data of TiP compounds. See DOI: https://doi.org/10.1039/d2dt00902a |
| This journal is © The Royal Society of Chemistry 2022 |