 Open Access Article
Novel cyclen-polyiodide complexes: a reappraisal of I–I covalent and secondary bond limits†
Matteo
Savastano
 *,
Carla
Bazzicalupi
 and
Antonio
Bianchi

Department of Chemistry “Ugo Schiff”, Via della Lastruccia 3, 50019 Sesto Fiorentino, Italy. E-mail: matteo.savastano@unifi.it
First published on 28th February 2022
Abstract
Supramolecular stabilization of polyiodides and iodine-dense phases is of high interest: this study explores the possibilities offered in this sense by diprotonated cyclen, affording two novel crystal structures. One of them contains at least one peculiar I⋯I interatomic distance (3.305(1) Å), falling well below the region commonly described by secondary bonding (3.4–3.7 Å) and essentially equal to the accepted limit for covalent bonding (3.30 Å): in other words, according to threshold distance values, we are relatively free to regard this interaction either as a bond or as contact. Lest the flip of a coin decides if we should or should not draw a bond in a polyiodide, statistical insights based on CSD surveys were used to put in perspective literature material and work out a meaningful assignment (as I82−). In doing so, we address how currently accepted threshold distance values came to be in the first place, their significance, soundness, and shortcomings in describing I82− and its formal fragments (I2, I3−, I5−). Discussion of the chemical meaning of the line representing bonding in I–I fragments in similar fringe cases, relating CSD data herein presented with the previous literature, is provided. Available information coincides quite well in supporting the necessity of a revision of broadly accepted threshold distance values.
Introduction
In recent times polyiodide chemistry has seen a rise in popularity mostly connected with novel applicative horizons, including solid state conductors,1 solar cells, batteries,2–5 ionic liquids,6–8 and even high-energy iodine dispersing agents as emergency biocidal countermeasures.9Despite such a rise in popularity, and the fact that polyiodide chemistry has been studied for at least two centuries, much basic knowledge is still required for rationalizing such systems. This seems to be mostly due to polyiodides’ complex structural chemistry, their multifaceted interaction possibilities (leading to the increase of specialistic jargon, featuring several non-equivalent but vastly overlapping terms) and their sensitiveness to crystallization conditions, leading oftentimes to surprising outcomes in terms of nature and types of possible crystalline phases.10,11
In such a panorama we devoted ourselves to the study of polyiodides’ (and other polyhalides)12 interactions with polarized heterocycles (s-tetrazine derivatives,13 quaternized pyridinium derivatives14,15) as well as protonated pyridinophanes with systematic structural changes (e.g. successive N-methylation,16 introduction of further substituents into the aromatic ring)17 and their Cu(II) complexes.18
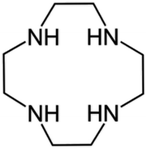
Herein we present two novel polyiodide crystal structures featuring diprotonated cyclen as the cation. Cyclen (1,4,7,10-tetraazacyclododecane, Fig. 1) is regarded as one of the all-time favourite macrocycles in cation coordination chemistry19 (in all its declinations) and was, to some extent, in need of further exploration about its ability to stabilize polyiodides.20 In its simplicity, cyclen is not far from the class of cyclophanes, large or small, which have been successfully employed for such purposes.16,21
One of the crystal structures herein described is a relatively simple salt, whose structure can be elucidated in a rather consolidated manner. The other, for better or for worse, is not, and its complications arise on the basis of some ambiguous I⋯I interatomic distances.
Much has been written about the nature of iodine–iodine intra- and inter-molecular interactions and on how we should tell them apart (cf. Are threshold values for the I–I covalent bond distance legitimate? section). Regarding the few relatively undisputed (perhaps by convention, or convenience, or both) certainties, there are a few threshold numerical values. According to the secondary literature, it seems that 3.30 Å should be the most effective cut-off distance to regard two iodine atoms as covalently bonded: this is the so-called Coppens limit (1982).22
Beyond reporting the 3.30 Å Coppens limit, the authoritative and influential review by Svensson and Kloo (2003) advocates a “secondary bonding region”, 3.4–3.7 Å, for supramolecular I⋯I interactions.10 Not much reference is given about how such boundaries were determined. Both a sharp 3.30 Å threshold distance as well as a clean-cut 3.4–3.7 Å region may appear to be merely broadly defined. Yet both continue to find vast application when polyiodide-based structures need to be discussed.
As a result of this status quo, the interesting 3.30–3.4 Å region is somewhat neglected, and appears to find itself in a weird “don't ask, don't tell” situation: not quite covalent, not yet supramolecular. The same could be said, to some extent, of the distance region that extends beyond 3.7 Å up to the I⋯I van der Waals contact distance (roughly 4 Å).
What should we write when we are faced with an I–I interatomic distance of exactly 3.30 Å (namely 3.305(1) Å in our case)? As we shall see together, our second structure contains polyiodides that can be regarded as an [I3−·I2·I3−] complex, an [I3−·I5−] one or as a molecular I82− species.
In the following we will try to provide a meaningful way to tell these possibilities apart, which we will attempt at doing with a statistical analysis of reported I82− and of polyiodides which are its formal fragments. The possibility of a more inclusive rationalization of asymmetrical I82− anions, and of superior polyiodides in general, emerges, pointing out that a revision of commonly accepted threshold values might be needed.
Experimental section
Crystals of [(H2Cyclen)·(I)·(I3)] (1) and [(H2Cyclen)2·(I5)·(I3)3·(I2)] (2) have been obtained in the same diffusion crystallization experiment. Cyclen (10 mg) and a 1![[thin space (1/6-em)]](https://www.rsc.org/images/entities/char_2009.gif) :
:![[thin space (1/6-em)]](https://www.rsc.org/images/entities/char_2009.gif) 1 I2/I− mixture (5 eqs of I3− with respect to the ligand) were put inside an H-shaped tube. MilliQ-grade H2O was carefully layered over solids on both sides and used to fill the tube so that the two solutions came in contact. Black crystals of 2 started forming after about one week on the originally iodine-rich side. After three weeks the solution appeared homogeneous and reddish-brown crystals of 1 also formed on the ligand-rich side.
1 I2/I− mixture (5 eqs of I3− with respect to the ligand) were put inside an H-shaped tube. MilliQ-grade H2O was carefully layered over solids on both sides and used to fill the tube so that the two solutions came in contact. Black crystals of 2 started forming after about one week on the originally iodine-rich side. After three weeks the solution appeared homogeneous and reddish-brown crystals of 1 also formed on the ligand-rich side.
Crystals of 1 and 2 were used for single-crystal X-ray diffraction analysis by using a Bruker APEX-II CCD diffractometer. The integrated intensities were corrected for Lorentz and polarization effects and an empirical absorption correction was applied.23 The structures were solved by SHELXS-97.24 Refinements were performed by means of full-matrix least-squares using SHELXL Version 2014/7.24 All non-hydrogen atoms were anisotropically refined. In 1 a riding model was used for all hydrogen atoms linked to carbon atoms, while all amino and one of the ammonium hydrogens were localized in the ΔF map, and their coordinates were freely refined, while the isotropic displacement parameters were constrained to have an equal value. In 2 the nitrogen linked hydrogens were not localized in the ΔF map and not introduced in the calculation.
Mercury25 and UCSF Chimera26 software were employed for the visual inspection and presentation of data.
Hirshfeld surface analysis was performed with CrystalExplorer.27
CCDC Conquest28 was used to retrieve data from CSD.29 Information on used datasets and their generation is specified through the text (further details in a dedicated section of the ESI†).
The Raman spectrum of 2 was recorded with a Bruker MultiRAM FT-Raman spectrometer equipped with a Nd-YAG laser emitting at 1064 nm as the excitation source. The spectra were recorded for the pure compound, and pressed in solid pellets, with 4 cm−1 slits and 5 mW power, acquiring 1000 scans.
Results and discussion
Crystal structural description
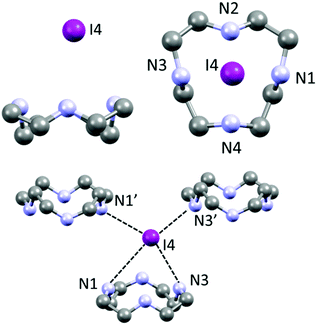
Each iodide anion is surrounded by a total of three macrocycles, one ligand as said plus two neighbouring ones interacting with NH⋯I hydrogen bonds pointing away from the centre of each macrocycle (I4⋯N1′ 3.443(3) Å and I4⋯N3′ 3.544(3) Å, cf. Table S2†). Such contacts are among the shortest in the crystal.
Each (H2Cyclen·I)+ subunit is connected to the others by such hydrogen bonds, creating H-bonded ribbons propagating along the a crystallographic direction (Fig. 3). Such ribbons neutralize their charge by surrounding themselves with triiodide anions, mainly interacting through NH⋯I hydrogen bonds and some weak CH⋯I contacts (Table S2†).
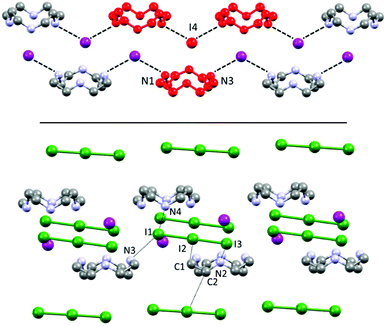 | ||
| Fig. 3 Top: Visualization of H-bonded (H2Cyclen·I)nn+ polycationic ribbons, repeating unit (red), as discussed in Fig. 2. Bottom: Their interaction with I3− counteranions surrounding and spacing such ribbons. | ||
Overall, there are no I⋯I contacts within the sum of the van der Waals radii (shortest I–I distance >4.2 Å) and I− and I3− anions can in this case be completely regarded as isolated and non-interacting. I3− is found to be almost symmetric without significant deviation from linearity (Table S3,† I1–I2–I3 angle 179.46(1)°).
If a classic crystal description based on the strongest interactions is attempted, the two most significant (shortest) contacts involve the I3−⋯I2⋯I3− complex mentioned in the introduction, which features distances of 3.305(1) (I9⋯I8) and 3.483(1) Å (I7⋯I6) (Table S3†). The N⋯I contacts are quite long (3.50(1)–4.03(1) Å, average 3.8 ± 0.2 Å), with the notable exception of N4⋯I3 (3.50(1) Å – Table S3†). Ligand–anion interactions are mostly of the van der Waals type, showing little inherent directionality: they are similar in nature to what is observed in 1, although the interactions are somewhat less strong and directional in 2, as it can be expected in terms of anion charge density moving to I− to superior polyiodides. Many CH⋯I contacts (Table S3†) are also found. A scant tendency to give NH⋯I H-bonds and rather to share the protons among different N atoms, has been previously observed also for azacyclophanes, especially if small, and especially for superior polyiodides (where the charge localization is scarce).16,21 Polyiodides are also in contact among themselves with interactions shorter than the sum of van der Waals radii (e.g. I1⋯I12 3.831(1) Å, I16⋯I4 3.856(1) Å, plus several longer contacts, cf. Table S3†). The I1–I12–I1′–I12′ and I6–I7–I6′–I7′ fragments engage in long mutual interaction in the shape of a square (Fig. S1†). While the I1–I12 contacts are almost equally long and in the range of the van der Waals contact distance (3.831(1) and 3.945(1) Å), in the case of I6⋯I7 contacts there is a significant difference (short contact 3.483(1) Å, long contact 3.901(1) Å – cf. Table S3†). We have previously reported similar packing features for networks composed of non-symmetry equivalent I7− anions.18
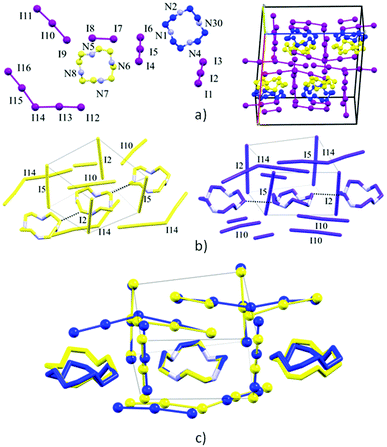
The two non-symmetry related ligands (blue and yellow in the following, Fig. 4) find themselves in quite similar environments, as depicted in Fig. 4b. They are essentially located in boxes (hinted in Fig. 4b) formed by I1–I2–I3 and I4–I5–I6 triiodides (and their symmetry-related pairs). Above or under the average macrocycle plane, either I12–I13–I14–I15–I16 pentaiodide or I9–I10–I11 triiodide plus I7–I8 diiodine are found (Fig. 4b), spacing out the cations.
Macrocycles are organized in rows (blue with blue, yellow with yellow) along the c direction possessing similar macrocycle-macrocycle distances, but a slightly different angle (yellow, C12⋯C16 3.56(2) Å, 3 centroids angle 177.36°; blue, C1⋯C5 3.59(2) Å, 3 centroids angle 172.06°) (Fig. 4a and b).
Quite expectedly, the individual blue/yellow macrocycles can be successfully superimposed (12 atom superimposition, RMS 0.0363 Å).
Fig. 4c shows the views of the superimposed blue/yellow macrocycles and the relative position of their surroundings (first neighbours). The triiodides constituting boxes around the ligands (I1–I2–I3 and I4–I5–I6, a total of 4 pairs, Fig. 4b and c) are strongly correlated in terms of their respective interactions with yellow or blue macrocycles. The relative positions of the anions in each pair are very similar, and only slightly tilted relative to each other (the axis of I1–I2–I3 I3− to average plane of blue macrocycle, 72.3°, axis of I6–I5–I4 I3− to average plane of blue macrocycle, 70.6°).
The biggest source of discrepancy in the ligand surroundings seems to be due to the presence of different iodine species (I5− or I3− and I2) (Fig. 4), which nevertheless show matching structural features, with closely related positions, at the very least, for the atoms forming I5− and I3−/I2.
Hirshfeld surfaces, and specifically fingerprint plots, were employed as tools to visualize and perhaps quantify the concept of structural similarity.30–32 In this sense they are a valuable tool to try to trace back the structural differences among the two non-equivalent macrocycles found in this crystal, which we successfully used in several instances for such a purpose.15,16,33 In fingerprint plots the contact distance is broken down into di and de components, i.e. point by point distances from the considered Hirshfeld surface to the closest atom inside or outside it.
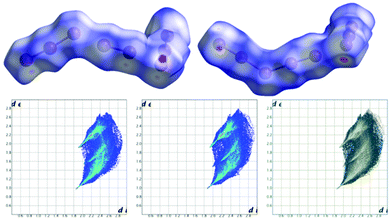
Without forgetting that in compound 2 no amino or ammonium hydrogen was introduced in the crystal structure refinement, the resulting Hirshfeld surfaces of both blue and yellow macrocycles are composed of an H⋯I component (60.0% and 60.2% of total surface) (top big tip feature in fingerprint plots, Fig. 5a and b), a broad H⋯H component (24.1% and 23.8%) (bottom tip, Fig. 5a and b) and an N⋯I component (15.8% and 16.0%) (middle tip feature in Fig. 5a and b). At the same time, the commonplace H⋯H contacts show a tip-like feature as well because, as discussed above, there are ligand–ligand contacts along the c direction (C12⋯C16 3.56(2) Å and C1⋯C5 3.59(2) Å for the yellow and blue macrocycles respectively, cf. Fig. 4b and Table S3†). As a matter of fact, the situation for the two macrocycles is hardly distinguishable (as confirmed by the superimposition of the two plots proposed in Fig. 5c).
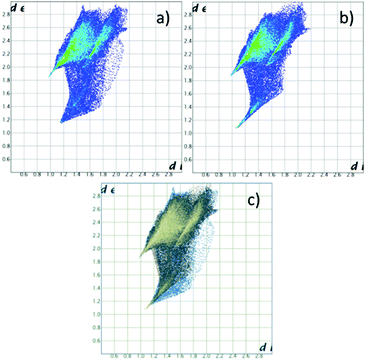 | ||
| Fig. 5 Fingerprint plot for H2Cyclen2+. (a) Blue macrocycle in 2; (b) yellow macrocycle in 2; (c) superposition of (a) and (b) (in blue and yellow respectively). | ||
Notably, applying the same treatment to the I3−⋯I2⋯I3− complex (i.e. I4–I5–I6⋯I7–I8⋯I9–I10–I11, Fig. 4) and to its closely related I5−⋯I3− complex counterpart (i.e. I16–I15–I14–I13–I12⋯I1–I2–I3, Fig. 4), the Hirshfeld surfaces of such species appear almost identical, together with their fingerprint plots (Fig. 6). This curious finding tempted us to discuss such polyiodides in more detail. In order to do so, we are forced to question how and if we should discriminate the two systems as I3−⋯I2⋯I3− and I5−⋯I3−, or if we could rather find more fitting descriptions for them, perhaps one encompassing both situations. In this sense, the first barrier to overcome is cut-off distances of the I–I primary (covalent) bonds (3.30 Å) and secondary bonds (3.4–3.7 Å),10,22 as arbitrary limits are hardly compatible with further discussion. This issue brings us to the next section.
Are threshold values for the I–I covalent bond distance legitimate?
In a sense, yes: there most likely are some threshold distance values.The questions are rather: do we know them? Do they coincide with currently accepted values?
This is where, we believe, there is room for discussion.
The first bit of information required for such debate is that, as appealing and convenient as it might sound, no universal set-in-stone cut-off distance might exist, especially if we intend to apply it to a plethora of polyiodides, different in nature among themselves (hybridization, electronic structure, etc.).
The 3.30 Å Coppens limit is extremely convenient, especially for rationalization and structural description purposes; yet such a value was merely devised as a likely limit, with the open objectives to keep polyiodides within the framework of mere simple building blocks and avoiding the necessity to describe certain peculiar cases as polymeric iodine chains.10,22 The first goal might still appeal in terms of broad rationalization of such species. However, while only I−, I2, I3− and I5− would survive according to Coppens (and 1980s data) if such a limit is used,22 reports of further polyiodides with bond lengths within 3.30 Å should now comprise other species as well, like e.g. I42− and some I82− (see below), reducing the strict significance of the said bond length threshold. Moreover, as nowadays some interesting polyiodide polymers are indeed reported, like the recently described I∞δ− (which displays I–I alternating distances all below the Coppens limit),34 there is no necessity to aprioristically refute polyiodide polymers anymore. These conceptual issues prompt verification of the 3.30 Å threshold against the contemporary dataset, as the available data were greatly expanded in the last 40 years.
In an effort to simultaneously introduce our methods and understand how the 3.30 Å limit came to be in the first place, we re-drew an I⋯I interaction distance (covalent or supramolecular) CSD29 survey limiting the dataset at the structure deposited before 1983, in order to look at the same picture Coppens might have looked at when formulating such a limit: the results are displayed in Fig. 7.
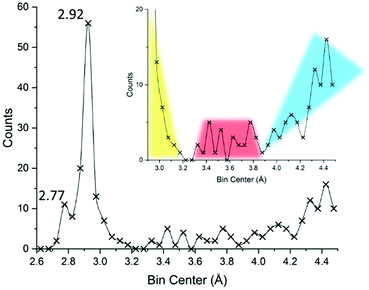 | ||
| Fig. 7 Reconstruction of the available literature material at the end of 1982, year of publication of ref. 22. Up to 4.5 Å a total of 235 unique I⋯I distances (intra- and inter-molecular) were reported. Bins of 0.05 Å were used for describing the distance distributions. The inset attempts at representing currently accepted interpretation, with primary (covalent), secondary, and long (van der Waals and/or aspecific) distance regions highlighted in yellow, red, and cyan, respectively. Further details in the ESI.† | ||
Even before delving into further statistics, the reader will recognize the familiar 2.77 and 2.92 Å distances typical of I2 and I3− fragments (vide infra). These peaks are separated by a valley, suggesting indeed that iodine-based systems contain one, the other, or both structural units, limiting any possibility of merging or other ambiguous situations.
The 3.30 Å limit effectively discriminates the end of the bell profile due to covalent bonds in triiodide (yellow in Fig. 7) and the beginning, at 3.4 Å, of the curve due to secondary bonds (red in Fig. 7). As such it appeared as a meaningful threshold value in the early '80s.
While conceptually developed by Bent35 and Alcock36 between the end of the '60s and the beginning of the '70s, the term “secondary bonding”, once formally referring to a certain type of interaction and spanning good portions of the periodic table, nowadays survives by extension mostly to indicate those interactions we seem to be hardly able to define in iodine systems, i.e. it coincides with the said 3.4–3.7 Å I⋯I contact range.10 In other words, the once chemically meaningful “secondary bonding”, became a mere, and quite generic, range of contact distances. At the same time the “conceptual space” left void by the disappearance of the secondary bond theory was soon occupied by the sigma-hole37 and halogen bond38 nomenclature, not without some lexicon difficulties.11
The secondary bond appears to be well-defined in Fig. 7 (red), being located between the sudden increase in contacts at around 3.4 Å and concluded before 3.8 Å, beyond which a minimum and then a progressive increase in contacts are found (suggesting the loss of specificity as we move towards distances greater than twice the I van der Waal radius, I = 2.04 Å,39 cyan Fig. 7).
Let us now look at the contemporary data, reported in Fig. 8 both as generic I⋯I distances (covalent and intermolecular, blue) and separated in its components as results from CSD (black and red for covalent and intermolecular distances, respectively).
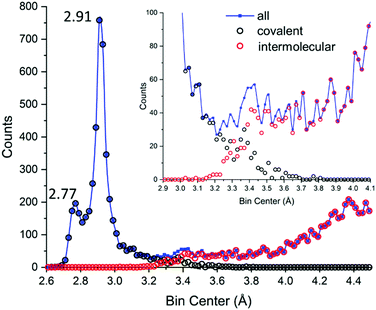 | ||
| Fig. 8 Actual data for polyiodide I–I distances in the CSD.29 Blue: All I⋯I distances (covalent and intermolecular). Black: I–I covalent bonds. Red: I⋯I intermolecular contacts. The inset shows how well reduced covalent/intermolecular datasets account for global data, with focus on the 3.1–3.7 Å region. Up to 4.5 Å, a total of 9560 unique distances are reported. Bins of 0.02 Å have been used. | ||
We might start noticing several things.
(i) The dataset size is vastly different (there is 40 times as much data available now compared to before 1983);
(ii) It is possible to obtain plots with a significantly better resolution, which allows the appreciation of finer details and more accurate evaluation of the characteristic distances (vide infra);
(iii) I–I covalent bonds in CSD extend in the long-distance range up to 3.4–3.6 Å;
(iv) I⋯I supramolecular interactions in CSD do not subside completely in the low-distance range until 3.2–3.1 Å;
(v) The 3.4–3.7 Å range hardly shows any appreciable specific behaviour;
(vi) Distances in the 3.3–3.4 Å range show almost equal probability of having been assigned to covalent bonds or supramolecular interactions;
(vii) Hardly any break is found between the bell profile associated with formal I3− (covalent), featuring a long tail, and secondary bonding region;
(viii) The distribution is heavily-biased towards I2 and I3−, as these fragments are encountered in even the most complicated molecular polyiodides.
A little comfort on such statistical data arises from several reports: over the years it was popular to address the matter by computational studies on the prototypical I3− anion or on the I2 + I− reaction energy profile.
Slater40 used an H3 model for linear 3-atomic molecules in order to explain the deviation of triiodide from linearity observed by Mooney-Slater41 in some of the earliest reports of polyiodide crystal structures: the beginning of covalency was thought to be >3.5 Å (on a 5 crystal structure dataset). Svensson and Kloo, who in their 2003 review indicate the 3.30 and 3.4–3.7 Å common limits, have addressed together with Rosdahl the issue of secondary bonding.42 They concluded that the covalency alongside dispersion interactions is a good model, and that the orbital overlap for polyiodides might start at about 5 Å, offering a stabilizing contribution that limits charge–charge repulsive effects. In more recent times, when the name of such interactions already drifted to sigma hole-bonding,11 Mealli and co-workers computationally investigated the basic building blocks of polyiodides (I−, I2, I3−, I42−), finding significant sigma electron sharing and scant evidence of sigma holes,43 signifying that the interaction in such systems cannot be purely electrostatic as a sigma hole model would suggest (limitations of the pure electrostatic model were already demonstrated in early seminal work on polyiodides such as those of Wiebenga et al. in the '60s).44,45 For the transition between an I2⋯I− system and a fully symmetric I3− anion, a pseudo-plateau energy profile was found.43 By investigating chalcogen and halogen bonds (please mind how the wording of such interactions evolved again!),11 Lippolis and co-workers reported bonding analysis for homo- and heterotrihalides.46–48 Regarding triiodide,48 they found that the transition from covalency to supramolecular interaction is almost smooth. This is mirrored also by the observation of the I3− structure–energy relationship as pioneered by Bürgi.49 Alcock himself, while proposing secondary bonding as a theory, noted that orbital diffuseness is the first step towards that kind of electron delocalization that finds its fullness only in metallic bonding.36
It is also clear that crystallographers, on a case-by-case level, have disregarded the Coppens limit on several occasions, hence our ability to retrieve I–I covalent bonds in the CSD longer than 3.30 Å. In some instances, the in silico assessment of the nature of long bonds ensued.50 This testifies that part of the community perceived the limitation of an arbitrary threshold.
The matter has also been discussed through a Raman spectroscopy approach,51,52 a notoriously relevant technique for polyiodide characterization.10 I–I bonds longer than 3.30 Å still influence the spectra and are generally rationalized as donor acceptor complexes (with various degrees of strength) among I3− and I2, formal and well-characterized components. Regarding this assignment, some advocate for strict global reduction of polyiodides to I2 and I3− (together with I−) basic fragments;51 and others discuss simple model examples (up to I5− or I7−), and then suggest that, although elucidation can be attempted (especially if paired with structural data), superior polyiodides can be rationalized similarly, even though the spectral features are expected to become increasingly hard to assign.10
To some extent, also UV-Vis evidence has been put forth, showing broadening and/or appearances of shoulder peaks in superior polyiodides with respect to mere I−, I2 and I3− building blocks.10
According to the above results, we believe that there is more than enough statistical and theoretical ground to question, at the very least, commonly accepted cut-off distances for polyiodides, if not even the existence of general-purpose unique threshold values.
While analogous situations can be envisaged for other elements showing the tendency for catenation and formation of 3c–4e bonds (notably Br), I is probably the most in need of attention owing to its polarizability and high atomic number.
Covalent bonds in I82− and its formal components: a statistical CSD survey
| Species (subtype) | Formal bond type | |||
|---|---|---|---|---|
| I–I in I2 | I–I in I3− | I−–I2 | I3−–I2 | |
| a Evaluated as 2·HWHM due to broadness and convolution with neighbouring peaks. | ||||
| I2 | 2.76(8) | |||
| I3− (global) | 2.92(4) | |||
| I3− (symmetric) | 2.92(4) | |||
| I3− (asymmetric) | 2.88(5) | 2.97(6) | ||
| I5− (V-shaped) | 2.78(9) | 3.1(1) | ||
| I5− (L-shaped) | 2.8(1) | 3.0(1)a | 3.1(2)a | |
| I82− | 2.8(2) | 3.0(1) | 3.4(1) | |
![[thin space (1/6-em)]](https://www.rsc.org/images/entities/char_2009.gif) :
:![[thin space (1/6-em)]](https://www.rsc.org/images/entities/char_2009.gif) 1 ratio in favour of symmetrical I3−, in line with the anion intrinsic preference for such a geometry.
1 ratio in favour of symmetrical I3−, in line with the anion intrinsic preference for such a geometry.
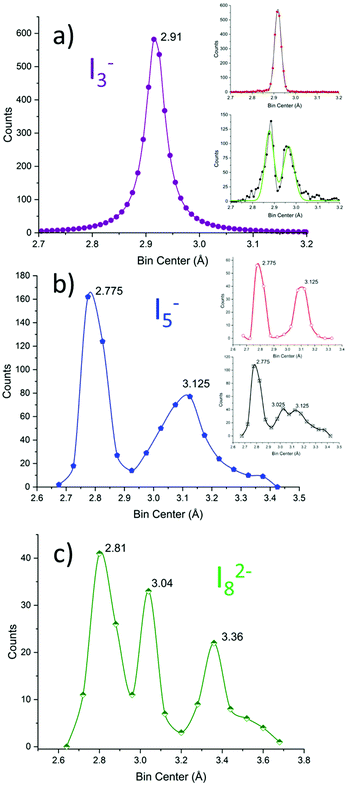 | ||
| Fig. 9 I–I bond length distribution in (a) I3− (violet), (b) I5− (blue), and (c) I82− (green) represented with bins of 0.01, 0.05 and 0.08 Å, respectively. The dataset for I3− and I5− taken from ref. 11. The dataset for I82− is reported in the dedicated section of the ESI.† The inset in (a) represents symmetrical (red) and asymmetrical (black) triiodides; Gaussian fittings are shown in black and green, respectively. The inset in (b) represents V-shaped (symmetrical, red) and L-shaped (asymmetrical, black) pentaiodides. | ||
We remind the reader also that the global length of triiodides can vary.10,11 On average the I3− length is 5.84(9) Å, i.e. for most triiodides, ≈68% or ≈95% if σ or 2σ thresholds are considered; the allowance on the total length is observed in the 1.6–3.0% range. This notion will be instrumental in the following.
It is immediately observed that the distribution is more complicated than in the above discussed simple case.
Pentaiodide is generally conceptually broken down into an [I−·(I2)2] complex (also known as symmetrical or V-shaped pentaiodide) or an [I3−·I2] complex (also known as asymmetrical or L-shaped pentaiodide).10 These categories have been applied to the above graph: pentaiodides were classified as V-shaped if both the difference of proximal I–I distances and the difference of distal I–I distances are below 0.05 Å (comparable with FWHM of I3−, cf. above). The procedure results in the red (V-shaped) and black (L-shaped) are shown in the insets in Fig. 9b.
V-Shaped symmetrical pentaiodides show only two maxima: 2.78(9) (formal I2) and 3.1(1) (I−–I2 bond) in a 1![[thin space (1/6-em)]](https://www.rsc.org/images/entities/char_2009.gif) :
:![[thin space (1/6-em)]](https://www.rsc.org/images/entities/char_2009.gif) 1 peak area ratio. L-Shaped pentaiodides instead show 3 peaks: 2.7(1) (formal I2), 3.02(15) (formal I3−) and 3.1(2) (I3−–I2 bond).
1 peak area ratio. L-Shaped pentaiodides instead show 3 peaks: 2.7(1) (formal I2), 3.02(15) (formal I3−) and 3.1(2) (I3−–I2 bond).
Summary of statistical evidence
The average bond length data are reported for the examined polyiodides in Table 1Data show the following:
(i) I2, I3− and longer components (associated with formal I−–I2 or I3−–I2 bonds) can be individuated for all model polyiodides;
(ii) Superior polyiodides (Inm− with n > 3) show at least one characteristic I–I bond above 3.1 Å;
(iii) The 3.1–3.3 Å region is minimally populated in the global statistic (Fig. 8) and is essentially not populated in the data pool contemporary to Coppens’ work22 (Fig. 7); as all superior polyiodides (Inm− with n > 3) contribute to it (point ii), we can assume that most contemporary I–I bonds in such a range are indeed due to superior polyiodides;
(iv) Even peaks associated with I2 and I3− formal fragments show variability, demonstrating how the exact structural situation of each type of polyiodide affects the I–I bond even of model fragments.
For what we are concerned, i.e. for the implications of statistical evidence about the molecular nature of I82−, we note the following. As anticipated, it must be acknowledged that one of the main conceptual pillars of the 3.30 Å cut-off distance, i.e. that with such a choice all known structures could be reduced to I−, I2, I3− or I5−,22 does not fully hold for modern data, as further polymeric or molecular polyiodides (e.g. I42−, cf. ref. 10, and I82−, cf. above) show bond lengths within such a limit. This simple observation is especially noteworthy in a field historically torn between a reductionist approach based merely on I−, I2 and I3− building blocks (and even triiodide had to struggle to be considered as a molecular species in the past),53 and claims of superior complexity not fully supported by data (cf. critical reviews of certain questionable superior polyiodides reported in ref. 10).
In the second instance, the observed 3.4(1) Å length for the long formal I3−⋯I2 bond in I82− still falls within a region ascribed to bonding interactions by a series of further reports.
In the rare accounts of I9− anions, the long bond length is in the 3.24–3.46 Å region, according to the cases reported in ref. 10, i.e. comparable to the I82− data. Svensson and Kloo in their prominent review10 describe I102− as an I5− dimer, with the long bond connecting such units of 3.44 Å, i.e. again in line with the I82− data. Anions of the I2n+33− series have been seldomly reported, especially when small. To the best of our knowledge the smallest member of such a family is I73−, which contains the bare minimum I atoms to bridge formal I− anionic sites with formal I2 molecules (charge–charge repulsion is significant). In the exemplificative (HMTAHD3+·I73−) case reported by Metrangolo, Resnati and co-workers, the I2 fragments, displaying a 2.81 Å interatomic distance, are found at 3.43 Å from central I− and 3.39 Å from terminal I−.54 As a further indication, calculations of the I–I bond length in the I2− radical (bond order 0.5, i.e. not negligible), placed its bond length at around 3.3 Å (depending on the basis set and level of theory).55 Moreover, crystalline I2 (intra-layer distance 3.496 Å and 3.972 Å, inter-layer distance 4.269)10 metallizes at room temperature at around 16 GPa while still in its molecular form, with all intermolecular distances being >3.5 Å.56 Dissociation of I2 molecules to give a classic metallic phase occurs at around 21 GPa at room temperature, with relatively little volume change (4%), with interatomic distances still beyond 3.30 Å (3.362 Å measured at 30 GPa).57 These findings suggest the possibility of interaction beyond pure electrostatics at distances greater than 3.30 Å (to be fair, most data are successive to Coppens work and to secondary bonding original definition). Everything seems to coincide well with reports asserting the existence of diffuse orbitals42 and a pseudo-plateau behaviour of the potential energy surface in moving from a distorted electrostatic complex to a fully symmetrical polyiodide for the prototypical I2 + I− = I3− reaction.43,48
In other words, there is evidence for the meaningful and covalent nature of the I–I bonds in the 3.3–3.5 Å range for the selected systems: this includes I82−.
Assignment of polyiodides contained in 2 and secondary bonding considerations
The crystal structure of 2, evaluated with a 3.30 Å limit on the I–I bond lengths, contains 3 different triiodides, 1 pentaiodide and an iodine molecule.A first triiodide (I1–I2–I3, Fig. 4) shows bond lengths typical of I3− (2.959(1) and 2.860(1) Å, cf. Table S3†) and long intermolecular contacts close to the van der Waals limit (I3⋯I11, I2⋯I16, I1⋯I12 and I1⋯I12′ 3.878(1), 3.891(1), 3.831(1) and 3.945(1) Å, respectively, cf. Table S3†), hence it is easily assigned as a typical I3−.
Pentaiodide (I12–I13–I14–I15–I16, Fig. 4) is also classic in terms of bond lenghts (in the range 2.793(1)–3.133(1) Å, contacts with neighbouring I3− from 3.831(1) to 3.945(1) Å, cf. Table S3†).
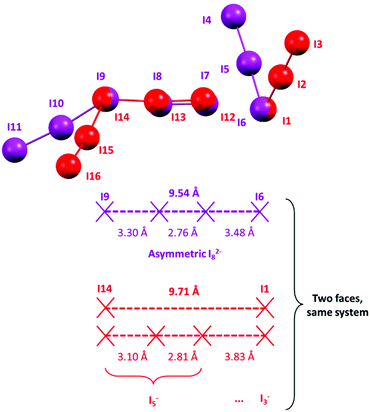
The two remaining I3− and the I2 molecule (Fig. 4) are strongly interacting (3.305(1), 3.483(1) Å, Table S3†), hence we should decide if they should be regarded as an I3−·I2·I3− complex, an I5−·I3− complex (two possibilities) or as an I82− anion.
As displayed in Fig. 10, the most satisfactory interpretation would be that of I82−, where the observed I–I distances would fall shortly below and after the statistical probability peak centred at 3.4 Å.
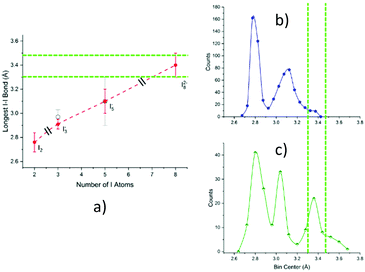 | ||
| Fig. 10 Informed assignment of the I11–I10–I9⋯I8–I7⋯I6–I5–I4 complex. Green dashed lines represent dotted interactions in the formula. (a) Graphical representation of Table 1 data, i.e., average value ± FWHM of the longest bond length in examined polyiodides (black slashes signal different polyiodide charges). Superposition of distances under discussion with pentaiodide (b) and octaiodide (c) bond length distributions. While possible, an I5−⋯I3− assignment would require both a quite unusual I5− bond length (on the fringe of the Gaussian) and a short non-explained I5−⋯I3− contact. Assignment to distorted I82− instead makes both distances close to statistical maximum, one shorter and one longer as expected in the case of distortion, a very common phenomenon in polyiodides. | ||
To reinforce such an assignment, an interesting parallelism can be drawn.
Let us consider again I3− as a 3 centre 4 electron system, where the symmetrical I3− anion is the energy minimum provided the extreme I atoms are below a critical distance, while an I2·I− asymmetrical complex is obtained if the extremes are too spaced out (i.e. the symmetrical form of the anion is prone to distortion under small external perturbations).
A similar situation could be envisaged for I82−: a formal I2 molecule is disputed between two different I3− ions, much like dogs and bones in a popular visualization of covalent bonding. The optimal (i.e. most represented in the CSD) I3−⋯I3− distance is placed by statistical data at approximately 9.48 Å (the 2 × I3−–I2 distance peak in I82−, observed at 3.36 Å, plus I–I bonding in I2, 2.76 Å); please see Fig. 11 for reference.
If the formal I3−⋯I3− distance in an I82− anion is significantly greater than 9.48 Å (or, equivalently, if the symmetric structure of I82− is perturbed by interactions with its surroundings in the crystal), the disputed I2 molecule would experience a tendency to fall in one of the two energy wells corresponding to the asymmetrical I5−·I3− complex, similarly to what happens for elongated I3−.
If we look at the I82− anion in 2, the I3−⋯I3− distance in such a species is 9.543(1) Å, i.e. slightly longer than the minimum energy configuration inferred from the statistical data. As a consequence, formal I3−–I2 bonds in said I82− are found one shorter and one longer than the average value (Fig. 10), i.e. some distortion towards an I5−·I3− type complex is already present. The “typical” I5− (I12–I13–I14–I15–I16 Fig. 4) also interacts with neighbouring I3−. The shortest of such interactions was found at 3.831 Å (I1⋯I12, Table S3,†i.e. with I1–I2–I3 I3−, Fig. 4) and is above regarded as supramolecular. However, if one looks at such an [I5−·I3−] complex again as an I82− anion, the two formal I3− contending the I2 molecule are 9.71 Å apart.
The bonding difference between an (almost) molecular I82− and a I5−·I3− complex is all consumed in the lenght difference between 9.5 and 9.7 Å (Fig. 11).
As the symmetrical situation is no more possible with such long distances, the system prefers to shorten significantly the formal I3−–I2 bond in the pentaiodide unit (3.305 Å in I82−, 3.097 in I5−) and to simultaneously elongate the I5−⋯I3− interaction.
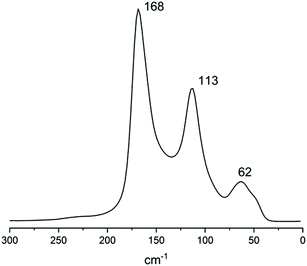
To further strengthen this view, the Raman spectrum of solid 2 (Fig. 12) was recorded. The spectrum consists of a strong band centred at 168 cm−1, a medium one at 113 cm−1 (typical of I3− symmetric stretch ν1) and a weak one at 62 cm−1 (I3− bending, ν2). Beyond the 113 cm−1 band, the other bands clearly show signs of convolution, as can be expected from a crystal containing more than one polyiodide species.
The 168 cm−1 band falls in the 140–180 cm−1 range, typical of superior polyiodides.51 In similar literature instances, a double intense band was found for I82− (174 and 161 cm−1, assigned to I2 and I−·I2, respectively) accompanied by medium I3− asymmetric stretching at 139 cm−1 (XRD formal I3−–I2–I3− bond distances 3.358 and 3.471 Å).52 In I82− displaying slightly longer formal I3−–I2–I3− bonds (3.417 and 3.485 Å), both strong bands at 172 cm−1 and 144 cm−1 were observed.51 In the case of 2, compresence of different polyiodides gives rise to peak convolution. As in the case of all polyiodides, the spectrum can be described by discrete I2 and I3− units “perturbed” by their mutual interactions.51 If by “perturbation” a certain degree of covalent/donor–acceptor character can be implied, then description as a mixture of different I82−, with a different extent of molecular character, can be proposed.
The so-called secondary bonding in these systems appears to be much closer to a way of finely considered electron sharing between systems with such diffused orbitals (as it seems to have been in the intention of original proposers)35,36 than a generic distance range suggestion.
Reduction to a mere universal distance range with clean-cut boundaries (the popular 3.4–3.7 Å range) is conceptually impossible, as bonding might start at much longer distances and it remains vastly dependent on the nature of the interacting polyiodides. At the same time, bonding thresholds are extremely useful and widely employed. A coherent revision of commonly accepted values, taking into account the nature of the interacting fragments and further structural parameters, which remains beyond the scope of the present study, is probably necessary.
Strongly asymmetrical triiodides (long bond 3.1–3.2 Å, short bond 2.85–2.75 Å)10,11 are still considered to be covalently bonded despite the fact that such systems already behave as in the I−·I2 complex limit. As detailed above (cf. I3− section), for bonded I3− the elongations in the 1.6–3.0% range are commonplace. In the present case, a difference of 0.2 Å on an average of 9.64 Å, i.e. about 2.0% elongation of the central I4 fragment, should entirely change the way we draw bonds among the involved atoms. To further fuel scientific discussion, we can go as far as stating that, in a sense, an I5−·I3− complex, even with a long 3.8 Å I5−⋯I3− contact distance, is still somewhat a “bonded” I82−, meaning that it is but the asymmetrical structure of the I82− system shown in Fig. 11, which is analogous to asymmetric I3−. This is not stating that the covalent bonds in polyiodide extend to 3.8 Å (cf. the previous section and how the real limit is case dependent and seems to be around 3.5 Å even considering the statistical distribution). Rather, we want to point out, as substantiated by many other studies, that when orbitals are highly diffused, and species highly polarizable, a certain extent of electron sharing may arise.
This kind of consideration allows us to see 2 as containing substantially a single [H2cyclen2+·I82−] unit, and to rationalize the symmetry lowering of I82− using the familiar I3− paragon. It is also interesting to notice how bond localization accompanying symmetry lowering tends to intrinsically favour simpler polyiodides, yet this apparent simplicity does not remove existing secondary bonds. As secondary bonding, by definition, involves electronic redistribution, i.e. it affects the intramolecular bonds of the interacting partners, it is quite possible that the complexity and broad distribution of bond lengths in superior polyiodides can be justified accounting for significant interactions even in a longer range than traditionally accepted cut-off values suggest.
Conclusions
Novel structural data herein reported support the diprotonated form of cyclen as a useful scaffold for the stabilization of simple and superior polyiodides, in particular of the rarely encountered I82− anion. Perhaps more importantly, the structural and statistical analysis herein reported, combined with previous reports and calculations, suggests the need for a revision of currently accepted cut-off values for covalent bonding in polyiodides. It appears that a single general-purpose threshold value cannot be identified (as it remains dependent on the nature of the polyiodide), but that the upper limit for covalent bonding in large and/or polycharged polyiodides should be moved from 3.30 Å towards the 3.4–3.5 Å range, to encompass and justify some systems. The secondary bonding region, generally defined in the 3.4–3.7 Å range, has also been addressed and rediscussed in terms of interactions in hypervalent systems characterized by 3c–4e and related bond-types, in an effort to give a more holistic view of complex polyiodides, partially conflicting with traditional reductionist approaches. Afterall, the emerging properties of complex systems have long been a concept in supramolecular chemistry: the fact that assemblies might possess properties that their individual components do not have urges caution about rushed reduction of polyiodides to mere I−, I2 and I3− building blocks.As a final comment, we notice that the previously reported H2cyclen2+-polyiodide structure GAFGEA,20 entirely different from 2 (different symmetry, the number of I per macrocycle, the presence of co-crystallized solvent H-bonded to the macrocycle, etc.⋯) also features I3⋯I2⋯I3 moieties (assigned as such) where the supramolecular contacts are 3.309 Å and 3.506 Å, i.e. almost identical to those observed in 2. If in a global revision process (beyond the scope of current study) we could assign such species to I82−, we would then be forced to notice that H2cyclen2+ seems to effectively stabilize such an uncommon moiety in the solid state. This will lead us to wonder why, sparking scientific curiosity and helping to identify I82−-specific templating cations. The same could be envisaged for other superior polyiodides as well.
We trust that our contribution might assist others in future assignments of superior polyiodides.
Conflicts of interest
There are no conflicts to declare.Acknowledgements
We would like to thank Dr Cristina Gellini for her assistance in recording the Raman spectrum.Notes and references
- Z. Yin, Q.-X. Wang and M.-H. Zeng, J. Am. Chem. Soc., 2012, 134, 4857–4863 CrossRef CAS PubMed.
- F. Bella, S. Galliano, M. Falco, G. Viscardi, C. Barolo, M. Grätzel and C. Gerbaldi, Chem. Sci., 2016, 7, 4880–4890 RSC.
- H. Paulsson, M. Berggrund, E. Svantesson, A. Hagfeldt and L. Kloo, Sol. Energy Mater. Sol. Cells, 2004, 82, 345–360 CrossRef CAS.
- H. Wang, H. Li, B. Xue, Z. Wang, Q. Meng and L. Chen, J. Am. Chem. Soc., 2005, 127, 6394–6401 CrossRef CAS PubMed.
- E. Pulli, E. Rozzi and F. Bella, Energy Convers. Manage., 2020, 219, 112982 CrossRef.
- Z. Fei, F. D. Bobbink, E. Păunescu, R. Scopelliti and P. J. Dyson, Inorg. Chem., 2015, 54, 10504–10512 CrossRef CAS PubMed.
- I. Jerman, V. Jovanovski, A. Šurca Vuk, S. B. Hočevar, M. Gaberšček, A. Jesih and B. Orel, Electrochim. Acta, 2008, 53, 2281–2288 CrossRef CAS.
- V. K. Thorsmølle, J. C. Brauer, S. M. Zakeeruddin, M. Grätzel and J.-E. Moser, J. Phys. Chem. C, 2012, 116, 7989–7992 CrossRef.
- J. Chang, G. Zhao, X. Zhao, C. He, S. Pang and J. M. Shreeve, Acc. Chem. Res., 2021, 54, 332–343 CrossRef CAS PubMed.
- P. H. Svensson and L. Kloo, Chem. Rev., 2003, 103, 1649–1684 CrossRef CAS PubMed.
- M. Savastano, Dalton Trans., 2021, 50, 1142–1165 RSC.
- Á. Martínez-Camarena, M. Savastano, C. Bazzicalupi, A. Bianchi and E. García-España, Molecules, 2020, 25, 3155 CrossRef PubMed.
- M. Savastano, C. Bazzicalupi, C. García, C. Gellini, M. D. L. de la Torre, P. Mariani, F. Pichierri, A. Bianchi and M. Melguizo, Dalton Trans., 2017, 46, 4518–4529 RSC.
- M. Savastano, C. Bazzicalupi, C. Gellini and A. Bianchi, Chem. Commun., 2020, 56, 551–554 RSC.
- M. Savastano, C. Bazzicalupi, C. Gellini and A. Bianchi, Crystals, 2020, 10, 387 CrossRef CAS.
- M. Savastano, Á. Martínez-Camarena, C. Bazzicalupi, E. Delgado-Pinar, J. M. Llinares, P. Mariani, B. Verdejo, E. García-España and A. Bianchi, Inorganics, 2019, 7, 48 CrossRef CAS.
- Á. Martínez-Camarena, M. Savastano, S. Blasco, E. Delgado-Pinar, C. Giorgi, A. Bianchi, E. García-España and C. Bazzicalupi, Inorg. Chem., 2022, 61, 368–383 CrossRef PubMed.
- Á. Martínez-Camarena, M. Savastano, J. M. Llinares, B. Verdejo, A. Bianchi, E. García-España and C. Bazzicalupi, Inorg. Chem. Front., 2020, 7, 4239–4255 RSC.
- A. Bianchi and E. García-España, in Supramolecular Chemistry, ed. P. A. Gale and J. W. Steed, 2012 Search PubMed.
- A. C. Warden, M. Warren, M. T. W. Hearn and L. Spiccia, New J. Chem., 2004, 28, 1160–1167 RSC.
- C. A. Ilioudis and J. W. Steed, CrystEngComm, 2004, 6, 239–242 RSC.
- P. Coppens, in Extended Linear Chain Compounds, ed. J. S. Miller, Springer US, Boston, MA, 1982, vol. 1, pp. 333–356 Search PubMed.
- L. Krause, R. Herbst-Irmer, G. M. Sheldrick and D. Stalke, J. Appl. Crystallogr., 2015, 48, 3–10 CrossRef CAS PubMed.
- G. M. Sheldrick, Acta Crystallogr., Sect. C: Struct. Chem., 2015, 71, 3–8 Search PubMed.
- C. F. Macrae, I. Sovago, S. J. Cottrell, P. T. A. Galek, P. McCabe, E. Pidcock, M. Platings, G. P. Shields, J. S. Stevens, M. Towler and P. A. Wood, J. Appl. Crystallogr., 2020, 53, 226–235 CrossRef CAS PubMed.
- E. F. Pettersen, T. D. Goddard, C. C. Huang, G. S. Couch, D. M. Greenblatt, E. C. Meng and T. E. Ferrin, J. Comput. Chem., 2004, 25, 1605–1612 CrossRef CAS PubMed.
- P. R. Spackman, M. J. Turner, J. J. McKinnon, S. K. Wolff, D. J. Grimwood, D. Jayatilaka and M. A. Spackman, J. Appl. Crystallogr., 2021, 54, 1006–1011 CrossRef CAS.
- I. J. Bruno, J. C. Cole, P. R. Edgington, M. Kessler, C. F. Macrae, P. McCabe, J. Pearson and R. Taylor, Acta Crystallogr., Sect. B: Struct. Sci., 2002, 58, 389–397 CrossRef PubMed.
- C. R. Groom, I. J. Bruno, M. P. Lightfoot and S. C. Ward, Acta Crystallogr., Sect. B: Struct. Sci., Cryst. Eng. Mater., 2016, 72, 171–179 CrossRef CAS PubMed.
- M. A. Spackman and P. G. Byrom, Chem. Phys. Lett., 1997, 267, 215–220 CrossRef CAS.
- M. A. Spackman and J. J. McKinnon, CrystEngComm, 2002, 4, 378–392 RSC.
- J. J. McKinnon, M. A. Spackman and A. S. Mitchell, Acta Crystallogr., Sect. B: Struct. Sci., 2004, 60, 627–668 CrossRef PubMed.
- M. Savastano, C. Bazzicalupi and A. Bianchi, Chem. – Eur. J., 2020, 26, 5994–6005 CrossRef CAS PubMed.
- S. Madhu, H. A. Evans, V. V. T. Doan-Nguyen, J. G. Labram, G. Wu, M. L. Chabinyc, R. Seshadri and F. Wudl, Angew. Chem., Int. Ed., 2016, 55, 8032–8035 CrossRef CAS PubMed.
- H. A. Bent, Chem. Rev., 1968, 68, 587–648 CrossRef CAS.
- N. W. Alcock, in Advances in Inorganic Chemistry and Radiochemistry, ed. H. J. Emeléus and A. G. Sharpe, Academic Press, 1972, vol. 15, pp. 1–58 Search PubMed.
- T. Clark, M. Hennemann, J. S. Murray and P. Politzer, J. Mol. Model., 2007, 13, 291–296 CrossRef CAS PubMed.
- G. Cavallo, P. Metrangolo, R. Milani, T. Pilati, A. Priimagi, G. Resnati and G. Terraneo, Chem. Rev., 2016, 116, 2478–2601 CrossRef CAS PubMed.
- S. Alvarez, Dalton Trans., 2013, 42, 8617–8636 RSC.
- J. C. Slater, Acta Crystallogr., 1959, 12, 197–200 CrossRef CAS.
- R. C. L. M. Slater, Acta Crystallogr., 1959, 12, 187–196 CrossRef CAS.
- L. Kloo, J. Rosdahl and P. H. Svensson, Eur. J. Inorg. Chem., 2002, 2002, 1203–1209 CrossRef.
- G. Manca, A. Ienco and C. Mealli, Cryst. Growth Des., 2012, 12, 1762–1771 CrossRef CAS.
- E. H. Wiebenga, E. E. Havinga and K. H. Boswijk, in Advances in Inorganic Chemistry and Radiochemistry, ed. H. J. Emeleus and A. G. Sharpe, Academic Press, 1961, vol. 3, pp. 133–169 Search PubMed.
- E. H. Wiebenga and D. Kracht, Inorg. Chem., 1969, 8, 738–746 CrossRef CAS.
- M. C. Aragoni, M. Arca, F. A. Devillanova, F. Isaia and V. Lippolis, Cryst. Growth Des., 2012, 12, 2769–2779 CrossRef CAS.
- F. S. S. Schneider, G. F. Caramori, R. L. T. Parreira, V. Lippolis, M. Arca and G. Ciancaleoni, Eur. J. Inorg. Chem., 2018, 2018, 1007–1015 CrossRef CAS.
- G. Ciancaleoni, M. Arca, G. F. Caramori, G. Frenking, F. S. S. Schneider and V. Lippolis, Eur. J. Inorg. Chem., 2016, 2016, 3804–3812 CrossRef CAS.
- H.-B. Bürgi, Angew. Chem., Int. Ed. Engl., 1975, 14, 460–473 CrossRef.
- M. C. Aragoni, M. Arca, F. A. Devillanova, M. B. Hursthouse, S. L. Huth, F. Isaia, V. Lippolis and A. Mancini, CrystEngComm, 2004, 6, 540–542 RSC.
- P. Deplano, J. R. Ferraro, M. L. Mercuri and E. F. Trogu, Coord. Chem. Rev., 1999, 188, 71–95 CrossRef CAS.
- P. Deplano, F. A. Devillanova, J. R. Ferraro, M. L. Mercuri, V. Lippolis and E. F. Trogu, Appl. Spectrosc., 1994, 48, 1236–1241 CrossRef CAS.
- G. Jones, J. Phys. Chem., 1930, 34, 673–691 CrossRef CAS.
- J. Lin, J. Martí-Rujas, P. Metrangolo, T. Pilati, S. Radice, G. Resnati and G. Terraneo, Cryst. Growth Des., 2012, 12, 5757–5762 CrossRef CAS.
- B. Braïda and P. C. Hiberty, J. Phys. Chem. A, 2000, 104, 4618–4628 CrossRef.
- R. W. Lynch and H. G. Drickamer, J. Chem. Phys., 1966, 45, 1020–1026 CrossRef CAS PubMed.
- Y. Fujii, K. Hase, N. Hamaya, Y. Ohishi, A. Onodera, O. Shimomura and K. Takemura, Phys. Rev. Lett., 1987, 58, 796–799 CrossRef CAS PubMed.
Footnote |
| † Electronic supplementary information (ESI) available: Crystal data refinement parameters, tables of contacts, information on CSD datasets. CCDC 2142722 and 2142723. For ESI and crystallographic data in CIF or other electronic format see DOI: 10.1039/d2dt00185c |
| This journal is © The Royal Society of Chemistry 2022 |

