 Open Access Article
Creative Commons Attribution 3.0 Unported Licence
Mapping catalyst activation, turnover speciation and deactivation in Rh/PPh3-catalysed olefin hydroformylation†
Alejandro
Bara-Estaún
 ab,
Catherine L.
Lyall
 ab,
John P.
Lowe
 ab,
Paul G.
Pringle
 d,
Paul C. J.
Kamer
 e,
Robert
Franke
fg and
Ulrich
Hintermair
 *abc
*abc
aDepartment of Chemistry, University of Bath, Claverton Down, BA2 7AY Bath, UK. E-mail: uh213@bath.ac.uk
bDynamic Reaction Monitoring Facility, University of Bath, Claverton Down, BA2 7AY Bath, UK
cCentre for Sustainable & Circular Technologies, University of Bath, Bath BA2 7AY, UK
dSchool of Chemistry, University of Bristol, Cantock's Close, Bristol BS8 1TS, UK
eLeibniz Institute for Catalysis, Albert-Einstein-Straße 29A, 18059 Rostock, Germany
fEvonik Performance Materials GmbH, Paul-Baumann-Straße 1, 45772 Marl, Germany
gLehrstuhl für Theoretische Chemie, Ruhr-Universität Bochum, 44780 Bochum, Germany
First published on 26th July 2022
Abstract
We report new insights into the fate of the precious metal during hydroformylation catalysis of 1-hexene with Rh/PPh3 complexes using multi-nuclear operando FlowNMR spectroscopy. By applying selectively excited 1H and 31P{1H} NMR pulse sequences we were able to characterise and quantify key hydrido-rhodium and acyl-rhodium intermediates formed during turnover as well as dormant dimeric carbonyl complexes. The quantitative catalyst distribution maps derived this way explain catalyst stability and activity across a range of reaction conditions, including why CO-lean conditions give faster hydroformylation catalysis through the suppression of dimer and cluster formation. The activation behaviour of five commonly used precursors and the thermal stability of the phosphine-hydrido complex [RhH(CO)(PPh3)3] have been investigated, and the benefits of applying controlled temperature gradients for quantitative FlowNMR spectroscopic reaction monitoring of dynamic catalyst systems are demonstrated.
1 Introduction
The reaction in which aldehydes are formed from olefins with H2 and CO in the presence of a suitable catalyst is known as hydroformylation or the “oxo” process.1 Originally discovered by Otto Roelen in 1938,2 it has since been studied extensively in both industrial and academic settings with a variety of ligands and metals.3,4 Rh and Co stand out as hydroformylation catalysts as, to date, they are still the only ones used in industry due to their high selectivity and activity.5 Nowadays, catalytic hydroformylation of olefins mediated by cobalt or rhodium complexes is one of the largest and most important industrial applications of homogeneous catalysis with an annual production of over 10 million metric tonnes in 2008.6 A large proportion of contemporary hydroformylation processes use the more active rhodium catalysts with phosphine or phosphite ligands in organic or aqueous/organic solution.7,8 New insights regarding the structure and catalytic relevance of various reaction intermediates have been discovered thanks to the development of new spectroscopic and computational techniques.6 Nevertheless, the elevated pressure and temperature used in addition to the O2 sensitivity of the catalysts still pose a challenge for true operando studies.9 Initial rate kinetic analyses and in situ IR and NMR studies have shed some light on the reaction mechanism and identified [RhH(CO)2(PPh3)2] as the dominant catalyst state,10 but a quantitative picture of the catalyst speciation during activation and turnover is still lacking. Furthermore, the fate of dormant off-cycle species and catalyst decomposition pathways, knowledge crucial to commercial processes using an expensive noble metal such as rhodium, has received little attention.6IR spectroscopy has long been the technique of choice for investigating hydroformylation catalysts due to the strong, characteristic absorptions of carbonyl functionalities. Since the development of high-pressure IR (HP-IR) cells, different setups have been designed and used in carbonylation chemistry.11–13 A recent example was reported by Selent et al., who designed a bespoke in situ HP-IR autoclave especially suited for operando mechanistic studies.14 IR spectroscopy is a fast and sensitive analytical technique, but it provides limited structural information and is often only used qualitatively due to the need for individual peak calibration. Despite being a slower and less sensitive technique than IR, NMR spectroscopy provides inherently quantitative data, offers wide applicability due to the number of NMR active nuclei, and provides detailed information on molecular structure and dynamics.15 Previously, in situ NMR studies on Rh/PR3 hydroformylation systems have been carried out in static high-pressure NMR tubes using 31P NMR experiments.16 However, the absence of active mixing and associated mass transfer limitations (in particular gas depletion) mean that observations derived from such experiments are of limited relevance to real-world process conditions.17 Online multi-nuclear high resolution FlowNMR spectroscopy has recently been shown to be a suitable technique to perform operando studies of complex reaction mixtures during catalytic turnover.18 When flow effects on signal quantification are accounted for18 and engineering aspects of the flow system considered,19 accurate data on the reaction progress and catalyst speciation free from mass transport limitations may be obtained even for highly air-sensitive systems operating at elevated temperature and pressure.20–23 FlowNMR has also been used to monitor the amount of H2 dissolved in solution at low24 and high pressures25 after consideration of flow effects and the ortho/para ratio of H2.
Hydroformylation reactions have been studied by operando FlowNMR spectroscopy as well. Burés et al. reported a kinetic study of an Rh/phosphite-catalysed hydroformylation reaction in 2019, but without any catalyst characterisation.26 In the same year, Landis et al. published a detailed kinetic analysis of an asymmetric Rh-catalysed hydroformylation studied using a 10 mm high-pressure sample tube as a stationary reactor in the NMR spectrometer with active gas and liquid recirculation.27 They developed a microkinetic model for Rh(bis-diazaphospholane)-catalysed hydroformylation that fit catalytic and stoichiometric reaction data well. In 2020 we reported an investigation of the Rh/PPh3 catalysed hydroformylation of 1-hexene by multi-nuclear, high pressure, operando FlowNMR spectroscopy.281H NMR experiments together with selectively excited 1H NMR and 31P{1H} NMR pulse sequences were interleaved to monitor the reaction. 1H NMR data allowed the quantification of dissolved H2 while tracking substrate consumption and product formation to obtain high-quality reaction progress profiles. Selectively excited 1H and 31P{1H} NMR experiments in combination with diffusion measurements and 2D NMR experiments were used to detect Rh/PPh3 intermediates during catalytic turnover (Scheme 1). The isomeric e,a and e,e bis-phosphine complexes [RhH(CO)2(PPh3)2] (A/B) were observed as the predominant hydrido phosphine Rh complex during turnover. They formed reversibly from the isomeric e,e,e and e,e,a tris-phosphine complexes [RhH(CO)(PPh3)3] (C/D) under CO pressure, or directly from [Rh(acac)(CO)2] with excess PPh3 under H2 and CO. The mono-phosphine trans-acyl complex [Rh(CO(CH2)5CH3)(CO)3(PPh3)] (Q), in equilibrium with the e,e and e,a bis-phosphine acyl complexes [Rh(CO(CH2)5CH3)(CO)2(PPh3)2] (O/P), was characterised as an in-cycle species prior to hydrogenolysis that liberates the aldehyde product when using two or less equivalents of PPh3 in the reaction. These acyl complexes could also be obtained by mixing 1-hexene with C/D under an atmosphere of CO without H2 present.
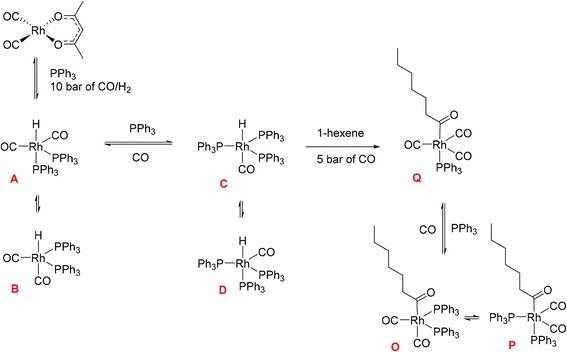 | ||
| Scheme 1 Phosphine Rh complexes detected and characterised by FlowNMR spectroscopy when monitoring the hydroformylation of 1-hexene in the presence of Rh(acac)(CO)2/PPh3 at 50 °C in toluene.28 | ||
Initially, these Rh species have not been quantified due to low signal-to-noise (S/N) caused by flow effects and their fluxional behaviour as a result of various intra- and inter-molecular exchange processes under the reaction conditions. The 31P{1H} NMR signal for the excess free PPh3 was sometimes broadened to the limit of detection and scalar P–H, Rh–H and C–P couplings obscured by the fast interconversion of multiple species. Here we report methods to make 31P{1H} NMR and selective excitation 1H NMR measurements robustly quantitative in flow in order to map the distribution of catalytic intermediates before, during and after turnover. Besides building a more comprehensive picture of the mechanism of Rh/PR3-catalysed hydroformylation, our results yield important insights into unproductive off-cycle species relevant for efficient application with optimum use of the precious metal.
2 Results and discussion
2.1 NMR signal quantification
The accurate quantification of NMR signals (qNMR) requires careful selection of acquisition parameters, such as spectral width (SW), transmitter excitation frequency (O1P), number of scans (NS), digital resolution (sampling rate), and the intercorrelated choice of flip angle (FA) and acquisition (AQ) plus delay (D1) time.29–32 Once these settings have been optimised, a critical parameter of the analyte(s) under investigation are the longitudinal or spin–lattice relaxation time constants (T1) of the nuclei of interest, as the D1 of the NMR experiment must be at least five times the longest T1 to give a quantitative NMR signal.30T1 values for 1H and 31P in medium-sized molecules may vary from 0.1 s to 20 s, a considerable range that can greatly affect signal quantification. These values are often not known a priori and are difficult to tabulate as they vary with temperature, solvent, matrix of reaction mixture and even gas composition.33 In continuous flow, signal quantification is further complicated by flow effects, making the absolute quantification of FlowNMR data critically dependant on careful calibration against static spectra (or precise knowledge of all relevant T1 values) and the use of an internal standard. In our previous work28 all 1H FlowNMR data, including selective excitation experiments, had been made quantitative in this way, but any 31P{1H} FlowNMR observations remained qualitative due to the absence of a 31P NMR standard, unknown range of values and broadened signals. In the following we address these limitations.
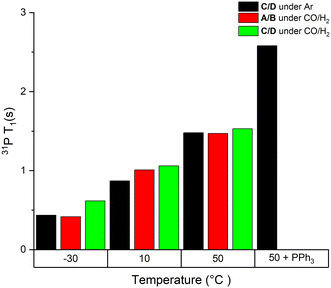 | ||
| Fig. 1 Static 31P T1 values of mixtures of complexes A/B and C/D at 40 mM in toluene under different conditions as indicated. | ||
As can be seen from the data in Fig. 1, T1 values of the bound PPh3 in both Rh complexes were relatively short (<3 s) but increased three-fold when increasing the temperature from −30 °C to 50 °C. We found less than 15% difference between the two complexes at any point, which is likely due to their similar structure and comparable degree of fluxionality. The effect of syngas versus argon was similarly small, indicating a negligible effect of excess CO (causing interconversion between A/B and C/D) on the quantification of either complex. However, the addition of excess PPh3 to C/D almost doubled the T1 value of Rh-bound PPh3 ligand. This is likely a mixing effect that depends on the residence time of the ligand on the metal as well as the respective relaxation time constants of the bound and free state of the ligand, highlighting the difficulty of accurate 31P NMR quantification of such dynamic mixtures (Scheme 2). This impact of free ligand on signal quantification is especially relevant to hydroformylation chemistry where different amounts of ligand excess are often compared. Nevertheless, measuring the T1 values under the reaction conditions applied or using appropriately long D1 times allows for precise signal quantification.
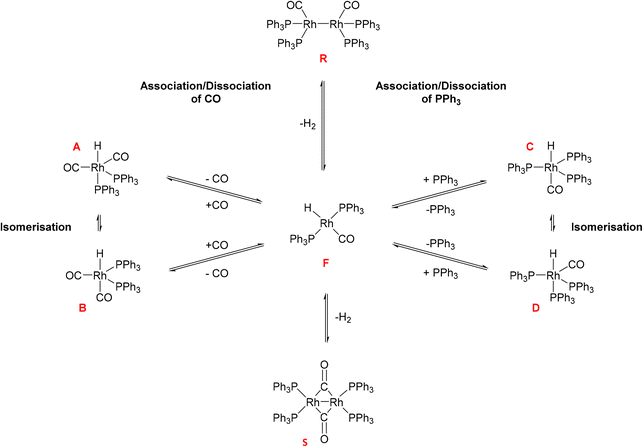
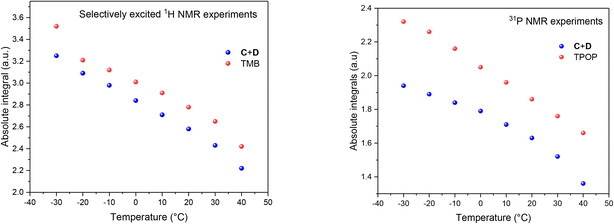
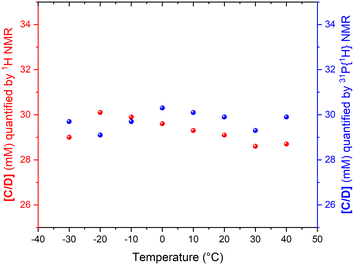
The fact that the signal intensities of both standards paralleled the signal intensities of the 1H and 31P NMR signals of the dynamic complex [RhH(CO)(PPh3)3] (Scheme 2) over a range of 70 °C suggests that although the compound engages in both intramolecular and intermolecular exchange processes, it may be accurately quantified using either nucleus as long as their NMR signals do not decoalesce. This assertion is further supported by the direct comparison of both integral values against their respective internal standards which do not engage in any dynamic exchanges (Fig. 3).
As the data in Fig. 3 shows, with suitable acquisition parameters both nuclei allow accurate quantification of the same complex against either standard over a range of temperatures, cancelling out the effect of a shift in the Boltzmann distribution (visible in Fig. 2). When the experiment was repeated under 5 bar of syngas, conditions that cause C/D to engage in additional exchange equilibria (Scheme 2), the quantification of C/D against either internal standard remained accurate although new (separate) signals for A/B were observed (Fig. S2–S4†). Dilution down to catalytic loadings of Rh did not affect the validity of the signal quantification either (Fig. S5†), showing the quantification method to extend robustly to process conditions.
2.2 Hydroformylation of 1-hexene catalysed by [Rh(acac)(CO)2] + PPh3
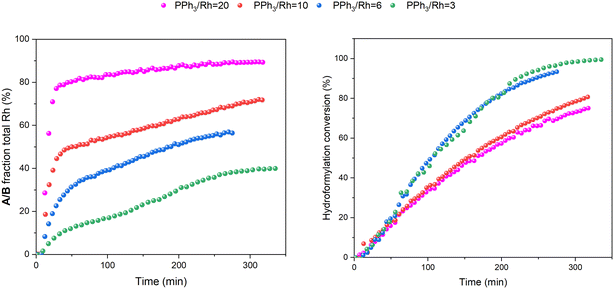
The hydroformylation of 1-hexene in the presence of [Rh(acac)(CO)2] and various amounts of PPh3 was studied by quantitative 1H, selective excitation 1H and 31P{1H} FlowNMR spectroscopy under 10–12 bar of H2/CO (various ratios) at 50 °C (Fig. 4). These experiments were carried out as described in the ESI,† using 25 mL of non-deuterated toluene with rhodium concentrations of 2.5 mM and 1-hexene concentrations of 500 mM corresponding to a [S]/[Rh] = 200 or 0.5 mol% catalyst loading in all cases. The concentration of PPh3 was varied from 0–250 mM resulting in ratios of [PPh3]/[Rh] = 0–100.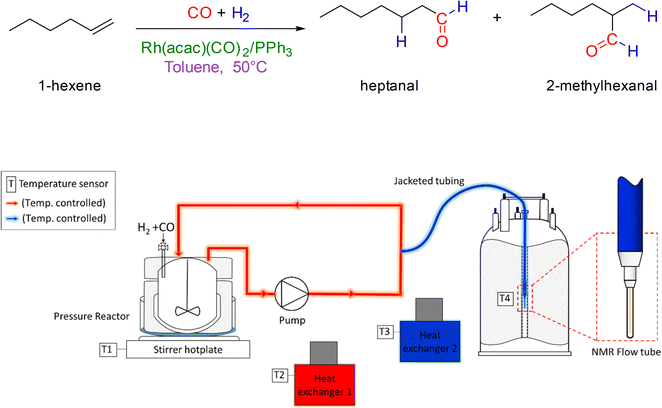 | ||
| Fig. 4 Reaction conditions of the hydroformylation of 1-hexene (upper) and schematic of the FlowNMR apparatus (lower). | ||
Interestingly, when only one equivalent PPh3 was used in the reaction no Rh–H species were observed during catalysis, and the only catalyst intermediate detected by 31P{1H} FlowNMR was the mono-phosphine acyl complex Q (Fig. S8†) identified previously.28
When the syngas composition was changed from 1![[thin space (1/6-em)]](https://www.rsc.org/images/entities/char_2009.gif) :
:![[thin space (1/6-em)]](https://www.rsc.org/images/entities/char_2009.gif) 1 to 3
1 to 3![[thin space (1/6-em)]](https://www.rsc.org/images/entities/char_2009.gif) :
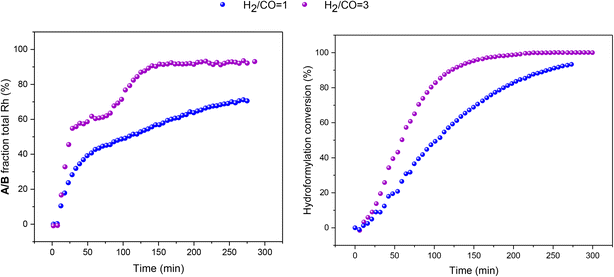
:![[thin space (1/6-em)]](https://www.rsc.org/images/entities/char_2009.gif) 1 H2/CO at the same total pressure in an experiment using six equivalents of PPh3 the catalysis was ∼30% faster (Fig. 6), reflecting the positive reaction order in H2 which effects the turnover-limiting hydrogenolysis. CO is known to have a negative effect on the reaction kinetics, partially due to the formation of inactive dimers, trimers and other carbonyl species without hydrido groups, reducing the amount of active Rh–H complexes.36 The amount of A/B detected with three times more H2 over CO was increased (Fig. 6), showing a stepwise profile consisting of a steady-state plateau around 60% of all Rh while hydroformylation was rapid (15–75 min) followed by a gradual increase to 90% after the catalysis had ceased after 2.5 h (Fig. S9 and S10†).
1 H2/CO at the same total pressure in an experiment using six equivalents of PPh3 the catalysis was ∼30% faster (Fig. 6), reflecting the positive reaction order in H2 which effects the turnover-limiting hydrogenolysis. CO is known to have a negative effect on the reaction kinetics, partially due to the formation of inactive dimers, trimers and other carbonyl species without hydrido groups, reducing the amount of active Rh–H complexes.36 The amount of A/B detected with three times more H2 over CO was increased (Fig. 6), showing a stepwise profile consisting of a steady-state plateau around 60% of all Rh while hydroformylation was rapid (15–75 min) followed by a gradual increase to 90% after the catalysis had ceased after 2.5 h (Fig. S9 and S10†).
While monitoring the amount of A/B delivered interesting insights into the catalyst speciation during turnover, the quantitative FlowNMR analysis was still missing a fraction of the Rh loading used. In addition to the possible formation of Rh-carbonyl clusters lacking any 1H and 31P NMR signature, the 31P{1H} NMR spectra did contain several weak signals with characteristic 1JRh–P coupling, but due to the low S/N under the conditions applied (i.e. at sub-mM concentrations and 50 °C) and unknown  values these could not be reliably characterised and quantified.
![[thin space (1/6-em)]](https://www.rsc.org/images/entities/char_2009.gif) :
:![[thin space (1/6-em)]](https://www.rsc.org/images/entities/char_2009.gif) 1 in favour of the reactor versus the flow system and average residence times of 1.6 min in the latter, the thermal effect on the reaction rate would be acceptable if a consistent temperature gradient was used throughout all experiments. With separate heating circuits for different sections of our FlowNMR setup19 we thus applied a stepwise temperature gradient from 50 °C in the reactor down to 0 °C in the tip of the flow tube in the NMR spectrometer and back (Fig. 7).
1 in favour of the reactor versus the flow system and average residence times of 1.6 min in the latter, the thermal effect on the reaction rate would be acceptable if a consistent temperature gradient was used throughout all experiments. With separate heating circuits for different sections of our FlowNMR setup19 we thus applied a stepwise temperature gradient from 50 °C in the reactor down to 0 °C in the tip of the flow tube in the NMR spectrometer and back (Fig. 7).
The temperature of the sample arriving at the tip of the flow tube in the NMR probe under the conditions applied (4 mL min−1 flow rate) was shown to be 7 °C using the methanol NMR thermometer37 (Table S4†). Gratifyingly, the NMR signals of complexes A/B flowing through the system under these conditions exhibited the decoalescence observed in VT-NMR experiments performed in NMR tubes (Fig. S1 and S2 and S10 and S11†), and the 31P{1H} S/N increased almost nine-fold from 3.2 at 50 °C to 27.8 at 7 °C.
When hydroformylation catalysis with one equivalent of PPh3 per Rh was monitored using this controlled temperature gradient (Fig. 7), the mono-phosphine acyl complex Q was the only Rh complex detected during turnover (Fig. 8), as in the experiments at constant 50 °C. More detailed analysis using a D1 of 35 seconds showed the existence of both linear and branched acyl isomers of Q (Fig. S12†).
As can be seen from the 31P{1H} NMR profiles shown in Fig. 8 a noticeable amount of triphenylphosphine oxide was also formed during the reaction, as also seen in all other experiments with this catalytic system (see below). Control reactions in thoroughly deoxygenated and sealed sample tubes showed this to be an intrinsic feature of the catalysis, and not due to traces of oxygen being present within or penetrating the flow system over time. Furthermore, a significant proportion of the Rh used was not detected by quantitative 1H and 31P{1H} NMR spectroscopy under these conditions, suggesting the formation of a significant amount of Rh-carbonyl clusters when using one equivalent of PPh3.
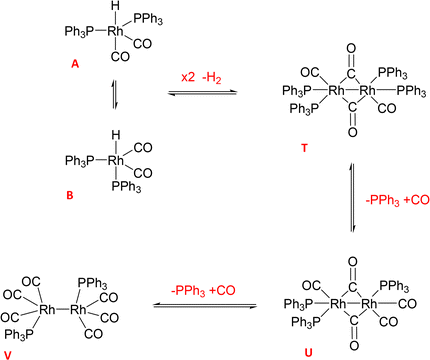
With the increased resolution and sensitivity at lower sample temperature, a new Rh–P species was detected towards the end of the reaction once substrate concentration had fallen below 50 mM. A signal centred at 27.8 ppm with second order coupling including a 1JRh–P = 136 Hz (Fig. S12 and S13†) was identified as the carbonyl phosphine Rh dimer [Rh(CO)6(PPh3)2] V (Scheme 3). This compound has previously been reported by Bianchini et al. who suggested the structure of the dimer to have two μ(CO) groups bridging the metals without a formal metal–metal bond.9 However, single crystal X-ray diffraction of a sample of V synthesised through the reaction of [Rh(acac)(CO)(PPh3)] with syngas showed it to possess three terminal carbonyls on each metal in staggered arrangement around a Rh–Rh single bond of 2.812 Å (Fig. 9).
When two equivalents of PPh3 per Rh were used A/B was still the only Rh–H complex detected throughout the reaction, as seen at constant 50 °C (Fig. S7 and S8†), but small amounts of the mono-phosphine acyl complex Q and the carbonyl phosphine Rh dimer V (Fig. S14†) were also detected using the low temperature flow acquisition (Fig. 10). Comparing the catalyst distribution profile with the reaction progress, two interesting observations can be made: (i) the build-up of the hydrido-phosphine resting state A/B mirrored substrate consumption (Fig. 10); and (ii) the decay of the in-cycle acyl intermediate Q aligned with the increase in dimer V at the end of the catalysis (from ∼400 min). The slow, gradual decrease in A/B after full conversion produced more Vvia reductive coupling9 (Scheme 3). The still incomplete mass balance and detection of free PPh3 suggests that even under these conditions up to 70% of the Rh resided in phosphine-free Rh-carbonyl clusters during the reaction.
When using three equivalents of PPh3 per Rh, Q and A/B were again the main catalyst species observed throughout the reaction, with the appearance dimer V at the expense of in-cycle Q once the substrate had been consumed (Fig. 11). The build-up of the at-cycle hydrido-phosphine complexes A/B again mirrored substrate consumption, but with three equivalents of PPh3 a small amount of a new Rh species was detected at 23.7 ppm (1JRh–P = 157 Hz) and 22.1 ppm (1JRh–P = 127 Hz) in the 31P{1H} NMR spectra (Fig. S15†) which was characterised as the tris-PPh3 Rh-carbonyl dimer U (Scheme 3). The solid-state structure of U was also confirmed by X-ray crystallography on a post-reaction sample that confirmed the dimer structure with two μ(CO) groups between the metals as reported previously.38
Increasing the ligand loading to six equivalents under otherwise identical reaction conditions caused a similar profile of A/B during the catalysis, with increasing amounts as the reaction progressed to completion (Fig. 12) to reach 1 mM (40% of all Rh) after 8 hours. With an excess of free PPh3 present the bis-phosphine hydrido complex A/B was stable without any detectable dimer formation during turnover. Due to the excess CO still present in solution, no tris-phosphine hydrido complex C/D was observed to form either. As with lower ligand loadings, a transient trace of the in-cycle acyl intermediate Q was present during turnover that reached a maximum of 0.5 mM (20% of all Rh) when the rate of the catalysis was highest, then decaying to A/B as the reaction approached completion. Only traces of dimers U and V were observed by 31P{1H} NMR after 16 hours under reaction conditions (Fig. S16 and S17†).
When changing the H2/CO ratio from 1![[thin space (1/6-em)]](https://www.rsc.org/images/entities/char_2009.gif) :
:![[thin space (1/6-em)]](https://www.rsc.org/images/entities/char_2009.gif) 1 to 3
1 to 3![[thin space (1/6-em)]](https://www.rsc.org/images/entities/char_2009.gif) :
:![[thin space (1/6-em)]](https://www.rsc.org/images/entities/char_2009.gif) 1 with six equivalents of PPh3, hydroformylation catalysis was 40% faster with qualitatively the same trace of A/B over time (Fig. 13). With more H2 present no acyl intermediate Q was observed during turnover, but a small amount of the tris-phosphine hydrido complex C/D formed under these CO-lean conditions. Both A/B and C/D were found to be stable under these conditions with no detectable amounts of dimers U or V in the 31P{1H} NMR spectra (Fig. S18†). Correspondingly, the concentrations of the at-cycle resting states A/B + C/D reached up to 2.4 mM (>95% of all Rh) towards the end of the reaction, evidencing negligible Rh-carbonyl cluster formation under these conditions.
1 with six equivalents of PPh3, hydroformylation catalysis was 40% faster with qualitatively the same trace of A/B over time (Fig. 13). With more H2 present no acyl intermediate Q was observed during turnover, but a small amount of the tris-phosphine hydrido complex C/D formed under these CO-lean conditions. Both A/B and C/D were found to be stable under these conditions with no detectable amounts of dimers U or V in the 31P{1H} NMR spectra (Fig. S18†). Correspondingly, the concentrations of the at-cycle resting states A/B + C/D reached up to 2.4 mM (>95% of all Rh) towards the end of the reaction, evidencing negligible Rh-carbonyl cluster formation under these conditions.
Using 10 equivalents of PPh3 per Rh with 1![[thin space (1/6-em)]](https://www.rsc.org/images/entities/char_2009.gif) :
:![[thin space (1/6-em)]](https://www.rsc.org/images/entities/char_2009.gif) 1 syngas the catalysis was 10% slower than with 3–6 equivalents (see also Fig. 5), and catalyst distribution was further pushed into the at-cycle complexes A/B with no traces of acyl intermediate Q detected (Fig. 14). As when using 6 equivalents of PPh3 and 3
1 syngas the catalysis was 10% slower than with 3–6 equivalents (see also Fig. 5), and catalyst distribution was further pushed into the at-cycle complexes A/B with no traces of acyl intermediate Q detected (Fig. 14). As when using 6 equivalents of PPh3 and 3![[thin space (1/6-em)]](https://www.rsc.org/images/entities/char_2009.gif) :
:![[thin space (1/6-em)]](https://www.rsc.org/images/entities/char_2009.gif) 1 H2/CO (Fig. 13), the phosphine hydrido complexes were stable towards dimerization to U or V with 10 equivalents of PPh3 but only made up 1.6 mM (65% of all Rh) indicating the formation of some 1H and 31P NMR silent Rh-carbonyl clusters.
1 H2/CO (Fig. 13), the phosphine hydrido complexes were stable towards dimerization to U or V with 10 equivalents of PPh3 but only made up 1.6 mM (65% of all Rh) indicating the formation of some 1H and 31P NMR silent Rh-carbonyl clusters.
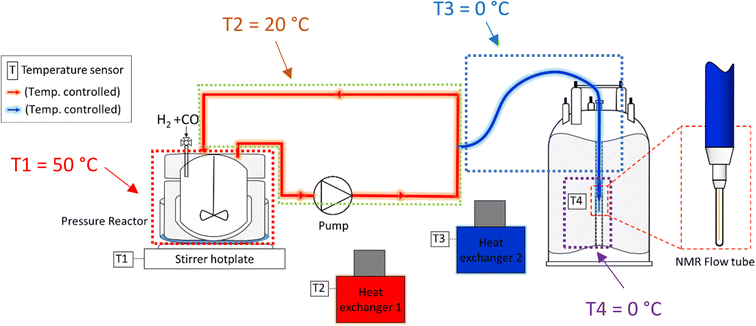 | ||
| Fig. 7 Schematic of the FlowNMR apparatus (not in scale) showing different temperature zones throughout the flow path. | ||
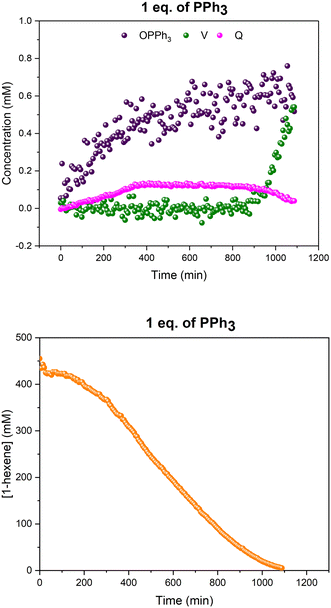 | ||
Fig. 8 Profiles of catalyst species from quantitative 31P{1H} FlowNMR (upper) and 1-hexene concentration from quantitative 1H FlowNMR (lower) during the hydroformylation of 1-hexene under 10 bar of CO/H2 (1![[thin space (1/6-em)]](https://www.rsc.org/images/entities/char_2009.gif) : :![[thin space (1/6-em)]](https://www.rsc.org/images/entities/char_2009.gif) 1) at 50 °C catalysed by [Rh(acac)(CO)2] = 2.5 mM and [PPh3] = 2.5 mM in 22.4 mL of non-deuterated toluene using the temperature gradients shown in Fig. 7. 1) at 50 °C catalysed by [Rh(acac)(CO)2] = 2.5 mM and [PPh3] = 2.5 mM in 22.4 mL of non-deuterated toluene using the temperature gradients shown in Fig. 7. | ||
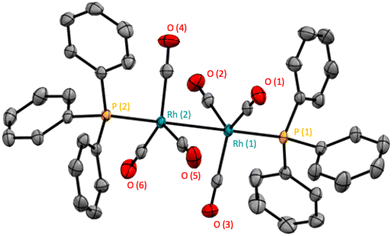 | ||
| Fig. 9 Solid-state structure of [Rh(CO)6(PPh3)2] (V). Hydrogen atoms have been omitted for clarity and thermal ellipsoids are shown at 50% probability level. | ||
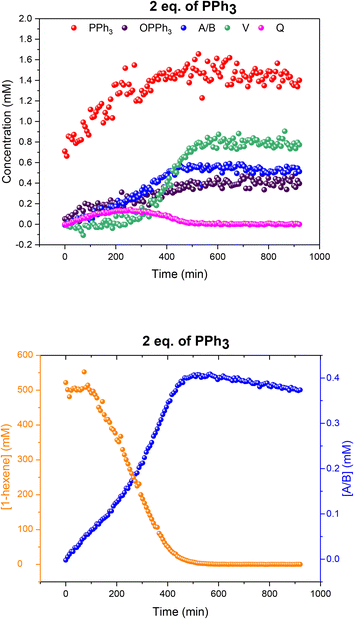 | ||
Fig. 10 Profiles of catalyst species from quantitative 31P{1H} FlowNMR (upper) and 1-hexene concentration from quantitative 1H FlowNMR (lower) during the hydroformylation of 1-hexene under 10 bar of CO/H2 (1![[thin space (1/6-em)]](https://www.rsc.org/images/entities/char_2009.gif) : :![[thin space (1/6-em)]](https://www.rsc.org/images/entities/char_2009.gif) 1) at 50 °C catalysed by [Rh(acac)(CO)2] = 2.5 mM and [PPh3] = 5 mM in 22.4 mL of non-deuterated toluene using the temperature gradients shown in Fig. 7. 1) at 50 °C catalysed by [Rh(acac)(CO)2] = 2.5 mM and [PPh3] = 5 mM in 22.4 mL of non-deuterated toluene using the temperature gradients shown in Fig. 7. | ||
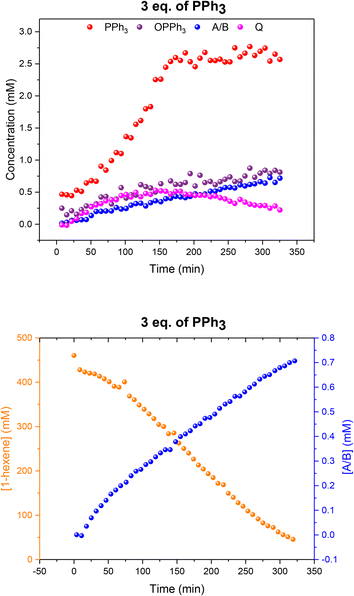 | ||
Fig. 11 Profiles of catalyst species from quantitative 31P{1H} FlowNMR (upper) and 1-hexene concentration from quantitative 1H FlowNMR (lower) during the hydroformylation of 1-hexene under 10 bar of CO/H2 (1![[thin space (1/6-em)]](https://www.rsc.org/images/entities/char_2009.gif) : :![[thin space (1/6-em)]](https://www.rsc.org/images/entities/char_2009.gif) 1) at 50 °C catalysed by [Rh(acac)(CO)2] = 2.5 mM and [PPh3] = 7.5 mM in 22.4 mL of non-deuterated toluene using the temperature gradients shown in Fig. 7. 1) at 50 °C catalysed by [Rh(acac)(CO)2] = 2.5 mM and [PPh3] = 7.5 mM in 22.4 mL of non-deuterated toluene using the temperature gradients shown in Fig. 7. | ||
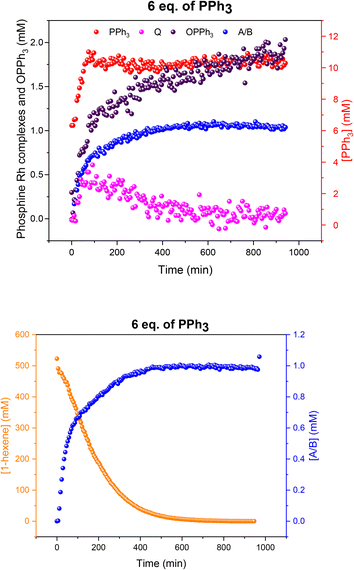 | ||
Fig. 12 Profiles of catalyst species from quantitative 31P{1H} FlowNMR (upper) and 1-hexene concentration from quantitative 1H FlowNMR (lower) during the hydroformylation of 1-hexene under 10 bar of CO/H2 (1![[thin space (1/6-em)]](https://www.rsc.org/images/entities/char_2009.gif) : :![[thin space (1/6-em)]](https://www.rsc.org/images/entities/char_2009.gif) 1) at 50 °C catalysed by [Rh(acac)(CO)2] = 2.5 mM and [PPh3] = 15 mM in 22.4 mL of non-deuterated toluene using the temperature gradients shown in Fig. 7. 1) at 50 °C catalysed by [Rh(acac)(CO)2] = 2.5 mM and [PPh3] = 15 mM in 22.4 mL of non-deuterated toluene using the temperature gradients shown in Fig. 7. | ||
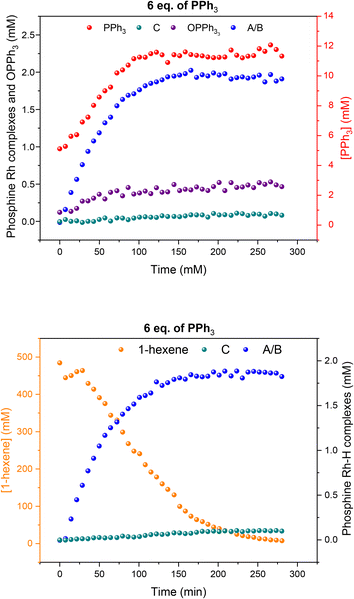 | ||
Fig. 13 Profiles of catalyst species from quantitative 31P{1H} FlowNMR (upper) and 1-hexene concentration from quantitative 1H FlowNMR (lower) during the hydroformylation of 1-hexene under 10 bar of CO/H2 (1![[thin space (1/6-em)]](https://www.rsc.org/images/entities/char_2009.gif) : :![[thin space (1/6-em)]](https://www.rsc.org/images/entities/char_2009.gif) 3) at 50 °C catalysed by [Rh(acac)(CO)2] = 2.5 mM and [PPh3] = 15 mM in 22.4 mL of non-deuterated toluene using the temperature gradients shown in Fig. 7. 3) at 50 °C catalysed by [Rh(acac)(CO)2] = 2.5 mM and [PPh3] = 15 mM in 22.4 mL of non-deuterated toluene using the temperature gradients shown in Fig. 7. | ||
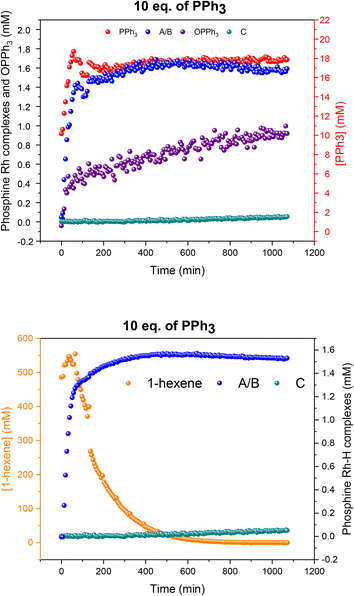 | ||
Fig. 14 Profiles of catalyst species from quantitative 31P{1H} FlowNMR (upper) and 1-hexene concentration from quantitative 1H FlowNMR (lower) during the hydroformylation of 1-hexene under 10 bar of CO/H2 (1![[thin space (1/6-em)]](https://www.rsc.org/images/entities/char_2009.gif) : :![[thin space (1/6-em)]](https://www.rsc.org/images/entities/char_2009.gif) 1) at 50 °C catalysed by [Rh(acac)(CO)2] = 2.5 mM and [PPh3] = 25 mM in 22.4 mL of non-deuterated toluene using the temperature gradients shown in Fig. 7. 1) at 50 °C catalysed by [Rh(acac)(CO)2] = 2.5 mM and [PPh3] = 25 mM in 22.4 mL of non-deuterated toluene using the temperature gradients shown in Fig. 7. | ||
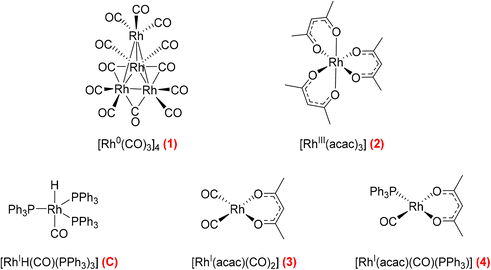 | ||
| Fig. 16 Commercial Rh complexes commonly used as hydroformylation precursors investigated for their activation behaviour with PPh3 and syngas in toluene. | ||
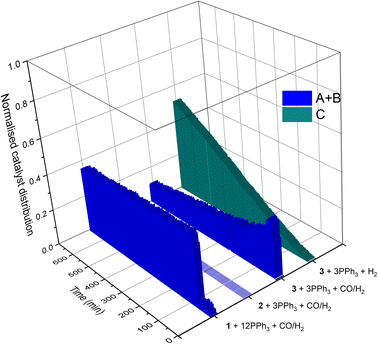 | ||
| Fig. 17 Activation of different Rh precursors (Fig. 16) at 2.5 mM in toluene with PPh3 and H2 and/or CO at 10 bar and 50 °C as derived from quantitative FlowNMR spectroscopy. | ||
All these trends continued when increasing the ligand loading further to 20 and 100 equivalents of PPh3 per Rh: the higher the excess of free ligand the slower the catalysis, and more A/B was pushed into C/D with no acyl intermediate Q or dimers U and V detected during the reaction (Fig. S19 and S20†).
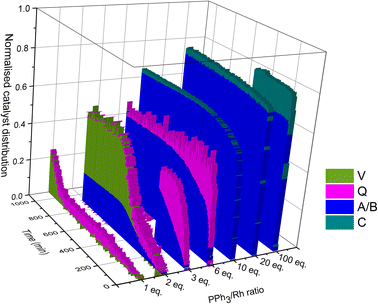
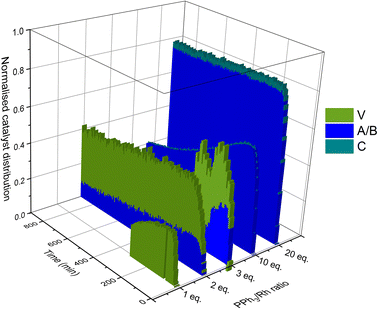
Taking all this data together, quantitative catalyst maps can be built that illustrate the shift in Rh speciation across different conditions. Fig. 15 illustrates the evolution in speciation over reaction time using 1![[thin space (1/6-em)]](https://www.rsc.org/images/entities/char_2009.gif) :
:![[thin space (1/6-em)]](https://www.rsc.org/images/entities/char_2009.gif) 1 H2/CO at 50 °C for ligand loadings of 1–100 equivalents. Any undetected Rh in this normalised plot either resides in Rh-carbonyl clusters or metallic Rh nanoparticles or deposits.
1 H2/CO at 50 °C for ligand loadings of 1–100 equivalents. Any undetected Rh in this normalised plot either resides in Rh-carbonyl clusters or metallic Rh nanoparticles or deposits.
If the mechanistic relevance of at least the main catalyst species observed is known, such maps can be used to rationalise observations of catalyst activity and stability. In this case, hydroformylation catalysis was fastest with 3–6 equivalents of PPh3, conditions that produced an observable amount of mono-phosphine acyl intermediate Q along with moderate quantities (<50% of all Rh) of the bis-phosphine hydrido complexes A/B. Conditions with less PPh3 gave rise to more phosphine-carbonyl dimer V and large amounts of other, uncharacterised Rh-carbonyl clusters, leading to lower hydroformylation activity. Using >6 equivalents of PPh3 on the other hand decreased the amount of carbonyl dimers and clusters to shift the Rh distribution more into the bis-phosphine hydrido complex A/B, thereby also slowing down the rate of the catalysis. The optimum performance with 3–6 equivalents of ligand can thus be understood as the best compromise between under- and over-coordination of Rh by PPh3versus the substrates CO, H2 and alkene. Increasing the H2/CO ratio can increase catalyst activity further by lowering the amount of competitive carbonyl binding that decreases the rate (see Fig. 13). Changes in concentration, pressure, temperature, ligand and substrate are all expected to shift these effects due to the highly dynamic nature of the catalyst system, but as long as the key intermediates can be detected and reliably quantified the behaviour of the catalytic system may be mapped out in the same way. In the following we briefly investigate precursor activation and catalyst stability in the absence of substrate with the same approach.
Various pre-activation protocols aimed at maximising initial rates have been used in the hydroformylation literature.39,40 Most studies adopt the common practice of exposing the Rh precursor and ligand to syngas for several hours with heating before the autoclave is vented, substrate added and repressurised with syngas to start the hydroformylation reaction. However, the different precursors, solvents, ligands and conditions used in these pre-activation protocols make rationalisation of the effectiveness of these procedures difficult. We thus decided to map the activation and stability of some commercial Rh precursors commonly used for hydroformylation catalysis using quantitative FlowNMR spectroscopy (Fig. 16).
Following the speciation of 1–4 under various activating conditions over time with quantitative 1H and 31P{1H} FlowNMR spectroscopy yielded insight into the effectiveness of the different precursors and activation protocols. All precursors except 2 reacted with PPh3 and syngas to give hydrido-phosphine complexes for hydroformylation catalysis (Fig. 17). Even after 12 hours with three equivalents of PPh3 under 10 bar H2/CO at 50 °C the tris-acac RhIII complex 2 had not formed any detectable Rh–P or Rh–H species, and the sharp 31P{1H} NMR peak of free PPh3 indicated no chemical exchange with the Rh centre (Fig. S21†), showing 2 to be an unsuitable precursor under these relatively mild reaction conditions.
The reaction of 1 with 12 equivalents of PPh3 (three per Rh atom) under Ar produced a mixture of the previously detected dimer U (Scheme 4) as well as the known Rh phosphine dimers R (37.5 ppm with 1JRh–P = 196 Hz) and S (17.2 ppm with 1JRh–P = 155 Hz) (Fig. S22†).9 All of these formed by PPh3/CO displacement and rearrangement, redox-neutral processes which are deemed fully reversible under the conditions applied (Scheme 4).
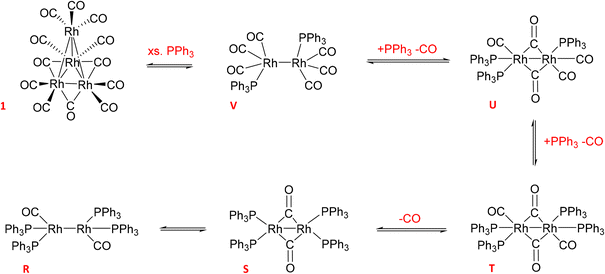 | ||
| Scheme 4 Equilibria of Rh0 dimer formation from [Rh4(CO)12] with PPh3 and CO in toluene (covalent Rh–Rh interactions render the d9 systems diamagnetic and thus NMR active). | ||
Adding 10 bar syngas to this mixture triggered the formation of A/B to up to 40% of all Rh in solution within 30 minutes at 50 °C, which were stable in toluene over >10 hours (Fig. 17). Venting the syngas at the end of the experiment showed traces of C/D and reformation of some dimer U in the mixture under Ar (Fig. S23–S27†). After re-pressurising the solution with 10 bar of CO C/D completely disappeared to only show A/B together with the carbonyl-rich dimers U and V (Fig. S24†), further evidencing their reversible interconversion (Scheme 4).
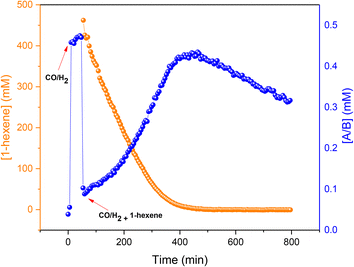
To assess the stability of the preformed hydrido complex C, it was pressurised with 10 bar 1:1 CO/H2 at 50 °C without additional PPh3. Notably, even before applying syngas only 70% of the nominal Rh loading was detected as C/D in toluene solution.‡ Immediately after adding 10 bar CO/H2 about 40% was transformed into A/B through PPh3 substitution by CO, and the mixture remained stable for at least one hour at 50 °C in toluene. Addition of 1-hexene and re-pressurisation with syngas gave rise to the hydroformylation activity expected under these conditions (Fig. 11) that saw A/B dropping sharply at the start of the catalysis and then building up again towards the end of the reaction (Fig. 18) after which it started decaying to dimers U and V.
This behaviour showed that starting with precursor C or even pre-activating it with syngas to A/B is not necessary, as the same reactivity may be obtained starting from 3 or 4 with added PPh3 (Fig. 8). On the contrary, the latter experiment even gave slightly higher rates (∼15%) than the former, probably due to some decomposition of C during the pre-activation process in the experiment shown in Fig. 18.
Additional evidence for the formation of inactive Rh-carbonyl clusters from A/B and/or C/D under CO-rich and substrate-lean conditions came from an experiment studying C under 10 bar of carbon monoxide. Immediately after pressurising with the solution with CO C completely disappeared from the 31P{1H} NMR spectra, but only 10% of the Rh used was detected as A/B (Fig. S28†) alongside traces of dimers U and V (Fig. S29 and S30†).
The reaction of the widely used precursor 3 with three equivalents of PPh3 under 10 bar of CO and H2 at 50 °C (our typical hydroformylation conditions) quickly yielded A/B in a maximum amount of 30% of all Rh added within 30 min (Fig. 17). As previously observed during catalysis, no C/D was detected under syngas due to the excess of CO present. In the absence of substrate, the amount of A/B formed from 3 under these conditions started to fall to reach 10% of all Rh after 12 hours, forming small amounts of dimer V by way of reductive coupling (Scheme 3). The up to 70% of undetected Rh presumably resided in 31P{1H} NMR-silent Rh-carbonyl clusters under these conditions (Fig. S32†). When the autoclave was vented at the end of the experiment and repressurised with 10 bar of H2 the tetra-phosphine dimer T was observed at the expense of the tris-phosphine dimer V, confirming their interconversion via PPh3/CO exchange (Fig. S33†). Although these H2-rich conditions did not lead to the reformation of A/B from the Rh0 dimers, the addition of 1-hexene followed by 10 bar of CO/H2 to this sample started hydroformylation catalysis with the disappearance of all dimeric species and formation of the acyl complex Q as observed previously (Fig. S34† and 11). However, although the reaction was 30% slower (Fig. S35†), this observation clearly establishes the reversibility of the formation of these Rh0 dimers, meaning that they too are at-cycle catalyst resting states that may liberate active species viaA/B under favourable conditions (Scheme 3). When the activation of 3 with three equivalents of PPh3 was followed under 10 bar of H2 the reaction proceeded more slowly to form the tris-phosphine hydrido complexes C/D up to a maximum of 55% of all Rh after 12 hours due to the absence of excess CO (Fig. S36 and S37†). Using two equivalents of PPh3 with 3 under 10 bar of H2 yielded a mixture of A/B and C/D that peaked at 20% of all Rh after 3.5 hours at 50 °C after which it decayed to <5% after 12 hours (Fig. S38†).
Following the activation of 3 under 10 bar of CO and H2 in the presence of various amounts of PPh3 (Fig. S39–S45†) showed a shift in Rh speciation similar to catalytic turnover conditions (Scheme 4): the less PPh3 was used the more dimer V was formed, with more PPh3 leading to a gradual shift to A/B and eventually some C/D (Fig. 19). With PPh3 loadings of <10 these pre-activated mixtures slowly decomposed to uncharacterised Rh-carbonyl clusters over the course of several hours at 50 °C, but using 20 or more equivalents of PPh3 yielded stable mixtures that did not deteriorate over at least 10 hours. Comparing the stability of A/B in the absence (Fig. 19) and presence (Fig. 15) of substrate showed hydroformylation catalysis to delay the decay by engaging more of the Rh in in-cycle species during turnover.
When the experiment was repeated under 5 bar of syngas A/B was observed to form together with several peaks due to decomposition (Fig. S50 and S51†) but different and less abundant than those seen under argon. Characteristic phosphorus resonances at 180 ppm correlating with hydride signals at −9.9 ppm (Fig. S52†) indicated the formation of Rh–PPh2–Rh hydrido clusters with different CO/PPh3 ratios than those formed in the absence of syngas. Repeating the experiment in the presence of a large excess of PPh3 (300 equivalents) showed no decomposition of C after heating to 90 °C (Fig. S53 and S54†), suggesting the decomposition to occur via dissociation of PPh3 and formation of tetracoordinated Rh complexes as those proposed to lead into the catalytic hydroformylation cycle.
3 Conclusion
The results of this investigation have extended the use of multi-nuclear high-resolution FlowNMR spectroscopy to quantify catalytic intermediates in systems that engage in multiple equilibria and where the chemical exchange between different species is fast. Being able to quantify catalytic intermediates during catalytic turnover (operando conditions) allows to map out catalyst speciation over a range of conditions which may be used to guide process development and upscaling with optimal use of the precious catalyst. Key to this was the ability to apply a controlled temperature gradient that slowed down the fast interconversion of catalytic reaction intermediates and thus facilitated their characterisation and quantification by FlowNMR spectroscopy due to refined coupling patterns and increased signal-to-noise without disrupting the catalytic cycle. In general terms, this work has shown that:a) intramolecular interconversion of stereoisomers does not affect NMR signal quantification;
b) intermolecular exchange between different species may impact observed T1 values and thus potentially affect NMR signal quantification;
c) lower temperatures give higher signal intensities as well as shorter T1;
d) with suitable acquisition parameters (accounting for the range of possible T1 values) and appropriate internal standards, absolute 31P NMR spectroscopic quantification of dynamic reaction intermediates is possible in continuous flow.
In the case of the Rh/PPh3 catalysed hydroformylation of 1-hexene, this approach has led to the successful investigation of the interconversion of [RhH(CO)(PPh3)3] (C), [RhH(CO)2(PPh3)2] (A/B), [Rh{CO(CH2)5(CH3)}(CO)3(PPh3)] (Q), [Rh2(CO)4(PPh3)4] (T), [Rh2(CO)5(PPh3)3] (U), [Rh2(CO)6(PPh3)2] (V), and [Rh2(CO)2(PPh3)] (R/S) during precursor activation and catalytic turnover to provide the following insights:
(i) the major Rh species in the presence of syngas and PPh3 is the bis-phosphine hydrido complex A/B which is in equilibrium with the tris-phosphine hydrido complex C;
(ii) both complexes are at-cycle resting states that liberate active Rh species into the catalytic cycle under turnover conditions, but both are prone to the formation of a series of Rh0 dimers R/S/T/U/V by reductive coupling (Schemes 2 and 3);
(iii) the formation of these dimers from the phosphine–hydrido RhI complexes is reversible but also connected to the reversible formation of higher nuclearity Rh0-carbonyl clusters such as [Rh4(CO)12] and [Rh6(CO)16] (Scheme 4) which are all off-cycle species that can make up to 90% of the Rh speciation under CO-rich conditions with low amounts of PPh3;
(iv) CO-lean conditions disfavour these off-cycle dimers and clusters to liberate more Rh into active states (such as mono-nuclear hydrido complexes), in line with the negative impact of CO on the reaction kinetics;
(v) with PPh3, ligand loadings of 3–6 equivalents provide the highest rates by balancing catalyst inhibition by CO and PPh3 saturation, respectively;
(vi) the monophosphine acyl complex Q observed with low amounts of PPh3 (<3 equivalents) is the only in-cycle catalytic intermediate detectable under turnover conditions by 1H and 31P NMR spectroscopy, suggesting the majority of product formation proceeds via mono-PPh3 species within the catalytic cycle;
(vii) [RhIII(acac)3] is an unsuitable precursor for hydroformylation catalysis with 10 bar syngas at 50 °C but RhI acac complexes activate quickly under these conditions so that no pre-activation is necessary;
(viii) irreversible catalyst deactivation proceeds via P–C bond cleavage in low-coordinate Rh–PPh3 complexes to irreversibly give carbonyl and hydrido Rh–PPh2–Rh species.
We hope the above findings will prove useful in the understanding and application of Rh/PR3 catalysed hydroformylation chemistry, and that the methods developed will help to unravel other dynamic catalytic systems in the future.
Conflicts of interest
RF is an employee of Evonik GmbH who operate industrial hydroformylation plants. The other authors declare no conflicts of interest.Acknowledgements
This work was supported by the Royal Society (UF160458; fellowship to UH), the EPSRC Dynamic Reaction Monitoring Facility at the University of Bath (EP/P001475/1), and the EPSRC Centre for Doctoral Training in Catalysis (EP/L016443; studentship to ABE).References
- H. Adkins and G. Krsek, J. Am. Chem. Soc., 1949, 71, 3051–3055 CrossRef CAS.
- O. Roelen, (Chemische Verwertungsgesellschaft Oberhausen m.b.H.) DE 849548, 1938 & 1952, US 2327066, 1943Chem. Abstr., 1944, 38, 3631 Search PubMed.
- L. A. van der Veen, P. C. J. Kamer and P. W. N. M. van Leeuwen, Organometallics, 1999, 18, 4765–4777 CrossRef CAS.
- Y. Yan, X. Zhang and X. Zhang, J. Am. Chem. Soc., 2006, 128, 16058–16061 CrossRef CAS.
- G. R. Stephenson, Organometallic chemistry: The transition elements, 1996 Search PubMed.
- R. Franke, D. Selent and A. Börner, Chem. Rev., 2012, 112, 5675–5732 CrossRef CAS PubMed.
- B. Cornils, Org. Process Res. Dev., 1998, 2, 121–127 CrossRef CAS.
- H.-W. Bohnen and B. Cornils, Adv. Catal., 2002, 47, 1–64 CAS.
- C. Bianchini, H. M. Lee, A. Meli and F. Vizza, Organometallics, 2000, 19, 849–853 CrossRef CAS.
- D. Evans, G. Yagupsky and G. Wilkinson, J. Chem. Soc. A, 1968, 2660–2665 RSC.
- K. Noack, Spectrochim. Acta, Part A, 1968, 24, 1917–1920 CrossRef CAS.
- W. R. Moser, C. J. Papile, D. A. Brannon, R. A. Duwell and S. J. Weininger, J. Mol. Catal., 1987, 41, 271–292 CrossRef CAS.
- R. B. King, A. D. King, M. Z. Iqbal and C. C. Frazier, J. Am. Chem. Soc., 1978, 100, 1687–1694 CrossRef CAS.
- C. Kubis, M. Sawall, A. Block, K. Neymeyr, R. Ludwig, A. Börner and D. Selent, Chem. – Eur. J., 2014, 20, 11921–11931 CrossRef CAS PubMed.
- R. Whyman, K. A. Hunt, R. W. Page and S. Rigby, J. Phys. E: Sci. Instrum., 1984, 17, 559–561 CrossRef CAS.
- I. T. Horváth, R. V. Kastrup, A. A. Oswald and E. J. Mozeleski, Catal. Lett., 1989, 2, 85–90 CrossRef.
- D. A. Foley, A. L. Dunn and M. T. Zell, Magn. Reson. Chem., 2016, 54, 451–456 CrossRef CAS PubMed.
- A. M. R. Hall, J. C. Chouler, A. Codina, P. T. Gierth, J. P. Lowe and U. Hintermair, Catal. Sci. Technol., 2016, 6, 8406–8417 RSC.
- A. Saib, A. Bara-Estaún, O. J. Harper, D. B. G. Berry, I. A. Thomlinson, R. Broomfield-Tagg, J. P. Lowe, C. L. Lyall and U. Hintermair, React. Chem. Eng., 2021, 6, 1548–1573 RSC.
- A. M. R. Hall, R. Broomfield-Tagg, M. Camilleri, D. R. Carbery, A. Codina, D. T. E. Whittaker, S. Coombes, J. P. Lowe and U. Hintermair, Chem. Commun., 2018, 54, 30–33 RSC.
- J. H. Vrijsen, I. A. Thomlinson, M. E. Levere, C. L. Lyall, M. G. Davidson, U. Hintermair and T. Junkers, Polym. Chem., 2020, 11, 3546–3550 RSC.
- A. M. R. Hall, P. Dong, A. Codina, J. P. Lowe and U. Hintermair, ACS Catal., 2019, 9, 2079–2090 CrossRef CAS.
- A. M. R. Hall, D. B. G. Berry, J. N. Crossley, A. Codina, I. Clegg, J. P. Lowe, A. Buchard and U. Hintermair, ACS Catal., 2021, 11, 13649–13659 CrossRef CAS PubMed.
- D. B. G. Berry, A. Codina, I. Clegg, C. L. Lyall, J. P. Lowe and U. Hintermair, Faraday Discuss., 2019, 220, 45–57 RSC.
- J. Y. Buser and A. D. McFarland, Chem. Commun., 2014, 50, 4234–4237 RSC.
- A. Martínez-Carrión, M. G. Howlett, C. Alamillo-Ferrer, A. D. Clayton, R. A. Bourne, A. Codina, A. Vidal-Ferran, R. W. Adams and J. Burés, Angew. Chem., Int. Ed., 2019, 58, 10189–10193 CrossRef PubMed.
- A. C. Brezny and C. R. Landis, ACS Catal., 2019, 9, 2501–2513 CrossRef CAS.
- A. Bara-Estaun, C. Lyall, J. P. Lowe, P. G. Pringle, P. C. J. Kamer, R. Franke and U. Hintermair, Faraday Discuss., 2021, 229, 422–442 RSC.
- U. Holzgrabe, I. Wawer and B. Diehl, NMR Spectroscopy in Pharmaceutical Analysis, Elsevier, 2008, pp. 43–62 Search PubMed.
- G. F. Pauli, B. U. Jaki and D. C. Lankin, J. Nat. Prod., 2005, 68, 133–149 CrossRef CAS PubMed.
- V. Rizzo and V. Pinciroli, J. Pharm. Biomed. Anal., 2005, 38, 851–857 CrossRef CAS PubMed.
- G. Helms, H. Dathe, N. Weiskopf and P. Dechent, Magn. Reson. Med., 2011, 66, 669–677 CrossRef PubMed.
- C. Di Carluccio, M. C. Forgione, S. Martini, F. Berti, A. Molinaro, R. Marchetti and A. Silipo, Carbohydr. Res., 2021, 503, 108313 CrossRef CAS PubMed.
- R. Wei, C. L. Dickson, D. Uhrín and G. C. Lloyd-Jones, J. Org. Chem., 2021, 86, 9023–9029 CrossRef CAS PubMed.
- D. Camuffo, Microclimate for Cultural Heritage, Elsevier, 3rd edn, 2019, pp. 61–71 Search PubMed.
- V. K. Srivastava, S. K. Sharma, R. S. Shukla, N. Subrahmanyam and R. V. Jasra, Ind. Eng. Chem. Res., 2005, 44, 1764–1771 CrossRef CAS.
- M. Findeisen, T. Brand and S. Berger, Magn. Reson. Chem., 2007, 45, 175–178 CrossRef CAS PubMed.
- A. S. C. Chan, H.-S. Shieh and J. R. Hill, J. Chem. Soc., Chem. Commun., 1983, 688–689 RSC.
- A. A. Dabbawala, R. V. Jasra and H. C. Bajaj, Catal. Commun., 2011, 12, 403–407 CrossRef CAS.
- B. E. Hanson and M. E. Davis, J. Chem. Educ., 1987, 64, 928 CrossRef CAS.
- F. H. Jardine, Polyhedron, 1982, 1, 569–605 CrossRef CAS.
Footnotes |
| † Electronic supplementary information (ESI) available. See DOI: https://doi.org/10.1039/d2cy00312k |
| ‡ Although supplied at a nominal purity of >97%, we always detected various amounts of PPh3 oxide and dimer R in toluene solutions of commercial C, even when handled under strict air-free conditions. Although not directly observed, we also suspect the presence of some PPh3-free Rh-carbonyl clusters in commercial samples of [RhH(CO)(PPh3)3]. |
| This journal is © The Royal Society of Chemistry 2022 |

