 Open Access Article
Creative Commons Attribution 3.0 Unported Licence
Partial reduction of NO to N2O on Cu{311}: role of intermediate N2O2†
Krit
Sitathani
,
Stephen J.
Jenkins
 and
Israel
Temprano
 *
*
Yusuf Hamied Department of Chemistry, University of Cambridge, Cambridge, UK. E-mail: it251@cam.ac.uk
First published on 14th March 2022
Abstract
We investigate the adsorption and reaction of NO on Cu{311} via a combination of reflection absorption infrared spectroscopy (RAIRS) and first-principles density functional theory (DFT), providing a mechanistic understanding of the reaction as it progresses. Our results support an interpretation that N2O is formed via an associative mechanism involving N2O2 as the crucial intermediate species. Consistent with previous work, we find that such an intermediate readily converts between its initial nitrogen-down configuration and an inverted oxygen-down configuration, prior to decomposition by cleavage of a single N–O bond. As the reaction proceeds, the surface is progressively poisoned by the accumulation of O adatoms resulting from N–O bond scission, and we probe this aspect of the reaction in detail as a function both of temperature and of the surface's pre-exposure to oxygen. Our results indicate that sustained conversion of NO to N2O on Cu would be contingent upon identifying some co-reactant capable of continuously removing O from the surface as the reaction proceeds.
Introduction
Amongst the most troublesome of atmospheric pollutants, one may certainly list the NOx gases – NO and NO2.1 Formed whenever combustion occurs within an oxygen/nitrogen-containing atmosphere or with nitrogen-containing fuels (such as biofuels), NOx gases are currently produced in copious quantities by everything from large-scale industrial processes, through automotive internal combustion engines, to domestic heating and cooking appliances, with high [NOx] being routinely found in large urban areas.2,3 Long-term exposure to NOx gases may result directly in the instigation or aggravation of respiratory conditions, while indirect effects may include enhanced formation of fine particulates and of ground-level ozone.4,5 Under the action of sunlight, NOx may result in the formation of smog, whilst combination of NO2 with atmospheric water vapour contributes to the phenomenon of acid rain.5 In light of all the above, reduction of NOx gases to N2 through catalytic means is generally seen as highly desirable.NOx reduction catalysts have been in widespread use since at least the 1970s, when the classic three-way catalysts were introduced within the automotive context.6,7 Whilst such a catalyst's platinum and palladium content served primarily to oxidise carbon monoxide and unburnt hydrocarbons, their rhodium content proved highly successful in the reduction of NOx to N2. The relatively high cost of rhodium, however, implies a driving force towards the development of cheaper alternatives.7–10 Further driving forces, and perhaps even more compelling ones, are that the exhaust streams of modern lean-burn engines typically constitute highly oxidising environments, whilst those of diesel engines attain significantly lower temperatures than those associated with typical gasoline engines.6 Both of these present challenges to the operation of traditional three-way catalysts and necessitate either cyclic control over exhaust conditions or the development of alternative catalytic strategies. Undoubtedly the most successful of these alternative strategies is embodied in selective catalytic reduction (SCR) by ammonia.11 In a commercial automotive SCR system, ammonia is generated in situ from decomposition of urea, and then reacts with NOx over an oxide or zeolite catalyst to form N2 and H2O.6,7,9,11 It remains true, however, that the need for a dissolved urea additive has limited the uptake of this technology in most automotive contexts. SCR is most commonly applied in static contexts (e.g. power plants) or in heavy goods and public transport vehicles (e.g. lorries, cargo ships, etc.).12
An additive-free approach has, in contrast, focussed upon the behaviour of NOx over coinage-metal catalysts, where partial reduction to N2O has been found to occur at very low temperatures (c.100 K).9,10,13–16 Now, to be clear, N2O as an end-product is not without its drawbacks, chief among which is its potency as a greenhouse gas, but it is indisputably less damaging to health and the environment than NOx when released in the lower atmosphere. It may also be possible to devise a secondary process whereby N2O may be fully reduced to N2, once the coinage-metal catalyst has done its job. For the moment, we focus on the crucial ability to achieve the initial reduction from NO to N2O. Although presently the low-temperature requirements of coinage-metal catalysts towards NOx reduction present a clear limitation for their commercial use, further understanding of their catalytic activity will be crucial to develop low-cost automotive systems. Surface science studies can advance this understanding by monitoring in situ the evolution of the catalytic system at early stages of the reaction.
An important clue as to the mechanism of this process may indeed be discerned in the fact that reduction over coinage metals not only occurs at low temperature but also ceases at higher temperature.8–10,14,17–21 All else being equal, one generally expects activated processes to proceed exponentially faster as the reaction temperature is increased, but the possibility of competitive side reactions may, in certain cases, complicate matters. Indeed, previous work on silver and copper substrates indicates a low-temperature regime, in which N2O is the dominant gaseous product of NO adsorption, contrasting with a high-temperature regime, in which NO2 is more prevalent.8,13 From a mechanistic perspective, it is generally believed that NO2 may be formed by the reaction of intact NO with surface O (the latter species derived from NO dissociation).6,10,13 On the other hand, N2O is thought to be generated via some kind of (NO)2 intermediate that partially dissociates almost immediately upon formation.13,22,23 The details of this latter pathway are not entirely clear, but it is evident that higher temperatures will disfavour the association of NO into the (NO)2 intermediate species, and hence will tend to favour the former pathway, in accordance with observations.13,22,24 This behaviour will, of course, also be strongly modified by the surface coverages of the involved species, which in turn will vary with time, temperature, and the partial pressure of these species in the gas phase.
Studies on single crystals have provided most of the evidence underlying these mechanisms, including a substantial body of work from King and co-workers on Ag{111}, Cu{100}, and Cu{110}.10,13,16,22,23,25Via a combination of reflection absorption infrared spectroscopy (RAIRS) and supersonic molecular beam mass spectrometry (SMB-MS) experiments, these investigators established the formation of an intermediate species, at temperatures in the vicinity of 100 K, identified as (NO)2 on the basis of absorption bands close to 1865 cm−1 and 1775 cm−1. Further bands in the range 1600–1625 cm−1 were interpreted as deriving from NO monomers. On Ag{111} and Cu{110} surfaces, adsorbed N2O was also identified, on the basis of an adsorption band close to 2225 cm−1, but it is presumed that most of this product species desorbs soon after formation on all three surfaces.10,13,16,22,23 In all cases, production of N2O gradually ceases as the experiment proceeds, due to poisoning of the surface by accumulated O adatoms.
First-principles density functional theory (DFT) calculations on Ag{111} subsequently showed that an intermediate of (NO)2 stoichiometry could be formed with a barrier of only 0.27 eV, lending credence to the basic thrust of the experimental interpretation.26 It ought to be noted, however, that the structure of this intermediate is very different from that of the gas-phase (NO)2 dimer that had previously been assumed as a reasonable description for the surface species. Specifically, the N–N bond length of the intermediate was considerably shorter than the corresponding separation of nitrogen atoms in the gas-phase dimer. Accordingly, it is probably rather more accurate to designate the surface intermediate as N2O2, rather than as (NO)2. Furthermore, recent RAIRS and scanning tunnelling microscopy (STM) experiments, performed by Shiotari et al.,24,27–29 suggest a key role for closely coadsorbed NO molecules that may map onto the weakly bound (NO)2 concept a little more closely than the N2O2 species predicted by theory.
In the present work, we aim to resolve the uncertainty regarding the true nature of the intermediate in N2O production – whether it is best described as N2O2, (NO)2, or simply as a pair of neighbouring NO monomers – in the light of new experimental and computational evidence gathered from the Cu{311} surface. As discussed in detail elsewhere, the {311} surfaces of face-centred cubic metals share structural similarities with the more frequently studied {110} surfaces, differing primarily in their lower symmetry (possessing just a single mirror plane, rather than two).30 We believe studies on this surface should prove complementary to work done on the Cu{110} surface, permitting the identification of common behaviours attributable to shared features (i.e. linear steps) whilst potentially allowing the emergence of detailed differences due to peculiarities of the surface structure (e.g. the differing registry between neighbouring steps on the two surfaces).
Methods
DFT calculations
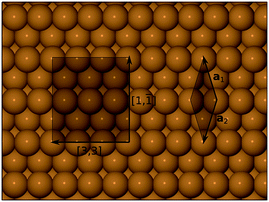
First-principles density functional theory (DFT) calculations reported in this work were carried out using the CASTEP computer code.31 Electronic wavefunctions were expanded in a plane wave basis set, up to a kinetic energy cutoff at 340 eV, and the Perdew–Burke–Ernzerhof (PBE) functional32 was adopted to describe exchange-correlation interactions. Electron–ion interactions were included through the use of ultrasoft pseudopotentials33 from the standard CASTEP library. The surface was modelled with a 12-layer slab, within a supercell of length equivalent to 22 layers in a <311> direction (ensuring a gap between adjacent slab images comfortably in excess of 10 Å). The lateral supercell dimensions were consistent with a (1, −1; 3, 3) cell (see Fig. 1) and the corresponding Brillouin zone was sampled on a 3 × 3 × 1 Monkhorst–Pack mesh.34 In geometry optimisation runs, the uppermost five layers of the slab were allowed to relax according to calculated forces, until tolerances of 10−5 eV and 0.02 eV A−1 were achieved for total energy and maximum forces respectively. Transition state searches were conducted using CASTEP's in-built LST/QST (linear and quadratic synchronous transit) algorithm, using the slightly looser tolerance of 0.05 eV A−1 for the calculated forces. Calculations were conducted in a spin-unrestricted manner, to allow for the possibility of spin-retention on the adsorbed molecules. Adsorption heats were computed with reference to separate calculations for the clean surface and an appropriate number of gas-phase molecules, all conducted according to the same parameters described above. We make no correction to our calculated adsorption heats in respect of zero-point energies, but estimate that they would increase the absolute values by no more than about 0.02 eV, whilst making a much smaller contribution to the relative stability of one adsorption geometry with respect to any other.After completing geometry optimisations, vibrational frequencies were calculated using the finite displacement method. In general, only the N and O atoms were permitted to move in these calculations, for reasons of computational efficiency. A small number of test calculations were conducted, however, in which the uppermost layer of Cu atoms was also mobile, but the resulting frequencies differed negligibly from the less intensive calculations. As is common with DFT calculations of vibrational frequencies, we found that our result for the N–O stretch mode of the NO molecule was an overestimate compared with the value found in the experimental literature (predominantly due to the absence of anharmonic effects in the finite displacement approach). We therefore applied a compensating scale factor of 0.933 to all N–O stretch modes (or linear combinations of the same) calculated for surface-adsorbed NO. Similarly, we found that a scale factor of 0.912 was necessary to match the highest-frequency calculated stretch mode of the gas-phase N2O molecule with that found in the experimental literature, and the same factor was therefore applied to similar modes in our surface calculations. Note that this mode may best be described as an out-of-phase combination of N–O and N–N stretches. For our surface calculations of the N2O2 molecule, which is not a stable entity in the gas phase, we applied a scale factor of 0.933 to the N–O stretch modes, which feature very little N–N stretch character. Unscaled frequencies for all modes are available in the ESI.† Statements regarding the activity or otherwise of specific modes in RAIRS experiments are made according to qualitative application of the usual surface selection rules (i.e. modes expected to have no surface-normal component to their dynamic dipole moment should be inactive) on the basis of observed symmetry.
RAIRS experiments
The UHV system used in this work has been fully described in our previous work,35–37 so here we describe the relevant sections only briefly. The system is divided into three different levels, each accommodating different components. The top level of the UHV chamber is where the system is connected to a Leybold Turbovac 151 turbomolecular pump, ionization gauge, and gas-dosing leak valve. The middle level contains a physical electronics sputter ion gun and an Ar leak valve, Edwards E603 diffusion pump, and a VG Scienta retractable rear-view LEED optics. The bottom level hosts ports connected to a Mattson RS2 IR spectrometer and a Hiden Hal 2 analytical mass spectrometer. Both leak valves are connected to a gas line, which is pumped by an Edwards E02 diffusion pump, backed by an Edwards E2M5 rotary pump. The position of the Cu{311} single crystal can be controlled by a manipulator that has movement along the x, y, and z Cartesian axis along with full 360° rotation around the z axis. The typical base pressure of the system is ∼2 × 10⁻¹¹ mbar.The Cu{311} single crystal sample used was provided by MaTecK GmBH, with a purity of 99.9999%, and dimensions of 15.00 mm × 10.00 mm × 1.00 mm, cut to an accuracy of <0.1° and polished to a roughness of <0.03 micron. The sample was mounted to the manipulator using 0.4 mm diameter Ta wires placed inside grooves on the top and bottom edges of the single crystal and secured in place by 0.125 mm diameter Ta wires tied through holes bored at the corners. The crystal temperature was measured and controlled by a Eurotherm PID controller, using a K-type thermocouple. The combination of an N2-filled shaft and resistive heating from the Ta wires allowed a very accurate temperature control of the sample between 95 and 900 K. The Cu{311} surfaces were prepared in UHV by cycles of Ar+ ion bombardment (typically 1 kV) and annealing (typically 900 K), until a sharp (1 × 1) LEED pattern was obtained. Auger electron spectroscopy (AES) was also used to monitor the chemical purity of the sample prior to NO dosing.
Exposure to NO was performed with the single crystal held at the specified temperature while NO dosing at a pressure of ∼6 × 10⁻¹⁰ mbar. The purity of NO was monitored by a quadrupole mass spectrometer, and exposure values in Langmuir units (1 L = 10−6 Torr s) were calculated from the overall pressure rise. RAIR spectra were acquired with a Mattson RS2 Fourier transform infrared (FTIR) spectrometer and external mercury cadmium telluride (MCT) detector, capable of detecting frequencies in the range 4000–570 cm−1. The incident and reflected infrared beams were transmitted in and out of UHV via KBr viewports, and the beam paths linking the UHV chamber to the spectrometer and detector were purged with dry N2(g). Each spectrum shown was obtained by averaging 400 individual spectra, each recorded at a resolution of 4 cm−1, and dividing by a similarly averaged background spectrum previously obtained from the clean surface.
Results
Coverage dependent NO adsorption on pristine Cu{311}
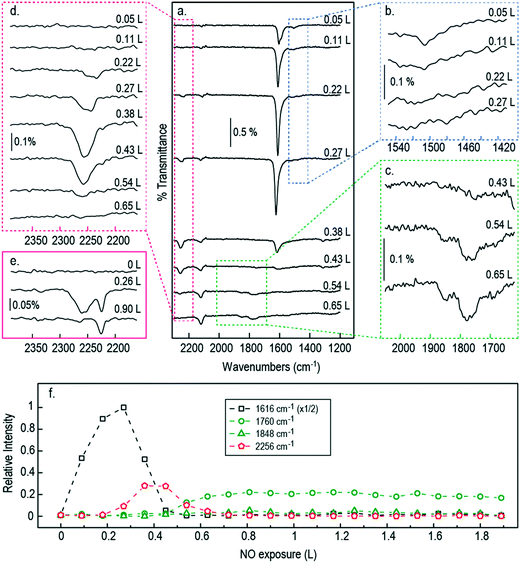
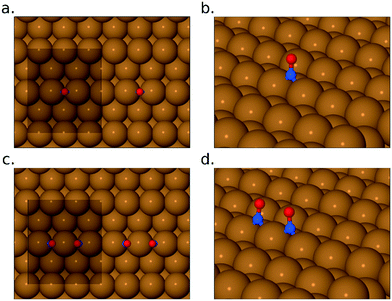
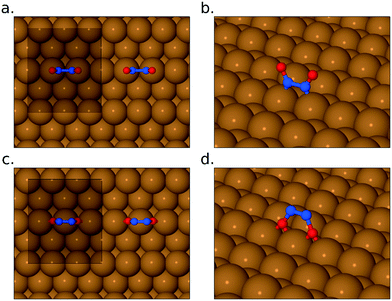
Fig. 2 shows RAIR spectra obtained at sequential NO exposure from an initially clean Cu{311} surface at 100 K. Initial exposure (0.05 L) reveals a strong double-peaked feature at 1606/1624 cm−1 in addition to a much less intense adsorption peak at 1508 cm−1. As exposure increases through 0.11 L to 0.22 L, the higher frequency feature strengthens and coalesces into a single asymmetric peak, while the lower frequency mode vanishes into the background. A small peak at around 2120 cm−1 corresponds to the gradual accumulation of CO on the surface, due to residual gas in the chamber, and will not be mentioned again; we estimate that the CO coverage never exceeds 0.12 ML (see ESI†).The higher frequency NO-related band is similar to a feature previously assigned by Brown et al.13 to the N–O stretch modes of individual NO monomers in studies on the Cu{110} surface (with the double peak implying adsorption at two different sites: bridge and atop). As mentioned above, however, a more recent study by Shiotari et al.24 has suggested that this feature in fact relates to closely coadsorbed NO species, based upon comparison between RAIRS and STM data (again on the Cu{110} surface). They argue that a small feature at 1515 cm−1 represents truly isolated NO monomers, noting that it is present only at the lowest exposures and disappears as the higher-frequency mode grows.24 To shed light on this, we have performed DFT calculations, on the Cu{311} surface, for adsorbed NO at 1/6 ML coverage (approximating isolated monomers) and for NO monomers adsorbed in adjacent sites (at a coverage of 1/3 ML) as shown in Fig. 3. In each case, our results indicate that adsorption in the bridge site is considerably more favourable than in the atop site, and in both cases the molecule adopts a near-upright geometry. We find that the bridge-site adsorption heat increases very slightly, from 1.46 eV to 1.52 eV per monomer, in going from isolated adsorption to the closely coadsorbed structure. Hirshfeld analysis38 indicates the retention of a net spin of 0.27 μB on the isolated NO monomer (cf. 1 μB on the gas-phase monomer) but negligible spin on the closely coadsorbed monomers, indicating a non-trivial degree of interaction even if the overall effect on the adsorption energy is small. Furthermore, the scaled N–O stretch frequencies are calculated to be 1547 cm−1 for the isolated monomers, and 1615 cm−1 for the surface-active (i.e. in-phase) mode of the closely coadsorbed monomers; the corresponding out-of-phase mode, calculated at 1553 cm−1, would not be experimentally observable due to the RAIRS surface selection rule. These results would seem most consistent with the scenario that the lower frequency RAIRS feature, seen clearly only in the lowest exposure spectrum, does indeed indicate the existence of isolated monomers, as argued by Shiotari et al.24 This feature disappears at higher exposure, not only because higher coverage reduces the distance that a monomer must diffuse in order to find a partner, but also because the average monomer has been on the surface for sufficient time to diffuse the necessary distance. We conclude that the double-peaked structure of the higher frequency mode is more likely to imply different local arrangements of closely coadsorbed NO (e.g. within islands versus at the edge of islands) than different types of adsorption site (atop sites having adsorption heats no higher than 1.07 eV per NO monomer in our calculations).
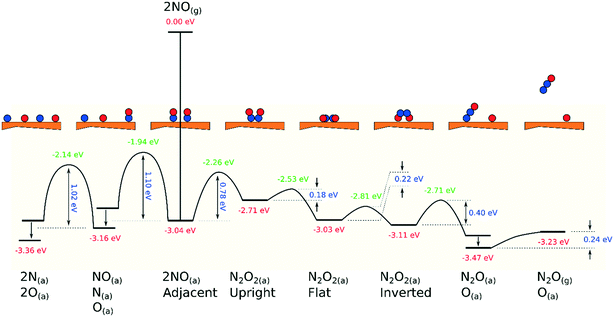
We note, in passing, that our calculations also reveal a pair of metastable geometries for isolated NO monomers, with energies intermediate between those of the bridge and atop structures. Both are highly tilted and involve bonding to the surface not only through the molecule's nitrogen atom (residing in a threefold site) and but also through its oxygen atom (residing in either a near-atop site or a near-bridge site). In each case, the N–O bond is significantly stretched, attaining a length of 1.28 Å (and an adsorption energy of 1.21 eV) when the oxygen atom lies in the near-atop site, and 1.37 Å (and an adsorption energy of 1.19 eV) when it lies in the near-bridge site (cf. the N–O bonds lengths of 1.21 Å and 1.22 Å that we find when the molecule adsorbs essentially upright in the atop and bridge sites respectively). We have searched for transition states that link these geometries to fully dissociated geometries (with the nitrogen atom ending in a threefold site, and the oxygen atom ending in a fourfold site) but found none that corresponded to activation barriers less than 1.00 eV relative to the energy of an isolated upright NO molecule in the bridge site. We therefore conclude that direct dissociation of NO ought not to be a significant process on the Cu{311} surface at the temperatures considered in the current work.
As the exposure increases beyond 0.22 L, new absorption bands appear in our RAIR spectra at frequencies well above the gas-phase stretch mode of NO. At an exposure of 0.26 L, we find a clear double-peaked feature at 2226/2262 cm−1, but only the lower frequency peak survives as the exposure increases further. Brown et al.13 have interpreted a similar feature (starting as a double peak, but then losing the higher frequency branch) as indicating adsorbed N2O on the Cu{110} surface. Our DFT calculations for N2O bound to the Cu{311} surface through its oxygen atom reveal an adsorption heat of just 0.04 eV per molecule, with a scaled out-of-phase N–N/N–O stretch frequency of 2210 cm−1 (Fig. 4a). With the molecule binding through its terminal nitrogen atom, on the other hand, we calculate a binding energy of 0.25 eV, and a scaled out-of-phase N–N/N–O stretch frequency of 2209 cm−1 (Fig. 4b). We therefore partially concur with Brown et al.13 over the interpretation of this portion of the RAIR spectrum, at least one component of which probably derives from weakly bound N2O. The origin of the higher frequency component of the double-peaked structure remains, however, a mystery.
Now, although our spectra clearly indicate the presence of N2O on the surface, resulting from the reaction of adsorbed NO, they do not preclude the likelihood that some quantity of N2O may also desorb from the surface during the course of the experiment. Our own data does not allow us to draw any definitive conclusion on this point, but it is noteworthy that SMB-MS experiments reported by Brown et al.13 on the Cu{110} surface confirm N2O desorption even at the lowest exposure to NO. We therefore expect that N2O is evolved from the very start of our own experiments, leading to a gradual build-up of adsorbed O adatoms as a by-product. We might indeed have suggested that the presence of a non-negligible coverage of O adatoms begins to stabilise surface N2O at exposures beyond 0.22 L, but our DFT calculations provide no support for this view. In fact, our calculations for N2O closely coadsorbed with an O adatom show an adsorption heat of 0.04 eV and a scaled out-of-phase N–N/N–O stretch frequency of 2218 cm−1, when binding through the molecule's oxygen atom (Fig. 4c), whereas they show an adsorption heat of 0.24 eV, with a scaled out-of-phase N–N/N–O stretch frequency of 2217 cm−1, when binding through its terminal nitrogen atom (Fig. 4d). In other words, the presence of a nearby O adatom hardly affects the binding of N2O at all, and, if anything, very slightly weakens it. The enhanced surface population of N2O must, therefore, presumably reflect an increased rate of production, substantially greater than any increased rate of desorption.
Strikingly, the chemistry of the surface changes dramatically at exposures beyond 0.27 L, most notably in the sudden drop in intensity of the NO band just above 1600 cm−1. A similar disappearance was noted by Brown et al.13 on the Cu{110} surface, attributed to site-blocking by O adatoms left over from the formation of N2O. This does, indeed, seem to be a reasonable supposition, which we expect carries over to the Cu{311} surface studied here. In the high-exposure limit, therefore, we find that all trace of adsorbed NO monomers has vanished beyond 0.43 L, while even the presence of adsorbed N2O vanishes at exposures above around 0.54 L. We do, however, observe very weak peaks around 1760 cm−1 and 1848 cm−1, respectively consistent with the symmetric and antisymmetric stretch modes of the gas-phase (NO)2 dimer. Brown et al.13 surmise that it is this dimer species that is the key intermediate in the formation of N2O. However, given the proximity of the vibrational frequency to the gas-phase species it seems to us unlikely that such a weakly bound physisorbed species would be sufficiently modified by its proximity to the surface as to facilitate a (NO)2 → N2O reaction, which simply does not occur in the gas phase at this temperature. We therefore postulate that the (NO)2 dimer is a by-product, rather than an intermediate. Identification of the true intermediate species is, nevertheless, critical to the elucidation of possible mechanistic paths to the formation of N2O and so we turn our attention to the determination of energetically plausible intermediate species for this reaction.
As mentioned above, previous DFT calculations of NO adsorption on Ag{111}, by Liu et al.26 outlined a possible reaction mechanism in which NO monomers first formed an intermediate N2O2 species, distinguished from the gas-phase (NO)2 dimer in having a much shorter N–N bond length. Crucially, this intermediate was found to be roughly equally stable when bonded to the surface via either its nitrogen atoms or its oxygen atoms, with a negligible activation barrier for flipping between the two states. Moreover, in its “inverted” state (i.e. bonding to the surface via its oxygen atoms) the activation barrier for the N2O2 → O + N2O reaction was also found to be rather small, and thus a very low energy pathway from NO monomers to weakly bound N2O could be completed. In the present case, we might reasonably ask firstly whether a similar pathway seems energetically reasonable on Cu{311}, and secondly whether we ought to expect any corresponding vibrational evidence in our RAIR spectra.
To address these questions via DFT, we first sought to find stable adsorption geometries for the N2O2 species (all of which turn out to have negligible spin, although we did not presuppose this). In the “upright” configuration (i.e. bonding to the surface via its nitrogen atoms) we were able to find one stable geometry, with nitrogen atoms close to atop sites, and with an adsorption heat equivalent to 1.35 eV per NO monomer and a surface-active (i.e. in-phase) scaled N–O stretch frequency of 1432 cm−1 (Fig. 5a and b). If such a species were present as a long-lived intermediate, therefore, one ought to expect to see a corresponding peak in the RAIR spectra, but the relatively high energy of the state suggests that it would not be long-lived and its absence from our experimental spectra is not surprising. In the “inverted” configuration, two stable geometries were found with oxygen atoms either close to atop sites (adsorption heat of 1.22 eV per NO monomer) or close to bridge sites (adsorption heat of 1.56 eV per NO monomer). The first of these is, again, unlikely to be a long-lived intermediate, but the second (Fig. 5c and d) is actually the most stable geometry that we have found for any combination of two N and two O atoms on this surface. The highest-frequency surface-active mode (the in-phase N–O stretch) calculated with the bridge-site inverted N2O2 molecule is found at just 823 cm−1 (scaled) which is outside the reliable range for our experimental spectra (swamped with noise below about 900 cm−1). The absence of a distinct RAIRS feature corresponding to this species is thus not an indication that the species is absent from the surface. It is worth noting, by the way, that in both the upright (i.e. nitrogen-down) and inverted (i.e. oxygen-down) orientation, this species differs markedly from the gas-phase (NO)2 dimer. In the upright geometry, our calculated N–N bond length is 1.43 Å, and in the inverted geometry it is just 1.27 Å, while the corresponding distance in the gas-phase dimer is typically thought to exceed 2 Å.
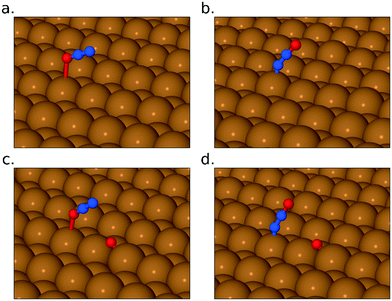
Turning to the pathway by which NO monomers may transform into the bridge-site inverted N2O2 molecule, we have considered four possible intermediates, in which the N2O2 molecule lies flat across the gap between neighbouring close-packed rows of the Cu{311} surface (see Fig. 6). In two cases (Fig. 6a and b) both exhibiting adsorption energies of 1.32 eV per NO monomer, the molecule's oxygen atoms lie closest to atop sites. In two other cases (Fig. 6c and d) both exhibiting adsorption energies of 1.52 eV per NO monomer, its oxygen atoms lie closest to bridge sites. There are thus two particularly stable potential intermediates that differ structurally (but hardly energetically) only in whether the molecule's nitrogen atoms lie over {111} or {100} microfacets of the surface. The two slightly less stable potential intermediates differ from one another in precisely the same sense. It appears that the less stable cases are only very shallow energy minima, which might possibly even be transition states between the more stable cases. Note that none of these flat-lying configurations are likely to contribute to the RAIR spectra, partly because they are likely to be only very short-lived intermediates with correspondingly low surface coverage, but also because their stretch modes are predominantly oriented parallel to the surface and hence will have minimal cross-section in surface infrared experiments.
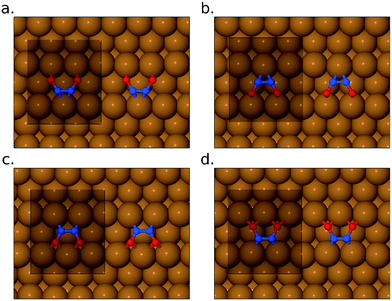 | ||
| Fig. 6 Panels (a)–(d) show four different flat-lying conformations for the surface-bound N2O2 species. In all cases, the unit cell used in the calculations is shown for reference. | ||
We have performed a transition state search to link the structure from Fig. 6c to the bridge-site inverted N2O2 molecule, obtaining an activation barrier of only 0.22 eV. More troublesome, however, is determining the minimum-energy pathway that might link the same intermediate to the geometry featuring two closely coadsorbed monomers. We favour a route that passes first from the closely coadsorbed monomer state to the N2O2 state depicted in Fig. 5a and b, and then in a second step to the structure depicted in Fig. 6c. The first of these two steps we calculated to involve an activation barrier amounting to 0.78 eV, while the second involves a barrier of just 0.18 eV. It must be remarked, however, that the first of these barriers is relatively high, given our expectation that the reaction should proceed at temperatures in the vicinity of 100 K. By way of contrast, in the recent work of Kuroishi et al.29 on the Cu{100} surface, a barrier of just 0.21 eV was calculated for a similar stage in their proposed pathway. Crucially, the route proposed here is nevertheless more kinetically favourable than the direct dissociation of NO. Assuming that the bridge-site inverted geometry can be achieved, the final steps to formation of N2O are straightforward. A transition state for cleavage of a single N–O bond has been located, associated with an activation energy of 0.40 eV, and the binding energy of N2O closely coadsorbed with O is (as mentioned above) just 0.04 eV when binding through its oxygen atom, or 0.24 eV when binding through its terminal nitrogen atom.
Our calculated potential energy landscape for dissociative and associative reactions of NO on Cu{311} is presented in Fig. 7, illustrating clearly that the associative route is indeed likely to be dominant. Dissociation requires the system to surmount activation barriers in excess of 1.00 eV, whereas the rate-determining step for the associative route (the initial formation of N2O2) involves a substantially smaller activation barrier of 0.78 eV. Subsequent steps, culminating in the formation of adsorbed N2O, are all downhill in energy, with considerably smaller activation barriers, and the final desorption of N2O will be trivially facile even at cryogenic temperatures.
NO exposure as a function of temperature and oxygen pre-coverage
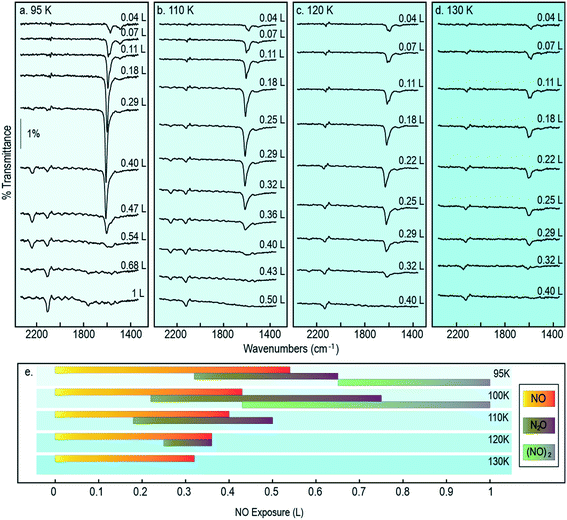
It is reasonable to anticipate that the experimental results reported above may vary as a function of temperature, in part because monomer diffusion rates may be expected to increase at higher temperatures, but also because passage across activation barriers will be exponentially enhanced. Accordingly, we collected exposure-dependant RAIR spectra at a series of temperatures between 95 K (the lowest sample temperature attainable in our apparatus) and 150 K (95–130 K shown in Fig. 8). Adopting the same band assignments used above for interpretation of the 100 K results, we may summarise (Fig. 8) the exposure regimes within which we observe NO monomers, N2O molecules, and (NO)2 dimers.When Cu{311} is exposed to NO while held at a temperature of 95 K, the N–O stretching vibration corresponding to closely coadsorbed NO monomer species grows from low exposure up to around 0.3 L, when it reaches a maximum in intensity, and vanishes at roughly 0.6 L. The NO stretch bands observed at low coverage appear sharper at 95 K than at 100 K, with the 1508 cm−1 feature (assigned to the N–O stretching of isolated monomers present at the initial stages of adsorption) being considerably more clearly defined and intense. Equally, the peak at 1624 cm−1 assigned to NO molecules adsorbed on atop sites develops to further extent and to higher exposure. This latter feature also appears when exposing the Cu{311} crystal to NO at temperatures up to 130 K although with increasingly reduced intensity, indicating that although NO initially adsorbs molecularly on this surface, the lifetime of the undissociated species decreases sharply with temperature as shown in Fig. 8e.
The N–N stretching mode of N2O species appears at coverages at which the N–O stretching mode of monomer species are still present, for all temperatures in the range 95–120 K. The co-existence of features characteristic of both species suggest that, under these conditions, the NO reactivity on Cu{311} is sufficient to undergo this transformation, but at a rate sufficiently limited that freshly adsorbed NO has sufficient lifetime to be detected. This indicates that the diffusion of NO species may be the limiting factor for the reaction of two NO molecules to form N2O + O. As can be observed in Fig. 8e, the presence of N2O species appears at progressively lower exposure with increasing temperature. Supporting this is also the observation that the span of exposures at which N2O species are observed increases over the temperature range from 95 to 100 K, but then decreases sharply as the temperature increases to 110 K and then 120 K, being completely absent at any coverage at higher temperatures. This fact indicates that as temperatures increase, the reaction of two NO species to form N2O + O is facilitated by an increased mobility of NO species.
It is also noteworthy that the presence of N2O species spans a wider range of exposures at 100 K than at 95 K. As a result, at 100 K we uniquely observe the co-existence of N2O and (NO)2 species, indicating that the rate of formation of N2O species is increased to a larger extent than the subsequent decomposition of N2O. At temperatures above 100 K the range of exposures over which N2O is detected by RAIRS becomes progressively shorter, until it is no longer detected at all for temperatures of 120 K and above. The presence of (NO)2 dimer species, on the other hand, is not detected at temperatures above 100 K.
In broad terms, the range of exposure over which NO monomers are stable gradually reduces as the temperature is increased, as shown in Fig. 8, consistent with the notion that consumption of this species (to form N2O) is an activated process. Moreover, the range of exposure over which N2O is observed on the surface expands somewhat over the temperature range from 95 K to 100 K, but narrows again at higher temperature. In addition, we note that (NO)2 dimers are stable on the surface only in the 95 K and 100 K experiments, consistent with this being a physisorbed species.
In order to investigate whether the build-up of O adatoms on the surface strongly affects the surface chemistry, either by blocking NO monomer adsorption or by hindering N2O desorption, we conducted further experiments in which oxygen was deliberately pre-adsorbed on the surface prior to NO exposure. A full description of oxygen adsorption on Cu{311} will be the subject of another article, but for the moment we simply mention that a sharp LEED pattern consistent with a missing-row reconstruction of the underlying metal may be formed upon oxygen adsorption at room temperature, and that this corresponds to an O adatom coverage of 0.5 ML (see Supporting Material). Upon exposure of this surface to NO at 100 K (Fig. 9) we observe no evidence of the monomeric species whatsoever, suggesting that site-blocking is probably significant, and that any molecules that do adsorb must have a rather short lifetime. We do, however, see tenuous RAIRS bands consistent with adsorbed N2O, between 0.22 L and 0.36 L exposures, with evidence of (NO)2 dimers present beyond 0.25 L. In effect, the behaviour mimics the later stages of experiments performed without oxygen pre-coverage, supporting the view that changes in the surface chemistry are largely driven by whatever coverage of O adatoms has already accumulated at any given moment. When oxygen is pre-dosed even a little beyond the nominal 0.5 ML coverage (i.e. when the missing-row LEED pattern has come and gone during room-temperature dosing) we find no evidence for any surface species at all during subsequent low-temperature NO exposure. We therefore surmise that the coverage of O adatoms responsible for shutting down reactivity on the Cu{311} surface is just a little higher than 0.5 ML. If catalytic conversion of NO to N2O were ever to be sustained, it would be necessary to maintain oxygen coverage below this level, perhaps by the introduction of a suitable reductant. We note, for example, work from Afsin et al., suggesting that isolated chemisorbed oxygen can be removed from Cu{110} by ammonia, albeit oxygen incorporated into a surface oxide cannot.39
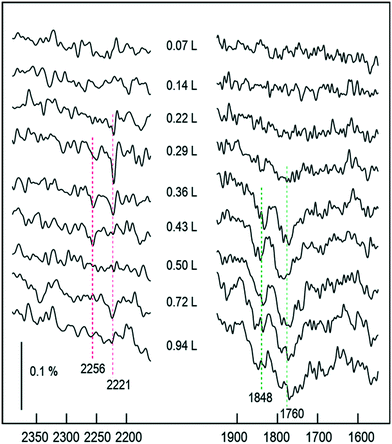 | ||
| Fig. 9 RAIR spectra following the adsorption of NO onto an O–Cu{311} single crystal (oxygen coverage ∼0.5 ML). | ||
Conclusions
Invoking our combined RAIRS and DFT results, we argue that the low-temperature formation of N2O from NO on the Cu{311} surface proceeds via an associative mechanism. In common with similar reactions on Ag{111} and Cu{100} (and probably also Cu{110}) we believe that NO molecules first pair up to create an intermediate N2O2 species, which binds to the surface initially through its nitrogen atoms but may readily flip over into a more stable configuration in which it is bound via its oxygen atoms. This inverted state seems to be key to formation of adsorbed N2O, achieved through the scission of a single N–O bond. The resulting N2O molecule is bound only very weakly to the surface, desorbing easily at temperatures in the vicinity of 100 K to leave a strongly adsorbed O adatom behind.In the early stages of sequential NO exposure at 100 K, the associative reaction is limited by the pairing up of NO molecules, while in the later stages the blocking of surface sites by O adatoms eventually curtails the reaction altogether (as can be replicated by pre-adsorption of oxygen). Between these extremes, there exists an exposure range within which NO, N2O, and (NO)2 coexist, the latter species being a physisorbed byproduct circumstantial to the main reaction. Under conditions of continuous exposure, therefore, it would be possible to maintain conversion of NO to N2O only if a suitable co-reactant could be found to sequester the blocking adatoms from the surface. Furthermore, we note that the coexistence of NO, N2O, and (NO)2 is not observed at 95 K, where formation of the latter two species is delayed until higher exposure, presumably due to lower surface mobility of the NO monomers. At higher temperatures, the physisorbed (NO)2 species is not observed at all, while the exposure range over which N2O may be found on the surface is progressively reduced until it vanishes in the data taken at 130 K. This does not, however, preclude the possibility that N2O may nevertheless be produced at higher temperatures, but must at least imply that the surface lifetime of any such species must be very short. Indeed, one should note that the coverage of NO declines to zero at progressively lower exposure as the temperature increases, suggesting that O adatoms are produced (presumably alongside N2O molecules) at a greater rate when more thermal energy is available.
Finally, our results underline the exceptionally fine balance between coverage, mobility, and site-blocking that governs the associative reaction of NO on coinage metal surfaces. Maintaining this balance at the “sweet spot” for optimum conversion of NO to N2O requires the achievement of fine control through the relatively blunt instruments of temperature and partial pressure. Even so, it may also be necessary to introduce additional species, or to cycle the operating conditions, if catalyst poisoning is to be avoided. We remain convinced, however, that high quality experimental and computational data may yet provide the necessary information that will unlock practical exploitation of this very interesting and unusual reaction mechanism.
Conflicts of interest
There are no conflicts to declare.References
- O. R. Inderwildi and D. A. King, Quo vadis biofuels?, Energy Environ. Sci., 2009, 2(4), 343–346 RSC.
- B. N. Duncan, et al., A space-based, high-resolution view of notable changes in urban NOx pollution around the world (2005–2014), J. Geophys. Res.: Atmos., 2016, 121(2), 976–996 CrossRef CAS.
- J. Pérez-Ramĭrez, et al., Formation and control of N2O in nitric acid production: Where do we stand today?, Appl. Catal., B, 2003, 44(2), 117–151 CrossRef.
- B. N. Duncan, et al., Application of OMI observations to a space-based indicator of NOx and VOC controls on surface ozone formation, Atmos. Environ., 2010, 44(18), 2213–2223 CrossRef CAS.
- T. Boningari and P. G. Smirniotis, Impact of nitrogen oxides on the environment and human health: Mn-based materials for the NOx abatement, Curr. Opin. Chem. Eng., 2016, 13, 133–141 CrossRef.
- M. J. Heimrich, Diesel NOx Catalytic Converter Development: A Review, J. Eng. Gas Turbines Power, 1996, 118(3), 668–672 CrossRef CAS.
- H. S. Gandhi, G. W. Graham and R. W. McCabe, Automotive exhaust catalysis, J. Catal., 2003, 216(1), 433–442 CrossRef CAS.
- X. Cheng and X. T. Bi, A review of recent advances in selective catalytic NOx reduction reactor technologies, Particuology, 2014, 16, 1–18 CrossRef CAS.
- S. Sato, et al., Cu-ZSM-5 zeolite as highly active catalyst for removal of nitrogen monoxide from emission of diesel engines, Appl. Catal., 1991, 70(1), L1–L5 CrossRef CAS.
- W. A. Brown and D. A. King, NO Chemisorption and Reactions on Metal Surfaces: A New Perspective, J. Phys. Chem. B, 2000, 104(12), 2578–2595 CrossRef CAS.
- M. Börnhorst and O. Deutschmann, Advances and challenges of ammonia delivery by urea-water sprays in SCR systems, Prog. Energy Combust. Sci., 2021, 87, 100949 CrossRef.
- G. Zhang, et al., Relation analysis on emission control and economic cost of SCR system for marine diesels, Sci. Total Environ., 2021, 788, 147856 CrossRef CAS PubMed.
- W. A. Brown, et al., Adsorption and Reactivity of NO and N2O on Cu{110}: A Combined RAIRS and Molecular Beam Studies, J. Phys. Chem., 1996, 100(30), 12559–12568 CrossRef.
- Y. Song and L. C. Grabow, Activity Trends for Catalytic CO and NO Co-Oxidation at Low Temperature Diesel Emission Conditions, Ind. Eng. Chem. Res., 2018, 57(38), 12715–12725 CrossRef CAS.
- N. G. Rey and H. Arnolds, Hot hole-induced dissociation of NO dimers on a copper surface, J. Chem. Phys., 2011, 135(22), 224708 CrossRef PubMed.
- W. A. Brown, R. K. Sharma and D. A. King, Site Switching and Surface Restructuring Induced by NO Adsorption on Pt{110}, J. Phys. Chem. B, 1998, 102(27), 5303–5308 CrossRef CAS.
- V. A. Kondratenko and M. Baerns, Mechanistic insights into the formation of N2O and N2 in NO reduction by NH3 over a polycrystalline platinum catalyst, Appl. Catal., B, 2007, 70(1), 111–118 CrossRef CAS.
- R. Burch, S. T. Daniells and P. Hu, The mechanism of N2O formation via the (NO)2 dimer: A density functional theory study, J. Chem. Phys., 2004, 121(6), 2737–2745 CrossRef CAS PubMed.
- A. Bogicevic and K. C. Hass, NO pairing and transformation to N2O on Cu(111) and Pt(111) from first principles, Surf. Sci., 2002, 506(1), L237–L242 CrossRef CAS.
- M. W. Roberts, The Formation of N2O During the Chemisorptions of Nitric Oxide at Platinum Surfaces at Low Temperature: A Comment on the Mechanism, Catal. Lett., 2004, 93(1), 29–30 CrossRef CAS.
- R. Burch, S. T. Daniells and P. Hu, N2O and NO2 formation on Pt(111): A density functional theory study, J. Chem. Phys., 2002, 117(6), 2902–2908 CrossRef CAS.
- W. A. Brown, P. Gardner and D. A. King, Very Low Temperature Surface Reaction: N2O Formation from NO Dimers at 70 to 90 K on Ag{111}, J. Phys. Chem., 1995, 99(18), 7065–7074 CrossRef CAS.
- W. A. Brown, et al., Characterization and orientation of adsorbed NO dimers on Ag{111} at low temperatures, J. Chem. Phys., 1995, 102(18), 7277–7280 CrossRef CAS.
- A. Shiotari, et al., Configuration change of NO on Cu(110) as a function of temperature, J. Chem. Phys., 2014, 140(21), 214706 CrossRef CAS PubMed.
- C. M. Kim, C. W. Yi and D. W. Goodman, Adsorption and Reaction of NO on Cu(100): An Infrared Reflection Absorption Spectroscopic Study at 25 K, J. Phys. Chem. B, 2002, 106(28), 7065–7068 CrossRef CAS.
- Z.-P. Liu, S. J. Jenkins and D. A. King, Why Is Silver Catalytically Active for NO Reduction? A Unique Pathway via an Inverted (NO)2 Dimer, J. Am. Chem. Soc., 2004, 126(23), 7336–7340 CrossRef CAS PubMed.
- A. Shiotari, et al., Imaging Covalent Bonding between Two NO Molecules on Cu(110), Phys. Rev. Lett., 2011, 106(15), 156104 CrossRef CAS PubMed.
- A. Shiotari, T. Odani and Y. Sugimoto, Torque-Induced Change in Configuration of a Single NO Molecule on Cu(110), Phys. Rev. Lett., 2018, 121(11), 116101 CrossRef CAS PubMed.
- K. Kuroishi, et al., A flat-lying dimer as a key intermediate in NO reduction on Cu(100), Phys. Chem. Chem. Phys., 2021, 23(31), 16880–16887 RSC.
- S. J. Jenkins and S. J. Pratt, Beyond the surface atlas: A roadmap and gazetteer for surface symmetry and structure, Surf. Sci. Rep., 2007, 62(10), 373–429 CrossRef CAS.
- S. J. Clark, et al., First principles methods using CASTEP, Z. Kristallogr., 2005, 220(5–6), 567–570 CAS.
- J. P. Perdew, K. Burke and M. Ernzerhof, Generalized Gradient Approximation Made Simple, Phys. Rev. Lett., 1996, 77(18), 3865–3868 CrossRef CAS PubMed.
- D. Vanderbilt, Soft self-consistent pseudopotentials in a generalized eigenvalue formalism, Phys. Rev. B: Condens. Matter Mater. Phys., 1990, 41(11), 7892–7895 CrossRef PubMed.
- H. J. Monkhorst and J. D. Pack, Special points for Brillouin-zone integrations, Phys. Rev. B: Solid State, 1976, 13(12), 5188–5192 CrossRef.
- D. Madden, et al., Proline-Derived Structural Phases on Cu{311}, Top. Catal., 2015, 1–15 Search PubMed.
- D. C. Madden, et al., Self-Organized Overlayers Formed by Alanine on Cu{311} Surfaces, J. Phys. Chem. C, 2014, 118(32), 18589–18603 CrossRef CAS.
- D. C. Madden, et al., Spontaneous Local Symmetry Breaking: A Conformational Study of Glycine on Cu{311}, J. Phys. Chem. C, 2015, 119, 13041–13049 CrossRef CAS.
- F. L. Hirshfeld, Bonded-atom fragments for describing molecular charge densities, Theor. Chim. Acta, 1977, 44(2), 129–138 CrossRef CAS.
- B. Afsin, et al., Reaction pathways in the oxydehydrogenation of ammonia at Cu{110} surfaces, Surf. Sci., 1993, 284(1–2), 109–120 CrossRef CAS.
Footnote |
| † Electronic supplementary information (ESI) available. See DOI: 10.1039/d1cy02284a |
| This journal is © The Royal Society of Chemistry 2022 |

