 Open Access Article
Coincidence study of core-ionized adamantane: site-sensitivity within a carbon cage?
Smita
Ganguly
 a,
Mathieu
Gisselbrecht
 a,
Per
Eng-Johnsson
 a,
Raimund
Feifel
 b,
Paul-Antoine
Hervieux
c,
Zeinab
Alfaytarouni
de,
Reinhold F.
Fink
 f,
Sergio
Díaz-Tendero
 ghi,
Aleksandar R.
Milosavljević
 j,
Patrick
Rousseau
 k and
Sylvain
Maclot
 *bl
*bl
aDepartment of Physics, Lund University, 22100 Lund, Sweden
bDepartment of Physics, University of Gothenburg, Origovägen 6 B, 41296 Gothenburg, Sweden. E-mail: smaclot@gmail.com
cUniversité de Strasbourg, CNRS, Institut de Physique et Chimie des Matériaux de Strasbourg, UMR 7504, 67000 Strasbourg, France
dUniversité de Strasbourg, CNRS, IPHC UMR 7178, 67000 Strasbourg, France
eRadiotherapy Department, Institut de cancérologie Strasbourg Europe (ICANS), 67200 Strasbourg, France
fInstitute of Physical and Theoretical Chemistry, Eberhard Karls University Tübingen, Auf der Morgenstelle 18, 72076 Tübingen, Germany
gDepartment of Chemistry, Universidad Autonoma de Madrid, 28049, Madrid, Spain
hInstitute for Advanced Research in Chemistry (IAdChem), Universidad Autónoma de Madrid, 28049 Madrid, Spain
iCondensed Matter Physics Center (IFIMAC), Universidad Autónoma de Madrid, 28049 Madrid, Spain
jSynchrotron SOLEIL, L’Orme de Merisiers, Saint Aubin, BP48, 91192, Gif-sur-Yvette Cedex, France
kNormandie Univ., ENSICAEN, UNICAEN, CEA, CNRS, CIMAP, 14000, Caen, France
lInstitut Lumière Matière UMR 5306, Université Claude Bernard Lyon 1, CNRS, Univ Lyon, 69100 Villeurbanne, France
First published on 17th November 2022
Abstract
We investigate the fragmentation dynamics of adamantane dications produced after core-ionization at the carbon edge followed by Auger decay. The combination of high-resolution electron spectroscopy, energy-resolved electron-ion multi-coincidence spectroscopy and different theoretical models allows us to give a complete characterization of the processes involved after ionization. We show that energy- and site-sensitivity is observed even for a highly-symmetric molecule that lacks any unique atomic site.
1 Introduction
Diamondoids have been of great interest in recent years due to their role in many applications1 such as in nanotechnology,2 in medicine,3,4 and in astrochemistry.5,6 In space, diamondoids are expected to be abundant due to their high stability but after comparison with laboratory measurements based on infrared spectroscopy,7 astronomical observations show a deficiency of diamondoids in the interstellar medium which to date is not completely understood.8 Adamantane (C10H16) is the smallest diamondoid molecule with a carbon cage formed by C(sp3)–C(sp3)-hybridized bonds and fully terminated by hydrogen atoms. The molecule comprises two different carbon sites CH and CH2, so-called methanetriyl and methylene groups, respectively. Previously, valence dissociative ionization of the adamantane has been studied using VUV radiation,9 XUV femtosecond pulses,10,11 electron ionization12,13 as well as other spectroscopic works.14,15 These studies reveal dissociation via a number of parallel channels which all start with an opening of the carbon cage and hydrogen migration indicating that the low stability of adamantane after excitation/ionization could explain its deficiency in astronomical observations. However, little is known about X-ray dissociative ionization of adamantane and diamondoids in general. It is known that X-rays travelling through the interstellar medium ionize the atoms, molecules and grains in the medium.16,17 The interaction of diamondoids with X-rays is therefore relevant to the chemistry of interstellar medium18–21 and could partially explain the lack of diamondoids in space.The only studies of carbon K-edge spectra we are aware of, for adamantane and other diamondoids, are the absorption spectra of Willey et al.22,23 In addition, the Auger electron spectra of diamondoids (bulk) have been measured and rationalized by calculations on adamantane derivatives by Endo et al.24 The theoretical results could resolve different contributions both regarding the Auger process (1s–2p2p, 1s–2s2p,1s–2s2s) and the chemical environment (C–C or different C–Hn atoms), raising the possibility of finding site-sensitive fragmentation upon core–hole excitation. Thus we have studied the dissociation of adamantane molecules in the gas phase after C-1s core-ionization using synchrotron X-ray radiation and explore site-sensitive dissociation. In fact, K-shell ionization by synchrotron radiation has been extensively used to probe the chemical environment of many molecular and cluster systems25–33 even though site-specific dissociation is often considered as weak34 and that fragmentation dynamics is mostly driven by internal energy.35,36 The fact that adamantane is a saturated hydrocarbon implies that the detection of site-selective dissociation (using the direct photoelectron) is highly challenging due to small energy difference between the two different carbon sites (similar chemical environment) and the effect is expected to be rather small. Nevertheless, multi-coincidence tools using Auger electron and ion spectroscopy can reveal such processes as we will show in the following.
In this work, we present the results of electron-ion spectroscopy of the adamantane dication after core-ionization at the carbon edge using X-ray photons. The first part consists of high-resolution spectroscopic measurements such as C-edge X-ray photoelectron spectrum (XPS), near edge X-ray absorption fine structure (NEXAFS), normal and resonant Auger electron spectroscopy (AES and RAES). These studies are used to determine the conditions and interpret the results of correlated photoion and Auger electron spectroscopy (AEPIPICO). This enables the characterization of the charged products of interaction (identification and energetics). Combination of state-of-the-art computational techniques is required to treat such complex system and the variety of processes occurring. We demonstrate that thanks to coincidence measurements and good understanding of the electronic structure of ionized adamantane we can reveal both energy- and site-sensitivity of photodissociation, even for such symmetric molecules containing carbon as the only heavy element.
2 Methods
2.1 Experimental
The experiments were carried out at the soft X-ray beamline PLEIADES at Synchrotron SOLEIL.37 The soft X-rays were generated by an Apple II HU 80 permanent magnet undulator and monochromatized using the modified Petersen plane grating monochromator in combination with a high-flux 600 lines per mm grating. For the present experiment, the photon energy was calibrated according to the maximum position of the CO2 C-1s → π* absorption peak.38The electron spectroscopy measurements were performed using a newly developed heated gas cell, in combination with a wide-angle lens VG-Scienta R4000 electron energy analyzer.39 High purity commercial adamantane powder (99%, Sigma-Aldrich) was used without further purification except vacuum pumping. The sample was placed in an external container and introduced into the gas cell through a heated injection gas line. The gas cell was heated at 54 degrees Celsius. During the measurements, the pressure in the Scienta chamber (outside the gas cell) was 7.1 × 10⁻⁷ mbar (the base pressure was 4.3 × 10⁻⁸ mbar). The binding energy scale of the adamantane XPS spectrum was calibrated according to the XPS spectrum of CO2 and the reference C-1s IP value reported by Myrseth et al.40 The CO2 was introduced into the gas cell under the same experimental conditions, through the same injection gas line. The kinetic energy scale of the adamantane Auger spectra was calibrated at the same time according to the measured CO2 Auger spectrum and the position of reference lines reported by Modeman et al.41 The overall uncertainty of binding and kinetic energy scales due to the calibration is estimated to be up to 0.1 eV. The adamantane electron spectra were recorded at the photon energy of 350 eV for the XPS and AES, 287 and 287.6 eV for the RAES, with an overall resolution of 55 meV.
The AEPIPICO spectra were recorded using the EPICEA setup,32,37 which consists of a double toroidal electron analyzer (DTA)42 and a 3D focusing ion TOF spectrometer. Electrons emitted at an angle of 54.7° enter the DTA, where they are retarded to a predetermined pass energy (Ep). The detection electron kinetic energy window is about 12% of the defined Ep, whereas the energy resolution is about 1% of the Ep.43 In the present experiments, a pass energy of 250 eV was used, which leads to an analyzer resolution of about 2.5 eV and a detection range of ±15 eV. The retardation voltage and DTA lenses were then adjusted to detect Auger electrons with a kinetic energy corresponding to a binding energy (BE) centered at 20 eV in the case of resonant Auger electron spectra and 40 eV in the case of normal Auger electron spectra. After exiting the DTA, the electrons are recorded by a delay-line position sensitive detector (DLD40, Roentdek GmbH). The distance of the electron position from the center is inversely proportional to its kinetic energy. The calibration of the kinetic energy scale was performed by recording radius-positions of Xe 5p and Xe 5s IPs as a function of the photon energy, and by using a previously proposed empirical formula to transform the detector radius-position (mm) to the electron kinetic energy (eV).43
For the EPICEA experiment, the adamantane is introduced into the vacuum chamber through a heated injection gas line and a heated needle, in a crossed-beam experimental arrangement. The base pressure was 4.2 × 10⁻⁸ mbar. The interaction region is placed in a zero-electric-field space between two extraction grids. The detection of an electron triggers a pulsed field that accelerates all ions toward a hexagonal delay-line detector (HEX75, Roentdek GmbH) placed behind the TOF drift tube. The positions on the detector and time of flight of all extracted ions are recorded and make part of the same coincident “event” marked by the triggering electron. Additionally, a pulse generator (Stanford DG645) was used to produce random triggers, which extract ions present in the interaction without a coincident electron event, thus allowing to analyze the background ion signal recorded due to false coincidences. False coincidences were taken into account using the statistical procedure reported by Prümper and Ueda.44 The NEXAFS spectra recorded on the EPICEA setup were obtained as a total photoion yield measured in a continuous ion extraction field.
2.2 Theoretical
The theoretical framework is based on the First Born Approximation (FBA) and the ejected electron is described by a distorted wave (a complete theoretical description of the model is given in ref. 48). The molecular wavefunction was computed at the HF/6-31G(d) level over the optimized geometry at the B3LYP/6-31G(d) level, and using Gaussian16 code.49 Such wave function is then converted to a single center wavefunction, thereby reducing the complexity of this multi-atom system.
Hartree–Fock (HF) orbitals of the adamantane molecule obtained with the SV(P) basis set55 were extended by the space of atomic valence orbitals according to ref. 56. Localized C-1s core orbitals were obtained with a Mulliken localization of the ten HF-orbitals with lowest orbital energies. The core-ionized states were described with CI calculations with one hole in the core orbital of interest and additionally one excitation of an electron from the occupied valence orbitals to one atomic virtual orbital while the final state energies and wavefunctions were obtained with a CI calculation with all configurations that result from two holes in the occupied valence orbitals of the ground state adamantane molecule.
3 Results and discussion
3.1 C-edge X-ray photoelectron spectroscopy
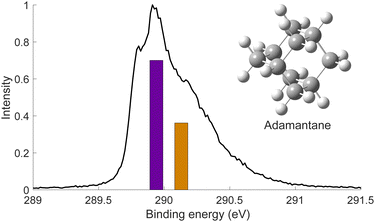
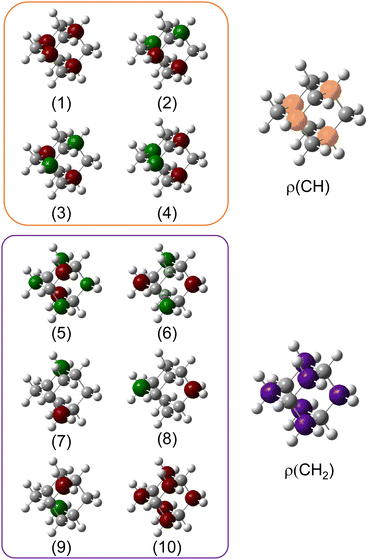
We used X-ray photoelectron spectroscopy (XPS) to probe the chemical environment of the adamantane carbon cage. Fig. 1 shows the experimental C-1s edge XPS spectrum recorded at hν = 350 eV and where several contributions can be observed. The two main features at 289.9 eV and 290.1 eV come from the two different carbon sites (CH and CH2) and are spaced by about 200 meV. The visible tail at higher binding energies can be associated with the population of some vibrational states.To compare with the experimental measurement, theoretical calculations (see Section 2.2.1) have been performed. First, they give access to the 10 different molecular orbitals that are displayed in Fig. 2. The first four (1–4) correspond to methanetriyl groups and ρ(CH) is the corresponding electronic density associated to the core orbitals in this site (see caption of Fig. 2). This shows that the electronic density is mainly located on the carbon of the initial site. Similar behaviour is observed for the ones of the methylene groups (5–10) and ρ(CH2). This indicates that orbitals seem to be very well localized on the carbon groups involved in the ionization and should give a well defined site-sensitivity. The Koopmans energy values of these molecular orbitals have an energy difference of ∼200 meV between the two carbon sites matching the experimental observation. The intensities of the different orbitals are calculated with a method based on the First Born Approximation (see Section. 2.2.1) and are reported as bars normalized to 0.7 in Fig. 1 (purple for CH2 sites and orange for CH sites) in good agreement with the experimental measurement.
3.2 Auger-yield near edge X-ray absorption fine structure
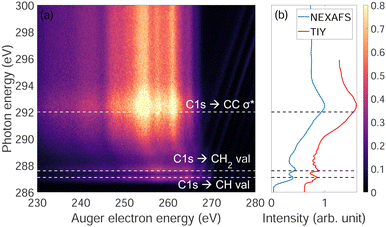
Fig. 3(a) shows the photon energy dependence of Auger electron energy of adamantane near the C-1s ionization edge. We observe that below the ionization edge (∼289.7 eV) there are two resonances at 287 eV and 287.6 eV attributed to CH and CH2 valence orbitals, respectively, and one resonance above threshold at 292 eV coming from σ* states of C–C bonds (respective attributions from ref. 22 and 23). Strong post-collision interactions (PCI) are visible between 288 and 292 eV (curved features). Fig. 3(b) shows the NEXAFS spectrum were the two narrow resonances at 287 eV and 287.6 eV and a broad one at 292 eV are clearly observed same as in Fig. 3(a). For comparison, a total ion yield X-ray absorption spectrum was recorded including higher resolution (30 meV) around the narrow resonances where the different vibration modes can be observed as in the works of Willey et al.22,233.3 Auger electron spectra
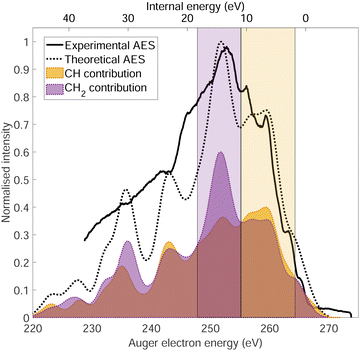
The normal Auger electron spectrum was recorded at hν = 350 eV photon energy well above threshold (∼289.7 eV) in order to avoid PCI effects and is shown as a thick black line in Fig. 4. We also estimate the internal energy axis (top axis of Fig. 4) according to the equation proposed by Kukk et al.35Eint(Ada2+) = Eb(Ada*+) − VDIT − KEAES where Eb(Ada*+) is the binding energy of the C-1s core hole state approximated at 290 eV in our case (see Fig. 1), VDIT is the double ionization threshold known at 23.9 eV according to our previous study10 and KEAES the kinetic energy of the Auger electrons. We can see that the internal energy starts nicely from 0 eV with a maximum around 15 eV. The theoretical Auger electron spectrum was obtained using CI energies and intensities according to the one-centre approximation (see Section 2.2.2) and is reported as a dotted black line in Fig. 4 showing a good agreement with the general features of the experimental spectrum and a previous work from Endo et al.24 The theoretical spectrum can be decomposed in two contributions coming from the two different carbon groups (CH and CH2) and are shown in plain color (orange and purple, respectively) in Fig. 4. The strongest contributions are observed around 252 eV in the case of the CH2 sites (purple) and 259 eV in the case of CH sites (orange). The same predominance can be seen in the two resonant Auger electron spectra (RAES) at the CH and CH2 sites (Fig. 5) demonstrating the site-sensitivity of this two peaks. Therefore, we label two bands in the AES in purple for CH2 (between 247.8 and 255.1 eV) sites and orange for CH sites (between 255.2 and 264.3 eV) visible in Fig. 4 even though these bands are not purely coming from one or another site. These bands will be used afterwards as filters in the core-ionization ion-electron spectroscopy analysis recorded at hν = 350 eV.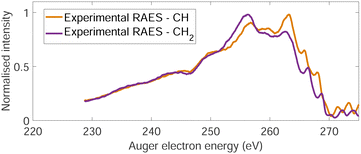 | ||
| Fig. 5 Two resonant Auger electron spectra (RAES) at the CH (orange) and CH2 (purple) valence orbital resonances after photoionization of adamantane at hν = 287 eV and hν = 287.6 eV, respectively. | ||
3.4 Dication photodissociation dynamics
When the adamantane molecule is ionized with a photon energy above the C-1s edge, it undergoes normal Auger decay and produces an unstable C10H162+ state. Our previous study10 showed that the adamantane dication goes through barrier-free structural changes like cage-opening or hydrogen migration(s) before dissociating into different ion pairs labelled as CnHx+/CmHy+. In this section, we present the dissociation dynamics of the adamantane dication after C-1s ionization at a photon energy of 350 eV.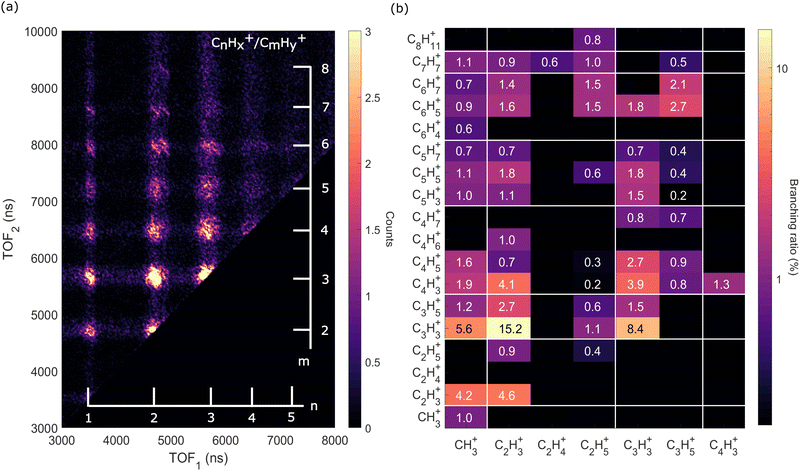 | ||
| Fig. 6 Two-dimensional time-of-flight (TOF) coincidence map of ion pairs in correlation with Auger electrons with energy between 230 and 270 eV following ionization of adamantane at hν = 350 eV, commonly referred to as AEPIPICO. The data are filtered to remove false coincidences using the statistical technique described by Prümper et al.44 (a) All the ion pairs recorded in coincidence. (b) Heat map showing the branching ratios of ion pairs produced after photoionization of adamantane at hν = 350 eV. White lines delimit the different carbon groups. The errors are estimated to be around 10% of the value. | ||
The ion pair islands in the AEPIPICO were identified and for a quantitative analysis we calculated their branching ratios. Fig. 6(b) shows the branching ratios using a representation similar to the AEPIPICO map shown in Fig. 6(a) for direct comparison. We observe that C2H3+/C3H3+ is the most intense channel with 15.2% of the total counts measured. The second most intense ion pair (8.4%) accounts for C3H3+/C3H3+. These two ions are observed in space57 and can be reactive species since they are radical cations which could contribute to the formation of large hydrocarbon species in certain interstellar regions.
Interestingly, we observe quite some ion pairs containing the ion CH3+ (BR = 21.6%) while the neutral structure of adamantane does not contain any carbon group with 3 hydrogen atoms, therefore the abundance of methyl cations in our data is an evidence for hydrogen migration10 before the dication dissociates. Methyl cations are observed in coincidence with ions containing two to seven carbon atoms. Methyl radical cations are reactive species also detected in the interstellar medium.58
It is also worth mentioning that the combined branching fractions of ion pairs that include CH3+, C2H3+, and C3H3+, account for almost 40% thus could contribute to the astrochemistry of certain regions,59 for instance planetary atmospheres such as Titan's one where formation of large polycyclic aromatic hydrocarbons (PAHs) are observed.60
Another fragment, C2H5+, involving at least two hydrogen migrations is observed in several channels. For instance, the correlation island of the 2-body breakup channel C2H5+/C8H11+ is observed with an intensity of around 0.8% which is much smaller that the one observed for valence ionization from our previous study10 since it was the main dissociation channel (BR = 23.3%). As expected, the correlation island has a slope of −1 indicating a 2-body breakup with two ions ejected in opposite directions with equal momenta.61 In general, the slopes of the other islands of the map are well defined and equal to −1 implying multi-step dissociation process that involves neutral fragment evaporation(s) prior to Coulomb explosion into two singly charged fragments with negative momentum correlation.
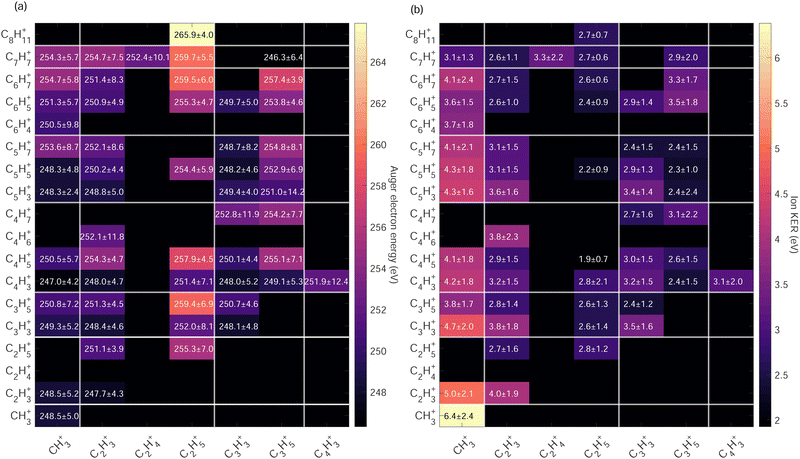
High Auger electron kinetic energies indicate low binding energies of the states i.e. the first HOMOs – valence shells were involved in the Auger cascade. After such a Auger decay, the dication is left with low internal energy. The fragmentation dynamics of the dication depends on the internal energy and energy barrier of the potential energy surfaces. In Fig. 7(a) we observe that within the same Cx/Cy groups ion pairs with more hydrogen atoms have higher Auger electron kinetic energies indicating a strong correlation between the internal energy of the dication upon Auger decay and hydrogen migration/dissociation before fragmentation.
The highest Auger electron kinetic energies are observed for ion pairs containing the fragment C2H5+. The maximum is observed for the channel C2H5+/C8H11+ with a weighted average value of 265.9 eV and a standard deviation of 4.0 eV, denoted as 265.9 ± 4.0 eV. The associated ion kinetic energy release for this channel is 2.7 ± 0.7 eV. The dominant ion pair C2H3+/C3H3+ has a low Auger electron kinetic energy of 248.4 ± 4.6 eV and ion kinetic energy release of 3.8 ± 1.8 eV.
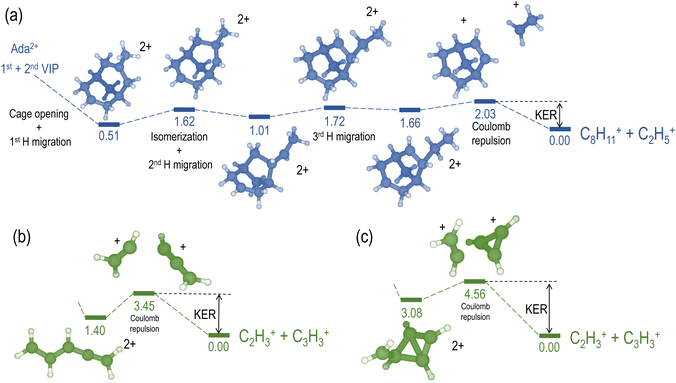
We compare the calculated potential energy surface (PES) (Fig. 8) to the experimental results (Fig. 9). We have selected the C2H5+/C8H11+ (blue) and C2H3+/C3H3+ (green) ion pairs to exemplify 2-body and multi-body breakup dynamics in adamantane dication respectively.
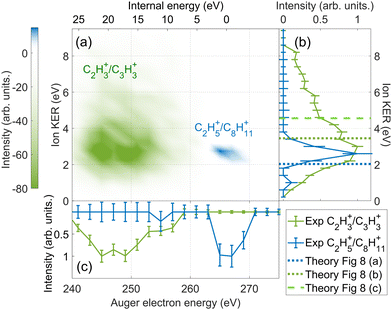 | ||
| Fig. 9 The difference in energy-resolved AEPIPICO data for the C2H3+/C3H3+ (green) and the C2H5+/C8H11+ (blue) ion pairs. (a) 2D map showing the energy correlation of the Auger electron energy with the total ion kinetic energy released (KER) for the selected ion pairs. The intensities of the C2H3+/C3H3+ events is set to be negative and the C2H5+/C8H11+ events is set to be positive for better contrast in the map. (b) The projection of (a) showing the experimental total ion KER of the C2H3+/C3H3+ (green) and the C2H5+/C8H11+ (blue) ion pairs. The theoretical ion KER values obtained from PES (Fig. 8) are shown as vertical dashed lines. (c) The projection of (a) showing the experimental Auger electron energy for the C2H3+/C3H3+ (green) and the C2H5+/C8H11+ (blue) ion pairs. | ||
Fig. 8(a) shows the PES of the channel C2H5+/C8H11+. This ion pair is formed by a barrier-less cage-opening, followed by three hydrogen migrations and then finally a 2-body breakup. In Fig. 9(a), we present the coincidence map of the ion KER vs. AES for the two selected ion pairs. For C2H5+/C8H11+, we see a sharp island (in blue) indicating narrow distributions for AES and ion KER with a well defined single peak. The theoretical ion KER can be estimated as the difference between the energy levels of the exit channel and the last transition state in the PES, because it corresponds to the Coulomb repulsion.62,63 In this case, the theoretical ion KER is 2.03 eV (vertical dashed blue line) which lies within the experimental distribution (2.7 ± 0.7 eV) shown in Fig. 9(b). Fig. 9(c) shows that AES of C2H5+/C8H11+ (in blue) is in the range 264–272 eV, which corresponds to a low internal energy distribution spreading from 0 to ∼3 eV. The negative part of the internal energy can be due to approximation of the binding energy Eb(Ada*+) (vibrational states) and calibration uncertainties at the edges of the DTA detector.
Fig. 8(b) and (c) show the PES of two different fragmentation pathways producing the C2H3+/C3H3+ ion pair. Pathway (b) assumes the fragmentation of a linear C5H62+ and pathway (c) a more complex cyclic structure leading to the formation of the cyclopropenyl cation. Both kind of structures can be produced assuming a high internal excitation energy after Auger decay. The coincidence map of ion KER vs. AES in Fig. 9(a) shows a broad distribution (in green) for C2H3+/C3H3+. Unlike C2H5+/C8H11+, for this ion pair there are several contributions in the AES and ion KER distributions indicating the presence of multiple fragmentation pathways. The maximum intensity in Fig. 9(b) is observed for KER around 3 eV but widely spread from 0 to almost 9 eV. The theoretical ion KER from the PES exploration gives two values of 3.45 and 4.56 eV (Fig. 8(b) and (c)) which are reported as vertical dashed green lines in Fig. 9(b) and shows that the broad distribution come from the fact that various pathways lead to the same final exit channel. Then, in Fig. 9(c) the AES distribution ranges from 240 to 260 eV and corresponds to a rather high and broad internal energy distribution spanning from 6 to 26 eV which also partly explain the broad feature for the KER distribution (up to 15 eV of vibrational energy left in the fragments).
From these two examples, we illustrate that the large amount of internal energy deposited by core-ionization compare to valence ionization privileges multi-body breakups and the production of small fragments.
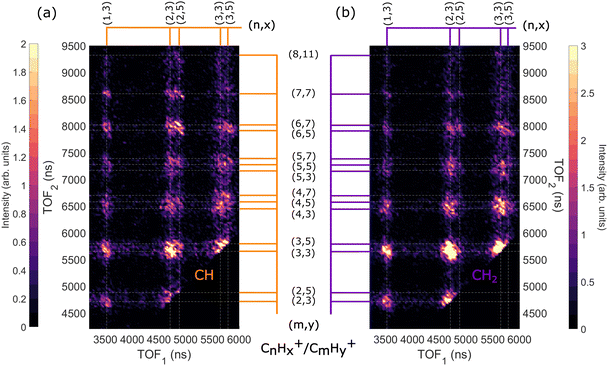
Fig. 10(a) and (b) shows the filtered AEPIPICO maps recorded in coincidence with the CH and CH2 AES bands (Fig. 4), respectively. The intensities of the maps have been normalized to maintain the 4![[thin space (1/6-em)]](https://www.rsc.org/images/entities/char_2009.gif) :
:![[thin space (1/6-em)]](https://www.rsc.org/images/entities/char_2009.gif) 6 (4 CH
6 (4 CH![[thin space (1/6-em)]](https://www.rsc.org/images/entities/char_2009.gif) :
:![[thin space (1/6-em)]](https://www.rsc.org/images/entities/char_2009.gif) 6 CH2) ratio that we expect in the adamantane molecule. We observe that the map in Fig. 10(a) has more ion pairs containing C2H5+ and C3H5+ than the map in Fig. 10(b). Generally, ions with more hydrogen atoms attached are more likely to be created when we ionize the CH site than the CH2 site. There is a significant difference in the intensities of the dominant ion pair C2H3+/C3H3+ in Fig. 10(a) and (b). Also, the C2H5+/C6H5,7+ and C2H5+/C7H7+ ion pairs are enhanced for CH site whereas the C3H3+/C4H3,5+ ion pairs are enhanced for CH2 site.
6 CH2) ratio that we expect in the adamantane molecule. We observe that the map in Fig. 10(a) has more ion pairs containing C2H5+ and C3H5+ than the map in Fig. 10(b). Generally, ions with more hydrogen atoms attached are more likely to be created when we ionize the CH site than the CH2 site. There is a significant difference in the intensities of the dominant ion pair C2H3+/C3H3+ in Fig. 10(a) and (b). Also, the C2H5+/C6H5,7+ and C2H5+/C7H7+ ion pairs are enhanced for CH site whereas the C3H3+/C4H3,5+ ion pairs are enhanced for CH2 site.
Therefore, we find that ions with more hydrogen atoms attached are more likely to be created when we ionize the CH site than the CH2 site. It seems that CH2 site-ionization creates a final dicationic state that prefers to undergo hydrogen evaporation and produces ions with fewer hydrogen atoms attached.
4 Conclusions
In this work, we investigated the dissociation of adamantane dications produced after core-ionization at the C-1s edge and Auger decay using energy-resolved electron-ion multi-coincidence spectroscopy and theoretical calculations. We first determined the electronic structure of the ionized adamantane molecule using high-resolution spectroscopic techniques XPS, NEXAFS, AES and RAES measurements. The XPS hinted to the contributions of the two carbon sites (CH and CH2) of the molecule supported by theoretical calculations based on FBA methods. RAES and theoretical simulations showed that two energy bands in the AES can be identified as main contributors from these two carbon sites. We then performed AEPIPICO spectroscopy to assess the fragmentation dynamics of the dication of adamantane. We succeeded to identify and access the kinematics of the different fragmentation pathways and determined their branching ratios. The energetics of two cases C2H3+/C3H3+ and C2H5+/C8H11+ have been presented to illustrate the differences in the mechanisms of dissociation involved. Higher internal energies are associated with stronger dissociation. Finally, we used the filtering of the PIPICO measurement with both CH and CH2 Auger electron bands. Our results suggest the presence of site-sensitive dissociation even though the effect can be blurred by the non-single state contributions in the Auger spectrum. Thus, this study, which combines both experimental and theoretical results, pushes the boundaries of understanding site sensitivity in a carbon cage. Further work is needed with a higher degree of theory to reveal the role of electronic excitation, and its interplay with nuclear dynamics, in the dissociation of the adamantane dication.Our results show that the adamantane molecule fragments into small hydrocarbons after exposure to soft X-rays and could partially play a part in the deficiency of diamondoids in space. In addition, diamondoids could contribute as a source of reactive species for carbonaceous cyclic compounds formation.60 Therefore, this study could be used to model the X-ray driven photodissociation of adamantane and perhaps other diamondoids in accompaniment to the X-ray driven photodissocation of PAHs.
Author contributions
ARM, PR and SM performed the experiments. SG and SM analyzed the data. RFF made the theoretical calculations for the Auger spectra. SDT computed the HF orbitals and PES. PAH and ZA performed theoretical calculations for XPS C-1s spectrum. All authors participated to the scientific discussions concerning the interpretation of the results. SG and SM wrote this manuscript and all authors helped to improve it.Conflicts of interest
There are no conflicts to declare.Acknowledgements
This work was performed on the PLEIADES beamline of synchrotron SOLEIL under the proposal no. 20191168. We acknowledge SOLEIL for provision of synchrotron radiation facilities and we would like to thank the PLEAIDES beamline team for their assistance. The research leading to this result has been supported by the project CALIPSOplus under Grant Agreement 730872 from the EU Framework Programme for Research and Innovation HORIZON 2020 and the COST Action CA18212 – Molecular Dynamics in the GAS phase (MD-GAS), supported by COST (European Cooperation in Science and Technology). The authors acknowledge the generous allocation of computer time at the Centro de Computación Científica at the Universidad Autónoma de Madrid (CCC-UAM). This work was partially supported by MICINN (Spanish Ministry of Science and Innovation) project PID2019-110091GB-I00 funded by MCIN/AEI/10.13039/501100011033 and the “María de Maeztu” (CEX2018-000805-M) Program for Centers of Excellence in RD.Notes and references
- G. A. Mansoori, P. L. B. De Araujo and E. S. De Araujo, Diamondoid molecules: with applications in biomedicine, materials science, nanotechnology & petroleum science, World Scientific, 2012 Search PubMed.
- S. Stauss and K. Terashima, Diamondoids: Synthesis, Properties, and Applications, Jenny Stanford Publishing, 2017 Search PubMed.
- V. Mochalin, O. Shenderova, D. Ho and Y. Gogotsi, Nano-Enabled Med. Appl., 2020, 313–350 CrossRef.
- A. Spasov, T. Khamidova, L. Bugaeva and I. Morozov, Pharm. Chem. J., 2000, 34, 1–7 CrossRef CAS.
- E. Anders and E. Zinner, Meteoritics, 1993, 28, 490–514 CrossRef CAS.
- T. Henning and F. Salama, Science, 1998, 282, 2204–2210 CrossRef CAS PubMed.
- J. Oomens, N. Polfer, O. Pirali, Y. Ueno, R. Maboudian, P. W. May, J. Filik, J. E. Dahl, S. Liu and R. M. Carlson, J. Mol. Spectrosc., 2006, 238, 158–167 CrossRef CAS.
- B. Acke and M. E. van den Ancker, Astron. Astrophys., 2006, 457, 171–181 CrossRef CAS.
- A. Candian, J. Bouwman, P. Hemberger, A. Bodi and A. G. Tielens, Phys. Chem. Chem. Phys., 2018, 20, 5399–5406 RSC.
- S. Maclot, J. Lahl, J. Peschel, H. Wikmark, P. Rudawski, F. Brunner, H. Coudert-Alteirac, S. Indrajith, B. A. Huber, S. Díaz-Tendero, N. F. Aguirre, P. Rousseau and P. Johnsson, Sci. Rep., 2020, 10, 1–12 CrossRef PubMed.
- A. Boyer, M. Hervé, A. Scognamiglio, V. Loriot and F. Lépine, Phys. Chem. Chem. Phys., 2021, 23, 27477–27483 RSC.
- J. Bouwman, S. Horst and J. Oomens, ChemPhysChem, 2018, 19, 3211–3218 CrossRef CAS PubMed.
- R. J. Waltman and A. C. Ling, Can. J. Chem., 1980, 58, 2189–2195 CrossRef CAS.
- P. B. Crandall, D. Müller, J. Leroux, M. Förstel and O. Dopfer, Astrophys. J., Lett., 2020, 900, L20 CrossRef CAS.
- R. Richter, D. Wolter, T. Zimmermann, L. Landt, A. Knecht, C. Heidrich, A. Merli, O. Dopfer, P. Reiß, A. Ehresmann, J. Petersen, J. E. Dahl, R. M. K. Carlson, C. Bostedt, T. Möller, R. Mitric and T. Rander, Phys. Chem. Chem. Phys., 2014, 16, 3070–3076 RSC.
- J. Wilms, A. Allen and R. McCray, Astrophys. J., 2000, 542, 914 CrossRef CAS.
- P. Caselli and C. Walmsley, From Darkness to Light: Origin and Evolution of Young Stellar Clusters, 2001, p. 67 Search PubMed.
- C. Walsh, H. Nomura, T. J. Millar and Y. Aikawa, Astrophys. J., 2012, 747, 114 CrossRef.
- R. Dupuy, M. Bertin, G. Féraud, M. Hassenfratz, X. Michaut, T. Putaud, L. Philippe, P. Jeseck, M. Angelucci and R. Cimino, et al. , Nat. Astron., 2018, 2, 796–801 CrossRef.
- A. Puglisi, T. Miteva, E. T. Kennedy, J.-P. Mosnier, J.-M. Bizau, D. Cubaynes, N. Sisourat and S. Carniato, Phys. Chem. Chem. Phys., 2018, 20, 4415–4421 RSC.
- S. Notsu, E. F. van Dishoeck, C. Walsh, A. D. Bosman and H. Nomura, Astron. Astrophys., 2021, 650, A180 CrossRef CAS.
- T. M. Willey, C. Bostedt, T. van Buuren, J. E. Dahl, S. G. Liu, R. M. K. Carlson, L. J. Terminello and T. Möller, Phys. Rev. Lett., 2005, 95, 113401 CrossRef CAS PubMed.
- T. M. Willey, J. R. Lee, D. Brehmer, O. A. Paredes Mellone, L. Landt, P. R. Schreiner, A. A. Fokin, B. A. Tkachenko, A. de Meijere and S. Kozhushkov, et al. , J. Vac. Sci. Technol., A, 2021, 39, 053208 CrossRef CAS.
- K. Endo, S. Koizumi, T. Otsuka, T. Ida, T. Morohashi, J. Onoe, A. Nakao, E. Z. Kurmaev, A. Moewes and D. P. Chong, J. Phys. Chem. A, 2003, 107, 9403–9408 CrossRef CAS.
- K. Siegbahn, Rev. Mod. Phys., 1982, 54, 709–728 CrossRef CAS.
- W. Eberhardt, T. K. Sham, R. Carr, S. Krummacher, M. Strongin, S. L. Weng and D. Wesner, Phys. Rev. Lett., 1983, 50, 1038–1041 CrossRef CAS.
- J. Eland, F. Wort and R. Royds, J. Electron Spectrosc. Relat. Phenom., 1986, 41, 297–309 CrossRef CAS.
- H. C. Schmelz, C. Reynaud, M. Simon and I. Nenner, J. Chem. Phys., 1994, 101, 3742–3749 CrossRef CAS.
- P. Salén, M. Kamińska, R. J. Squibb, R. Richter, M. Alagia, S. Stranges, P. van der Meulen, J. H. D. Eland, R. Feifel and V. Zhaunerchyk, Phys. Chem. Chem. Phys., 2014, 16, 15231–15240 RSC.
- P. Bolognesi, J. A. Kettunen, A. Cartoni, R. Richter, S. Tosic, S. Maclot, P. Rousseau, R. Delaunay and L. Avaldi, Phys. Chem. Chem. Phys., 2015, 17, 24063–24069 RSC.
- R. Linguerri, E. Olsson, G. Nyman, M. Hochlaf, J. H. D. Eland and R. Feifel, Inorg. Chem., 2021, 60, 17966–17975 CrossRef CAS PubMed.
- M. Gerlach, F. Fantuzzi, L. Wohlfart, K. Kopp, B. Engels, J. Bozek, C. Nicolas, D. Mayer, M. Gühr, F. Holzmeier and I. Fischer, J. Chem. Phys., 2021, 154, 114302 CrossRef CAS PubMed.
- P. Markush, P. Bolognesi, A. Cartoni, P. Rousseau, S. Maclot, R. Delaunay, A. Domaracka, J. Kocisek, M. C. Castrovilli, B. A. Huber and L. Avaldi, Phys. Chem. Chem. Phys., 2016, 18, 16721–16729 RSC.
- L. Inhester, B. Oostenrijk, M. Patanen, E. Kokkonen, S. H. Southworth, C. Bostedt, O. Travnikova, T. Marchenko, S.-K. Son, R. Santra, M. Simon, L. Young and S. L. Sorensen, J. Phys. Chem. Lett., 2018, 9, 1156–1163 CrossRef CAS PubMed.
- E. Kukk, D. T. Ha, Y. Wang, D. G. Piekarski, S. Diaz-Tendero, K. Kooser, E. Itälä, H. Levola, M. Alcamí, E. Rachlew and F. Martín, Phys. Rev. A: At., Mol., Opt. Phys., 2015, 91, 043417 CrossRef.
- P. Salén, L. Schio, R. Richter, M. Alagia, S. Stranges and V. Zhaunerchyk, Phys. Rev. A, 2020, 102, 032817 CrossRef.
- PLEIADES Beamline website, https://www.synchrotron-soleil.fr/fr/lignes-de-lumiere/pleiades, 2019.
- J.-i Adachi, N. Kosugi, E. Shigemasa and A. Yagishita, J. Phys. Chem., 1996, 100, 19783–19788 CrossRef CAS.
- D. Danilović, D. K. Božanić, R. Dojćilović, N. Vukmirović, P. Sapkota, I. Vukašinović, V. Djoković, J. Bozek, C. Nicolas, S. Ptasinska and A. R. Milosavljević, J. Phys. Chem. C, 2020, 124, 23930–23937 CrossRef.
- V. Myrseth, J. Bozek, E. Kukk, L. SÃæthre and T. Thomas, J. Electron Spectrosc. Relat. Phenom., 2002, 122, 57–63 CrossRef CAS.
- W. E. Moddeman, T. A. Carlson, M. O. Krause, B. P. Pullen, W. E. Bull and G. K. Schweitzer, J. Chem. Phys., 1971, 55, 2317–2336 CrossRef CAS.
- C. Miron, M. Simon, N. Leclercq and P. Morin, Rev. Sci. Instrum., 1997, 68, 3728–3737 CrossRef CAS.
- X.-J. Liu, C. Nicolas and C. Miron, Rev. Sci. Instrum., 2013, 84, 033105 CrossRef PubMed.
- G. Prümper and K. Ueda, Nucl. Instrum. Methods Phys. Res., Sect. A, 2007, 574, 350–362 CrossRef.
- L. Mouawad, P. Hervieux, C. Dal Cappello, J. Pansanel, A. Osman, M. Khalil and Z. El Bitar, J. Phys. B: At., Mol. Opt. Phys., 2017, 50, 215204 CrossRef.
- L. Mouawad, P.-A. Hervieux, C. Dal Cappello, J. Pansanel, V. Robert and Z. El Bitar, J. Phys. B: At., Mol. Opt. Phys., 2018, 51, 175201 CrossRef.
- L. Mouawad, P.-A. Hervieux, C. Dal Cappello, J. Pansane, V. Robert and Z. El Bitar, Eur. Phys. J. D, 2019, 73, 1–8 CrossRef CAS.
- L. Mouawad, P.-A. Hervieux, C. D. Cappello and Z. E. Bitar, J. Phys. B: At., Mol. Opt. Phys., 2019, 53, 025202 CrossRef.
- M. J. Frisch, G. W. Trucks, H. B. Schlegel, G. E. Scuseria, M. A. Robb, J. R. Cheeseman, G. Scalmani, V. Barone, G. A. Petersson, H. Nakatsuji, X. Li, M. Caricato, A. V. Marenich, J. Bloino, B. G. Janesko, R. Gomperts, B. Mennucci, H. P. Hratchian, J. V. Ortiz, A. F. Izmaylov, J. L. Sonnenberg, D. Williams-Young, F. Ding, F. Lipparini, F. Egidi, J. Goings, B. Peng, A. Petrone, T. Henderson, D. Ranasinghe, V. G. Zakrzewski, J. Gao, N. Rega, G. Zheng, W. Liang, M. Hada, M. Ehara, K. Toyota, R. Fukuda, J. Hasegawa, M. Ishida, T. Nakajima, Y. Honda, O. Kitao, H. Nakai, T. Vreven, K. Throssell, J. A. Montgomery, Jr., J. E. Peralta, F. Ogliaro, M. J. Bearpark, J. J. Heyd, E. N. Brothers, K. N. Kudin, V. N. Staroverov, T. A. Keith, R. Kobayashi, J. Normand, K. Raghavachari, A. P. Rendell, J. C. Burant, S. S. Iyengar, J. Tomasi, M. Cossi, J. M. Millam, M. Klene, C. Adamo, R. Cammi, J. W. Ochterski, R. L. Martin, K. Morokuma, O. Farkas, J. B. Foresman and D. J. Fox, Gaussian∼16 Revision C.01, Gaussian Inc., Wallingford CT, 2016 Search PubMed.
- H. Siegbahn, L. Asplund and P. Kelfve, Chem. Phys. Lett., 1975, 35, 330–335 CrossRef CAS.
- H. Ågren, S. Svensson and U. Wahlgren, Chem. Phys. Lett., 1975, 35, 336–344 CrossRef.
- E. Z. Chelkowska and F. P. Larkins, At. Data Nucl. Data Tables, 1991, 49, 121–206 CrossRef CAS.
- R. Fink, J. Electron Spectrosc. Relat. Phenom., 1995, 76, 295–300 CrossRef CAS.
- M. Gerlach, T. Preitschopf, E. Karaev, H. M. Quitián-Lara, D. Mayer, J. Bozek, I. Fischer and R. F. Fink, Phys. Chem. Chem. Phys., 2022, 24, 15217–15229 RSC.
- A. Schafer, H. Horn and R. Ahlrichs, J. Chem. Phys., 1992, 97, 2571–2577 CrossRef.
- R. F. Fink, S. L. Sorensen, A. Naves de Brito, A. Ausmees and S. Svensson, J. Chem. Phys., 2000, 112, 6666–6677 CrossRef CAS.
- A. Ali, E. Sittler, D. Chornay, B. Rowe and C. Puzzarini, Planet. Space Sci., 2013, 87, 96–105 CrossRef CAS.
- H. Feuchtgruber, F. P. Helmich, E. F. van Dishoeck and C. M. Wright, Astrophys. J., 2000, 535, L111 CrossRef CAS PubMed.
- M. A. Lukianova and V. I. Feldman, Radiat. Phys. Chem., 2022, 191, 109847 CrossRef CAS.
- J. Bourgalais, N. Carrasco, L. Vettier, A. Comby, D. Descamps, S. Petit, V. Blanchet, J. Gaudin, Y. Mairesse and B. Marty, J. Phys. Chem. A, 2021, 125, 3159–3168 CrossRef CAS PubMed.
- J. Eland, F. Wort and R. Royds, J. Electron Spectrosc. Relat. Phenom., 1986, 41, 297–309 CrossRef CAS.
- S. Díaz-Tendero, M. Alcamí and F. Martín, Phys. Rev. Lett., 2005, 95, 013401 CrossRef PubMed.
- S. Díaz-Tendero, M. Alcamí and F. Martín, J. Chem. Phys., 2005, 123, 184306 CrossRef PubMed.
| This journal is © the Owner Societies 2022 |

