
 Open Access Article
 This Open Access Article is licensed under a
 Creative Commons Attribution 3.0 Unported Licence
The design of phase change materials with carbon aerogel composites for multi-responsive thermal energy capture and storage†
Keyan
Sun
ae,
Yan
Kou
a,
Hongsheng
Dong
a,
Sheng
Ye
b,
Donghui
Zhao
c,
Jian
Liu
 *bd and
Quan
Shi
*a
*bd and
Quan
Shi
*a
aThermochemistry Laboratory, Liaoning Province Key Laboratory of Thermochemistry for Energy and Materials, Dalian National Laboratory for Clean Energy, Dalian Institute of Chemical Physics, Chinese Academy of Sciences, Dalian 116023, China. E-mail: shiquan@dicp.ac.cn
bState Key Laboratory of Catalysis, Dalian Institute of Chemical Physics, Chinese Academy of Sciences, 457 Zhongshan Road, Dalian 116023, China
cDalian Jiaotong University, School of Art and Design, Dalian 116028, China
dDICP-Surrey Joint Centre for Future Materials, Department of Chemical and Process Engineering and Advanced Technology Institute, University of Surrey, Guildford, Surrey GU2 7XH, UK. E-mail: jian.liu@surrey.ac.uk
eUniversity of Chinese Academy of Sciences, Beijing 100049, China
First published on 8th December 2020
Abstract
Phase change materials (PCMs) have been widely used as thermal energy storage systems; however, traditional PCMs can only be triggered by temperature for thermal energy storage, which greatly limits their versatility in the application of capturing thermal energy. Herein, we propose a multi-responsive thermal energy capture and storage system involving Fe-doped carbon aerogel as a supporting matrix and eicosane as a PCM. With the ability to respond to light, electricity, and magnetism as well as temperature simultaneously, the designed PCM system demonstrates excellent performance for converting solar, electric and magnetic energy into thermal energy stored as latent heat in the materials. Furthermore, our multi-responsive PCM demonstrates a mild transition onset temperature of 35 °C, relatively large thermal energy storage density of 212 J g−1, shape stability without liquid phase leakage in transition, and excellent phase transition stability even after 1000 heating–cooling cycles. Our reported PCM may shed light on the development of complementary multi-energy utilization.
Introduction
Phase change materials (PCMs) with high thermal energy storage density and constant transition temperature during phase change processes have been widely applied in the thermal energy storage and temperature control fields.1–5 Meanwhile, traditional PCMs can only respond to temperature variations and directly save the generated thermal energy, which greatly limits their application in harvesting thermal energy generation by other alternations apart from temperature. Energy sources such as solar energy, electric energy and magnetic energy can be converted into thermal energy.6–8 Conversion between thermal energy and other energy sources enriches methods of thermal energy capture and is beneficial to improve their utilization efficiency. However, the inefficient conversion of thermal energy is greatly hindering the development of thermal energy conversion and storage in multiple existing energy source fields.To achieve efficient thermal energy conversion from solar energy, electric energy or magnetic energy, a general strategy is to construct a PCM composite system through employing a functional support matrix which can respond to various energy sources rapidly and convert those sources into thermal energy.9,10 In recent work, multi-responsive composite PCMs have attracted much attention because of their ability of converting multiple energy sources into thermal energy simultaneously, which can be applied to further improve the utilization efficiency of energy. For instance, graphene aerogel has been utilized as a matrix for PCMs to achieve solar-thermal and electro-thermal conversion simultaneously.11 Additionally, melamine foam was utilized as a template for coating with graphene nanoplatelets or cellulose nanofiber/graphene nanoplatelet hybrids; in addition, carbon aerogels derived from various melons are appropriate matrices for solar-thermal and electro-thermal conversion.12–14 Alternatively, due to the matrix formed from loading magnetic particles such as Fe3O4 onto graphene nanosheets, PCMs can exhibit very good solar-thermal and magnetic-thermal conversion capacities.15 Although there are some reports on the design of multi-responsive PCMs, it is still a challenge to achieve PCM systems with integrated solar-thermal, electro-thermal and magnetic-thermal conversion abilities simultaneously. To address this goal, two major processes are required: (a) a continuous conductivity network structure of the supporting matrix is desired; (b) light-absorbers and magnetic particles should be introduced and remain stable in the system without damaging the continuous network structure.
In this work, a multi-responsive PCM with the ability to respond to light, electricity, and magnetism as well as temperature was designed, synthesized, and employed to convert multiple energy sources such as solar, electric and magnetic energy into thermal energy for storage. In this process, the chelating effect between Fe3+ and gelatin is exploited to strengthen the carbon skeleton. Therefore, the obtained Fe-doped carbon aerogel (FCA) can create a continuous network for conductivity and light absorption capacity. In the meantime, the introduction of Fe endows this network with magnetic characteristics. After the loading of eicosane, the final multi-responsive PCMs, including light-absorption, conductivity and magnetism, are obtained. The resulting FCA PCMs exhibit excellent shape stability, thermal properties, and cycle stability, as well as highly efficient solar-thermal, electro-thermal and magnetic-thermal conversion. This work may open a new window of thermal energy conversion in different energy source fields with enhanced energy utilization efficiency.
Experimental
Materials
Eicosane (AR) was obtained from Aladdin Reagent (Shanghai, China). Gelatin (AR) and iron nitrate (Fe(NO3)3·9H2O) (AR) were purchased from Guoyao Chemical Co., Ltd. Nitric acid (HNO3) was provided by Tianjin Damao chemical reagent factory, China. All the reagents were used without any further treatment.Synthesis of FCA
Three main steps were involved in the synthesis of FCA. The first step was the sol–gel process. 2 g gelatin and 2 g Fe(NO3)3·9H2O were dissolved in 50 mL deionized water and heated to 80 °C with continuous stirring for 2 h to form a transparent sol (Fig. 2(a)). Then, the sol was allowed to stand at 4 °C for 12 h to form the hydrogel after being cooled to room temperature (Fig. 2(b)). The second step was freeze-drying. The hydrogel was placed in the refrigerator for 12 h of pre-freezing and placed in liquid nitrogen to be totally frozen. Then, the hydrogel was transferred to a lyophilizer for 48 h of freeze-drying to obtain the three-dimensional porous aerogel (Fig. 2(c)). The third step was carbonization. The porous aerogel was carbonized in a tube furnace at 800 °C for 2 h in a nitrogen atmosphere. Finally, the FCA was obtained after being washed with HNO3 and deionized water (Fig. S1a†). As the quality of Fe(NO3)3·9H2O changed from 0 g to 3 g, the obtained FCA samples were labeled as FCA0, FCA1, FCA2, and FCA3, respectively (Table S1†).Synthesis of the FCA PCM composites
The vacuum impregnation method was applied to prepare the multi-responsive PCM composites. First, eicosane was totally melted at 80 °C. Then, the FCA was added under vacuum conditions for 2 h. After removing the unpacked eicosane from the surface of the FCA, the multi-responsive PCM composites were finally prepared (Fig. S1b†). The FCA PCM composite samples were named FCA0-C20 to FCA3-C20, respectively, corresponding to the different FCA samples from FCA0 to FCA3, as shown in Table S1.†Characterization
The morphologies and pore structures were measured by scanning electron microscopy (SEM), transmission electron microscopy (TEM), and nitrogen adsorption–desorption isotherm instruments. X-ray photoelectron spectroscopy (XPS) and Raman spectroscopy were conducted to evaluate the compositions and graphitization degrees of the FCA samples. The chemical compositions of the FCA PCM composites were investigated using Fourier transform infrared (FTIR) spectroscopy and X-ray diffractometry (XRD). The thermal properties were investigated using a differential scanning calorimeter (DSC), thermogravimetric analyzer (TG), and thermal constants analyzer. The thermal cycle stability was evaluated by 1000 heating–cooling cycles using a homemade device. The magnetic property (M–H curve) was measured with a Quantum Design Physical Property Measurement System (PPMS). The optical properties were studied using an ultraviolet-visible-near-infrared (UV-vis-NIR) spectrophotometer. The solar-thermal, electro-thermal, and magnetic-thermal conversion properties were examined by simulated sunlight with a xenon lamp source, a direct current power supply, and an alternating magnetic field, respectively. The infrared imaging photographs were taken by an infrared thermal imager.Results and discussion
The synthesis process of the FCA PCM composites is shown in Fig. 1. The FCA is derived from inexpensive, environmentally friendly and easily available gelatin as the carbon source; it contains many functional groups, such as –NH2, –OH and –COOH.16,17 In the sol–gel process, the chelating effect between Fe3+ and gelatin strengthens the connection of the gel scaffold to form the network structure.18 After freeze-drying and carbonization, the unique porous structure is finally formed. After impregnating eicosane into FCA under vacuum conditions, the FCA PCM composites were obtained.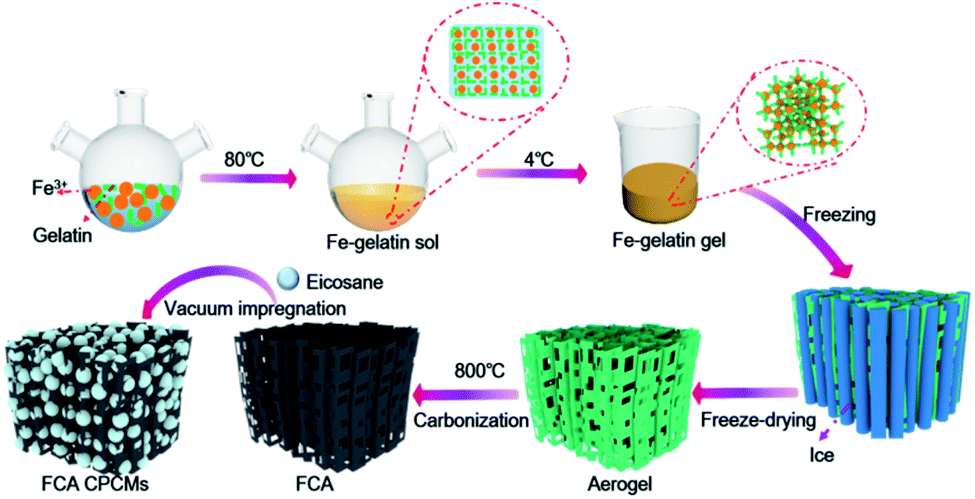 | ||
| Fig. 1 Schematic of the synthesis of the FCA PCM composites. | ||
Morphology and structure characterization
The SEM and TEM images show the morphology of FCA, as shown in Fig. 2 and S2.† FCA2 has an interconnected macropore structure with pore sizes on the micrometer level, as shown in Fig. 2(d). Meanwhile, pores with sizes of several nanometers were also found in this porous scaffold (Fig. 2(e) and S2†), which together form the hierarchical porous structure. This porous structure can provide space for immersion of the PCMs, which is helpful to prevent the liquid phase from leaking during the phase change process. However, no obvious pores were found in the sample FCA0 in Fig. S2(a and b),† where no Fe3+ was added during the synthesis to form the porous structure. Additionally, black particles with sizes of several nanometers were found to be distributed in the porous structure (Fig. 2(e) and S2†). These nanoparticles may be iron along with iron carbide, formed by the reduction of carbon and the chelating effect between the Fe precursor and pyrolytic carbon by overlapping the d-orbitals of Fe with the p-orbitals of carbon.19–21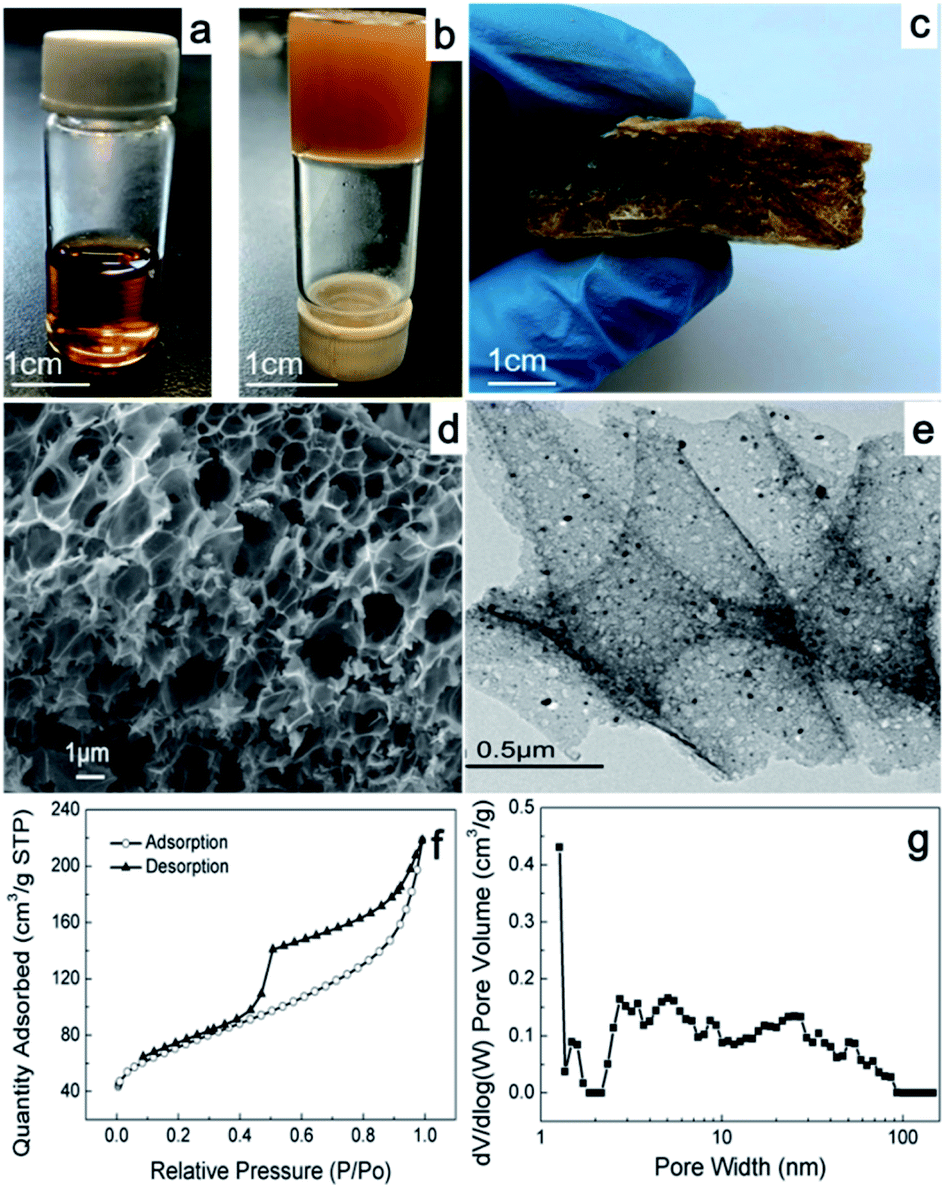 | ||
| Fig. 2 Photographs of (a) Fe–gelatin sol, (b) Fe–gelatin gel and (c) Fe–gelatin aerogel after freeze-drying treatment; (d) SEM and (e) TEM images, (f) nitrogen adsorption and desorption isotherms and (g) corresponding pore size distribution of FCA2. | ||
The porous characteristics of FCA were further determined by nitrogen adsorption, and the corresponding results are summarized in Table S2.† The nitrogen adsorption and desorption isotherm curves of all the FCA samples display a type IV isotherm, as shown in Fig. 2(f) and S2(a and c),† indicating that the FCA samples contain rich mesopores. Also, the distribution of the pores, as shown in Fig. 2(f) and S2,† indicates that micropores and macropores are also included in the FCA samples, further proving their hierarchical porous structures; this is consistent with the SEM and TEM results. Generally, macropores in the supporting matrix act as storage cavities, mesopores provide transport pathways, and micropores can serve as adsorption sites for guest species; therefore, hierarchical porous materials are suitable to form composite phase change material systems for high thermal energy storage capacity.22–24 The specific surface areas of the FCA samples increase from 228 m2 g−1 to 302 m2 g−1 with increasing ferric nitrate content in the synthesis process, corresponding with a gradual decrease in the pore sizes. This can be attributed to the gelatin layers stacked on each other with low ferric nitrate content, resulting in smaller pore sizes and a larger surface area. With the addition of ferric nitrate, the gelatin distribution tends to be more uniform, resulting in an increase of the pore sizes and a decrease of the surface area.
In the high-resolution TEM images (Fig. 3(a)), it is easy to observe an onion-like morphology in the FCA2 sample, which is a typical graphitic characteristic.25 The graphitization degree of FCA was further determined by Raman spectroscopy, as shown in Fig. 3(b) and S4(a).† All the Raman spectra show two obvious peaks around 1340 cm−1 (D band) and 1575 cm−1 (G band), representing defected carbon crystallites and crystalline graphite, respectively.26 Generally, the graphitization degree is characterized by the ID/IG ratio. The ID/IG ratio decreases from 1.40 (FCA0) to 1.21 (FCA3) with increasing addition of ferric nitrate during the FCA preparation, suggesting that the graphitization degree increases from FCA0 to FCA3.
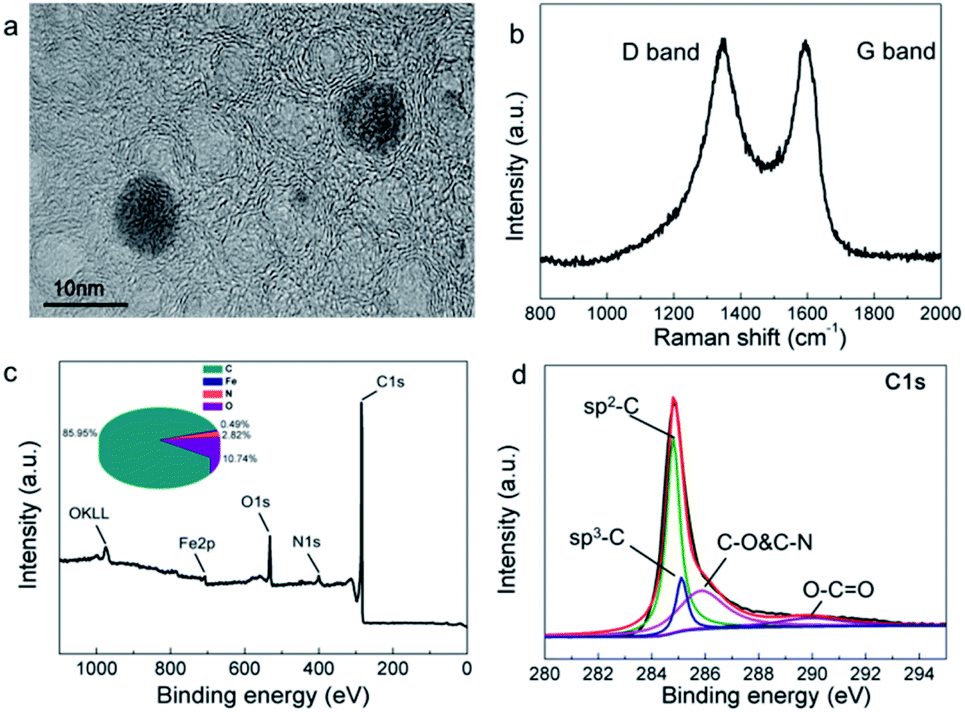 | ||
| Fig. 3 (a) High resolution TEM image, (b) Raman spectrum, (c) XPS spectrum and (d) C1s spectrum of FCA2. | ||
The chemical components of FCA2 were determined by XPS. As can be seen in Fig. 3(c and d) and S4(b–d),† the most abundant elements are C (85.95%) and O (10.74%), along with small amounts of N and Fe. The peaks at about 284.8 eV, 285.1 eV, 285.8 eV, and 289.9 eV represent SP2-C, SP3-C, C–O and C–N, and O–C![[double bond, length as m-dash]](https://www.rsc.org/images/entities/char_e001.gif) O, respectively, proving the existence of graphite carbon.20,27,28 The peaks at around 399.1 eV, 401.1 eV, 406.1 eV, 531.1 eV and 532.0 eV suggest pyridinic N, graphitic N, N–O, CO and C–O.29–31 Moreover, the peaks at about 707.6 eV and 710.9 eV confirm the presence of Fe(0) and Fe3C,28,32 which promotes the conversion of graphitic carbon and imparts magnetic properties to the final FCA PCM composite.
O, respectively, proving the existence of graphite carbon.20,27,28 The peaks at around 399.1 eV, 401.1 eV, 406.1 eV, 531.1 eV and 532.0 eV suggest pyridinic N, graphitic N, N–O, CO and C–O.29–31 Moreover, the peaks at about 707.6 eV and 710.9 eV confirm the presence of Fe(0) and Fe3C,28,32 which promotes the conversion of graphitic carbon and imparts magnetic properties to the final FCA PCM composite.
The chemical compositions and crystalline structures of the samples were characterized by XRD and FTIR (Fig. 4). The XRD pattern of eicosane shows peaks at 19.56°, 19.91°, 23.5°, 24.84° and 25.55°, belonging to the (010), (011), (105), (−101), and (110) crystal planes of β phase, respectively. The peaks at 7.23°, 10.58°, 13.91°, 39.81° and 44.56° respectively represent the (002), (003), (004), (220), and (207) crystal planes of α phase.33,34 These characteristic peaks are identical to the standard PDF card no. 45-1543 for eicosane, as inserted in Fig. 4. Also, in the XRD spectrum of FCA2, Fe3C was detected, matching well with the standard PDF card no. 35-0722. No new peaks appeared in the spectrum of FCA2-C20 except those of eicosane and FCA2, indicating that only physical connections exist between FCA and eicosane. However, it can also be seen that the intensities of the peaks at 7.23°, 10.58°, and 13.91° are obviously reduced in the FCA2-C20 XRD spectrum, representing that the FCA has an effect on the crystallization properties of the α phase in eicosane. For the FTIR spectrum of eicosane, the peaks of around 2843 cm−1, 2910 cm−1, and 2950 cm−1 are related to the C–H stretching vibration. The C–H bending vibration is reflected by the peak at about 1472 cm−1. Furthermore, the peaks at about 718 cm−1 and 3450 cm−1 represent the in-plane rocking vibrations of CH2 and –OH, respectively.35 The C–O, CO, and –OH peaks are also found in the FTIR spectrum of FCA2 at about 1105 cm−1, 1609 cm−1, and 3450 cm−1, respectively. While similar results occur in the FTIR spectrum of FCA2-C20, no new peaks other than those of FCA2 and eicosane appear. These results further demonstrate that FCA and eicosane are linked by physical interactions, which prevents the eicosane from flowing out of the FCA during the phase change process.
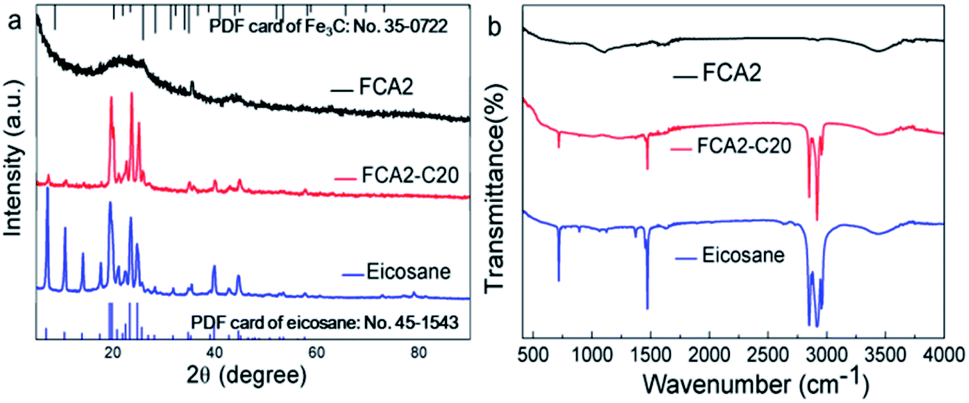 | ||
| Fig. 4 (a) XRD and (b) FTIR patterns of FCA2, FCA2-C20 and eicosane. | ||
Thermal properties and phase change behavior
Leakage tests were carried out to examine the shape stabilities of the FCA PCM composite samples by detecting their leakage performance during the phase change process. Specifically, the samples were heated to 80 °C for about 2 h on filter paper to ensure that the phase change process occurred. The liquid traces of leakage would be observed on the filter paper. Fig. S5† shows photographs of the samples at 25 °C and 80 °C. It is clear that the eicosane sample was completely melted into liquid at 80 °C and absorbed by the filter paper; meanwhile, all the FCA-based PCM composite samples remained solid, without residual leakage traces on the filter paper. These leakage tests indicate that FCA provides outstanding encapsulation ability; therefore, the FCA PCM composites have excellent shape stability even over the phase change temperature range.The thermal stabilities of eicosane and the FCA PCM composite samples were determined by TG measurements. The curves of TG and DTG are shown in Fig. 5(a), and the corresponding data are listed in Table S3.† There is one sharp decline in the TG curve of eicosane with the onset temperature of 275.4 °C, indicating the decomposition of eicosane. Similar results appear in the FCA PCM composite samples; however, the onset temperature of decomposition is slightly lower. This result may be caused by the physical interaction between eicosane and FCA, which slightly reduces the thermal stability of eicosane.36,37 The weight loss of eicosane is 95.94%, with losses of 15.96%, 57.01%, 82.32%, and 82.19% for FCA0-C20, FCA1-C20, FCA2-C20 and FCA3-C20, respectively. Generally, the weight loss is related to the amount of eicosane loaded in the FCA carrier. The eicosane ratios from FCA0-C20 to FCA3-C20 are 16.64%, 59.42%, 85.80% and 85.67%, respectively, calculated by the equation in Table S3.†
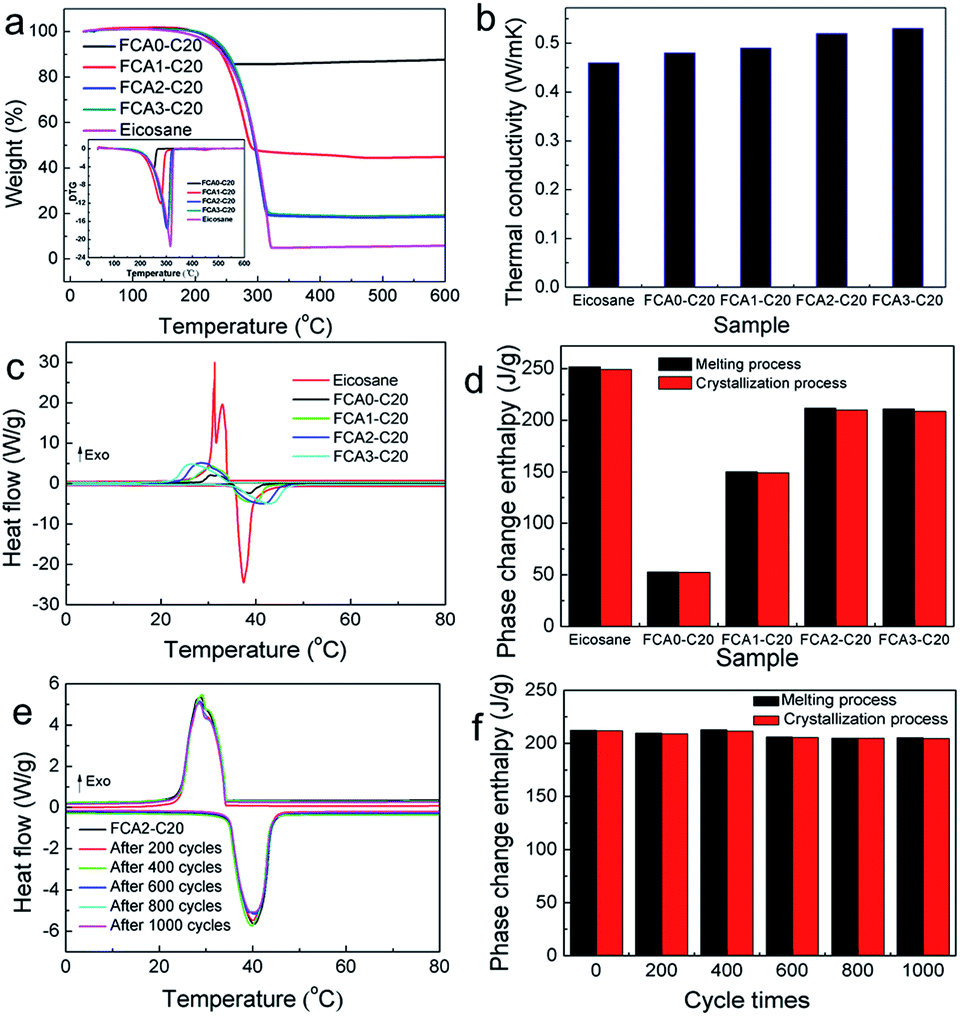 | ||
| Fig. 5 (a) TG and corresponding DTG (inset) curves, (b) thermal conductivity, (c) DSC curve and (d) corresponding column chart of eicosane and the FCA PCM composite samples; (e) DSC curves and (f) corresponding column chart of the FCA2-C20 sample during the thermal cycle stability test. | ||
The thermal conductivities of the eicosane and FCA PCM composite samples were evaluated by a thermal constant analyzer (Hot Disk), and the results are shown in Fig. 5(b). The thermal conductivity of eicosane was measured to be 0.46 W m−1 K−1. Meanwhile, the thermal conductivities of the FCA PCM composite samples increased to 0.48 W m−1 K−1–0.53 W m−1 K−1, showing an ascending trend from the FCA0-C20 to the FCA3-C20 samples. This may be related to the increasing degree of graphitization of the samples catalyzed by different amounts of iron during the preparation process, matching the results of Raman spectroscopy.38
The phase change properties of the FCA PCM composite were recorded by DSC, and the results are shown in Fig. 5(c and d). The corresponding phase change parameters are summarized in Table S4.† As we can see, there is one endothermic peak with the onset temperature of 35.80 °C during the melting process of eicosane. However, two exothermic peaks appear in the crystallization process with the onset temperature of 33.93 °C. This may be related to the different crystallization temperatures of the α phase and β phase of eicosane, as shown in the eicosane XRD pattern. In addition, the two exothermic peaks tend to become one peak in the FCA PCMs. The reason may be that the introduction of FCA influenced the crystallization of eicosane; this can be confirmed in the XRD pattern of FCA2-C20, in which the intensities of the peaks at 7.23°, 10.58°, and 13.91° are obviously reduced, representing that the FCA has an effect on the crystallization properties of the α phase in eicosane. As for the FCA PCM composite samples, no obvious differences are found in the onset temperatures of both melting and crystallization compared with eicosane, indicating that the FCA matrix has no effect on the phase change temperature of eicosane. The enthalpy of eicosane was determined to be 251.89 J g−1 in the melting process and 249.31 J g−1 in the crystallization process, as Table S4† shows. The enthalpies of the FCA PCM composite samples vary with the different FCA matrices, and the largest enthalpies are 211.66 J g−1 in the melting process and 209.80 J g−1 in the crystallization process for the FCA2-C20 sample, maintaining excellent thermal energy storage capacity compared with previous work.39–42
The thermal energy storage properties of the FCA PCM composite samples can be further determined by the encapsulation ratio (R) and encapsulation efficiency (E); these were calculated by the equations in the ESI,† and the results are listed in Table S4.†43 Generally, R indicates the content of PCMs loaded in the FCA carrier, and E represents the phase change efficiency during the thermal energy utilization process. As Table S4† shows, the largest R and E of 84.03% and 84.09% were obtained for the FCA2-C20 sample, revealing that this FCA PCM composite possesses the highest thermal energy storage capacity of eicosane. In addition, the loaded PCMs can entirely express their phase change properties due to the similarity of R and E. According to these results, it is easy to conclude that the FCA PCM composites possess excellent thermal energy storage ability and phase change working efficiency.
The thermal cycle stability of the FCA2-C20 sample was evaluated by a homemade automatic heating and cooling device. The sample was subjected to 1000 cycles, and the phase change properties were tested by DSC measurements every 200 cycles. As shown in Fig. 5(e and f), the DSC curves are basically consistent even after 1000 cycles, exhibiting stable phase change behavior. The corresponding data of the thermal cycle stability are listed in Table S5.† It can be found that the onset temperatures of the melting process and crystallization process are almost unchanged, and the phase change enthalpy slightly decreases by about 3% from 212.35 J g−1 to 205.23 J g−1 in the melting process and from 211.82 J g−1 to 204.67 J g−1 in the crystallization, respectively. These results suggest that the FCA PCM composite possesses outstanding thermal cycle stability and is promising in the application of long-term thermal energy storage.
Multi-responsive thermal energy conversion performance
To determine its responsive ability to various energy sources, the FCA2-C20 sample was exposed to different energy source fields, including light irritation, an electro field, and a magnetic field. In this process, different types of energy were converted into thermal energy stored in the FCA PCM composite system. To further demonstrate the thermal conversion ability of the FCA PCM composite for different energy sources, the following equations are proposed to evaluate the energy conversion efficiency.39,43,44 | (1) |
 | (2) |
Solar-thermal conversion performance
In order to evaluate the solar-thermal conversion performance, the light absorption capacities of eicosane and FCA2-C20 were firstly measured by UV-vis spectrophotometry. As shown in Fig. 6(a), it is obvious that the light absorption capacity of the FCA2-C20 sample is much better than that of eicosane in the wavelength range of 200 nm–800 nm. The results calculated according to the definition of absorbance indicate that the light absorption capacity of the FCA2-C20 sample is 97.7%–98.4% in this wavelength range, while it is less than 20% for eicosane. This is due to the fact that the FCA matrix is extremely sensitive to light, which enables the FCA PCM composite to capture the light more effectively and further convert it into thermal energy, which is beneficial to solar-thermal conversion.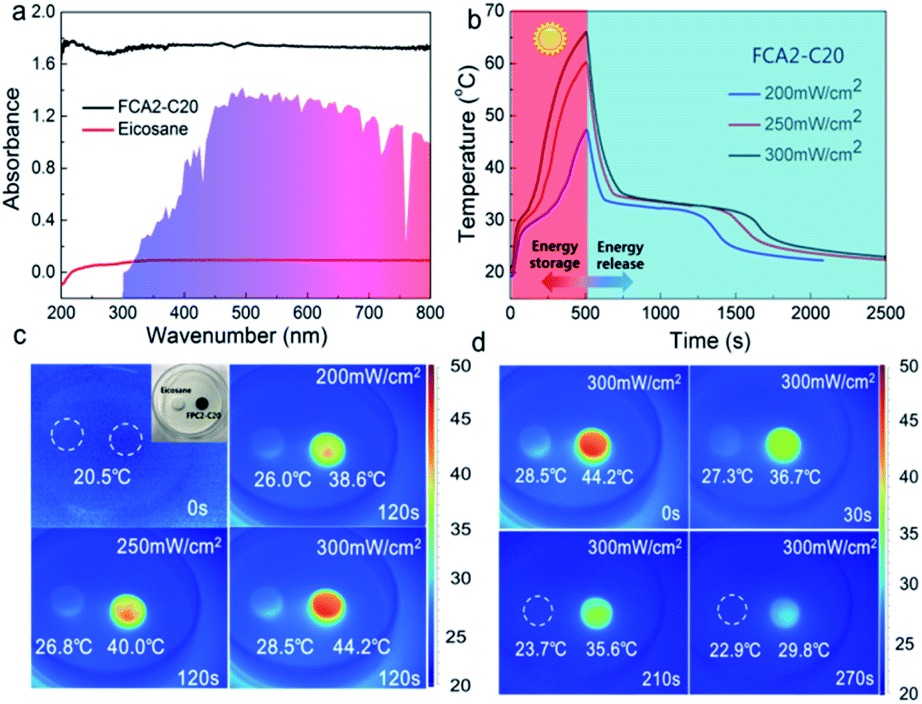 | ||
| Fig. 6 (a) UV-vis absorption spectra of eicosane and FCA2-C20, (b) solar-thermal conversion curves, (c and d) infrared imaging pictures of the solar-thermal conversion process of FCA2-C20. | ||
The solar-thermal conversion abilities of eicosane and an FCA PCM composite sample (FCA2-C20) were evaluated by a simulated light source with input power of 200 mW cm−2, 250 mW cm−2, and 300 mW cm−2 (Fig. S7(a)†). The corresponding temperature–time curves and temperature change images were obtained, as shown in Fig. 6(b–d) and S7.† As can be seen in Fig. 6(b) and S7,† the temperature of the samples increases with the light on and cools when the light is turned off. In addition, two “platforms” appear in the heating and cooling process of FCA2-C20 in the temperature range of 27 °C–34 °C, representing the melting and freezing of eicosane in the FCA PCM composite system, respectively. The rate of the temperature rise increases as the irradiation intensity is enhanced in the curves of both eicosane and FCA2-C20. The temperature of FCA2-C20 can reach about 47 °C, 60 °C, and 66 °C with irradiation intensities of 200 mW cm−2, 250 mW cm−2, and 300 mW cm−2 for 500 s, respectively, while that of eicosane reaches 33 °C, 38 °C, and 44 °C. This temperature change difference is owing to the excellent light absorption capacity of FCA2-C20, which accelerates the solar-thermal conversion process. The same phenomenon can be found in the infrared images, as Fig. 6(c) shows. The temperature rises faster as the illumination power increases, and the temperature of FCA2-C20 is much higher than that of eicosane during the solar-thermal conversion process. When the light is off, the temperature of FCA2-C20 drops rapidly until another “platform” appears, indicating the release of the stored latent thermal energy. Generally, the duration of the “platform” is proportional to the stored latent thermal energy. It is worth noting that the duration of the “platform” in the FCA2-C20 sample is much longer than that in the eicosane sample, suggesting that more latent thermal energy has been converted and stored in the FCA2-C20 sample during the solar-thermal conversion process. Similarly, the infrared images in Fig. 6(d) show that the temperature decreases to 36 °C–37 °C and is maintained for about 180 s when the light is off, confirming that the latent thermal energy release tends to make the temperature constant as well. All these results demonstrate that the FCA PCM composite can greatly improve the light absorption capacity and convert more solar energy into thermal energy for storage in the PCM system. The solar-thermal conversion efficiency of the FCA2-C20 sample was calculated, and the details are listed in Table S6.† As can be seen, the conversion efficiency of FCA2-C20 can reach 60.63%, 77.00%, and 93.32% with the light power of 200 mW cm−2, 250 mW cm−2, and 300 mW cm−2, respectively. Compared with the published results of solar-thermal conversion PCM composite systems, it can be found that the 93.32% conversion efficiency obtained in this work is impressive.6,45–48 These results further prove that the FCA PCM composite possesses outstanding solar-thermal conversion ability and great potential in the field of thermal energy conversion and storage.
Electro-thermal conversion performance
In addition to converting solar energy into thermal energy stored in the FCA PCM composite system, the electro-thermal conversion performance of the FCA2-C20 sample was investigated by a direct current power supply heating unit, as shown in Fig. S8.† The obtained temperature–time curves of different currents are summarized in Fig. 7(b). Fig. 7(a) describes the LED lights of “DICP” symbols illuminated with the FCA2-C20 sample in the circuit. When the eicosane sample was in the circuit, the “DICP” symbol lights were off (Fig. S8(b)†), indicating that a conductive path is created by the FCA continuous network structure in the FCA2-C20 sample. For the temperature–time curves of the FCA2-C20 sample, the temperature increases and decreases as the power is turned on/off. Also, in 200 s, the FCA2-C20 sample can reach about 152 °C, 106 °C, and 61 °C with input currents of 0.2 A, 0.15 A, and 0.12 A, respectively. In this process, latent thermal energy storage is involved from 34 °C to 39 °C (“platform”), where the release of this part of the energy happens in the cooling process. The rate of temperature increase is proportional to the input current, as proved by the infrared imaging pictures (Fig. 7(c)) as well. Also, the temperature can be maintained at around 37 °C for about 200 s even when the current is off, as shown in Fig. 7(d), confirming that the stored thermal energy is released immediately to prevent the temperature from dropping. These results prove that the electric energy can be converted into thermal energy and stored in the FCA PCM composite system. Electro-thermal conversion efficiency is also involved, as shown in Table S7.† It can be found that the electro-thermal conversion efficiencies of the FCA2-C20 sample achieve 47.89%, 70.11%, and 94.83% when the input currents are 0.12 A, 0.15 A, and 0.20 A, respectively, which are much higher than those in most previous work.9,12,33,49,50 Therefore, the FCA PCM composite can effectively convert electric energy into thermal energy and provide another conversion path for thermal energy conversion and storage.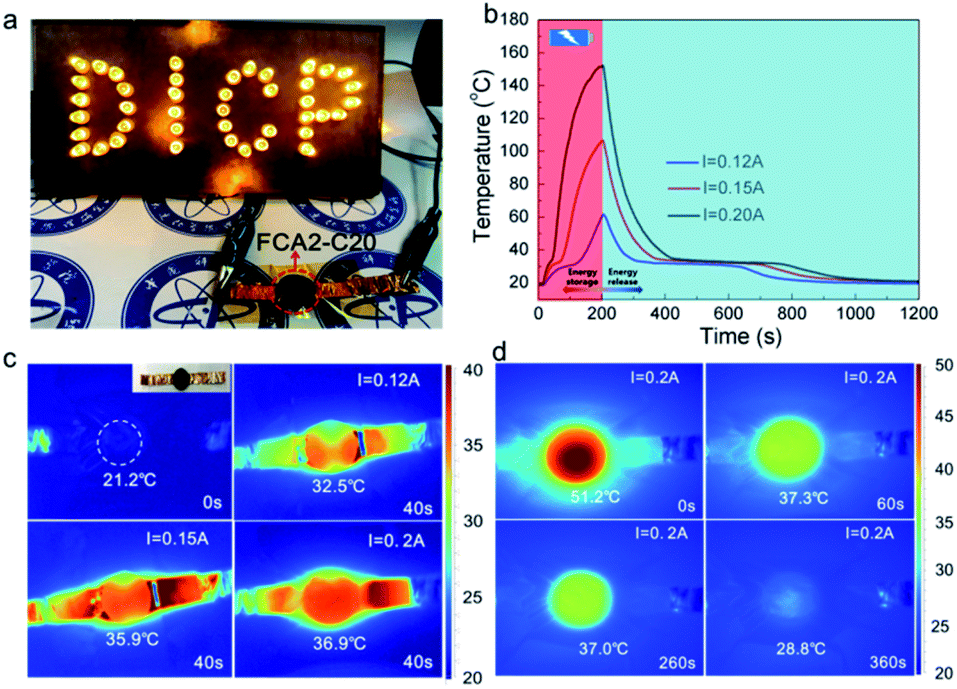 | ||
| Fig. 7 (a) LED lights of “DICP” characters with FCA2-C20, (b) electro-thermal conversion curves and (c and d) infrared imaging pictures of the electro-thermal conversion process of FCA2-C20. | ||
Magnetic-thermal conversion performance
Magnetic energy is also an energy source that can be converted into thermal energy by FCA PCM composite systems. In this process, magnetic materials can generate much heat in the alternating magnetic field provided by periodic electron motion (alternating current) due to Néel relaxation or Brownian relaxation.8,51 Then, the heat is transferred to the PCMs for the thermal energy storage. The amount of heat (A) generated by a magnetic material in one cycle of an alternating magnetic field is simply equal to the area of its hysteresis loop, as the following equation describes:52 | (3) |
The magnetic-thermal conversion ability was explored by an alternating magnetic field device generated by an alternating current, as shown in Fig. S9.† The magnetic properties of the FCA2-C20 sample were determined by PPMS at room temperature, and the result is shown in Fig. 8(a). A magnetic hysteresis loop appeared in the FCA2-C20 sample, indicating its superparamagnetic behavior. The inserted image of Fig. 8(a) shows that the FCA2-C20 sample can be attracted tightly to the bottle wall; meanwhile, it is simply scattered in the bottom of the bottle for the eicosane sample, also proving the magnetic characteristic of the FCA2-C20 sample. Also, this magnetic property is the functional basis of magnetic-thermal conversion. To further explore the magnetic-thermal performance of the FCA PCM composite system, the temperature–time curves of FCA2-C20 in the alternating magnetic field are summarized in Fig. 8(b). After exposing the FCA2-C20 sample in the alternating magnetic field for 350 s, the temperature increases to about 47 °C, 60 °C, and 111 °C with input alternating currents of 10 A, 12 A, and 14 A, respectively. In this process, with increasing input alternating current, the generated intensity of the alternating magnetic field is improved; thus, the temperature rises more rapidly. In addition, the “platform” in the heating process occurs from 33 °C to 40 °C, similar to the cooling process, which represents the latent thermal energy storage and release processes, respectively. These processes demonstrate that FCA PCM composites can change magnetic energy into thermal energy and store it within themselves. Moreover, these results fully explain that magnetic energy can also be applied to thermal energy conversion and further broaden the energy source choices of thermal energy storage as well.
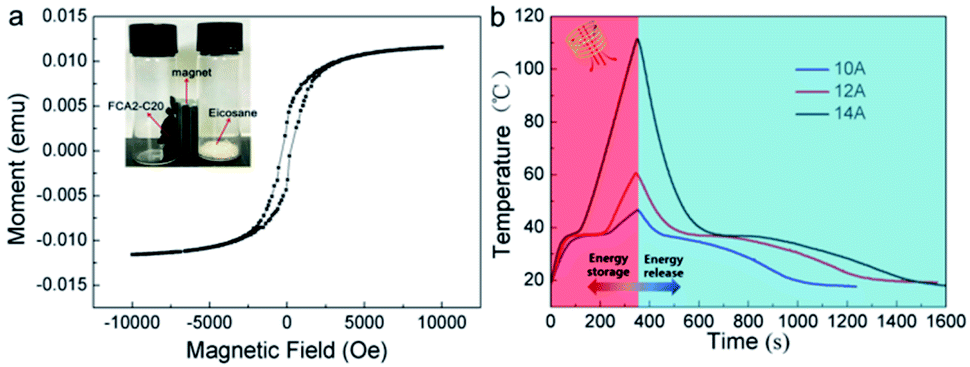 | ||
| Fig. 8 (a) Magnetic property curves of FCA2-C20 and image of FCA2-C20 attracted by a magnet (inset). (b) Magnetic-thermal conversion curves of the FCA2-C20 sample. | ||
Conclusions
In summary, we synthesized a multi-responsive PCM composite based on Fe-doped carbon aerogel with eicosane as the PCM for thermal energy capture and storage in multiple fields. The system responds well to solar energy, electric energy, and magnetic energy for thermal energy storage. These composite phase change materials exhibited excellent shape stability, thermal properties, cycle stability, and energy conversion ability. The phase change enthalpy can reach 211.66 J g−1 without leakage in the phase change process and remains basically unchanged even experiencing 1000 thermal cycle tests. The solar-thermal and electro-thermal conversion efficiencies can reach 93.32% and 94.83%, respectively. These PCMs simultaneously realize thermal energy capture from solar energy, electric energy, and magnetic energy, which enables them to meet the thermal energy storage requirements in various environments.Conflicts of interest
There are no conflicts to declare.Acknowledgements
This work was financially supported by National Natural Science Foundation of China (21903082, 21902157), Liaoning Provincial Natural Science Foundation of China (2019-MS-318, 2019-BS-239), Science and Technology Major Project of Liaoning Province (2019JH1/10300002), the Scientific Instrument Developing Project of the Chinese Academy of Sciences (YJKYYQ20190046), and DICP (DICP I202036). Q. Shi would like to thank Dalian Outstanding Young Scientific Talent Program. The authors acknowledge Prof. Tang Bingtao in Dalian University of Technology for the assistance of magnetic-thermal conversion measurement.Notes and references
- K. Sun, Y. Kou, H. Zheng, X. Liu, Z. Tan and Q. Shi, Sol. Energy Mater. Sol. Cells, 2018, 178, 139–145 CrossRef CAS
.
- Y. Kou, S. Wang, J. Luo, K. Sun, J. Zhang, Z. Tan and Q. Shi, J. Chem. Thermodyn., 2019, 128, 259–274 CrossRef CAS
- X. Chen, H. Gao, M. Yang, W. Dong, X. Huang, A. Li, C. Dong and G. Wang, Nano Energy, 2018, 49, 86–94 CrossRef CAS
- D. C. Hyun, N. S. Levinson, U. Jeong and Y. Xia, Angew. Chem., Int. Ed., 2014, 53, 3780–3795 CrossRef CAS
- D. G. Atinafu, W. Dong, C. Wang and G. Wang, J. Mater. Chem. A, 2018, 6, 8969–8977 RSC
- G. Qi, J. Yang, R. Bao, D. Xia, M. Cao, W. Yang, M. Yang and D. Wei, Nano Res., 2016, 10, 802–813 CrossRef
- L. Chen, R. Zou, W. Xia, Z. Liu, Y. Shang, J. Zhu, Y. Wang, J. Lin, D. Xia and A. Cao, ACS Nano, 2012, 6, 10884–10892 CrossRef CAS
- X. Fan, J. Xiao, W. Wang, Y. Zhang, S. Zhang and B. Tang, Polymers, 2018, 10, 585–596 CrossRef
- K. Y. Sun, Y. Kou, Y. W. Zhang, T. T. Liu and Q. Shi, ACS Sustainable Chem. Eng., 2020, 8, 3445–3453 CrossRef CAS
- Y. Zhou, X. Wang, X. Liu, D. Sheng, F. Ji, L. Dong, S. Xu, H. Wu and Y. Yang, Carbon, 2019, 142, 558–566 CrossRef CAS
- G. Li, G. Hong, D. Dong, W. Song and X. Zhang, Adv. Mater., 2018, 30, e1801754 CrossRef
- F. Xue, Y. Lu, X.-d. Qi, J.-h. Yang and Y. Wang, Chem. Eng. J., 2019, 365, 20–29 CrossRef CAS
- H. Wu, S. Deng, Y. Shao, J. Yang, X. Qi and Y. Wang, ACS Appl. Mater. Interfaces, 2019, 11, 46851–46863 CrossRef CAS
- Y. Li, Y. A. Samad, K. Polychronopoulou, S. M. Alhassan and K. Liao, J. Mater. Chem. A, 2014, 2, 7759–7765 RSC
- W. Wang, B. Tang, B. Ju, Z. Gao, J. Xiu and S. Zhang, J. Mater. Chem. A, 2017, 5, 958–968 RSC
- G. Sun, H. Xie, J. Ran, L. Ma, X. Shen, J. Hu and H. Tong, J. Mater. Chem. A, 2016, 4, 16576–16587 RSC
- G. Sun, L. Ma, J. Ran, X. Shen and H. Tong, J. Mater. Chem. A, 2016, 4, 9542–9554 RSC
- J. Li, N. Wang, J. Deng, W. Qian and W. Chu, J. Mater. Chem. A, 2018, 6, 13012–13020 RSC
- S. Esconjauregui, C. M. Whelan and K. Maex, Carbon, 2009, 47, 659–669 CrossRef CAS
- Y. Gong, D. Li, C. Luo, Q. Fu and C. Pan, Green Chem., 2017, 19, 4132–4140 RSC
- Z. L. Yu, S. Xin, Y. You, L. Yu, Y. Lin, D. W. Xu, C. Qiao, Z. H. Huang, N. Yang, S. H. Yu and J. B. Goodenough, J. Am. Chem. Soc., 2016, 138, 14915–14922 CrossRef CAS
- X. Zhang, Q. Lin, H. Luo and S. Luo, Appl. Energy, 2020, 260, 114278–114287 CrossRef CAS
- X. Chen, H. Gao, L. Xing, W. Dong, A. Li, P. Cheng, P. Liu and G. Wang, Energy Storage Mater., 2019, 18, 280–288 CrossRef
- J. Tang, M. Yang, F. Yu, X. Chen, L. Tan and G. Wang, Appl. Energy, 2017, 187, 514–522 CrossRef CAS
- M. Shaibani, S. J. D. Smith, P. C. Banerjee, K. Konstas, A. Zafari, D. E. Lobo, M. Nazari, A. F. Hollenkamp, M. R. Hill and M. Majumder, J. Mater. Chem. A, 2017, 5, 2519–2529 RSC
- B. Shen, Y. Li, W. Zhai and W. Zheng, ACS Appl. Mater. Interfaces, 2016, 8, 8050–8057 CrossRef CAS
- K. Zhu, H. Xu, C. Chen, X. Ren, A. Alsaedi and T. Hayat, Chem. Eng. J., 2019, 372, 304–311 CrossRef CAS
- M. Li, Y. Liu, L. Han, J. Xiao, X. Zeng, C. Zhang, M. Xu, P. Dong and Y. Zhang, J. Mater. Chem. A, 2019, 7, 17923–17936 RSC
- J. Gao, Y. Wang, H. Wu, X. Liu, L. Wang, Q. Yu, A. Li, H. Wang, C. Song, Z. Gao, M. Peng, M. Zhang, N. Ma, J. Wang, W. Zhou, G. Wang, Z. Yin and D. Ma, Angew. Chem., Int. Ed. Engl., 2019, 58, 15089–15097 CrossRef CAS
- R. Arrigo, M. Havecker, S. Wrabetz, R. Blume, M. Lerch, J. McGregor, E. P. Parrott, J. A. Zeitler, L. F. Gladden, A. Knop-Gericke, R. Schlogl and D. S. Su, J. Am. Chem. Soc., 2010, 132, 9616–9630 CrossRef CAS
- W. Wang, W. Liu, Y. Zeng, Y. Han, M. Yu, X. Lu and Y. Tong, Adv. Mater., 2015, 27, 3572–3578 CrossRef CAS
- H. Zhang, H. Cui, J. Li, Y. Liu, Y. Yang and M. Wang, Nanoscale, 2019, 11, 21532–21541 RSC
- Z. Liu, R. Zou, Z. Lin, X. Gui, R. Chen, J. Lin, Y. Shang and A. Cao, Nano Lett., 2013, 13, 4028–4035 CrossRef CAS
- Z. Guo, H. Liu, Y. Wu, X. Wang and D. Wu, React. Funct. Polym., 2019, 140, 111–123 CrossRef CAS
- M. Rezvanpour, M. Hasanzadeh, D. Azizi, A. Rezvanpour and M. Alizadeh, Mater. Chem. Phys., 2018, 215, 299–304 CrossRef CAS
- W. Kong, Y. Lei, Y. Jiang and J. Lei, J. Therm. Anal. Calorim., 2017, 130, 1011–1019 CrossRef CAS
- X. Zhang, Z. Huang, B. Ma, R. Wen, X. Min, Y. Huang, Z. Yin, Y. Liu, M. Fang and X. Wu, Thermochim. Acta, 2016, 638, 35–43 CrossRef CAS
- L. Peng, Z. Xu, Z. Liu, Y. Guo, P. Li and C. Gao, Adv. Mater., 2017, 29, 1700589 CrossRef
- G. Li, X. Zhang, J. Wang and J. Fang, J. Mater. Chem. A, 2016, 4, 17042–17049 RSC
- Y. Jiang, Z. Wang, M. Shang, Z. Zhang and S. Zhang, Nanoscale, 2015, 7, 10950–10953 RSC
- F. Yavari, H. R. Fard, K. Pashayi, M. A. Rafiee, A. Zamiri, Z. Yu, R. Ozisik, T. Borca-Tasciuc and N. Koratkar, J. Phys. Chem. C, 2011, 115, 8753–8758 CrossRef CAS
- Y. Cui, C. Liu, S. Hu and X. Yu, Sol. Energy Mater. Sol. Cells, 2011, 95, 1208–1212 CrossRef CAS
- Y. Zhang, X. Li, J. Li, C. Ma, L. Guo and X. Meng, Nano Energy, 2018, 53, 579–586 CrossRef CAS
- L. Zhou, Y. Tan, D. Ji, B. Zhu, P. Zhang, J. Xu, Q. Gan, Z. Yu and J. Zhu, Sci. Adv., 2016, 2, e1501227 CrossRef
- C. Lei, K. Wu, L. Wu, W. Liu, R. Du, F. Chen and Q. Fu, J. Mater. Chem. A, 2019, 7, 19364–19373 RSC
- J. Yang, P. Yu, L. S. Tang, R. Y. Bao, Z. Y. Liu, M. B. Yang and W. Yang, Nanoscale, 2017, 9, 17704–17709 RSC
- L. Zhang, R. Li, B. Tang and P. Wang, Nanoscale, 2016, 8, 14600–14607 RSC
- J. Yang, G.-Q. Qi, L.-S. Tang, R.-Y. Bao, L. Bai, Z.-Y. Liu, W. Yang, B.-H. Xie and M.-B. Yang, J. Mater. Chem. A, 2016, 4, 9625–9634 RSC
- W. Wu, X. Huang, K. Li, R. Yao, R. Chen and R. Zou, Appl. Energy, 2017, 190, 474–480 CrossRef CAS
- R. Chen, R. Yao, W. Xia and R. Zou, Appl. Energy, 2015, 152, 183–188 CrossRef CAS
- Y. Zhang, M. M. Umair, S. Zhang and B. Tang, J. Mater. Chem. A, 2019, 7, 22218–22228 RSC
- J. Carrey, B. Mehdaoui and M. Respaud, J. Appl. Phys., 2011, 109, 083921 CrossRef
Footnote |
| † Electronic supplementary information (ESI) available: The synthesis condition, photographs of samples, SEM and TEM images, N2 adsorption and desorption isotherms and corresponding pore size distributions results, Raman and XPS results, leakage test photographs, TG, DSC and thermal cycle stability data, the schematic of tangential method, the schematic and data of solar-thermal conversion, the schematic and data of elector-thermal conversion, the schematic of magnetic-thermal conversion. See DOI: 10.1039/d0ta09035b |
| This journal is © The Royal Society of Chemistry 2021 |