Atomic vibration as an indicator of the propensity for configurational rearrangements in metallic glasses
Huiyang
Fan
ab,
Zhao
Fan
 b,
Xiongjun
Liu
 *a,
Zhaoping
Lu
a and
En
Ma
*c
aState Key Laboratory for Advanced Metals and Materials, University of Science and Technology Beijing, Beijing, 100083, China. E-mail: xjliu@ustb.edu.cn
bDepartment of Materials Science and Engineering, Johns Hopkins University, Baltimore, MD 21218, USA
cCenter for Alloy Innovation and Design (CAID), State Key Laboratory for Mechanical Behavior of Materials, Xi’an Jiaotong University, Xi’an 710049, China. E-mail: ema.matscieng@gmail.com
First published on 12th July 2021
Abstract
In a metallic glass (MG), the propensity for atomic rearrangements varies spatially from location to location in the amorphous solid, making the prediction of their likelihood a major challenge. One can attack this problem from the “structure controls properties” standpoint. But all the current structure-centric parameters are mostly based on local atomic packing information limited to short-range order, hence falling short in reliably forecasting how the local region would respond to external stimuli (e.g., temperature and/or stress). Alternatively, one can use indicators informed by physical properties to bridge the static structure on the one hand, and the response of the local configuration on the other. A sub-group of such physics-informed quantities consists of atomic vibration parameters, which will be singled out as the focus of this article. Here we use the Cu64Zr36 alloy to systematically demonstrate the following two points, all using a single model MG. First, we show in a comprehensive manner the interrelation among common vibrational parameters characterizing the atomic vibrational amplitude and frequency, including the atomic mean square displacement, flexibility volume, participation fraction in the low-frequency vibrational modes and boson peak intensity. Second, we demonstrate that these vibrational parameters fare much better than purely static structural parameters based on local geometrical packing in providing correlation with the propensity for local configurational transitions. These vibrational parameters also share a correlation length similar to that in structural rearrangements induced by external stimuli. This success, however, also poses a challenge, as it remains to be elucidated as to why short-time dynamical (vibrational) behavior at the bottom of the energy basin can be exploited to project the height of the energy barrier for cross-basin activities and in turn the propensity for locally collective atomic rearrangements.
1. Introduction
In contrast to conventional alloys which solidify into crystalline structures upon cooling from their liquid counterparts, metallic glasses (MGs) result from the frustration of the crystallization process to form a metastable non-crystalline solid, which is often considered as a frozen-in state of liquids.1 Early MGs were typically obtained by rapid quenching of melts.2 In the 1990s, bulk MGs with unusually high glass-forming ability were developed,3,4 which can be produced via copper-mold casting and have inspired extensive research activities. Over the past decades, numerous bulk MGs with interesting physical, chemical and mechanical properties have been reported, such as Zr-, Fe-, Co-, Mg-, and Pd-based alloys.5 Meanwhile, intensive research has been ongoing to explore the structural origin of their unusual properties. Distinctly different from conventional alloys, MGs are amorphous solids, with no long-range order nor well-defined defects. The local structures inside MGs are inherently inhomogeneous, and depend strongly on the composition and the processing history of the alloy.6–9 Consequently, under externally imposed stimuli (e.g., temperature and stress) the responses of local regions are variable and influenced by the degree and length scale of the heterogeneities.8,10It has been generally believed that there are liquid-like regions inside MGs, which play the role of defects in crystalline metals to carry the relaxation and plastic flow. As a result, much attention has been focused on detecting “defects” inside MGs, by specifying the local environment of the atoms. For example, some local regions may contain more “free volume” and hence be more prone to local plasticity or relaxation.11,12 Later work has probed the local environment from the atomic packing perspective, in particular the short-range order (SRO) surrounding an atom. In this regard, the coordination polyhedra13,14 are the most elementary structural motifs.15 For example, in some MG systems icosahedra are found to be preferable and affect the glass transition dynamics significantly.16 These motifs are relatively stable and rigid, and their connection in space may form skeletons that help resist deformation.17 On the opposite side, there are also irregularly shaped coordination polydedra with excess volume and low symmetry, termed ‘geometrically unfavored motifs’ (GUMs).18 These GUMs are unstable and more likely to evolve under applied stimuli.18 In lieu of inspecting the coordination polyhedra, one can also monitor the degree of local ordering by investigating the bond orientation order,19 local five-fold symmetry (LFFS),20 and spherical periodic order or local transitional symmetry,21,22 even though such a simple index may not be able to tell apart different local atomic packing environments.23,24 Beyond SROs, attempts have also been made to describe the structural correlations on a medium-range length scale and beyond.25,26 This has been done mostly for the connectivity of representative polyhedra/clusters, sharing vertices, edges or faces, to explain the structural stability during the glass transition26,27 or rigidity of the backbone.28 However, a simple and yet robust indicator to quantify the medium-range order (MRO) remains sorely missing.
Despite all these efforts, it is now generally realized that the correlation between any of these static structural indicators and local properties is unlikely to be satisfactorily strong. This is partly because the property variations are not controlled by SRO alone, and the degree of order and coordination in the medium range (e.g., up to 2 nm) and beyond is difficult to decipher and quantify.29,30 For example, the applicability of free volume is questionable, as the atomic relaxation involves not only excess volume, but also compressed ones.15,31 Similarly, shear transformations undergo both volume reduction and dilation during deformation. In general, the structural features influence the properties in a rather complex way, one that is difficult to quantify using a single hand-crafted indicator. In other words, while it is desirable to be able to predict properties solely from the (local) atomic configuration, current simple descriptions of the packing environment appear to be too simplified to be adequate.
Research has also been progressing along a different line of thinking, to develop parameters that are informed by physical and mechanical responses, in addition to being related to the local packing structure. Such indicators include atomic-level stresses,32,33 the configurational potential energy,34–36 local elastic moduli,37 the local yield stress,38,39 thermal energy fluctuation40 and the thermal activation energy barrier.41,42 In other words, these parameters are physics-oriented, mainly based on the knowledge of interparticle interactions (often through atomic potentials and extensive computer simulations). In particular, recent experiments and simulations have developed several ways to take dynamics information into account. For example, Harrowell et al. demonstrated that the long-time dynamical behavior of a particle can be well inferred from its short-time dynamics, while it is not readily accessible from its geometric free volume.43,44 Liu et al. defined the particles with faster dynamics as flow units, where the local region is more likely to yield under a small cyclic loading stress.45 The Debye–Waller factor (DWF) is often used to measure the degree to which the local structure is constrained by its surroundings, i.e., the cage dynamics of structural relaxation.46 Note that within a short timescale when topological rearrangement is infrequent, the local Debye–Waller factor is primarily determined by the local configurations. A similar indicator is the atomic mean-square displacement (MSD), which measures the displacement of an atom from its initial position. The glassy state exhibits a plateau of the MSD, before the atom breaks the cage of local atomic vibration and enters the diffusive regime. In terms of short-time dynamics, several unusual vibrational properties have been noticed for glasses. Among them, an anomalous enhancement at low frequencies on the vibrational density of states (VDOS) spectrum has been widely observed in experiments; this is the so-called boson peak (BP). Also, soft modes (quasi-localized low-frequency vibrational modes)18,47 have been identified and are believed to contribute to the BP: these additional modes are localized at groups of atoms that move collectively. Meanwhile, the local regions where particles have large MSD and low shear modulus are soft domains that participate more in the low-frequency vibrational modes.48–50 These ‘soft spots’ have been observed to frequently coincide with local regions where shear transformations take place.18 Since the quasi-localized modes are resonantly coupled with transverse phonons, Yang et al. proposed a structural parameter termed the orientational order to describe the most probable direction of the transverse vibration; the magnitude of this parameter scales linearly with the BP intensity.51 Also, it is tempting to speculate that the BP intensity is closely related to the degree of defectiveness. Experimentally, it has been proven that severe plastic deformation would lead to an obvious enhancement of the BP, due to the formation of shear bands. After subsequent annealing, the BP would weaken.52,53 Luo et al. recorded the BP fluctuation depending on the thermal history of glass.54 All these suggest that the BP intensity may also correlate well with the local properties.
These ideas in recent years, as well as the hints already in the literature for the various correlations, bring forth two pressing needs. First, it will be useful to interrogate and sort out how these dynamics parameters are interrelated. In the following, we will assess for each particle the participation in the low-frequency vibrational modes and the contribution to the BP intensity, and link them with the vibrational amplitude (MSD) and flexibility of the atom. Second, it will be of interest to systematically evaluate how good these vibration-dynamics indicators are, relative to purely structural parameters, in connection with configurational rearrangements in relaxation and shear transformations. To this end, we will compare the power of the various vibrational parameters for predicting the local properties, including the local shear modulus, atomic non-affine displacements as a measure of the propensity for shear transformations, and the local activation energy as a metric for the tendency towards thermally induced relaxation. In other words, this focus article aims to provide a timely resolution of the two needs above. We intentionally make our summary easy to follow, by examining each and every quantity of interest all in a single Cu64Zr36 MG model.
2. Atomic vibration characteristics
We chose the Cu64Zr36 alloy as the model MG for the following reasons: first, it is a typical binary alloy with good glass-forming ability,55 which has been widely investigated in both experimental and theoretical studies.56,57 Second, the empirical embedded atom potentials for this alloy have been widely used for studying atomic structures, and dynamic and mechanical properties.16,29,58 All the simulations in our work were performed using the LAMMPS package.59 The system containing 10![[thin space (1/6-em)]](https://www.rsc.org/images/entities/char_2009.gif) 000 atoms was melted and fully equilibrated at 2500 K using a Nose–Hoover thermostat to get the liquid state, and then quenched to 300 K at a cooling rate of 1 × 10⁹ K s−1 with a time step of 2 fs to get the glass state. The external pressure was held at zero during the quenching process, and periodic boundary conditions were applied in all three dimensions.
000 atoms was melted and fully equilibrated at 2500 K using a Nose–Hoover thermostat to get the liquid state, and then quenched to 300 K at a cooling rate of 1 × 10⁹ K s−1 with a time step of 2 fs to get the glass state. The external pressure was held at zero during the quenching process, and periodic boundary conditions were applied in all three dimensions.
2.1 Atomic vibration amplitude and flexibility volume
The mean-square displacement (MSD) is a well-known measure of the deviation of the position of a particle with respect to its reference position over time. The MSD of the ith particle in a system is given by ri2 = 〈(xi(t) − xi(0))2〉, where xi(t) is the position of the ith particle at time t, xi(0) the reference position, and 〈⋯〉 represents an ensemble average. A larger MSD value reflects a larger amplitude of displacement and faster dynamics of the particle. In the MG state the MSD exhibits a plateau over a short time period before leaving the cage to enter the diffusive regime. This constrained oscillation of the particle is taken to be its vibrational MSD. We calculated the vibrational MSD of each particle inside the sample equilibrated at 300 K under a microcanonical ensemble. The calculated ri2 was then averaged over 100 independent runs, all starting from the same configuration but with different momenta assigned randomly from the appropriate Maxwell–Boltzmann distribution.By combining the atomic vibrational MSD with the atomic volume, Ωa (obtained from the Voronoi tessellation60), a new parameter termed the flexibility volume (vflex) can be set up.61 The atomic vflex,i is defined as vflex,i = ri2⋅ai, where  is the atomic spacing. The magnitude of vflex,i reflects the flexibility in space, or wiggle room of the atom in question. Both vflex and ri2 show a non-Gaussian distribution as seen in Fig. 1. The long tail corresponds to the atoms with the largest vibrational amplitude or atomic spacing in the system. The simulated MSD and flexibility volume are found to be consistent with reported values in the literature.61,62 Based on Debye theory, the flexibility volume can be derived from measurable quantities including the vibrational MSD, Debye temperature and shear modulus. The Debye temperature can be expressed as63
 . Here h is the Planck constant, kB is the Boltzmann constant,
  and
and  are the longitudinal and transverse velocities, respectively (B is the bulk modulus, and G is the shear modulus), and
  is the mass density. There is also a scaling relation between the Debye temperature and vibrational MSD,64 as
  , where ℏ is the reduced Planck constant, T is the temperature, m is the averaged atomic weight, and 〈r2〉 is the averaged vibrational MSD. If we take an approximation of vl = 2vs for MGs, a linear relationship between the averaged vflex and shear modulus G can be established,61i.e.,
  , where C is a universal constant. Besides, the percent change of vflex caused by structural relaxation or rejuvenation in a given MG is also comparable to that of the modulus.65 This quantitative scaling with the modulus is an advantage over that with the vibrational MSD, making vflex,i particularly useful when it comes to characterizing the rigidity of the surroundings61,65,66 and assessing the barrier (which scales with G) encountered in shear transformations.
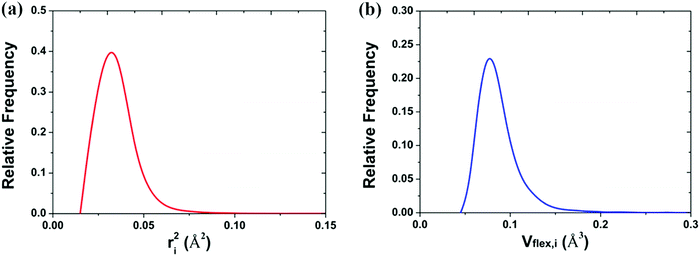 | ||
| Fig. 1 Distribution of the (a) vibrational mean square displacement (ri2) and the (b) flexibility volume (vflex,i) in a Cu64Zr36 MG. | ||
2.2 Low-frequency vibrational modes and boson peak
There are other characteristic vibrational properties that can be obtained from the VDOS spectrum. The frequency (ω)-dependent VDOS g(ω) of target atomic groups was calculated from the Fourier transform of the velocity auto-correlation function (VACF). The system was equilibrated at 300 K and ambient pressure. The VACF of the whole system was subsequently measured at 300 K in the micro-canonical ensemble. 100 independent runs were generated and averaged to reduce the noise. To specify the contribution of each atom, we also calculated the atomic VACF, each being an average of at least 50![[thin space (1/6-em)]](https://www.rsc.org/images/entities/char_2009.gif) 000 calculations. After obtaining the VDOS, the BP intensity (IBP) contributed by each particle and the whole system was obtained by locating the maximum in the plot of the reduced VDOS g(ω)/ω2. We also confirmed that the weighted average of the partial VDOS is equal to the total VDOS of the whole system.
000 calculations. After obtaining the VDOS, the BP intensity (IBP) contributed by each particle and the whole system was obtained by locating the maximum in the plot of the reduced VDOS g(ω)/ω2. We also confirmed that the weighted average of the partial VDOS is equal to the total VDOS of the whole system.
In order to evaluate the atomic participation fraction in the soft modes, we adopted normal mode analysis of the sample by diagonalizing the dynamical matrix of the inherent structure obtained using the conjugate-gradient method. The participation fraction of particle i in eigenmode eω is defined by pi = |eiω|2, where eiω is the corresponding polarization vector of particle i. The participation fraction in the low-frequency vibrational modes of each atom was calculated by summing pi of the 1% lowest-frequency modes in the spectrum of the dynamical matrix. This summation Pi measures the degree of involvement of each atom in all the softest modes.
3. Correlations between the vibrational parameters
We now illustrate that the vibrational properties introduced in the last section are closely interrelated. First, the atomic contributions to the BP intensity and to soft modes are correlated, as shown in Fig. 2. By and large, atoms that participate more in the low-frequency vibrational modes also contribute more to the BP intensity. It supports the idea that quasi-localized low-frequency vibrational modes constitute the BP,67 a notion that has led to intensive research on the structural origin of the BP.68,69 For example, density or elastic fluctuations,68,70 excess free volume,52 and locally unfavored motifs associated with larger MSD71 have been linked to the domains in a quasi-continuum region where the transverse phonons produce additional modes.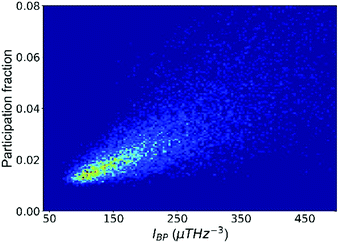 | ||
| Fig. 2 The participation fraction in the low-frequency vibrational modes correlates with the contribution to the boson peak intensity (IBP). The plot includes all atoms in the Cu64Zr36 system. | ||
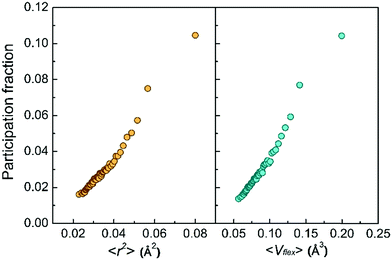
Second, the low-frequency vibrational modes go hand in hand with the vibration amplitude. Fig. 3 shows the monotonic increase of the atomic participation fraction in the low-frequency vibrational modes with increasing atomic MSD or with the flexibility volume. The most flexible atoms can be easily separated from the rest by their exceptional contribution to the low-frequency vibrational modes, although the separation is not as obvious for atoms with smaller MSD or flexibility.
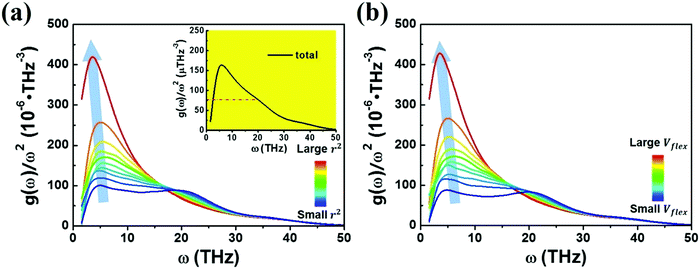
We next examine a similar correlation in the vibration spectra. Fig. 4 shows how the partial reduced VDOS changes with increasing MSD or flexibility. The atoms in the system were sorted into 10 groups by the value of ri2 or vflex,i. IBP is the most pronounced for the top 10% flexible atoms, but down to almost the Debye level for the most inflexible group of atoms. The inset in Fig. 4a is the global VDOS of the system, showing the BP frequency (ωBP) at a frequency of 5 THz, where the dash line marks the estimated Debye level. ωBP shifts toward lower frequency as the coarse-grained MSD or vflex increases, as shown in Fig. 4a and b.
Note here that while the most flexible group of atoms, in terms of their MSD or flexibility, contributes the most to the BP intensity, atoms with lower MSD or flexibility do not necessarily contribute less to the BP. We noticed that Zr atoms have lower averaged MSD and vflex when compared with Cu atoms, but give rise to higher partial BP intensity. This observation poses a challenge to the idea of an absolute correlation between the atomic MSD and BP intensity. In fact, it has been suggested that the BP intensity depends on not only the vibrational MSD, but also the element characteristics (i.e., atomic mass, radius and bonding features). Recently, Zhang et al. proposed that there is a quantitative correlation between the BP intensity and atomic mass weighted MSD for different MGs, written as  , where C is a universal constant, m is the atomic mass, 〈r2〉 is the averaged vibrational MSD, kB is the Boltzmann constant and T is the temperature.72 Besides, the parameter ‘orientational order’ proposed by Yang et al. also achieved a decent correlation linking the BP intensity with both the vibrational MSD and atomic species: the distance from the center atom to the farthest vertex of its coordination polyhedron is proportional to the contribution of local structure to the BP enhancement.51 Moreover, Ding et al. noticed that there is a strong correlation between vflex and the vibrational anisotropy,61 the latter originating from the local structural anisotropy. Actually, our results indicate that any two of the vibrational parameters are strongly correlated, which will be demonstrated in Fig. 2–4. However, since a causal relationship between the parameters is often lacking, it is natural to raise the question as to which parameter can be more robustly correlated with the properties.
4. Predicting stress- and thermal-induced relaxation from vibrational parameters
4.1 Local shear transformation propensity
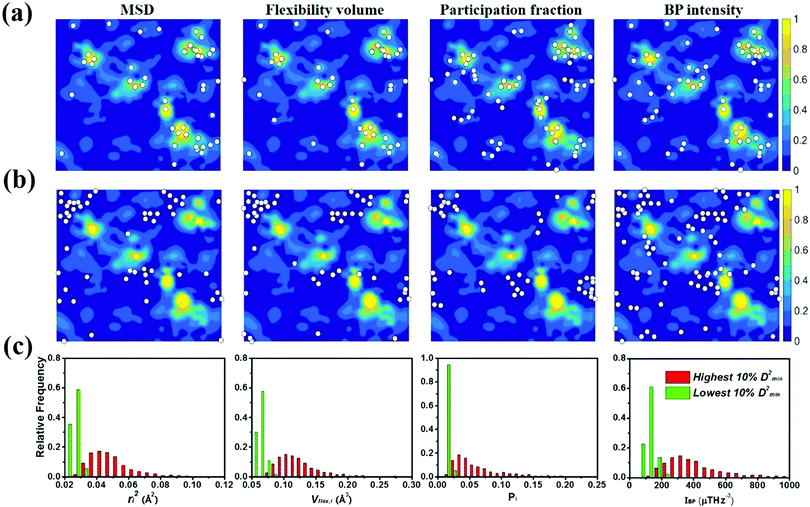
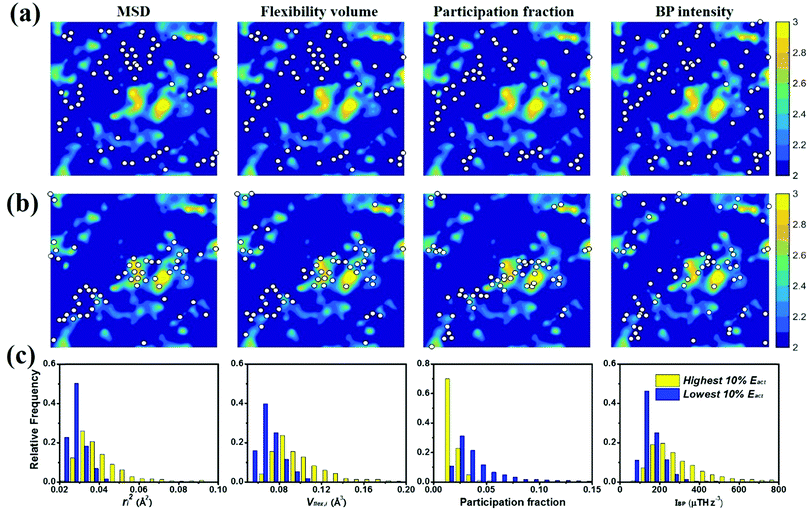
To gauge the degree/extent of shear transformations upon deformation, the non-affine atomic displacement D2min for each atom was calculated after athermal quasi-static shear to a global strain of 5%. It is determined by accumulating ΔD2min with a step of shear strain Δγ = 0.1%. The shear was applied along six different loading directions, to average out variations due to direction-dependent loading. The colored contour maps shown in Fig. 5a and b present the spatial distribution of the normalized atomic displacement D2min (by dividing it with a threshold, above which the atom is regarded as having participated obviously in a local shear transformation), each slab having a thickness of 3 Å (roughly the average atomic spacing). The sites with large D2min percolate in space. The white spots superimposed onto Fig. 5a correspond to atoms with the largest 10% of each vibrational indicator. These white spots overlap well with the regions most prone to shear transformations. The panels in Fig. 5b, on the other hand, display the locations of atoms with the lowest 10% of each indicator as the white spots. They obviously tend to distribute in the least shear-transformed regions. Taking Fig. 5a and b together, the correlation is very clear, regardless of which of the four vibrational parameters is used. This is not surprising, as we have already demonstrated in the preceding section that these vibration parameters themselves are strongly interrelated (for example, it was shown before that the BP49 and soft modes73,74 are associated with local regions where atoms have high flexibility61). As another way to demonstrate the contrast, Fig. 5c uses bar charts to plot the population distribution as a function of the magnitude of each vibrational indicator, contrasting the atoms with the highest versus those with the lowest 10% D2min. These two contrasting groups are obviously well separated by any of the four indicators.4.2 Local shear modulus
We also calculated the shear modulus (G) at ambient temperature by using the fluctuation method. The simulation box was subdivided into 1000 small cubes, to calculate the local G. For a system at equilibrium, the relation between the stress fluctuations and the local elastic modulus tensor Cijkl is obtained from the second derivative of the free energy with respect to strain, Cijkl = CSijkl + CBijkl + CKijkl, where CSijkl is the stress fluctuation term, CBijkl is the Born term and CKijkl is the kinetic contribution. The subscripts i, j, k, l indicate the Cartesian components. ,
,  , and
, and  . m, n are particle indices, V is the volume of interest, rmn is the separation between two interacting particles m and n, and P denotes the local stress tensor. The local shear modulus of a selected region was evaluated as
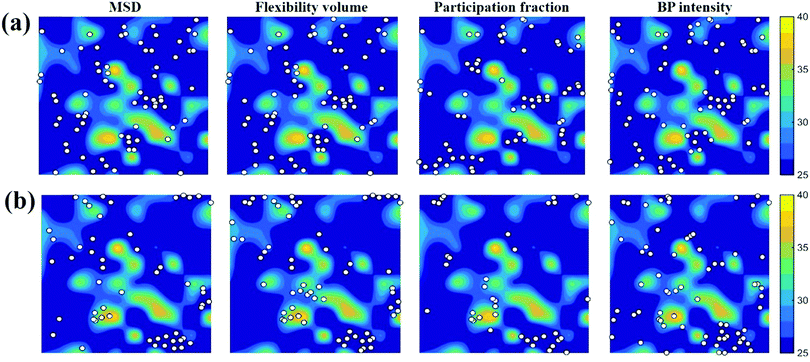
  . For MG systems, C44 = C55 = C66. The heterogeneous distribution of local G is shown in Fig. 6. The white spots are atoms with the largest 10% (Fig. 6a), or the lowest 10% (Fig. 6b), of each vibrational indicator. In Fig. 6a, the white spots tend to avoid areas of high G, preferentially residing in regions of lower G. In Fig. 6b, the white spots tend to be in the regions of lower G. Actually, the findings are expected. For example, it is known that the DWF reflects the stiffness: the high-frequency plateau shear modulus can be directly related to the DWF through the Langevin model for Brownian motion.75 Also, because vflex directly scales with G, as discussed earlier, it is not surprising to observe that vflex fares better than the other indicators in the correspondence with the local G. It should be pointed out that the local shear modulus here was calculated from a group of atoms (∼10 atoms) within a local region (i.e., it is a locally averaged quantity), whereas the vibrational parameters and local properties were all calculated for each atom. As such, it is reasonable to see a slightly weaker correlation between such a shear modulus and the atomic-level vibrational parameters, when compared with other correlations that are on the atomic scale.
4.3 Activation energy for thermally induced relaxation
A schematic picture of the potential energy landscape (PEL) is often used to help understand the transition between configurational states. From the PEL perspective, thermally activated β relaxations are identified as hopping between neighboring sub-basins confined within a meta-basin, whereas the transitions between meta-basins are known as the percolation of β relaxations, to form the global α relaxation. Here we employed the activation–relaxation technique (ART)76 for searching for the saddle points and relaxation pathways of local regions, each process corresponding to a β event. The initial perturbations in the ART were introduced by applying random displacement of a small group of atoms (a specified atom and its nearest neighbors). The magnitude of the displacement was fixed, while the displacement direction was randomly chosen. When the curvature of the PEL surpasses the pre-set threshold, the system is pushed towards the saddle point using the Lanczos algorithm. The saddle point is accepted if the overall force of the total system is below 0.01 eV Å−1. The corresponding activation energy Eact is thus the difference between the saddle point energy and the initial state energy. For each atom at the center, we employed 100 ART searches with different random perturbations. The contours in Fig. 7a and b are colored by the value of Eact. The white spots in Fig. 7 are defined in the same way as those in Fig. 5 and 6. The unstable (in terms of the tendency for vibrational excursion) sites predicted by the white spots in Fig. 7a tend to locate in areas of the lowest Eact, while the stable sites in Fig. 7b overlap well with the areas of the highest Eact. In Fig. 7c, we compare atoms with the highest and the lowest 10% Eact: they can be separated by each of the four vibrational parameters.5. Spatial heterogeneities and their correlations
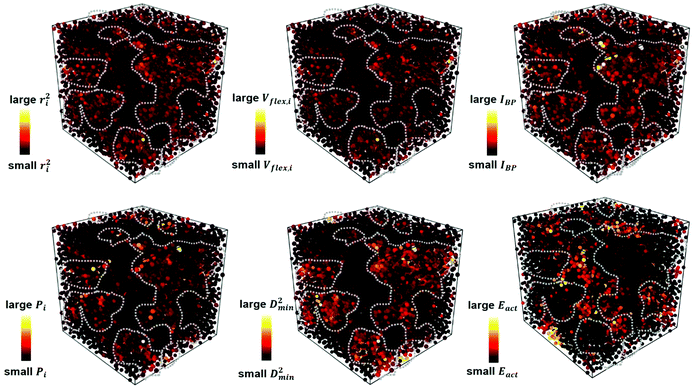
Each of the vibrational properties, and the local D2min and Eact responses, shows spatial heterogeneity. Atoms corresponding to different magnitudes of the indicator tend to aggregate and connect in 3D space, as demonstrated in the 3D colored maps in Fig. 8 for the MG simulation box. The higher the magnitude of the vibrational parameters, the brighter the color in the diagram. For easy comparison, we encircle the most flexible region identified by the highest values of ri2, vflex,i, IBP,i and Pi, using dotted lines. These lines are then superimposed onto the 3D box showing D2min and Eact. We observe that the regions enclosed by these lines coincide very well with those having the highest D2min and Eact.Following the definition of the spatial autocorrelation function, the correlation coefficient ρ of each parameter (or local property) was calculated via , where
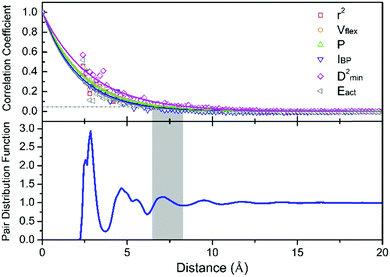
 ![[x with combining macron]](https://www.rsc.org/images/entities/i_char_0078_0304.gif) denotes the averaged value of each indicator, xr0 is the value at the reference position and xr0+r is the value at the position a distance r away from the reference. ρ is calculated for all appropriate pairs that are distance r apart from each other. As shown in Fig. 9, ρ decays exponentially with respect to r. An exponential covariance function ρ(r) = exp(−3r/ε) is used to describe the decay (solid line), where ε is the correlation length defined to be the smallest distance beyond which ρ is less than 0.05, as listed in Table 1. It ranges from 6.4 to 7.2 Å, falling within the length of the 3rd coordination shell as marked by the gray shade on the pair distribution function curve. The correlation length for Eact is 6.0 Å, around the position of the 2nd valley in the pair distribution function, while D2min has the largest correlation length of 8.5 Å, which goes beyond the 3rd coordination shell.
denotes the averaged value of each indicator, xr0 is the value at the reference position and xr0+r is the value at the position a distance r away from the reference. ρ is calculated for all appropriate pairs that are distance r apart from each other. As shown in Fig. 9, ρ decays exponentially with respect to r. An exponential covariance function ρ(r) = exp(−3r/ε) is used to describe the decay (solid line), where ε is the correlation length defined to be the smallest distance beyond which ρ is less than 0.05, as listed in Table 1. It ranges from 6.4 to 7.2 Å, falling within the length of the 3rd coordination shell as marked by the gray shade on the pair distribution function curve. The correlation length for Eact is 6.0 Å, around the position of the 2nd valley in the pair distribution function, while D2min has the largest correlation length of 8.5 Å, which goes beyond the 3rd coordination shell.
| r i 2 | v flex | P i | I BP | D 2min | E act | |
|---|---|---|---|---|---|---|
| ε (Å) | 7.0 | 7.2 | 6.9 | 6.4 | 8.4 | 6.0 |
To quantify the size of the local region participating in structural rearrangement, we roughly estimated the activation volume Vact involved in thermal activation or shear transformation via Vact = ε3. As such, the number of atoms involved in Vact is around 14 and 38 for the thermal activation (Eact) and shear transformation events (D2min), respectively. As reported by Fan et al.,77 thermal activation only involves a small number of atoms, typically less than 10 atoms, while a single shear transformation zone (STZ, defined as a localized group of atoms in the noncrystalline solid that shoulder almost all of the shear strains in response to applied stresses)78 usually contains more atoms, typically around 20 or 25–33 atoms.79,80 It is generally accepted that a single β event that represents hopping between sub-basins on the PEL is akin to an STZ in deformation. The correlation length of Eact can be smaller than that of a shear transformation (D2min measures the local irreversible shear transformations induced by the triggers), because the latter inevitably involves the surroundings and possibly initiates an autocatalytic process. Therefore, it is reasonable to observe a larger correlation length of D2min than that for Eact.
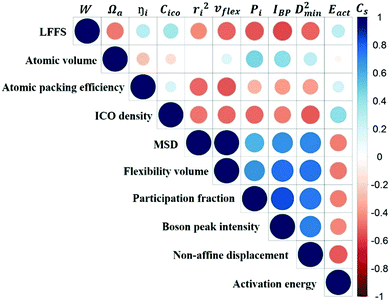
To quantify the accuracy of using vibrational parameters to predict local atomic rearrangement, we employed Spearman's rank correlation coefficient Cs to specify the monotonic relationship between each two variables.81 A monotonically increasing correlation between two quantities gives Cs = 1 and anti-correlation gives Cs = −1; Cs = 0 indicates the absence of correlation. In this comparison, we also include several previously used structural parameters. For example, we include local five-fold symmetry (LFFS), which was used to correlate the structure with deformation and liquid dynamics.23,82,83 LFFS can be evaluated as  , where n5i is the number of 5-edged polygons in Voronoi polyhedron type i, nki is the number of k-edged polygons in Voronoi polyhedron type i and Pi is the fraction of polyhedron type i. Another useful structural indicator is the icosahedra (ICO) density Cico,28 as full icosahedra are the dominant motif in Cu64Zr36. Here, the ICO density is defined as
  , where nMC is the number of M-centered icosahedra and nM is the total number of M atoms in the Voronoi cluster of the atom at the center. As such, Cico is a structural parameter covering information about medium-range atomic packing around the atom of interest, including the environment of the coordinated atoms in terms of their first-nearest neighbor coordination (extending up to the 2nd shell of the center atom) and reflecting how likely the ICOs are to connect/interpenetrate. The next structural parameter is the atomic volume (Voronoi volume), or atomic packing efficiency
  , where Va and Vu denote the volume occupied by the atoms inside a cluster and the total volume of the cluster,84 respectively.
Fig. 10 is the matrix that displays the Spearman's correlation between any two of the variables. We observe from this matrix that the predictive power of structural parameters is generally weaker than that of vibrational parameters. The correlation between structural and vibrational parameters is weak, stressing again that structural descriptors based on short-range information would not be sufficiently robust to predict the dynamics.
v flex gives the highest Cs for correlating with D2min, as well as the most negative Cs with Eact (high flexibility corresponding to a low activation barrier), exhibiting the best predictive power for the responses of the local structure under applied stress or temperature. This is not surprising as vflex was designed to capture both the atomic packing and dynamical information. From its definition, vflex can be taken as a volume-scaled vibrational MSD. The vibrational MSD term is similar to the DWF that evaluates the flexibility of local structures in supercooled liquids, corresponding to the curvature of the basin on the PEL. Although there is an overall trend of MGs with larger Ωa giving smaller elastic modulus, there is no one-to-one correspondence between the local structure and its elastic modulus. As known from the Lindemann criterion of melting, the mobility of atoms not only depends on the travel distance of the particle, but also the atomic spacing between the rearranging particles. vflex combines these two together, and has an explicit physical relation with G, which is widely regarded as a key baseline property correlating with many properties for MGs.58,85,86 This lays the foundation for a credible forecast of properties using vflex. Another point worth noting is that vflex can be calculated from the MSD, Debye temperature or shear modulus, which are experimentally measurable.
6. A comment on the connection with the atomic packing structure
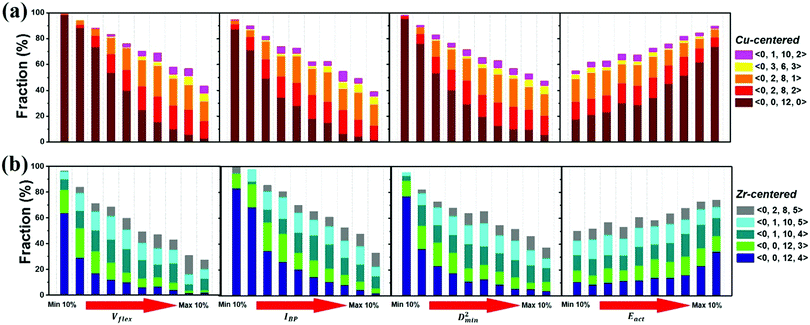
The atomic vibrational behavior is rooted in the glass structure, and the readiness for atomic rearrangement is also influenced by the local environment. It is therefore expected that a common structural link can be found. To this end, the atoms were divided into 10 groups according to the difference in vibrational or mechanical/thermal activated properties. Fig. 11 compares the contents of the 5 major Cu- and Zr-centered polyhedra of the grouped atoms. Here we use the Voronoi index 〈n3, n4, n5, n6〉 to describe the geometric structure feature, with n3, n4, n5, and n6 specifying the number of triangles, rectangles, pentagons, and hexagons, respectively, in the tessellated Voronoi polyhedron. For an MG of this Cu-rich Cu–Zr composition, Cu-centered 〈0, 0, 12, 0〉 and Zr-centered 〈0, 0, 12, 4〉 clusters are energetically preferable. The most stable 10% of atoms contain most of these two dominant types of motifs. With increasing flexibility, the content of these stabilizing motifs decreases significantly. Note, however, that the atomic response can vary under different stimulus conditions (e.g. local stress field, loading direction). For example, Eact is obtained from local excursions in random directions, and these events do not necessarily get activated under imposed stresses.We now briefly comment on the structural parameters. Because of the dominance of icosahedra in this MG composition, structural parameters such as the LFFS and ICO density exhibit a fair predictive capability. According to the matrix in Fig. 10, the ICO density shows a better correlation with D2min and Eact, compared with the LFFS. The ICO density depends on not only the degree of LFFS, but also the local aggregation of icosahedral motifs. It characterizes the structural feature of a length scale larger than nearest neighbors, i.e., the medium-range connection of organized SROs. The atomic volume and atomic packing efficiency, in comparison, are less effective in predicting the propensity for local deformation or relaxation, even though they are often used to reflect the free volume content.87,88 Specifically, a denser atomic packing efficiency was considered to cause the dynamic slowdown during the glass transition,84,89 and the dense structure tends to be more stable in glassy states. However, it has long been argued that the atomic packing density is not ideal for determining the propensity for atomic rearrangement, one reason being that both excess free volume and anti-free volume can be involved in deformation and relaxation.90,91 Also, for complex MGs, the critical structural motif is influenced by chemical SROs, which can be diverse.92,93 Besides, evidence is mounting that short-range geometrical configurations may not be sufficient to decisively govern the response, as discussed in the Introduction section.
7. Concluding remarks and pending issues
In this work, we have used a model MG alloy to establish direct interrelations among the various vibrational properties. Furthermore, we have shown that, by and large, the vibrational parameters have the ability to predict the local structural rearrangements induced by applied stress or temperature, at a level obviously more reliable than static structural parameters. In general, it is clear that atoms with large flexibility amplitude and significant participation in low-frequency vibrations are prone to local relaxation, softening and non-affine displacement. Of the several vibrational parameters, vflex is the optimal, in terms of predictive power and accessibility.Finally, a few remaining issues come to mind, as an outlook. First, from what has been summarized above, correlating the structure/dynamics in MGs with the properties has so far relied heavily on atomistic simulations. There is a pressing need to bridge the gap between simulations and experiments. Second, while Fan et al. have observed similar correspondence between the flexibility volume and properties in covalent network glasses,65 it remains to be seen whether vflex maintains its predictive power in all kinds of glasses. Third, the dynamics switch-over underpinning the glass transition is one of the most important issues in the glass field, which needs to be understood. Fourth, the vibrational dynamics as a function of temperature, and the correlation between vibrational parameters and the glass forming ability, are also worth exploring. Fifth, it is a bit surprising that short-time dynamical behavior, which only samples the short-time vibrational dynamics near the bottom of the sub-basin in the PEL, seems to reflect in some way the energy barrier for cross-basin inelastic relaxation via local atomic rearrangements. While this is a convenient scaling as we showed in this article, why it is so remains to be better understood. Sixth, with regard to the structural underpinning of the vibrational and relaxation properties, although the parameters evaluated in this study are for individual atoms, their magnitude is actually controlled by the local environment surrounding the center atom. One may set the goal to base the predictions on the overall static structure. In this regard, so far the structural input is from the nearest neighbors in the short-to-medium range (up to a couple of nanometers).94 It appears necessary to include information from length scales at and beyond medium range, as well as subtle features not easily captured by simple structural indicators. Recently, machine learning methods have been emerging as a promising tool in conquering this problem: by summing up the interstice features from SROs to MROs,95,96 or by utilizing local radial density functions to wrap longer-range structural information into the picture.97 But it still remains difficult to translate the insight gained into a single and user-friendly parameter/indicator. It is also a grand challenge to understand how/why such data-driven models were able to achieve those predictive performances, when it comes to using machine learning to predict fertile sites from the (relative) positions of the atoms inside amorphous matter. Interestingly, progress is being made very recently to derive physical insight into the structural features governing the local responses, building upon the impressive predictive power generated via deep learning.98
Abbreviations and symbols
| ART | Activation–relaxation technique |
| BP | Boson peak |
| DWF | Debye–Waller factor |
| GUM | Geometrically unfavored motif |
| ICO | Icosahedron |
| LFFS | Local five-fold symmetry |
| MG | Metallic glass |
| MRO | Medium-range order |
| MSD | Mean-square displacement |
| PEL | Potential energy landscape |
| SRO | Short-range order |
| STZ | Shear transformation zone |
| VACF | Velocity auto-correlation function |
| VDOS | Vibrational density of states |
| g(ω) | Vibrational density of states |
| G | Shear modulus |
| I BP | Boson peak intensity |
| P i | Participation fraction of the ith atom in the soft modes |
| r 2 | Vibrational mean-square displacement |
| v flex | Flexibility volume |
| θ D | Debye temperature |
| ω | Frequency |
| Ω a | Atomic volume |
| D 2min | Non-affine atomic displacement |
| E act | Activation energy |
| V act | Activation volume |
| ρ | Correlation coefficient |
| r | Atomic distance |
| ε | Correlation length |
| C s | Spearman's rank correlation coefficient |
| W | Local five-fold symmetry index |
| C ico | Icosahedra density |
| η | Atomic packing efficiency |
Conflicts of interest
There are no conflicts to declare.Acknowledgements
This research was supported by the National Natural Science Foundation of China (No. 52071024, 11790293, 51871016, and 51671021), the Funds for Creative Research Groups of China (51921001), Project of International Cooperation and Exchanges NSFC (51961160729), 111 Project (B07003), and the Fundamental Research Fund for the Central Universities of China. H. Y. F. acknowledges the financial support from the China Scholarship Council (No. 201806460074) for her study at the Johns Hopkins University. E. M. is grateful to XJTU for supporting his research at CAID.References
- M. Telford, Mater. Today, 2004, 7, 36–43 CrossRef CAS.
- H. S. Chen and C. E. Miller, Rev. Sci. Instrum., 1970, 41, 1237–1238 CrossRef CAS.
- A. L. Greer, Nature, 1993, 366, 303–304 CrossRef.
- A. Inoue, Acta Mater., 2000, 48, 279–306 CrossRef CAS.
- A. L. Greer and G. Editors, MRS Bull., 2007, 32, 611–619 CrossRef CAS.
- G. Kumar, T. Ohkubo, T. Mukai and K. Hono, Scr. Mater., 2007, 57, 173–176 CrossRef CAS.
- L. S. Luo, B. B. Wang, F. Y. Dong, Y. Q. Su, E. Y. Guo, Y. J. Xu, M. Y. Wang, L. Wang, J. X. Yu, R. O. Ritchie, J. J. Guo and H. Z. Fu, Acta Mater., 2019, 171, 216–230 CrossRef CAS.
- W. Li, H. Bei, Y. Tong, W. Dmowski and Y. F. Gao, Appl. Phys. Lett., 2013, 103, 171910 CrossRef.
- H. B. Yu, M. Tylinski, A. Guiseppi-Elie, M. D. Ediger and R. Richert, Phys. Rev. Lett., 2015, 115, 1–5 Search PubMed.
- F. Zhu, S. Song, K. M. Reddy, A. Hirata and M. Chen, Nat. Commun., 2018, 9, 3965 CrossRef PubMed.
- F. Spaepen, Acta Metall., 1977, 25, 407–415 CrossRef CAS.
- M. H. Cohen and G. S. Grest, Phys. Rev. B: Condens. Matter Mater. Phys., 1979, 20, 1077–1098 CrossRef CAS.
- Y. Shi and M. L. Falk, Phys. Rev. Lett., 2005, 95, 1–4 Search PubMed.
- Y. Shi and M. L. Falk, Phys. Rev. B: Condens. Matter, Mater. Phys., 2006, 73, 1–10 Search PubMed.
- T. Egami, K. Maed, D. Srolovitz and V. Vitek, Le J. Phys., Colloq., 1980, 41, C8-272–C8-275 Search PubMed.
- J. Ding, Y. Q. Cheng and E. Ma, Acta Mater., 2014, 69, 343–354 CrossRef CAS.
- R. Soklaski, Z. Nussinov, Z. Markow, K. F. Kelton and L. Yang, Phys. Rev. B: Condens. Matter, Mater. Phys., 2013, 87, 1–8 CrossRef.
- J. Ding, S. Patinet, M. L. Falk, Y. Cheng and E. Ma, Proc. Natl. Acad. Sci. U. S. A., 2014, 111, 14052–14056 CrossRef CAS PubMed.
- P. J. Steinhardt, D. R. Nelson and M. Ronchetti, Phys. Rev. B: Condens. Matter Mater. Phys., 1983, 28, 784–805 CrossRef CAS.
- H. L. Peng, M. Z. Li and W. H. Wang, Phys. Rev. Lett., 2011, 106, 1–4 CrossRef PubMed.
- X. J. Liu, Y. Xu, X. Hui, Z. P. Lu, F. Li, G. L. Chen, J. Lu and C. T. Liu, Phys. Rev. Lett., 2010, 105, 1–4 Search PubMed.
- X. J. Liu, S. D. Wang, H. Wang, Y. Wu, C. T. Liu, M. Li and Z. P. Lu, Phys. Rev. B, 2018, 97, 134107 CrossRef CAS.
- M. Z. Li, J. Mater. Sci. Technol., 2014, 30, 551–559 CrossRef.
- W. Mickel, S. C. Kapfer, G. E. Schröder-Turk and K. Mecke, J. Chem. Phys., 2013, 138, 1–8 CrossRef PubMed.
- D. B. Miracle, Nat. Mater., 2004, 3, 697–702 CrossRef CAS PubMed.
- Z. W. Wu, M. Z. Li, W. H. Wang and K. X. Liu, Phys. Rev. B: Condens. Matter, Mater. Phys, 2013, 88, 1–5 Search PubMed.
- H. Tanaka, T. Kawasaki, H. Shintani and K. Watanabe, Nat. Mater., 2010, 9, 324–331 CrossRef CAS PubMed.
- M. Lee, C. M. Lee, K. R. Lee, E. Ma and J. C. Lee, Acta Mater., 2011, 59, 159–170 CrossRef CAS.
- Y. Q. Cheng and E. Ma, Prog. Mater. Sci., 2011, 56, 379–473 CrossRef CAS.
- J. Ding and E. Ma, npj Comput. Mater., 2017, 3, 1–12 CrossRef CAS.
- L. Li, E. R. Homer and C. A. Schuh, Acta Mater., 2013, 61, 3347–3359 CrossRef CAS.
- D. Srolovitz, K. Maeda, V. Vitek and T. Egami, Philos. Mag. A Phys. Condens. Matter, Struct. Defects Mech. Prop., 1981, 44, 847–866 CrossRef CAS.
- T. Egami, Prog. Mater. Sci., 2011, 56, 637–653 CrossRef CAS.
- W. L. Johnson and K. Samwer, Phys. Rev. Lett., 2005, 95, 2–5 Search PubMed.
- M. D. Demetriou, J. S. Harmon, M. Tao, G. Duan, K. Samwer and W. L. Johnson, Phys. Rev. Lett., 2006, 97, 41–44 Search PubMed.
- W. L. Johnson, M. D. Demetriou, J. S. Harmon, M. L. Lind and K. Samwer, MRS Bull., 2007, 32, 644–650 CrossRef CAS.
- M. Tsamados, A. Tanguy, C. Goldenberg and J. L. Barrat, Phys. Rev. E: Stat., Nonlinear, Soft Matter Phys., 2009, 80, 1–17 CrossRef PubMed.
- S. Patinet, D. Vandembroucq and M. L. Falk, Phys. Rev. Lett., 2016, 117, 1–5 CrossRef PubMed.
- A. Barbot, M. Lerbinger, A. Hernandez-Garcia, R. García-García, M. L. Falk, D. Vandembroucq and S. Patinet, Phys. Rev. E, 2018, 97, 1–13 CrossRef PubMed.
- J. Zylberg, E. Lerner, Y. Bar-Sinai, E. Bouchbinder and J. S. Langer, Proc. Natl. Acad. Sci. U. S. A., 2017, 114, 7289–7294 CrossRef CAS PubMed.
- B. Xu, M. L. Falk, J. F. Li and L. T. Kong, Phys. Rev. Lett., 2018, 120, 125503 CrossRef CAS PubMed.
- C. Liu, P. Guan and Y. Fan, Acta Mater., 2018, 161, 295–301 CrossRef CAS.
- A. Widmer-Cooper, P. Harrowell, P. H. Asaph Widmer-Cooper, A. Widmer-Cooper and P. Harrowell, J. Non-Cryst. Solids, 2006, 1–18 Search PubMed.
- A. Widmer-Cooper and P. Harrowell, Phys. Rev. Lett., 2006, 96, 2–5 CrossRef PubMed.
- S. T. Liu, F. X. Li, M. Z. Li and W. H. Wang, Sci. Rep., 2017, 7, 11558 CrossRef CAS PubMed.
- A. Ottochian and D. Leporini, J. Non-Cryst. Solids, 2011, 357, 298–301 CrossRef CAS.
- M. L. Manning and A. J. Liu, Phys. Rev. Lett., 2011, 107, 2–5 CrossRef PubMed.
- H. Shintani and H. Tanaka, Nat. Mater., 2008, 7, 870–877 CrossRef CAS PubMed.
- N. Jakse, A. Nassour and A. Pasturel, Phys. Rev. B: Condens. Matter, Mater. Phys., 2012, 85, 1–6 CrossRef.
- P. M. Derlet, R. Maaß and J. F. Löffler, Eur. Phys. J. B, 2012, 85, 1–20 CrossRef.
- J. Yang, Y. J. Wang, E. Ma, A. Zaccone, L. H. Dai and M. Q. Jiang, Phys. Rev. Lett., 2019, 122, 1–6 Search PubMed.
- J. Bünz, T. Brink, K. Tsuchiya, F. Meng, G. Wilde and K. Albe, Phys. Rev. Lett., 2014, 112, 1–5 CrossRef PubMed.
- Y. P. Mitrofanov, M. Peterlechner, S. V. Divinski and G. Wilde, Phys. Rev. Lett., 2014, 112, 1–5 CrossRef PubMed.
- P. Luo, Y. Z. Li, H. Y. Bai, P. Wen and W. H. Wang, Phys. Rev. Lett., 2016, 116, 1–5 CrossRef PubMed.
- D. Xu, B. Lohwongwatana, G. Duan, W. L. Johnson and C. Garland, Acta Mater., 2004, 52, 2621–2624 CrossRef CAS.
- D. Wang, Y. Li, B. B. Sun, M. L. Sui, K. Lu and E. Ma, Appl. Phys. Lett., 2004, 84, 4029–4031 CrossRef CAS.
- Y. Q. Cheng, H. W. Sheng and E. Ma, Phys. Rev. B: Condens. Matter, Mater. Phys., 2008, 78, 1–7 Search PubMed.
- Y. Q. Cheng, A. J. Cao and E. Ma, Acta Mater., 2009, 57, 3253–3267 CrossRef CAS.
- S. Plimpton, J. Comput. Phys., 1995, 117, 1–19 CrossRef CAS.
- V. A. Borodin, Philos. Mag. A Phys. Condens. Matter, Struct. Defects Mech. Prop., 1999, 79, 1887–1907 CAS.
- J. Ding, Y.-Q. Cheng, H. Sheng, M. Asta, R. O. Ritchie and E. Ma, Nat. Commun., 2016, 7, 13733 CrossRef CAS PubMed.
- B. Schönfeld, J. Zemp and U. Stuhr, J. Phys.: Condens. Matter, 2016, 29, 015401 CrossRef PubMed.
- C. Kittel, P. McEuen and P. McEuen, Introduction to solid state physics, Wiley, New York, 1996, vol. 8 Search PubMed.
- J. A. Reissland, The physics of phonons, Wiley-Interscience, 1973 Search PubMed.
- Z. Fan, J. Ding and E. Ma, Mater. Res. Lett., 2018, 6, 570–583 CrossRef CAS.
- Z. Fan, J. Ding, Q. J. Li and E. Ma, Phys. Rev. B, 2017, 95, 1–10 Search PubMed.
- H. Tanaka, J. Phys. Soc. Jpn., 2001, 70, 1178–1181 CrossRef CAS.
- T. Brink, L. Koch and K. Albe, Phys. Rev. B, 2016, 94, 1–9 CrossRef.
- R. Milkus and A. Zaccone, Phys. Rev. B, 2016, 93, 1–10 CrossRef.
- H. Mizuno, S. Mossa and J. L. Barrat, Proc. Natl. Acad. Sci. U. S. A., 2014, 111, 11949–11954 CrossRef CAS PubMed.
- T. S. Grigera, V. Martín-Mayor, G. Parisi and P. Verrocchio, Nature, 2003, 422, 289–292 CrossRef CAS PubMed.
- H. P. Zhang, B. B. Fan, J. Q. Wu, W. H. Wang and M. Z. Li, Phys. Rev. Mater., 2020, 4, 1–6 Search PubMed.
- A. Widmer-Cooper, H. Perry, P. Harrowell and D. R. Reichman, Nat. Phys., 2008, 4, 711–715 Search PubMed.
- M. Mosayebi, P. Ilg, A. Widmer-Cooper and E. Del, Gado, Phys. Rev. Lett., 2014, 112, 1–5 CrossRef PubMed.
- B. A. Pazmiño Betancourt, P. Z. Hanakata, F. W. Starr and J. F. Douglas, Proc. Natl. Acad. Sci. U. S. A., 2015, 112, 2966–2971 CrossRef PubMed.
- G. T. Barkema and N. Mousseau, Comput. Mater. Sci., 2001, 20, 285–292 CrossRef CAS.
- Y. Fan, T. Iwashita and T. Egami, Nat. Commun., 2014, 5, 5083 CrossRef CAS PubMed.
- J. S. Langer, Phys. Rev. E: Stat., Nonlinear, Soft Matter Phys., 2008, 77, 1–14 Search PubMed.
- I. C. Choi, Y. Zhao, B. G. Yoo, Y. J. Kim, J. Y. Suh, U. Ramamurty and J. Il Jang, Scr. Mater., 2012, 66, 923–926 CrossRef CAS.
- J. D. Ju and M. Atzmon, Acta Mater., 2014, 74, 183–188 CrossRef CAS.
- W. H. Press, S. A. Teukolsky, W. T. Vetterling and B. P. Flannery, Numerical Recipes 3rd Edition: The Art of Scientific Computing, Cambridge University Press, USA, 3rd edn, 2007 Search PubMed.
- Y. C. Hu, F. X. Li, M. Z. Li, H. Y. Bai and W. H. Wang, Nat. Commun., 2015, 6, 8310 CrossRef CAS PubMed.
- Y. C. Hu, F. X. Li, M. Z. Li, H. Y. Bai and W. H. Wang, J. Appl. Phys., 2016, 119, 205108 CrossRef.
- L. Yang, G. Q. Guo, L. Y. Chen, C. L. Huang, T. Ge, D. Chen, P. K. Liaw, K. Saksl, Y. Ren, Q. S. Zeng, B. Laqua, F. G. Chen and J. Z. Jiang, Phys. Rev. Lett., 2012, 109, 1–5 Search PubMed.
- L. S. Huo, J. F. Zeng, W. H. Wang, C. T. Liu and Y. Yang, Acta Mater., 2013, 61, 4329–4338 CrossRef CAS.
- W. H. Wang, Prog. Mater. Sci., 2012, 57, 487–656 CrossRef CAS.
- Q.-K. Li and M. Li, Mater. Trans., 2007, 48, 1816–1821 CrossRef CAS.
- H. W. Sheng, E. Ma and M. J. Kramer, JOM, 2012, 64, 856–881 CrossRef CAS.
- L. Ward, D. Miracle, W. Windl, O. N. Senkov and K. Flores, Phys. Rev. B: Condens. Matter Mater. Phys., 2013, 88, 1–10 CrossRef.
- V. A. Khonik and N. P. Kobelev, J. Appl. Phys., 2014, 115, 2014–2017 CrossRef.
- A. Foroughi, H. Ashuri, R. Tavakoli, M. Stoica, D. Ažopu and J. Eckert, J. Appl. Phys., 2017, 122, 215106 CrossRef.
- P. F. Guan, T. Fujita, A. Hirata, Y. H. Liu and M. W. Chen, Phys. Rev. Lett., 2012, 108, 1–5 CrossRef PubMed.
- Q. Yu, X. D. Wang, H. B. Lou, Q. P. Cao and J. Z. Jiang, Acta Mater., 2016, 102, 116–124 CrossRef CAS.
- B. Wang, L. Luo, E. Guo, Y. Su, M. Wang, R. O. Ritchie, F. Dong, L. Wang, J. Guo and H. Fu, npj Comput. Mater., 2018, 4, 1–11 CrossRef CAS.
- Q. Wang and A. Jain, Nat. Commun., 2019, 10, 1–11 CrossRef.
- Q. Wang, J. Ding and E. Ma, npj Comput. Mater., 2020, 6, 1–12 CrossRef.
- Z. Fan, J. Ding and E. Ma, Mater. Today, 2021, 40, 48–62 CrossRef.
- Z. Fan and E. Ma, Nat. Commun., 2021, 12, 1506 CrossRef CAS PubMed.
| This journal is © The Royal Society of Chemistry 2021 |

