
Compositional heterogeneity in CsyFA1−yPb(BrxI1−x)3 perovskite films and its impact on phase behavior†
Julien
Barrier‡
 ab,
Rachel E.
Beal‡
ac,
Aryeh
Gold-Parker
ad,
Julian A.
Vigil
ae,
Eli
Wolf
fg,
Louis
Waquier
ab,
Nicholas J.
Weadock
ag,
Zihan
Zhang
h,
Laura T.
Schelhas
i,
Ana Flavia
Nogueira
j,
Michael D.
McGehee
gi and
Michael F.
Toney
*g
ab,
Rachel E.
Beal‡
ac,
Aryeh
Gold-Parker
ad,
Julian A.
Vigil
ae,
Eli
Wolf
fg,
Louis
Waquier
ab,
Nicholas J.
Weadock
ag,
Zihan
Zhang
h,
Laura T.
Schelhas
i,
Ana Flavia
Nogueira
j,
Michael D.
McGehee
gi and
Michael F.
Toney
*g
aSSRL Materials Science Division, SLAC National Accelerator Laboratory, Menlo Park, CA 94025, USA
bÉcole Supérieure de Physique et de Chimie Industrielles de la Ville de Paris – ESPCI Paris, 75005 Paris, France
cDepartment of Materials Science and Engineering, Stanford University, Stanford, CA 94305, USA
dDepartment of Chemistry, Stanford University, Stanford, CA 94305, USA
eDepartment of Chemical Engineering, Stanford University, Stanford, CA 94305, USA
fDepartment of Applied Physics, Stanford University, Stanford, CA 94305, USA
gDepartment of Chemical and Biological Engineering, University of Colorado Boulder, Boulder, CO 80309, USA. E-mail: michael.toney@colorado.edu
hPhysics Department, University of Colorado Boulder, Boulder, CO 80309, USA
iNational Renewable Energy Laboratory, Golden, CO 80401, USA
jInstitute of Chemistry, University of Campinas, Campinas, SP – 13083-970 Sãao Paulo, Brazil
First published on 11th October 2021
Abstract
Hybrid organic inorganic lead halide perovskite semiconductors of the form CsyFA1−yPb(BrxI1−x)3 are promising candidate materials for high-efficiency photovoltaics. Notably, cation and anion substitution can be used to tune the band gaps to optimize performance and improve stability. However, multi-component materials can be prone to compositional and structural inhomogeneity and the extent, length scale and impact of this heterogeneity on lead halide perovskite properties are not well understood. Here we use synchrotron X-ray diffraction to probe the evolution of crystal structure across the tetragonal-to-cubic phase transition for a series of CsyFA1−yPb(BrxI1−x)3 thin films with x = 0.05 to 0.3 and y = 0.17 to 0.40. We find that the transition occurs across a broad temperature range of approximately 40 °C, much larger than for pure compounds such as MAPbI3 and MAPbBr3. We hypothesize that this smearing of the phase transition is due to compositional inhomogeneities that give rise to a distribution of local transition temperatures and we estimate the composition varies by about 10% to 15% with likely greater heterogeneity for the halide anion than the cation. This approach of mapping the transition is a simple and effective method of assessing heterogeneity, enabling evaluation of its impact.
Broader contextThis paper focuses on metal halide perovskite thin films, a system of wide interest for photovoltaic applications. Particularly, perovskite films of the form CsyFA1−yPb(BrxI1−x)3 have sparked a lot of enthusiasm for use in tandem solar cell applications since their bandgap is particularly well suited to complement Si. However, these alloyed materials are potentially inhomogeneous, which have implications on the materials properties, including the propensity to photo-induced instability and phase demixing. Stability is one of the most significant challenges faced in these materials before commercialization of perovskite solar cell devices. Despite extensive studies, the nature of the inhomogeneities and the extent of compositional heterogeneity is still not well understood, as there are few simple methods to assess this. It is essential to quantify heterogeneity, particularly at the nanoscale, to understand its impact. Understanding the complex phase behavior is of paramount importance as the phase transitions are around the operational temperatures of solar devices. |
Introduction
Over the last decade, hybrid organic inorganic metal halide perovskites (MHPs) have sparked tremendous enthusiasm due to their favorable optoelectronic properties1,2 for applications in both single-junction and tandem solar cells as well as other optoelectronic devices.3–5 Perovskites have the general chemical formula ABX3 where for MHPs, A is a monovalent cation, B is a divalent cation, and X is a halide anion. The unit cell comprises corner-sharing BX6 octahedra that form a cuboctahedral cavity filled by the A-site cation. The perovskite crystal structure accommodates a wide compositional space, and in state-of-the-art MHP photovoltaics, A is typically a mixture of formamidinium (FA = CH(NH2)2+), methylammonium (MA = CH3NH3+), and Cs+, B is typically Pb2+, and X is typically a mixture of I− and Br−. Compositional tuning on both the A- and X-site alters the material's band gap, and compositions of the form CsyFA1−yPb(BrxI1−x)3 with 0 < x <1 and 0.1 < y < 0.3 have been found to be particularly well-suited for applications as the top-cell material in tandem perovksite–silicon photovoltaics.6Despite the impressive performance of MHP based solar cells, with record efficiencies exceeding 25% and 29% for perovskite and perovskite/Si monolithic tandem devices, respectively,7,8 there is space for improvement in several aspects before commercialization and widespread deployment becomes feasible.9–11 While state-of-the-art MHP solar cells have short circuit current densities that are near theoretical and practical maxima, the open circuit voltage and fill factor can be improved, which could be achieved by suppressing charge carrier recombination in the bulk film and at interfaces. In addition, high-performing multi-cation, multi-halide MHP devices need to be controllably synthesized by cost-efficient and scalable methods. While there is some debate about possible limitations imposed by the toxicity of Pb2+, developing high performing Pb-free solar cells is desirable. Finally, convincingly demonstrating long-term stability remains a key issue.12
Of these challenges, stability is, arguably, the most important. While thermodynamic stability and chemical decomposition are important, photo-induced instability (or demixing) is a significant challenge for multi-cation, multi-halide MHPs that have wide band gaps needed for tandem photovoltaics. Here illumination induces a nanoscale compositional segregation into I-rich and Br-rich domains.13–16 This process requires fast halide anion diffusion that is likely facilitated by high vacancy concentrations.17–19 There is some evidence for photoinduced A-site cation demixing as well,20 although mixed A-site MHPs with FA and Cs show improved photo-stability.21 While the phenomenon of photo-induced phase segregation has been intensively investigated, the mechanism is still under active discussion.16 It has been suggested that for MAPb(BrxI1−x)3 perovskites compositions near the tetragonal-to-cubic phase boundary are more optically stable.22 We have shown that MHP crystallographic phase is not the sole determinant to stability,14 and it has been postulated that initial nanoscale local compositional variations serve as nuclei for the formation of I-rich segregated nanoscale domains under illumination.23–25 Furthermore, local compositional fluctuations can impact charge carrier dynamics and device performance.26 Thus, it is essential to quantify compositional uniformity, particularly at the nanoscale, to understand and control its impact.
Studies have demonstrated optoelectronic and compositional heterogeneity27–29 in MHPs across length scales, but almost all investigations have been limited to >0.1 μm spatial scale.30 For example, de Quilettes et al. showed that photoluminescence (PL) intensities and lifetimes varied between different regions within the same film.27 Correa-Baena et al. used nano-X-ray fluorescence microscopy of mixed halide MHPs to map heterogeneity in I and Br composition showing μm-size regions of low Br content but demonstrating improvements in uniformity for some compositions;28 the same method was used also by Wieghold et al. to show that the elemental composition is altered in single grains based on the film thickness and this inhomogeneity explained differences in charge carrier dynamics.26 Szostak et al. mapped chemical diversity of individual regions with nano-spectroscopy29 showing that these regions have an intrinsic heterogeneity of the organic components. Gratia et al. used ion microscopy to map halide composition in FA0.85MA0.15Pb(Br0.15I0.85)3 films at sub-100 nm and observed 50 nm regions devoid of Br, and interestingly, noted no evidence for such compositional segregation based on peak broadening in diffraction, an apparent contradiction.31 Much of the research on heterogeneity is summarized in the review by Tennyson et al.30 Despite extensive work, easily and accurately quantifying and characterizing compositional heterogeneity remains a significant challenge, especially for 1 to 100 nm length scales.
Compositional heterogeneity can have two origins: intrinsic (or thermodynamic) and extrinsic (processing-induced). The first form is the thermodynamic separation of the multi-component MHP into two or more distinct phases driven by minimization of the free energy. The second likely results from kinetics due to the solution-processing methods used to fabricate MHP materials that may lead to chemical, structural, and electronic property heterogeneity on multiple length scales.30 Distinguishing these is difficult because the MHP film may be in a kinetically trapped, metastable state. We make no attempt to distinguish intrinsic and extrinsic nonuniformity in this paper and we refer to both as compositional heterogeneity.
To the best of our knowledge, there have been no investigations of the phase behavior and phase diagrams for any multi-cation, multi-halide MHP. This is likely because these are very challenging due to multi-dimensional phase space and the capacity for the perovskite crystal structure to accommodate many different distortions32 that can make perovskite phase diagrams quite complex. We have mapped the room temperature crystal structures for CsyFA1−yPb(BrxI1−x)3 thin films with x = 0.05 to 0.3 and y = 0.17 to 0.40 and identified the cubic-tetragonal solvus.14 For the simpler four component MHPs, there have been a few reports on phase behavior.20,33–36 For A-site substitution, these have shown limited incorporation of Cs in pseudocubic CsyFA1−yPbI3, about y = 0.15 in the bulk powders,33 despite theoretical predictions of much higher solubility (y = 0.7).20 In contrast, most MHP films show a solubility up to at least y = 0.3 for CsyFA1−yPbI3,37 but these may be kinetically trapped. In MAPb(BrxI1−x)3, diffraction has shown a miscibility gap up to 350 K with strong intergrowth of I-rich and Br-rich crystallites and observed deviations from Vegard's law,35 a point we discuss later in this manuscript. In CsPb(BrxI1−x)3, a computational study38 has predicted a single phase orthorhombic solid-solution at room temperature but phase separate into Br-rich tetragonal and I-rich orthorhombic phases at 50–75 °C.
The presence of compositional heterogeneity complicates the phase transition behavior in MHPs, since slight variations in composition can result in a different crystallographic phase being thermodynamically favorable and shift the temperature where structural transitions occur. Because MHPs can undergo phase transitions around operational temperatures, an understanding of their complex phase behavior is necessary. In this work, we explore the nature of the tetragonal-to-cubic phase transition in CsyFA1−yPb(BrxI1−x)3 perovskites and how these behaviors differ from those observed in pure compounds such as MAPbI3 and MAPbBr3. Crystal structure and phase transitions are characterized using X-ray diffraction (XRD), and the temperature dependence of the band gap is determined from the external quantum efficiency (EQE) of optimized devices.
We track the lattice parameter and the octahedral tilt angle across the transition and use the octahedral tilt angle to characterize the evolution of the crystal structure from tetragonal into cubic. We find that that this transition occurs over a broad temperature range, and we also observe a change in the temperature dependence of the band gap near the temperature range where the MHP structure becomes cubic. The importance of this study is that we show that photovoltaic-relevant MHP films can be compositionally heterogeneous at the nanoscale and we establish a simple methodology to characterize this heterogeneity.
Results
We investigate a series of CsyFA1−yPb(BrxI1−x)3 films with x = 0.05, 0.17, 0.2 or 0.3 and with y = 0.17, 0.25 or 0.4 that have well-controlled, and nearly constant morphology. Details on the film preparation are given in ref. 14 and in the Experimental section below.Structural considerations
First, we briefly recall structural stability considerations. The degree of distortion from the cubic perovskite crystal structure and hence the tendency to form non-cubic structures can be described by the Goldschmidt tolerance factor, τG, which has the equation: | (1) |
These tilt patterns are codified with Glazer notation41 and can describe cubic, tetragonal, and orthorhombic perovskite crystal structures.42–46 In this notation, the letters a, b, and c indicate the magnitude of rotation about the x-, y-, and z-axes, respectively, in the direction indicated by the superscript. A “0” superscript indicates no rotation, so the Pm![[3 with combining macron]](https://www.rsc.org/images/entities/char_0033_0304.gif) m cubic crystal structure is denoted a0a0a0. Successive octahedra along an axis can either rotate in the same (in-phase) or opposite (out-of-phase) directions. A “+” superscript indicates in-phase rotation of equal magnitude of the octahedra along the specified axis, whereas a “−” superscript indicates that successive octahedra along that axis are rotated equally in magnitude but in opposite directions. Tilt patterns that result in a structure with both in-phase and out-of-phase tilts that are equal in magnitude are termed antidistorted.47,48 In an antidistortive phase transition from an untilted to a tilted structure, the size of the unit cell increases, but centrosymmetry is preserved.47 Tetragonal-to-cubic phase transitions in metal-halide perovksites are antidistortive.
m cubic crystal structure is denoted a0a0a0. Successive octahedra along an axis can either rotate in the same (in-phase) or opposite (out-of-phase) directions. A “+” superscript indicates in-phase rotation of equal magnitude of the octahedra along the specified axis, whereas a “−” superscript indicates that successive octahedra along that axis are rotated equally in magnitude but in opposite directions. Tilt patterns that result in a structure with both in-phase and out-of-phase tilts that are equal in magnitude are termed antidistorted.47,48 In an antidistortive phase transition from an untilted to a tilted structure, the size of the unit cell increases, but centrosymmetry is preserved.47 Tetragonal-to-cubic phase transitions in metal-halide perovksites are antidistortive.
While the Goldschmidt tolerance factor is a good indicator for the formation of either perovskite or non-perovskite phases, it cannot be used to predict the predominance of a given crystal structure within the perovskite family. Bartel et al.49 have developed an alternative to the conventional Goldschmidt tolerance factor, and in Section S1 (ESI†), we discuss the ability of tolerance factors from Bartel et al.49 and Goldschmidt to predict crystal structure within the perovskite family.
Fig. 1a shows the XRD patterns for two different CsyFA1−yPb(BrxI1−x)3 compositions at room temperature compared with MAPbI3. This figure shows that Cs0.17FA0.83Pb(Br0.4I0.6)3 has a cubic perovskite structure (untilted a0a0a0 in Glazer notation), while Cs0.4FA0.6Pb(Br0.17I0.83)3 has a tetragonal P4/mbm structure that arises from in-phase tilting of the PBX6 octahedra (denoted a0a0c+). These structures are visualized in Fig. 1b and c, respectively. XRD data for MAPbI3, which has a tetragonal I4/mcm structure, is also shown. As previously mentioned, the PbI6 are tilted out-of-phase (a0a0c−) as shown in Fig. 1d. While both of these structures are antidistorted, they are crystallographically distinct. In tetragonal CsyFA1−yPb(BrxI1−x)3 perovskites, neighboring PBX6 octahedra in a given (001) plane have the opposite sense of rotation, but each (001) plane is identical. In MAPbI3 the arrangement of PBX6 octahedra in a given (001) plane is similar, but the sense of rotation alternates between each successive plane. In addition to MAPbI3, many oxide perovskites also have the I4/mcm space group and out-of-phase tilt pattern in the tetragonal phase.51–54 Note that the in-phase tilt pattern is consistent with previous works on MHPs comprising either inorganic or FA cations.14,33,55–59
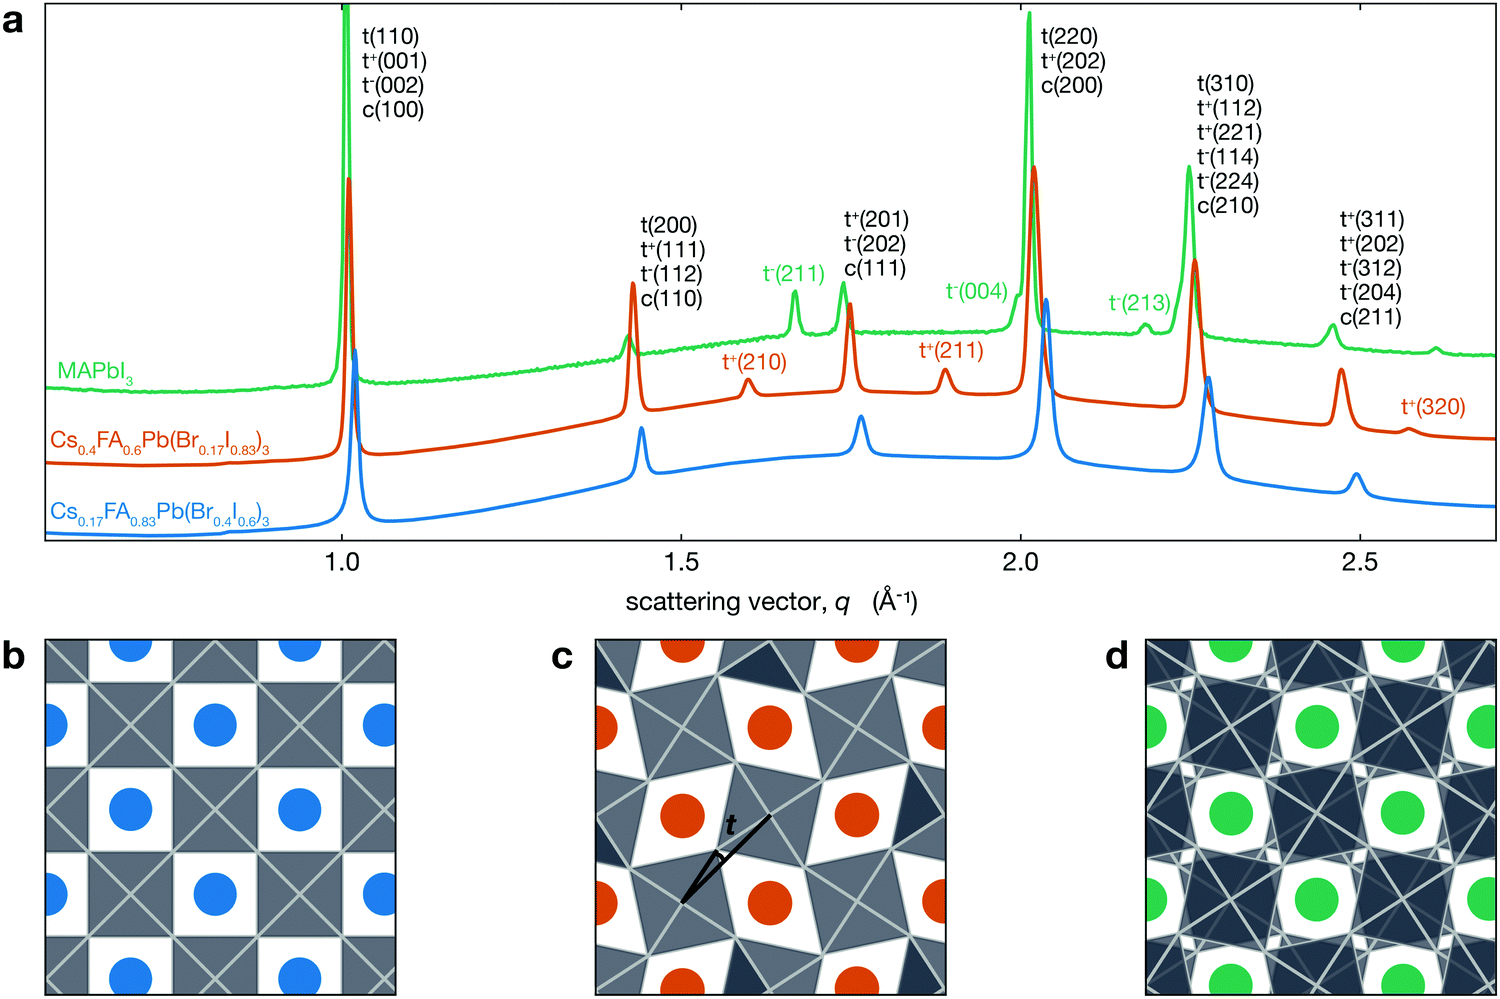 | ||
| Fig. 1 (a) XRD patterns for different CsyFA1−yPb(BrxI1−x)3 compositions exhibiting both tetragonal a0a0c+ (tetragonal peaks indexed with t+) and cubic a0a0a0 structures as well as the a0a0c− (tetragonal peaks indexed with t−) phase of MAPbI3 (MAPbI3 data from Schelhas et al.50). The y-axis is linear in intensity (arbitrary units not shown) with an offset between the three patterns. Views of (b) a0a0a0, (c) a0a0c+, and (d) a0a0c− structures looking down the c-axis. Blue, orange and green spheres represent the A-site cation, and the PBX6 octahedra are shown in grey. The tilt angle t we consider here is the angle between the black lines in (c). | ||
For Cs0.4FA0.6Pb(Br0.17I0.83)3, the symmetry associated with in-phase tilting of the PBX6 octahedra results in the emergence of several tetragonal superlattice peaks, including the t(210) and t(211) reflections around 1.6 and 1.9 Å−1, respectively, which are not observed in cubic Cs0.17FA0.83Pb(Br0.4I0.6)3. We note that a tetragonal phase should result in the splitting of the cubic c(100) peak into t(110) and t(001) reflections and the c(200) into t(220) and t(002). The difference in tetragonal peak positions is expected to be about 0.5% at room temperature. However, the observed XRD peak full width at half maximum (FWHM) for the t(110)–t(001) and t(220)–t(002) peaks is about three times larger than this expected splitting of 0.5% and hence does not allow us to resolve two separate peaks from this measurement.
Phase transition monitored through the disappearance of tetragonal reflections
We performed in situ XRD on the series of perovksite thin films while heating through the tetragonal-to-cubic phase transition. The temperature dependent XRD patterns are shown in Fig. 2a for Cs0.4FA0.6Pb(Br0.17I0.83)3 and Fig. 2b shows the region near the t(210) peak demonstrating the disappearance of this tetragonal superlattice peak with increasing temperature. The t(210) peak is weak but observable at 95 °C, but it is not observed at 100 °C. At all temperatures, the XRD peaks have been fit with a Voigt function over a quadratic background from the substrate. Because small peaks are hard to distinguish from background and noise, we used chi-squared analysis to determine the presence of tetragonal reflection at each temperature. All calculations and fitting procedures are explained in greater detail in Section S2 (ESI†). We identify the temperature where the tetragonal peak intensities go to zero as T0. For Cs0.4FA0.6Pb(Br0.17I0.83)3 (Fig. 2) this is 97 ± 3 °C (see Section S2 for details, ESI†). We note that T0 may represent a solidus temperature14 where above T0, the MHP film is in a fully cubic crystal structure but below this, there exist tetragonal domains.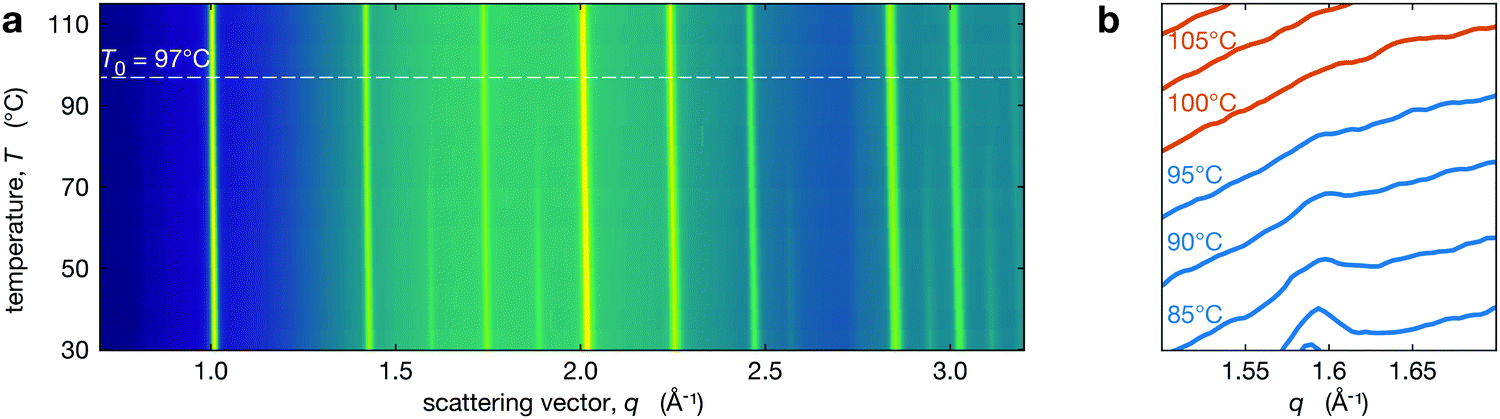 | ||
| Fig. 2 (a) Temperature XRD map for Cs0.4FA0.6Pb(Br0.17I0.83)3 with the extracted T0 (temperature where film is purely cubic) indicated by a dashed line. (b) Evolution of the integrated intensity of the t(210) superlattice peak. Temperature is increasing moving up in the vertical direction. The y-axis is linear and represents the intensity counts in arbitrary units. | ||
Behaviour of the phase transition
To track the phase transition behavior of CsyFA1−yPb(BrxI1−x)3 perovskite films, we extract the average octahedral tilt angle t from the tetragonal reflection intensities in our XRD measurements (see Section S3, ESI†). Note that we define the tilt angle for one PbX6 octahedron, with Pb taken as the center, and the angle is relative to the cubic phase atomic position of the halide (see Fig. 1c). This is the tilt angle averaged over space and time. Hence, if the MHP film is heterogeneous, either because of extrinsic compositional variations or due to the coexistence of cubic and tetragonal phases, t is averaged over these regions. As explained in Section S3 (ESI†), the presence of preferred orientation in our CsyFA1−yPb(BrxI1−x)3 perovskite films results in some uncertainty in the absolute value of the tilt angle. This would manifest as a systematic change in the magnitude of the tilt angle (e.g., shifted higher or lower by some constant multiplier) but will not impact our conclusions, as relative changes are not affected.The temperature evolution of the tilt angle, t, is shown in Fig. 3a for all CsyFA1−yPb(BrxI1−x)3 compositions along with comparable tilt angle temperature dependence for pure compounds, including MAPbI3 films50 and MAPbBr3 single crystals. To aid comparison, we have plotted t as a function of T − T0, where for CsyFA1−yPb(BrxI1−x)3 films T0 is the temperature where the average tilt goes to zero, and for MAPbI3 films and MAPbBr3, T0 is the phase transition temperature. The results shown in Fig. 3a for MAPbI3 and MAPbBr3 are consistent with the literature.59–63 The striking qualitative observation from Fig. 3a is that the tilt evolution at the transition in all the mixed A-site, halide CsyFA1−yPb(BrxI1−x)3 compositions is significantly broadened compared to MAPbI3 films and MAPbBr3, which as we explain below, is a manifestation of compositional heterogeneity. This behavior is most apparent for 40-17 and 17-05 where we have the largest temperature range. For all our alloyed compositions, Fig. 3a shows that the slopes of the tilt angle t versus temperature T are much smaller than it is for the pure compounds MAPbI3 and MAPbBr3, consistent with the broadened transition although there is a few °C offset in the tilt for 17-17, 25-20 and 40-30 (compared to 40-17), reflecting the errorbar in determining T0. We refer to the compositions studied here by chemical formula (e.g., Cs0.4FA0.6Pb(Br0.17I0.83)3) or simply the percentage of Cs and Br at the A- and X-site, respectively (e.g. 40-17). For some compositions (17-17, 25-20 and 40-30), the temperature range is limited since we are unable to cool the films.
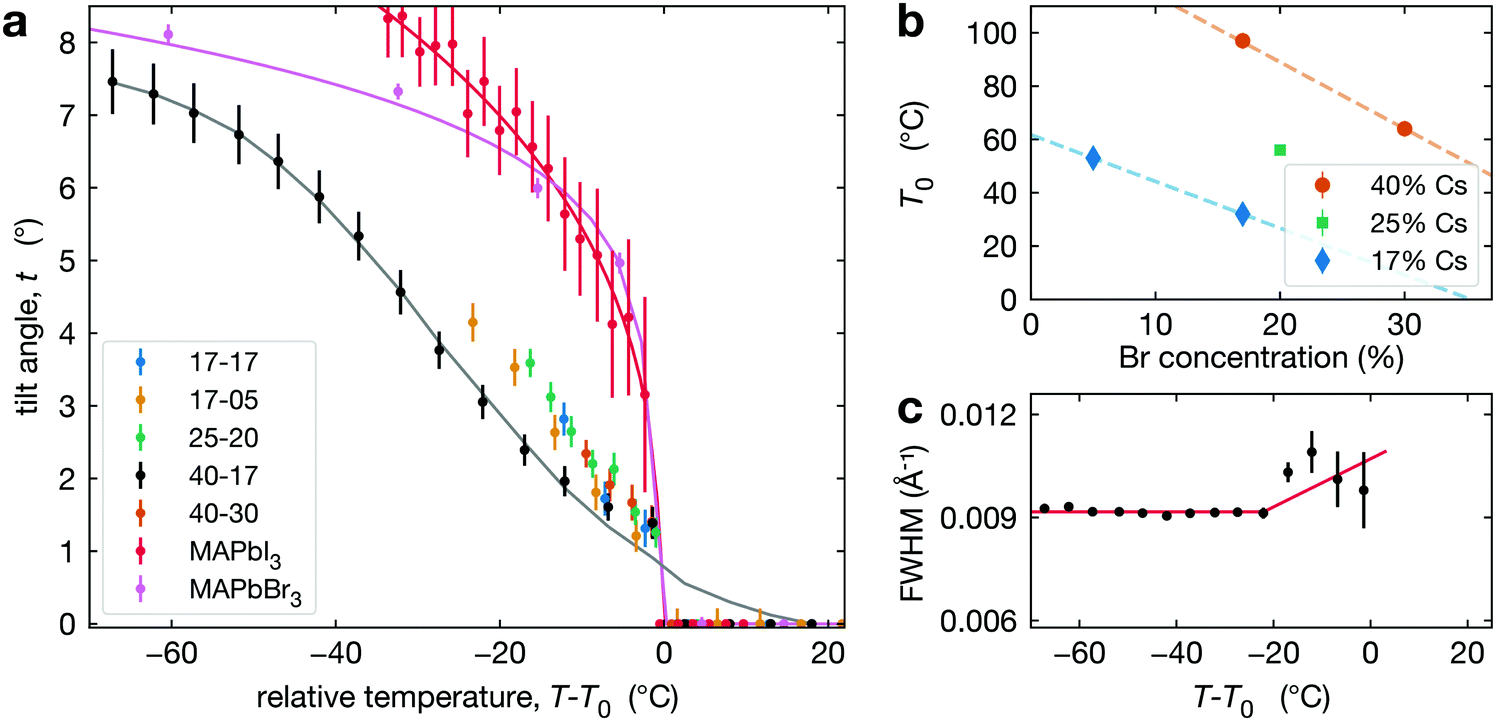 | ||
| Fig. 3 (a) Octahedral tilt angle (symbols) plotted as a function of temperature for all compositions studied with data for MAPbI3 thin films extracted from Schelhas et al.50 and MAPbBr3 single crystals. The solid lines show fits to these data as explained in the text. (b) Temperature T0 as a function of Br concentration at constant Cs compositions: 17% (blue diamonds), 25% (green square), 40% (orange dots). (c) The FWHM of the t(210) peak in Cs0.4FA0.6Pb(Br0.17I0.83)3 increases slightly around 20 °C below T0. | ||
As noted in the introduction, we do not distinguish between intrinsic (thermodynamic phase coexistence) and extrinsic compositional heterogeneity. Hence, we model the phase transition behavior in Fig. 3a as a smeared first order or second-order transition. For a first order behavior, the intrinsic temperature dependence is a step function at Tc; while for the second-order transition, the behavior near the transition follows a power-law of the form t ∼ (Tc − T)β, where β is the critical exponent for the phase transition and Tc is the transition temperature. For either type of transition, we account for the impact of compositional heterogeneity by convoluting the intrinsic temperature dependence (step function or power-law) with a Gaussian distribution of transition temperatures. Both fitting processes are discussed in detail in Section S4 (ESI†). For Cs0.4FA0.6Pb(Br0.17I0.83)3, the step function and power-law fits give a Tc at 73 °C and 80 °C, respectively, with a broad width due to the distribution of transition temperatures (52 °C and 45 °C, respectively). The best fit value for β is 0.49, but with large uncertainty. We observe qualitatively similar behavior in all of the CsyFA1−yPb(BrxI1−x)3 compositions studied and report Tc, fitting transition width, and T0 values in Table 1, while Fig. 3b plots T0 for different compositions. Note that our experimental data set only allows us to determine a Tc and transition width for Cs0.4FA0.6Pb(Br0.17I0.83)3 and Cs0.17FA0.83Pb(Br0.05I0.95)3, as data are only available above room temperature and for Cs0.17FA0.83Pb(Br0.05I0.95)3, we can only set a lower limit on the transition width of 21 °C.
| [Cs], y (%) | [Br], x (%) | T 0 (°C) | T c (°C) | Transition width (°C) |
|---|---|---|---|---|
| 17 | 5 | 53 | 39 | >21 |
| 17 | 17 | 37 | ||
| 25 | 20 | 56 | ||
| 40 | 17 | 97 | 73 | 45 |
| 40 | 30 | 64 |
This behaviour is different from pure compounds, MAPbI3 and MAPbBr3. Despite being a well-studied system, the character of the tetragonal-to-cubic phase transition in MAPbI3 is still debated. DFT calculations suggest that the transition is second-order,64 but several experimental studies have concluded that the transition is closer to tricritical (mean field exponent β = 0.25).60,62,63,65 A recent study of the tetragonal-to-cubic transition in a deuterated MAPbI3 single crystal indicates that the transition is at least weakly first order with small tetragonal domains nucleating near iodide vacancies in the cubic lattice.66
For CsyFA1−yPb(BrxI1−x)3, we observe a very small increase in the FWHM of the t(210) Bragg peak about 10–20 °C below T0, as shown in Fig. 3c. This weak dependence is, in general, inconsistent with the expected power-law increase in FWHM67 for a second-order transition. This observation suggests that the tetragonal-to-cubic transition in our CsyFA1−yPb(BrxI1−x)3 films is not second order.
Lattice parameter behavior
The temperature dependence of the lattice parameters through the phase transition provides insight into the phase behavior and nature of the heterogeneity that broadens the transition. Fig. 4a and b show the temperature evolution of the lattice parameters a′ and c as well as the pseudo-cubic lattice parameter d for Cs0.17FA0.83Pb(Br0.05I0.95)3 and Cs0.4FA0.6Pb(Br0.17I0.83)3. We used the t(210) and t(201) peaks to extract the lattice parameters, and for ease of comparison, we plot and
and  . These lattice parameters are thus reflective of only the regions that are tetragonal within the film. It is informative to compare this dependence to that for the pure compound MAPbI3,60 which is shown in Fig. 4c, and behaves the same as the pure compound MAPbBr3.61 Before making this comparison, we calculate that the volumetric thermal expansion coefficients (βV) for Cs0.4FA0.6Pb(Br0.17I0.83)3 and Cs0.17FA0.83Pb(Br0.05I0.95)3 as (2.11 ± 0.1) × 10−4 K−1 and (1.83 ± 0.3) × 10−4 K−1, respectively. These values are slightly larger than βV = (1.52 ± 0.07)× 10−4 K−1 for Cs0.15FA0.85PbI3,68 and suggest that Br in the X site gives a larger βV compared to I. We observe no change in βV at the phase transition (T0 in Fig. 4a).
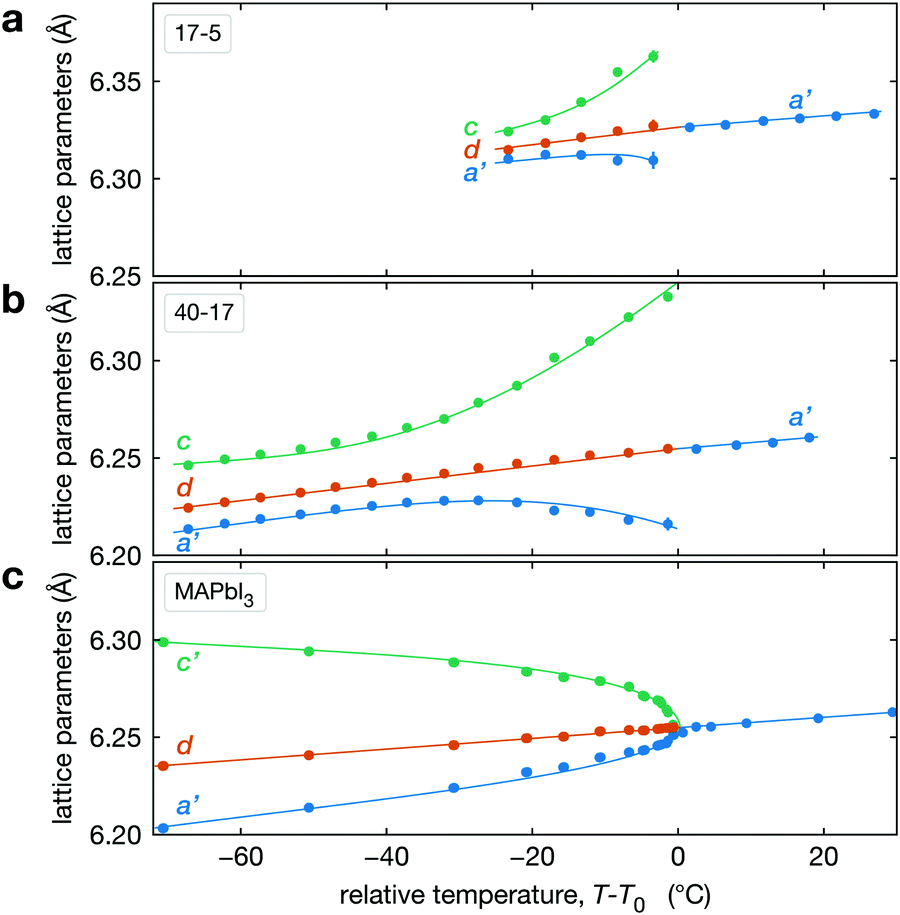 | ||
Fig. 4 Evolution of lattice parameters for Cs0.17FA0.83Pb(Br0.05I0.95)3 (a), Cs0.4FA0.6Pb(Br0.17I0.83)3 (b) and MAPbI3 (c) plotted as a function of the relative temperature T − T0. (a and b) The parameters are extracted from the tetragonal peak positions. (c) Data extracted from ref. 60. Here  (blue), (blue),  (brown) and c (green). For MAPbI3 we plot c′ = c/2 instead. Above T0, the structure is cubic, so only a single lattice parameter is shown. Solid lines show the general trend. (brown) and c (green). For MAPbI3 we plot c′ = c/2 instead. Above T0, the structure is cubic, so only a single lattice parameter is shown. Solid lines show the general trend. | ||
There is a distinct difference in the lattice parameter behavior near the transition for CsyFA1−yPb(BrxI1−x)3 and MAPbI3 in that for the pure compound a′ and c converge approaching the transition temperature, but for the mixed-cation, mixed-halide perovskite a′ and c diverge approaching T0, especially c. We propose the following explanation for this unusual observation for CsyFA1−yPb(BrxI1−x)3 perovskite films. This divergent behavior is a manifestation of the compositional heterogeneity and the resulting distribution of transition temperatures. Fig. 3c and Table 1 show that CsyFA1−yPb(BrxI1−x)3 with high Br and/or low Cs will transform into the cubic phase at lower temperatures than for low Br and/or high Cs. Consequently, as temperature increases, regions of the CsyFA1−yPb(BrxI1−x)3 films with high Br and/or low Cs will transform first into the cubic phase and the tetragonal regions of the film will be those that are richer in Cs or poor in Br. Since the tetragonal t(210) and t(201) peaks are used to determine a′ and c in Fig. 4a, these lattice parameters will increasingly correspond to regions of low Br and/or high Cs. Fig. 4a shows c increasing approaching T0, and these still tetragonal regions must have relatively more I, the larger halide, thus driving the larger c. Although indirect, this suggests that there is more heterogeneity in the halide composition than for the A-site cation. We expand on this hypothesized behavior in Section S5 (ESI†) with a simple model with four regions with different compositions. Overall, these observations on the lattice parameters support our conclusion on compositional heterogeneity broadening the transition and point to the halides as more heterogeneous.
Band gap temperature dependence
To better understand how this tetragonal-to-cubic transition might influence the operation of solar cells, we measured the optical band gap as a function of temperature. We measured the external quantum efficiency (EQE) of an optimized Cs0.17FA0.83Pb(Br0.17I0.83)3 device at three temperatures on either side of T0 (temperature where the material is fully cubic) and extracted the band gap by fitting the low energy tail of the EQE at each temperature (see Section S6, ESI†). The extracted optical band gaps are plotted in Fig. 5. We observe that below T0 the band gap decreases with temperature, and above T0, the band gap increases with temperature. While both trends are modest, they are distinguishable.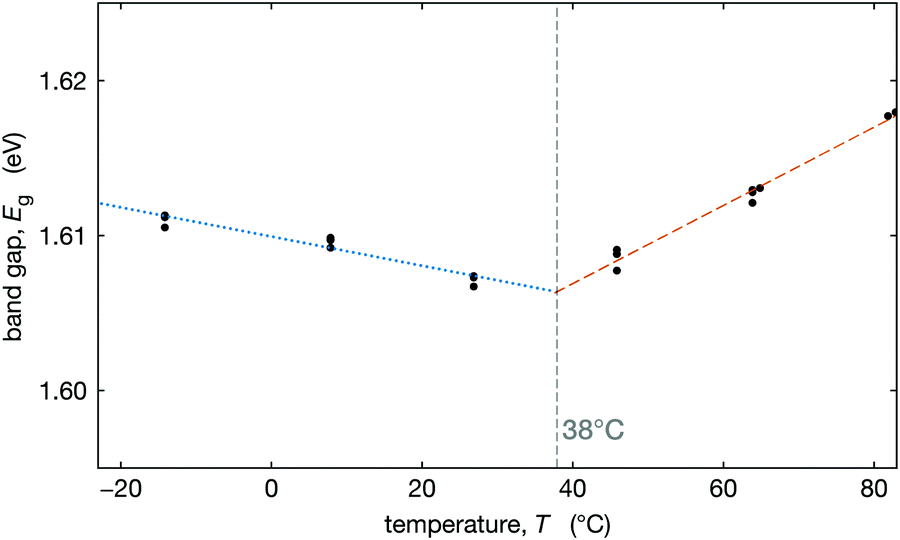 | ||
| Fig. 5 Band gap (eV) (black dots) for perovskite composition Cs0.17FA0.83Pb(Br0.17I0.83)3 as a function of temperature (°C), calculated from up and downward cycles of EQE, with a linear fit before discontinuity (blue dashed line) and after slope discontinuity (red dotted line). The grey dashed line shows the intersection of the two fit slopes. | ||
In the low-temperature tetragonal phase, the average tilt angle decreases upon heating, increasing the overlap of the orbitals associated with the Pb–X bonds, decreasing the band gap,69–72 consistent with Fig. 5. In the cubic phase above T0, the band gap increases with temperature, consistent with DFT calculations that show that the band gaps of biaxially strained cubic CsPbI3 and CsSnI3 increase with strain.70 This is because in the cubic phase, lattice expansion reduces the orbital overlap, increasing the band gap.69–72
We fit the decreasing and increasing band gap regimes with linear dependence and find that their intersection at 38 °C is nearly identical to the value of T0 = 37 °C that we estimate from XRD data, see Fig. 3b. These results (Fig. 5) coupled with our map of the transition temperature (Fig. 3b) can be used to estimate the temperature where the slope in the band gap vs. temperature changes from negative to positive (between about Tc and T0). A positive slope for the band gap vs. temperature results in a comparatively more efficient solar cell at higher temperatures than for a negative slope. Thus, the temperature where this slope changes may have important implications for the temperature coefficient for power conversion efficiency in MHP solar cells, if this is near typical operational temperatures.
Discussion
Relative to the pure phases, we have observed two distinct differences in the phase transition behavior for multi-cation, multi-halide MHPs. First, as reflected in the octahedral tilt angle, the transition is broadened over a considerable temperature range of the order of 40 °C. Second, the behavior of the lattice parameters of the tetragonal domains just below the transition diverges slightly as opposed to converging in the pure compounds. These behaviors are consistent with the presence of compositional heterogeneity.With respect to the phase transition behavior, we have defined two characteristic temperatures. T0 is the temperature at which the average tilt angle becomes zero and the entirety of the film adopts the cubic structure. Tc is the average transition temperature obtained from fitting the temperature dependence of the tilt angle to a broadened transition. While we cannot distinguish compositional heterogeneity as intrinsic (or thermodynamic) or extrinsic (processing-induced), T0 and Tc have different meanings for these scenarios. For the case of two-phase coexistence, with increasing temperature, the film evolves from pure tetragonal to cubic plus tetragonal to pure cubic.38 Here, T0 is a solvus temperature, while Tc is near the middle of the two-phase region. In the case of extrinsic heterogeneity, T0 corresponds to the transition temperature for regions with the highest transition temperature and Tc is the transition temperature reflective of the average composition. In either case the breadth of the transition, as obtained from either the fit transition width (see Section S2.3, ESI†) or the difference between T0 and Tc, is indicative of the compositional heterogeneity and can be used to provide an estimate of these inhomogeneities. With reference to Fig. 3b, which shows the variation in T0 with Cs and Br composition, a 30–40 °C change corresponds to roughly 10–15% variation in either Cs or Br composition. This suggests compositional variation of the order 10–15%, which is considerable.
There are additional ways that the phase transition might be broadened, in particular, the compound can be relaxor ferroelectric or dipolar glass. In this case, a homogeneous solid solution would transform upon cooling from a non-polar paraelectric to an ergodic relaxor state with polar nanoregions. This can eventually lead to vanishing or quenching the phase transition.73 While some studies pointed out that MHP alloys can present these responses,74,75 this is not the case in our work because (a) the P4/mbm tetragonal phase is not consistent with an ergodic relaxor or dipolar glass,73 (b) there is no evidence of a superlattice of ordered A or X sites, (c) at the temperature of our experiments (>300 K), freezing out the FA rotational motions does not occur, and (d) we constantly observe a phase transition throughout our compositional space.
From Fig. 3b, we find that at fixed Br substitution, T0 increases with increasing Cs substitution, and at fixed Cs substitution, T0 decreases with increasing Br substitution. The room temperature phase map reported by Beal et al. suggests that for higher degrees of Cs substitution, more Br substitution is required before any tetragonal phase is observed.14 This is because Cs is a smaller cation than FA, and Br is a smaller anion than I. Structurally, Br substitution shrinks the size of the cuboctahedral cavity so that it is a better fit for Cs, and the Goldschmidt tolerance factor τG is closer to unity.39 Thus, when the amount of Br in the lattice is increased, more Cs can be substituted into the cubic crystal lattice before any distortion in the form of octahedral rotations is required to decrease the size of the cuboctahedral cavity.14 This structural argument is also supported by DFT calculations, which confirm that the energy of the tetragonal phase is lower in systems where the A-site cation is small relative to its cuboctahedral cavity (τG < 1).55
A compositional variation of 10–15% is significant. It is reasonable to expect that this should lead to broadening of the XRD peaks of the order 0.5–1% of the peak Q value (e.g., 0.005 Å−1–0.01 Å−1 for the t(110)/(002) peak). This is estimated from the variation in lattice parameters with composition35,37 and the compositional differences estimated above. This prediction is less than the observed XRD peak widths of the t(110)/(002) and t(200)/(112) fundamental XRD peaks of about 0.005 Å−1 and 0.006 Å−1, respectively. One explanation of this apparent discrepancy is that regions of different composition are partly coherently strained to have similar or equal lattice parameters throughout the film; this would imply that the regions with varied composition are small in order to achieve such lattice coherency. This explanation would result in smaller peak widths than predicted from the estimated compositional variations, consistent with our data. In MAPb(BrxI1−x)3, prior work has shown a miscibility gap with strong intergrowth of I-rich and Br-rich crystallites and unexpected deviations from Vegard's law.35 These observations also may be related to the possibility of coherency strain.
Conclusion
We used synchrotron XRD to characterize the crystal structure of CsyFA1−yPb(BrxI1−x)3 perovskites across the tetragonal-to-cubic phase transition. We find that, in contrast to MAPbI3, which has an out-of-phase octahedral tilt pattern, CsyFA1−yPb(BrxI1−x)3 perovskites have an in-phase pattern of octahedral rotations about the c-axis. This symmetry gives rise to superlattice reflections in the XRD patterns that we use to calculate the temperature dependence of the octahedral tilt angle and lattice parameters across the transitions. Our results show that the tetragonal to cubic transition occurs over a broad range of temperatures that we identify as due to compositional heterogeneity leading to coexisting cubic and tetragonal regions. These give rise to a range of local transition temperatures that effectively smear out into the global transition. We estimate the local compositional variations of about 10–15% in either or both FA/Cs and Br/I, although the data suggest more in the halide. We also find that the temperature dependence of the band gap changes sign from negative to positive near the temperature where the MHP structure becomes cubic, which is explained as a competition between lattice expansion and lead–halide bond length changes due to varying tilt angle.Our results support and complement previous works demonstrating that multi-anion, multi-cation MHP films can be compositionally heterogeneous at the nanoscale. Furthermore, we have established a simple methodology to characterize this compositional heterogeneity in mixed-cation, mixed-halide MHP. Using this methodology can enable a way to understand the extent and impact of heterogeneity on the properties and performance of MHP photovoltaic materials.
Experimental data
Device fabrication and characterisation
Films were prepared using the standard chlorobenzene antisolvent method within a 4![[thin space (1/6-em)]](https://www.rsc.org/images/entities/char_2009.gif) :1 dimethylformamide (DMF)/dimethyl sulfoxide solvent (DMSO) mixture that was optimized for film morphology at each composition and is detailed in ref. 14. After spin casting, films were annealed on a hotplate at 60 °C for 1 min and subsequently at 105 °C for 30 min under an N2 atmosphere. Two-dimensional X-ray scattering patterns were collected with monochromatic 12.7 keV synchrotron beam on SSRL beam line 2-1 and recorded on a 255 mm2 × 255 mm2 detector, under a flowing He atmosphere. Images were calibrated using LaB6 and integrated to 1D using PyFAI.76 Tilt angle was obtained following the method developed in Sections S2 and S3 (ESI†). EQE was measured in a cryostat on solar cells made with the following stack: glass, ITO, NiOx, perovskite, PCBM, ALD SnO2, sputtered ITO. Light was shone through the sputtered ITO side.
:1 dimethylformamide (DMF)/dimethyl sulfoxide solvent (DMSO) mixture that was optimized for film morphology at each composition and is detailed in ref. 14. After spin casting, films were annealed on a hotplate at 60 °C for 1 min and subsequently at 105 °C for 30 min under an N2 atmosphere. Two-dimensional X-ray scattering patterns were collected with monochromatic 12.7 keV synchrotron beam on SSRL beam line 2-1 and recorded on a 255 mm2 × 255 mm2 detector, under a flowing He atmosphere. Images were calibrated using LaB6 and integrated to 1D using PyFAI.76 Tilt angle was obtained following the method developed in Sections S2 and S3 (ESI†). EQE was measured in a cryostat on solar cells made with the following stack: glass, ITO, NiOx, perovskite, PCBM, ALD SnO2, sputtered ITO. Light was shone through the sputtered ITO side.
MAPbBr3 crystallization and single crystal X-ray diffraction
MAPbBr3 crystals were prepared by inverse temperature crystallization. A 1 M solution of PbBr2 and MABr in DMF was prepared and passed through a 0.22 μm filter; the filtered solution was heated to 82 °C in an oil bath and removed after 30 min. MAPbBr3 crystals were isolated quickly from the cooling mother liquor to avoid re-dissolution. Crystals were mounted on an X-ray transparent MiTeGen microloop using Paratone oil and single crystal X-ray diffraction was performed on a Bruker D8 Venture diffractometer equipped with a Photon 100 CMOS detector. The temperature was varied from 100–300 K with an Oxford Cryostream.Data were collected from ϕ and ω scans using Mo-Kα radiation (λ = 0.71073 Å). The frames were integrated using SAINT V8.38A and absorption correction was performed with SADABS-2016/2, both implemented in the Bruker APEX 3 software. Space group determination was performed with XPREP, with space group assignment based on reported structures, systematic absences, |E × E − 1| statistics, and refinement statistics. The structure was solved using direct methods with the SHELXT software77 and refined using a least-squares method implemented by SHELXL-2014/7 in the Olex 2 software package.
The Pb and Br thermal displacement parameters are refined anisotropically, whereas the C, N, and H parameters are refined isotropically. Due to the well-known dynamic cation disorder in the tetragonal and cubic phases, the methylammonium (MA) molecule was refined two ways: as a single atom centered in the interstices, or as a molecule confined to reside along high symmetry directions determined by residual electron densities. Additional constraints to the MA cation were applied to the C–N bond length (1.47 Å) and to fix fractional occupancy to maintain stoichiometry. No significant differences were observed in the final structures refined with these two methods.
Author contributions
JB, AGP, MFT: conceptualization; JB, AGP, JAV: data curation; JB, JAV, LW, NJW, ZZ: formal analysis; REB, AFN (sample prep), AGP, JAV, LW, LTS (XRD), EW (EQE): investigation; JB, AGP, MFT, JAV, LW, NJW, ZZ: methodology; LTS, AFN, MDM, MFT: supervision; JAV, LW, NJW, ZZ: validation; JB, ZZ: visualisation; JB, REB: writing – original draft; all authors: writing – review and editing.Conflicts of interest
There are no conflicts of interest to declare.Acknowledgements
This work was supported by the U.S. Department of Energy (DOE) Solar Energy Technology Office (SETO) of the Energy Efficiency and Renewable Energy (EERE) award for the Derisking Halide Perovskite Solar Cells project at the National Renewable Energy Laboratory under Contract No. DE-AC36-08-GO28308 managed and operated by the Alliance for Sustainable Energy, LLC. Use of the Stanford Synchrotron Radiation Light-source, SLAC National Accelerator Laboratory, is supported by the U.S. Department of Energy, Office of Science, Office of Basic Energy Sciences under Contract No. DE-AC02-76SF00515. Part of this work was performed at the Stanford Nano Shared Facilities (SNSF), supported by the National Science Foundation under award ECCS-2026822. J. B. is supported by Fonds ESPCI Paris. J. A. V. acknowledges fellowship support from the Stanford University Office of the Vice Provost of Graduate Education and the National Science Foundation Graduate Research Fellowship Program under Grant No. DGE – 1656518. We thank Charles Musgrave, Joe Berry and Laura Mundt for productive discussions.References
- J. S. Manser, J. A. Christians and P. V. Kamat, Intriguing optoelectronic properties of metal halide perovskites, Chem. Rev., 2016, 116, 12956–13008, DOI:10.1021/acs.chemrev.6b00136.
- Y. Fu, H. Zhu, J. Chen, M. P. Hautzinger, X. Y. Zhu and S. Jin, Metal halide perovskite nanostructures for optoelectronic applications and the study of physical properties, Nat. Rev. Mater., 2019, 4, 169–188, DOI:10.1038/s41578-019-0080-9.
- G. E. Eperon, T. Leijtens, K. A. Bush, R. Prasanna, T. Green, J. T. W. Wang, D. P. McMeekin, G. Volonakis, R. L. Milot and R. May, Perovskite-perovskite tandem photovoltaics with optimized band gaps, Science, 2016, 354, 861–865, DOI:10.1126/science.aaf9717.
- M. V. Kovalenko, L. Protesescu and M. I. Bodnarchuk, Properties and potential optoelectronic applications of lead halide perovskite nanocrystals, Science, 2017, 358, 745–750, DOI:10.1126/science.aam7093.
- F. Sahli, J. Werner, B. A. Kamino, M. Brauninger, R. Monnard, B. Paviet-Salomon, L. Barraud, L. Ding, J. J. Diaz Leon, D. Sacchetto, G. Cattaneo, M. Despeisse, M. Boccard, S. Nicolay, Q. Jeangros, B. Niesen and C. Ballif, Fully textured monolithic perovskite/silicon tandem solar cells with 25.2% power conversion efficiency, Nat. Mater., 2018, 17, 820–826, DOI:10.1038/s41563-018-0115-4.
- J. Xu, C. C. Boyd, J. Y. Zhengshan, A. F. Palmstrom, D. J. Witter, B. W. Larson, R. M. France, J. Werner, S. P. Harvey and E. J. Wolf, et al., Triple-halide wide band gap perovskites with suppressed phase segregation for efficient tandems, Science, 2020, 367, 1097–1104, DOI:10.1026/science.aaz5074.
- NREL, Best research-cell efficiency chart, https://www.nrel.gov/pv/cell-efficiency.html.accessed (Feb 2021, 2020).
- M. A. Green, E. D. Dunlop, J. Hohl-Ebinger, M. Yoshita, N. Kopidakis and A. W. Ho-Baillie, Solar cell efficiency tables (Version 55), Prog. Photovoltaics, 2020, 28, 3–15, DOI:10.1002/pip.3371.
- J. P. Correa-Baena, M. Saliba, T. Buonassisi, M. Gratzel, A. Abate, W. Tress and A. Hagfeldt, Promises and challenges of perovskite solar cells, Science, 2017, 358, 739–744, DOI:10.1126/science.aam6323.
- H. J. Snaith, Present status and future prospects of perovskite photovoltaics, Nat. Mater., 2018, 17, 372–376, DOI:10.1038/s41563-018-0071-z.
- T. Soto-Montero, W. Soltanpoor and M. Morales-Masis, Pressing challenges of halide perovskite thin film growth, APL Mater., 2020, 8, 110903, DOI:10.1063/5.0027573.
- T. Leijtens, K. A. Bush, R. Prasanna and M. D. McGehee, Opportunities and challenges for tandem solar cells using metal halide perovskite semiconductors, Nat. Energy, 2018, 3, 828–838, DOI:10.1038/s41560-018-0190-4.
- E. T. Hoke, D. J. Slotcavage, E. R. Dohner, A. R. Bowring, H. I. Karunadasa and M. D. McGehee, Reversible photo-induced trap formation in mixed-halide hybrid perovskites for photovoltaics, Chem. Sci., 2015, 6, 613–617, 10.1039/C4SC03141E.
- R. E. Beal, N. Z. Hagstrom, J. Barrier, A. Gold-Parker, R. Prasanna, K. A. Bush, D. Pasarello, L. Schelhas, K. Bruning, H. G. Steinruck, M. D. McGehee, M. F. Toney and A. F. Nogueira, Structural origins of light-induced phase segregation in organic–inorganic halide perovskite photovoltaic materials, Matter, 2020, 2(1), 13, DOI:10.1016/j.matt.2019.11.001.
- A. J. Knight and L. M. Herz, Preventing phase segregation in mixed-halide perovskites: a perspective, Energy Environ. Sci., 2020, 13, 2024–2046, 10.1039/d0ee00788A.
- M. C. Brennan, A. Ruth, P. V. Kamat and M. Kuno, Photoinduced anion segregation in mixed halide perovskites, Trends Chem., 2020, 2, 282–301, DOI:10.1016/j.trechm.2020.01.010.
- C. Eames, J. M. Frost, P. R. Barnes, B. C. O'regan, A. Walsh and M. S. Islam, Ionic transport in hybrid lead iodide perovskite solar cells, Nat. Commun., 2015, 6(1), 8, DOI:10.1038/ncomms8497.
- A. Walsh and S. D. Stranks, Taking control of ion transport in halide perovskite solar cells, ACS Energy Lett., 2018, 3, 1983–1990, DOI:10.1021/acsenergylett.8b00764.
- A. Senocrate and J. Maier, Solid-state ionics of hybrid halide perovskites, J. Am. Chem. Soc., 2019, 141, 8382–8396, DOI:10.1021/jacs.8b13594.
- L. T. Schelhas, Z. Li, J. A. Christians, A. Goyal, P. Kairys, S. P. Harvey, D. H. Kim, K. H. Stone, J. M. Luther and K. Zhu, et al., Insights into operational stability and processing of halide perovskite active layers, Energy Environ. Sci., 2019, 12, 1341–1348, 10.1039/C8EE03051K.
- K. A. Bush, K. Frohna, R. Prasanna, R. E. Beal, T. Leijtens, S. A. Swifter and M. D. McGehee, Compositional engineering for efficient wide band gap perovskites with improved stability to photoinduced phase segregation, ACS Energy Lett., 2018, 3, 428–435, DOI:10.1021/acsenergylett.7b01255.
- A. J. Barker, A. Sadhanala, F. Deschler, M. Gandini, S. P. Senanayak, P. M. Pearce, E. Mosconi, A. J. Pearson, Y. Wu and A. R. Srimath Kandada, et al., Defect-assisted photoinduced halide segregation in mixed-halide perovskite thin films, ACS Energy Lett., 2017, 2, 1416–1424, DOI:10.1021/acsenergylett.7b00282.
- C. G. Bischak, E. M. Sanehira, J. T. Precht, J. M. Luther and N. S. Ginsberg, Heterogeneous charge carrier dynamics in organic–inorganic hybrid materials: Nanoscale lateral and depth-dependent variation of recombination rates in methylammonium lead halide perovskite thin films, Nano Lett., 2015, 15(7), 4799–4807, DOI:10.1021/acs.nanolett.5b01917.
- C. G. Bischak, C. L. Hetherington, H. Wu, S. Aloni, D. F. Ogletree, D. T. Limmer and N. S. Ginsberg, Origin of reversible photoinduced phase separation in hybrid perovskites, Nano Lett., 2017, 17, 1028–1033, DOI:10.1021/acs.nanolett.6b04453.
- C. G. Bischak, A. B. Wong, E. Lin, D. T. Limmer, P. Yang and N. S. Ginsberg, Tunable polaron distortions control the extent of halide demixing in lead halide perovskites, J. Phys. Chem. Lett., 2018, 9, 3998–4005, DOI:10.1021/acs.jpclett.8b01512.
- S. Wieghold, J. Tresback, J. P. Correa-Baena, N. T. P. Hartono, S. Sun, Z. Liu, M. Layurova, Z. A. VanOrman, A. S. Bieber, J. Thapa, B. Lai, Z. Cai, L. Nienhaus and T. Buonassisi, Halide heterogeneity affects local charge carrier dynamics in mixed-ion lead perovskite thin films, Chem. Mater., 2019, 31, 3712–3721, DOI:10.1021/acs.chemmater.9b00650.
- D. W. Quilettes, S. M. de, Vorpahl, S. D. Stranks, H. Nagaoka, G. E. Eperon, M. E. Ziffer, H. J. Snaith and D. S. Ginger, Impact of microstructure on local carrier lifetime in perovskite solar cells, Science, 2015, 348, 683–686, DOI:10.1126/science.aaa5333.
- J. P. Correa-Baena, Y. Luo, T. M. Brenner, J. Snaider, S. Sun, X. Li, M. A. Jensen, N. T. P. Hartono, L. Nienhaus and S. Wieghold, et al., Homogenized halides and alkali cation segregation in alloyed organic–inorganic perovskites, Science, 2019, 363, 627–631, DOI:10.1126/science.aah5065.
- R. Szostak, J. Silva, S. H. Turren-Cruz, M. Soares, R. Freitas, A. Hagfeldt, H. Tolentino and A. Nogueira, Nanoscale mapping of chemical composition in organic–inorganic hybrid perovskite films, Sci. Adv., 2019, 5, eaaw6619, DOI:10.1126/sciadv.aaw6619.
- E. M. Tennyson, T. A. S. Doherty and S. D. Stranks, Heterogeneity at multiple length scales in halide perovskite semiconductors, Nat. Rev. Mater, 2019, 4, 573–587, DOI:10.1038/s41578-019-0125-0.
- P. Gratia, G. Grancini, J. N. Audinot, X. Jeanbourquin, E. Mosconi, I. Zimmermann, D. Dowsett, Y. Lee, M. Gratzel and F. De Angelis, et al., Intrinsic halide segregation at nanometer scale determines the high efficiency of mixed cation/mixed halide perovskite solar cells, J. Am. Chem. Soc., 2016, 138, 15821–15824, DOI:10.1021/jacs.6b10049.
- S. K. Mishra, M. K. Gupta, R. Mittal, M. Zbiri, S. Rols, H. Schober and S. L. Chaplot, Phonon dynamics and inelastic neutron scattering of sodium niobate, Phys. Rev. B: Condens. Matter Mater. Phys., 2014, 89(18), 184303, DOI:10.1103/PhysRevB.89.184303.
- B. Charles, M. T. Weller, S. Rieger, L. E. Hatcher, P. F. Henry, J. Feldmann, D. Wolverson and C. C. Wilson, Phase behavior and substitution limit of mixed cesium-formamidinium lead triiodide perovskites, Chem. Mater., 2020, 32, 2282–2291, DOI:10.1021/acs.chemmater.9b04032.
- A. Mohanty, D. Swain, S. Govinda, T. N. G. Row and D. Sarma, Phase diagram and dielectric properties of MA1xFAxPbI3, ACS Energy Lett., 2019, 4, 2045–2051, DOI:10.1021/acsenergylett.9b01291.
- F. Lehmann, A. Franz, D. M. Tobbens, S. Levcenco, T. Unold, A. Taubert and S. Schorr, The phase diagram of a mixed halide (Br, I) hybrid perovskite obtained by synchrotron X-ray diffraction, RSC Adv., 2019, 9, 11151–11159, 10.1039/C8RA09398A.
- S. Y. Kim, H. C. Lee, Y. Nam, Y. Yun, S. H. Lee, D. H. Kim, J. H. Noh, J. H. Lee, D. H. Kim, S. Lee and Y. W. Heo, Ternary diagrams of the phase, optical bandgap energy and photoluminescence of mixed-halide perovskites, Acta Mater., 2019, 81, 460–469, DOI:10.1016/j.actamat.2019.10.008.
- Z. Li, M. Yang, J. S. Park, S. H. Wei, J. J. Berry and K. Zhu, Stabilizing perovskite structures by tuning tolerance factor: Formation of formamidinium and cesium lead iodide solid-state alloys, Chem. Mater., 2016, 28, 284–292, DOI:10.1021/acs.chemmater.5b04107.
- J. S. Bechtel and A. Van der Ven, First-principles thermodynamics study of phase stability in inorganic halide perovskite solid solutions, Phys. Rev. Mater., 2018, 2, 045401, DOI:10.1103/PhysRevMaterials.2.045401.
- V. M. Goldschmidt, Die gesetze der krystallochemie, Naturwissenschaften, 1926, 14, 477–485, DOI:10.1007/BF01507527.
- H. T. Stokes, E. H. Kisi, D. M. Hatch and C. J. Howard, Group-theoretical analysis of octahedral tilting in ferroelectric perovskites, Acta Crystallogr., Sect. B: Struct. Sci., 2002, 58, 934–938, DOI:10.1107/S0108768102015756.
- A. Glazer, The classification of tilted octahedra in perovskites, Acta Crystallogr., Sect. B: Struct. Crystallogr. Cryst. Chem., 1972, 28, 3384–3392, DOI:10.1107/S0567740872007976.
- W. Cochran, Crystal stability and the theory of ferroelectricity, Phys. Rev. Lett., 1959, 3(9), 412–414, DOI:10.1103/PhysRevLett.3.412.
- P. M. Woodward, Octahedral tilting in perovskites. I. Geometrical considerations, Acta Crystallogr., Sect. B: Struct. Sci., 1997, 53, 32–43, DOI:10.1107/S0108768196010713.
- P. M. Woodward, Octahedral tilting in perovskites. II. Structure stabilizing forces, Acta Crystallogr., Sect. B: Struct. Sci., 1997, 53, 44–66, DOI:10.1107/S0108768196012050.
- K. Aleksandrov, The sequences of structural phase transitions in perovskites, Ferroelectrics, 1976, 14, 801–805, DOI:10.1080/00150197608237799.
- J. S. Bechtel and A. Van der Ven, Octahedral tilting instabilities in inorganic halide perovskites, Phys. Rev. Mater., 2018, 2(2), 025401, DOI:10.1103/PhysRevMaterials.2.025401.
- W. Zhong and D. Vanderbilt, Competing structural instabilities in cubic perovskites, Phys. Rev. Lett., 1995, 74(13), 2587–2590, DOI:10.1103/PhysRevLett.74.2587.
- V. Gopalan and D. B. Litvin, Rotation-reversal symmetries in crystals and handed structures, Nat. Mater., 2011, 10, 376, DOI:10.1038/nmat2987.
- C. J. Bartel, C. Sutton, B. R. Goldsmith, R. Ouyang, C. B. Musgrave, L. M. Ghiringhelli and M. Scheffler, New tolerance factor to predict the stability of perovskite oxides and halides, Sci. Adv., 2019, 5, eaav0693, DOI:10.1126/sciadv.aav0693.
- L. T. Schelhas, J. A. Christians, J. J. Berry, M. F. Toney, C. J. Tassone, J. M. Luther and K. H. Stone, Monitoring a silent phase transition in CH3NH3PbI3 solar cells via operando X-ray diffraction, ACS Energy Lett., 2016, 1, 1007–1012, DOI:10.1021/acsenergylett.6b00441.
- R. A. Cowley, Lattice dynamics and phase transitions of strontium titanate, Phys. Rev., 1964, 134(4A), A981–A997, DOI:10.1103/PhysRev.134.A981.
- G. Shirane and Y. Yamada, Lattice-Dynamical Study of the 110°K Phase Transition in SrTiO3, Phys. Rev., 1969, 177(2), 858–863, DOI:10.1103/PhysRev.177.858.
- J. Harada, J. D. Axe and G. Shirane, Neutron-scattering study of soft modes in cubic BaTiO3, Phys. Rev. B: Solid State, 1971, 4(1), 155–162, DOI:10.1103/PhysRevB.4.155.
- E. K. H. Salje, M. C. Gallardo, J. Jimenez, F. J. Romero and J del Cerro, The cubic-tetragonal phase transition in strontium titanate: excess specific heat measurements and evidence for a neartricritical, mean field type transition mechanism, J. Phys.: Condens. Matter, 1998, 10, 5535–5543, DOI:10.1088/0953-8984/10/25/006.
- J. Young and J. M. Rondinelli, Octahedral rotation preferences in perovskite iodides and bromides, J. Phys. Chem. Lett., 2016, 7, 918–922, DOI:10.1021/acs.jpclett.6b00094.
- O. J. Weber, D. Ghosh, S. Gaines, P. F. Henry, A. B. Walker, M. S. Islam and M. T. Weller, Phase behavior and polymorphism of formamidinium lead iodide, Chem. Mater., 2018, 30, 3768–3778, DOI:10.1021/acs.chemmater.8b00862.
- D. Ghosh, A. R. Smith, A. B. Walker and M. S. Islam, Mixed a-cation perovskites for solar cells: Atomic-scale insights into structural distortion, hydrogen bonding, and electronic properties, Chem. Mater., 2018, 30, 5194–5204, DOI:10.1021/acs.chemmater.8b01851.
- A. Francisco-Lopez, B. Charles, M. I. Alonso, M. Garriga, M. Campoy-Quiles, M. T. Weller and A. R. Goni, Phase diagram of methylammonium/formamidinium lead iodide perovskite solid solutions from temperature-dependent photoluminescence and Raman spectroscopies, J. Phys. Chem. C, 2020, 124, 3448–3458, DOI:10.1021/acs.jpcc.9b10185.
- A. Franz, D. M. Tobbens, F. Lehmann, M. Kargell and S. Schorr, The influence of deuteration on the crystal structure of hybrid halide perovskites: A temperature-dependent neutron diffraction study of FAPbBr3, Acta Crystallogr., Sect. B: Struct. Sci., Cryst. Eng. Mater., 2020, 76, 267–274, DOI:10.1107/S2052520620002620.
- Y. Kawamura, H. Mashiyama and K. Hasebe, Structural study on cubic? Tetragonal transition of CH3NH3PbI3, J. Phys. Soc. Jpn., 2002, 71, 1694–1697, DOI:10.1143/JPSJ.71.1694.
- H. Mashiyama, Y. Kawamura, E. Magome and Y. Kubota, Displacive character of the cubic-tetragonal transition in CH3NH3PbX3, J. Korean Phys. Soc., 2003, 42(April), S1026–S1029 CAS.
- R. Comin, M. K. Crawford, A. H. Said, N. Herron, W. E. Guise, X. Wang, P. S. Whitfield, A. Jain, X. Gong, A. J. H. McGaughey and E. H. Sargent, Lattice dynamics and the nature of structural transitions in organolead halide perovskites, Phys. Rev. B, 2016, 94(9), 094301, DOI:10.1103/PhysRevB.94.094301.
- P. Whitfield, N. Herron, W. Guise, K. Page, Y. Cheng, I. Milas and M. Crawford, Structures, phase transitions and tricritical behavior of the hybrid perovskite methyl ammonium lead iodide, Sci. Rep., 2016, 6, 35685, DOI:10.1038/srep35685.
- F. Brivio, J. M. Frost, J. M. Skelton, A. J. Jackson, O. J. Weber, M. T. Weller, A. R. Goni, A. M. A. Leguy, P. R. F. Barnes and A. Walsh, Lattice dynamics and vibrational spectra of the orthorhombic, tetragonal, and cubic phases of methylammonium lead iodide, Phys. Rev. B: Condens. Matter Mater. Phys., 2015, 92, DOI:10.1103/PhysRevB.92.144308.
- F. Cordero, F. Trequattrini, F. Craciun, A. Paoletti, G. Pennesi and G. Zanotti, Cation reorientation and octahedral tilting in the metal–organic perovskites MAPI and FAPI, J. Alloys Compd., 2020, 158210, DOI:10.1016/j.jallcom.2020.158210.
- N. J. Weadock, P. M. Gehring, A. Gold-Parker, I. C. Smith, H. I. Karunadasa and M. F. Toney, On the question of dynamic domains and critical scattering in cubic methylammonium lead triiodide, Phys. Rev. Lett., 2020, 125, 075701, DOI:10.1103/PhysRevLett.125.075701.
- N. Ru, C. Condron, G. Margulis, K. Shin, J. Laverock, S. Dugdale, M. Toney and I. Fisher, Effect of chemical pressure on the charge density wave transition in rare-earth tritellurides RTe3, Phys. Rev. B: Condens. Matter Mater. Phys., 2008, 77, 035114, DOI:10.1103/PhysRevB.77.035114.
- M. Abdelsamie, J. Xu, K. Bruening, C. J. Tassone, H. G. Steinruck and M. F. Toney, Impact of processing on structural and compositional evolution in mixed metal halide perovskites during film formation, Adv. Funct. Mater., 2020, 30, 2001752, DOI:10.1002/adfm.202001752.
- Y. Chang, C. Park and K. Matsuishi, First principles study of the structural and the electronic properties of the lead-halide-based inorganic–organic perovskites (CH3NH3)PbX3 and CsPbX3 (X = Cl, Br, I), J. Korean Phys. Soc., 2004, 44(4), 889–893 CAS.
- C. Grote and R. F. Berger, Strain tuning of tin halide and lead halide perovskites: A first-principles atomic and electronic structure study, J. Phys. Chem. C, 2015, 119, 22832–22837, DOI:10.1021/acs.jpcc.5b07446.
- J. H. Lee, N. C. Bristowe, J. H. Lee, S. H. Lee, P. D. Bristowe, A. K. Cheetham and H. M. Jang, Resolving the physical origin of octahedral tilting in halide perovskites, Chem. Mater., 2016, 28, 4259–4266, DOI:10.1021/acs.chemmater.6b00968.
- R. Prasanna, A. Gold-Parker, T. Leijtens, B. Conings, A. Babayigit, H. G. Boyen, M. F. Toney and M. D. McGehee, Band gap tuning via lattice contraction and octahedral tilting in perovskite materials for photovoltaics, J. Am. Chem. Soc., 2017, 139, 11117–11124, DOI:10.1021/jacs.7b04981.
- A. A. Bokov and Z. G. Ye, Recent progress in relaxor ferroelectrics with perovskite structure, J. Mater. Sci., 2006, 41, 31–52 CrossRef CAS.
- E. M. Mozur, M. A. Hope, J. C. Trowbridge, D. M. Halat, L. L. Daemen, A. E. Maughan, T. R. Prisk, C. P. Grey and J. R. Neilson, Cesium substitution disrupts concerted cation dynamics in formamidinium hybrid perovskites, Chem. Mater., 2020, 32, 6266–6277 CrossRef CAS.
- M. Simenas, S. Balciunas, J. N. Wilson, S. Svirskas, M. Kinka, A. Garbaras, V. Kalendra, A. Gagor, D. Szewczyk and A. Sieradzki, et al., Suppression of phase transitions and glass phase signatures in mixed cation halide perovskites, Nat. Commun., 2020, 11, 1–9 Search PubMed.
- J. Kieffer and D. Karkoulis, PyFAI, a versatile library for azimuthal regrouping, J. Phys.: Conf. Ser., 2013, 202012, DOI:10.1088/1742-6596/425/20/202012i.
- G. M. Sheldrick, SHELXT Integrated space-group and crystal-structure determination, Acta Crystallogr., Sect. A: Found. Adv., 2015, 71, 3–8, DOI:10.1107/S2053273314026370.
Footnotes |
| † Electronic supplementary information (ESI) available. See DOI: 10.1039/d1ee01184g |
| ‡ These authors contributed equally. |
| This journal is © The Royal Society of Chemistry 2021 |