
 Open Access Article
 This Open Access Article is licensed under a
 Creative Commons Attribution 3.0 Unported Licence
Ozone production and precursor emission from wildfires in Africa†
James D.
Lee
 *ab,
Freya A.
Squires‡
a,
Tomás
Sherwen
ab,
Shona E.
Wilde
a,
Samuel J.
Cliff
a,
Lucy J.
Carpenter
a,
James R.
Hopkins
ab,
Stephane J.
Bauguitte
c,
Chris
Reed
c,
Patrick
Barker
d,
Grant
Allen
d,
Thomas J.
Bannan
d,
Emily
Matthews
d,
Archit
Mehra§
d,
Carl
Percival
e,
Dwayne E.
Heard
f,
Lisa K.
Whalley
fg,
Grace V.
Ronnie
f,
Samuel
Seldon
f,
Trevor
Ingham
f,
Christoph A.
Keller
hi,
K. Emma
Knowland
hi,
Euan G.
Nisbet
j and
Stephen
Andrews
ab
*ab,
Freya A.
Squires‡
a,
Tomás
Sherwen
ab,
Shona E.
Wilde
a,
Samuel J.
Cliff
a,
Lucy J.
Carpenter
a,
James R.
Hopkins
ab,
Stephane J.
Bauguitte
c,
Chris
Reed
c,
Patrick
Barker
d,
Grant
Allen
d,
Thomas J.
Bannan
d,
Emily
Matthews
d,
Archit
Mehra§
d,
Carl
Percival
e,
Dwayne E.
Heard
f,
Lisa K.
Whalley
fg,
Grace V.
Ronnie
f,
Samuel
Seldon
f,
Trevor
Ingham
f,
Christoph A.
Keller
hi,
K. Emma
Knowland
hi,
Euan G.
Nisbet
j and
Stephen
Andrews
ab
aDepartment of Chemistry, University of York, York, YO10 5DD, UK. E-mail: james.lee@york.ac.uk
bNational Centre for Atmospheric Science, University of York, YO10 5DD, York, UK
cFAAM Airborne Laboratory, National Centre for Atmospheric Sciences, Cranfield University, Building 146, Central Avenue, Cranfield, Bedfordshire MK43 0AL, UK
dSchool of Earth and Environmental Sciences, University of Manchester, Manchester, M13 9PL, UK
eNASA Jet Propulsion Laboratory: Pasadena, CA, USA
fSchool of Chemistry, University of Leeds, Leeds, LS2 9JT, UK
gNational Centre for Atmospheric Science, University of Leeds, Leeds, LS2 9JT, UK
hUniversities Space Research Association, Columbia, MD, USA
iNASA Goddard Space Flight Center, Greenbelt, MD, USA
jDepartment of Earth Sciences, Royal Holloway, University of London, Egham, UK
First published on 23rd September 2021
Abstract
Tropospheric ozone (O3) negatively impacts human health and is also a greenhouse gas. It is formed photochemically by reactions of nitrogen oxides (NOx) and volatile organic compounds (VOCs), of which wildfires are an important source. This study presents data from research flights sampling wildfires in West and Central African savannah regions, both close to the fires and after the emissions had been transported several days over the tropical North Atlantic Ocean. Emission factors (EFs) in g kg−1 for NOx (as NO), six VOCs and formaldehyde were calculated from enhancement to mole fractions in data taken close to the fires. For NOx, the emission factor was calculated as 2.05 ± 0.43 g kg−1 for Senegal and 1.20 ± 0.28 g kg−1 for Uganda, both higher than the average value of 1.13 ± 0.6 g kg−1 for previous studies of African savannah regions. For most VOCs (except acetylene), EFs in Uganda were lower by factors of 20–50% compared to Senegal, with almost all the values below those in the literature. O3 enhancement in the fire plumes was investigated by examining the ΔO3/ΔCO enhancement ratio, with values ranging from 0.07–0.14 close to the fires up to 0.25 for measurements taken over the Atlantic Ocean up to 200 hours downwind. In addition, measurements of O3 and its precursors were compared to the output of a global chemistry transport model (GEOS-CF) for the flights over the Atlantic Ocean. Normalised mean bias (NMB) comparison between the measured and modelled data was good outside of the fire plumes, with CO showing a model under-prediction of 4.6% and O3 a slight over-prediction of 0.7% (both within the standard deviation of the data). For NOx the agreement was poorer, with an under-prediction of 9.9% across all flights. Inside the fire plumes the agreement between modelled and measured values is worse, with the model being biased significantly lower for all three species. In total across all flights, there was an under-prediction of 29.4%, 16.5% and 37.5% for CO, O3 and NOx respectively. Finally, the measured ΔO3/ΔCO enhancement ratios were compared to those in the model for the equivalent flight data, with the model showing a lower value of 0.17 ± 0.03 compared to an observed value of 0.29 ± 0.05. The results detailed here show that the O3 burden to the North Atlantic Ocean from African wildfires may be underestimated and that further study is required to better study the O3 precursor emissions and chemistry.
Environmental significanceTropospheric ozone is important in the context of both climate and air quality. It is formed photo-chemically in the troposphere by reactions of carbon monoxide and volatile organic compounds in the presence of nitrogen oxides. Wildfires are an important source of these precursors particularly in Africa. It is estimated that surface emissions from biomass burning contribute ∼24% to boundary layer ozone over Africa. This work presents measurements of the precursors of ozone formation from fires in Senegal and Uganda, providing new data on emission factors from the region. It also provides insight into the performance of a global chemistry transport model (GEOS-CF) for predicting ozone formed from wildfires in Africa as the air is transported over the Atlantic Ocean. |
1 Introduction
Tropospheric ozone (O3) is an important atmospheric constituent in the contexts of climate, air quality, and tropospheric chemistry. O3 is a secondary pollutant formed by the photo-oxidation of carbon monoxide (CO) and volatile organic compounds (VOCs) in the presence of nitrogen oxides (NOx), with an additional tropospheric source arising from transport from the stratosphere. O3 levels in the troposphere can also increase from the transport from the stratosphere, where O3 is naturally abundant. Emissions of O3 precursors (i.e. NOx and VOCs) can be anthropogenic in origin (e.g. fossil fuel combustion) and can also have natural sources such as wildfires, lightning and biogenic processes. Globally, wildfires have been estimated to produce approximately 170 Tg of O3 per year, which is 3.5% of all tropospheric O3 production.1,2 Africa is the single most important region for biomass burning related tropospheric O3, accounting for approximately 35% of the global annual pyrogenic O3 enhancement. It is estimated that surface emissions from biomass burning contribute ∼24% to boundary layer O3 over Africa, with a large fraction of this transported away from the continent.3 O3 production in a smoke plume is a complex process and depends on several factors including the relative composition of fire emissions, chemical and photochemical reactions, smoke injection height, aerosol effects on chemistry and radiation, and local and downwind meteorological conditions. Biomass burning encompasses both natural- and human-induced fires, and there remains significant uncertainty in the global estimates of emission factors of O3 precursors (VOCs and NOx) from these sources4 and in the trends of these emissions over time.5,6 Emissions of the precursors and the subsequent photochemical O3 formation are observed in different locations and on different scales.7,8 Often, one of the goals of making the measurements is to assess the skill of regional or global models in predicting O3 in fire plumes.9 Whilst the photochemistry involved in O3 formation through hydroxyl radical (OH) initiated oxidation of VOCs and the reaction of the peroxy radical formed with NO is relatively well understood, models can still struggle to describe the evolution of atmospheric composition in fire plumes.10 These model shortcomings are usually often attributed to errors in the chemical reaction rates,11 emissions, resolving plume or filament structures due to spatial (vertical and horizontal) resolution,12 or meteorology, demonstrating the need for further study.The effect of biomass burning has been studied extensively both on a global scale and over the North Atlantic region,13–15 with increased levels of O3, CO and NOx (ref. 13) as well as HCN16 and HNCO17 observed in fire plumes. However, observations and modelling of O3 and its precursors from the African sub-Saharan tropics are scarce,1,2 with the majority of previous studies concentrating on emissions from North America.18–20 Fires from the African continent constitute an important source of NOx and VOCs and transport of the air on prevailing Easterly winds mean they become an important source of O3 to the North Atlantic Ocean, therefore this lack of information warrants further study of the region.
The Methane Observations and Yearly Assessments (MOYA) project (see Fig. 1 for campaign locations) was focused primarily on closing the global methane budget through new in situ observations and analysis of existing datasets. This is being achieved (in part) by targeted field campaigns to quantify poorly-quantified methane sources on local and regional scales (including from wildfires), as well as the use of atmospheric chemical transport models such as GEOS-Chem21 in order to provide global estimates of methane emission trends. Two aircraft-based field campaigns were conducted in the northern sub-Saharan African region as a part of the MOYA project, timed to coincide with the dry season and hence the period of most intense burning.22 The first was based in Dakar, Senegal between 27 February 2017 and 3 March 2017, and the second based in Uganda and Zambia between 16 January 2019 and 11 February 2019 (referred to as MOYA-1 and MOYA-2 respectively throughout).
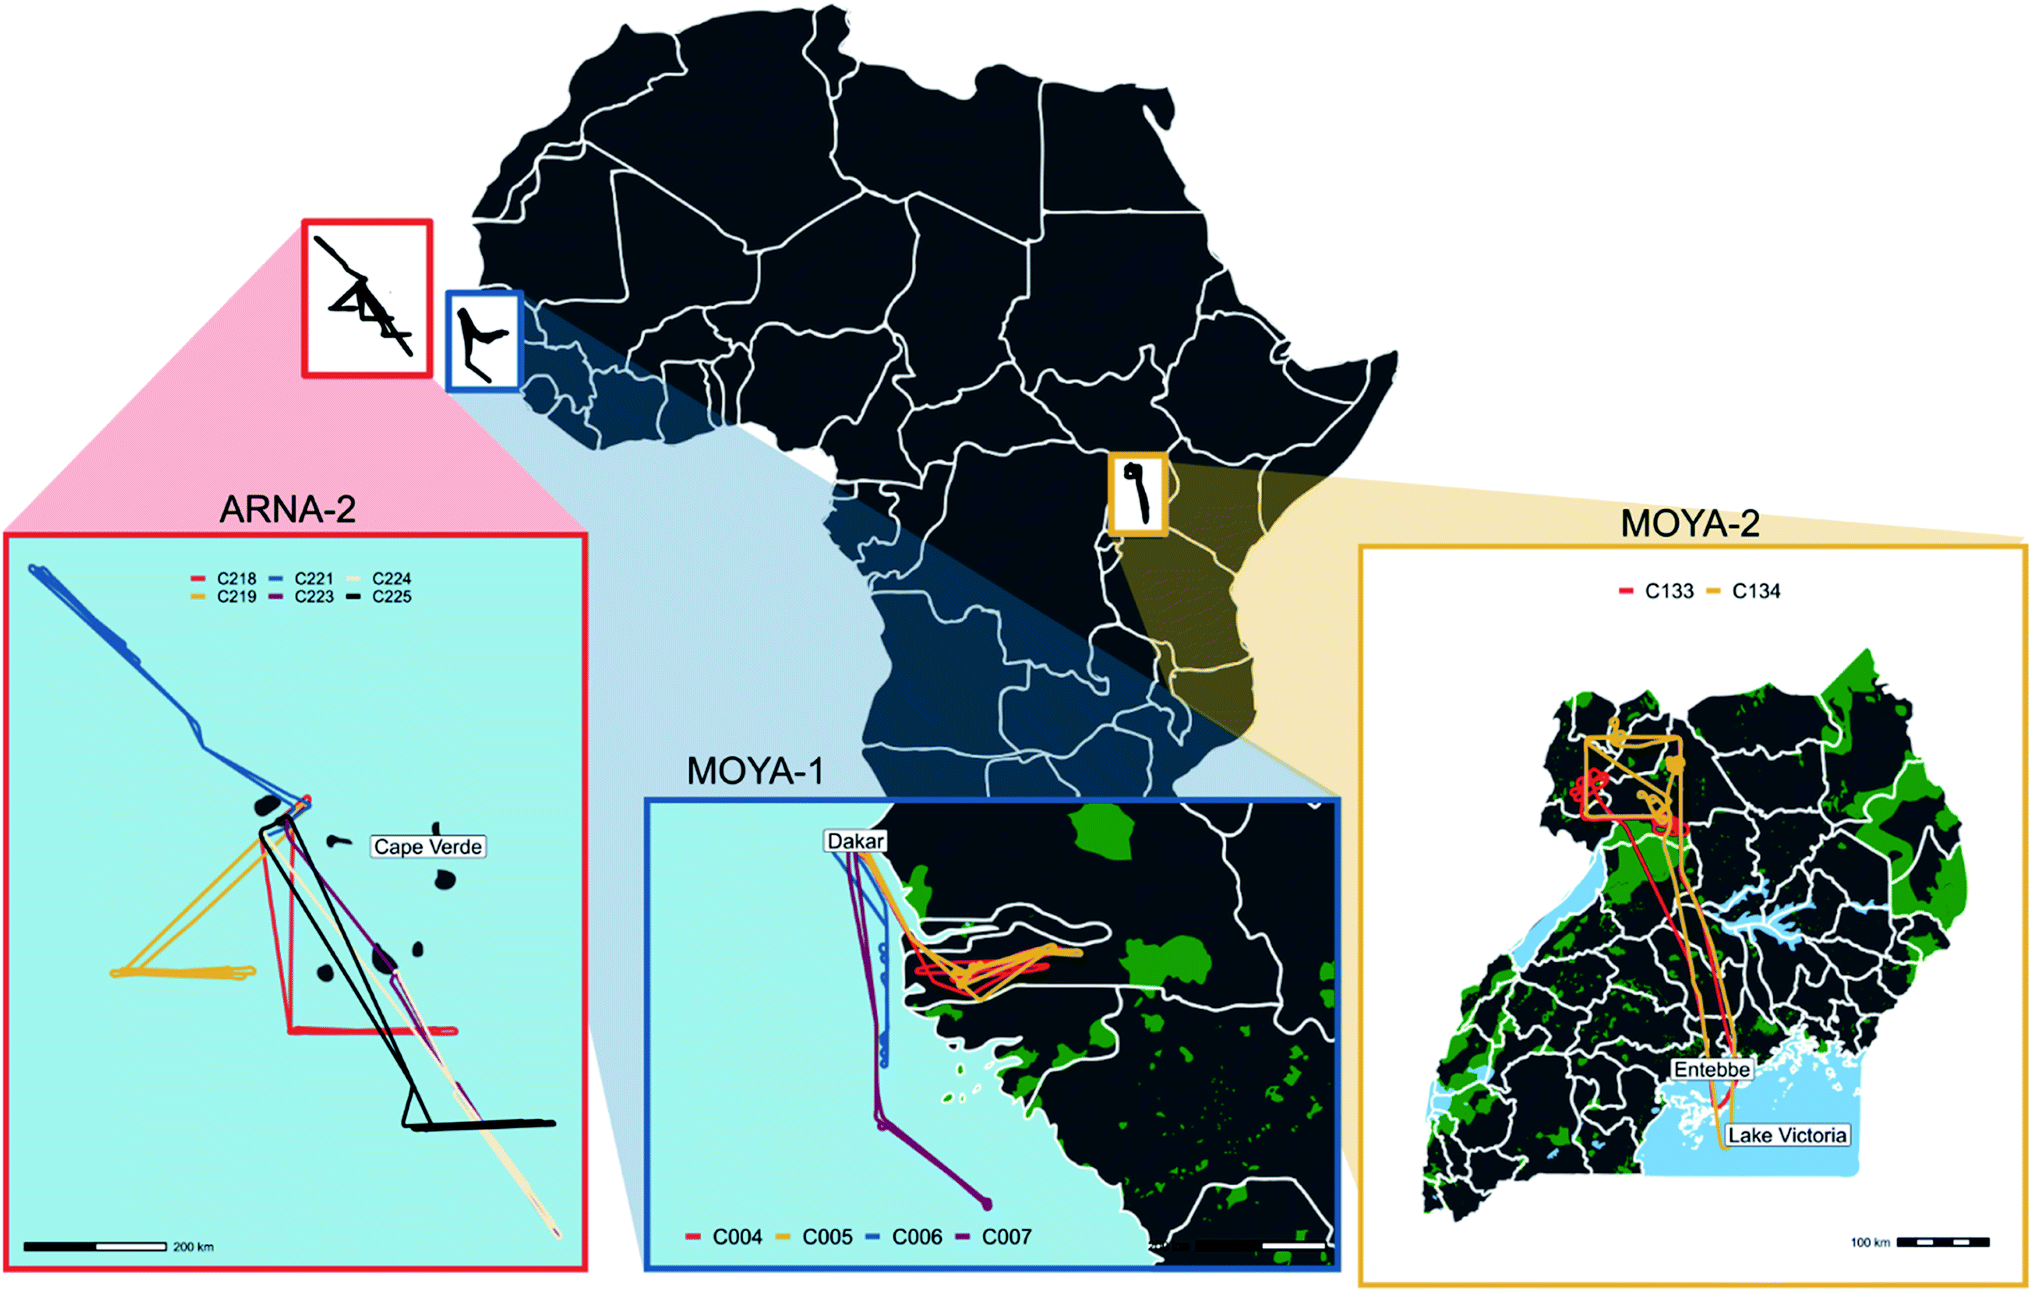 | ||
| Fig. 1 All locations and flight tracks from campaigns MOYA-1 (28th February 2017 to 2nd March 2017), MOYA-2 (28th to 29th January 2019) and ARNA-2 (5th to 12th February 2020). | ||
The Atmospheric Reactive Nitrogen over the remote Atlantic (ARNA) project was focused on sources of NOx in the remote marine troposphere, in particular “renoxification” from particle bound nitrate to HONO and NO2.23,24 The project involved two aircraft based field campaigns based on São Vicente, Cape Verde, approximately 600 km from the coast of Senegal (see Fig. 1 for campaign locations). ARNA-1 took place in August 2019, a time when the area around Cape Verde does not experience much outflow from Africa, and hence could be used as background measurements. ARNA-2 took place in February 2020, when the Cape Verde region is often influenced by dust-rich air from the Sahara, that has also passed over the burning region of West Africa. During the ARNA-2 campaign, NASA's Global Modelling Assimilation Office provided near-real time support. Only ARNA-2 flights are examined here.
In this paper, we present aircraft-based measurements of a range of gas phase species in order to investigate O3 formation in the fire plumes. Measurements of a range of plume ages from a few minutes to several days are presented, along with the corresponding O3![[thin space (1/6-em)]](https://www.rsc.org/images/entities/char_2009.gif) :CO enhancement ratio (Section 2). The measurements are then compared against the publicly-available global coupled meteorology-chemistry model output produced by the NASA Goddard Earth Observing System Composition Forecast system (GEOS-CF)25 in order to assess the model skill in capturing observations of O3 in the fire plumes. By comparing measured emission factors of CO, NOx and a range of VOCs – taken from flights close to the fires – the emission factors used in the model are assessed and any errors in the model prediction of O3.
:CO enhancement ratio (Section 2). The measurements are then compared against the publicly-available global coupled meteorology-chemistry model output produced by the NASA Goddard Earth Observing System Composition Forecast system (GEOS-CF)25 in order to assess the model skill in capturing observations of O3 in the fire plumes. By comparing measured emission factors of CO, NOx and a range of VOCs – taken from flights close to the fires – the emission factors used in the model are assessed and any errors in the model prediction of O3.
2 Methods
2.1 Description of flights
All flights were carried out by the UK's large atmospheric research aircraft, a BAe-146-301 managed by the Facility for Airborne Atmospheric Measurements (FAAM). The flight tracks from the three field campaigns are shown in Fig. 1 and described below.Fig. 2 shows five-day HYSPLIT back trajectories calculated using the Global Forecast System (GFS) weather forecast model produced by the National Centers for Environmental Prediction (NCEP), for each of the far field flights (C006, C007, C218, C219, C221, C223, C224 and C225). A trajectory was calculated for every minute in which biomass burning was sampled during each flight, as determined through a biomass burning flag where simultaneous enhancements of HCN and CO seven standard deviations above background signified the sampling of biomass burning outflow. The trajectories are overlaid on satellite retrievals of locations that were actively burning during the time of the flights (and the 7 days before), taken from the NASA MODerate Resolution Imaging Spectrometer (MODIS). These indicate that all flights sampled outflow from the large concentration of fires across West Africa, with an air mass age between 1–5 days.
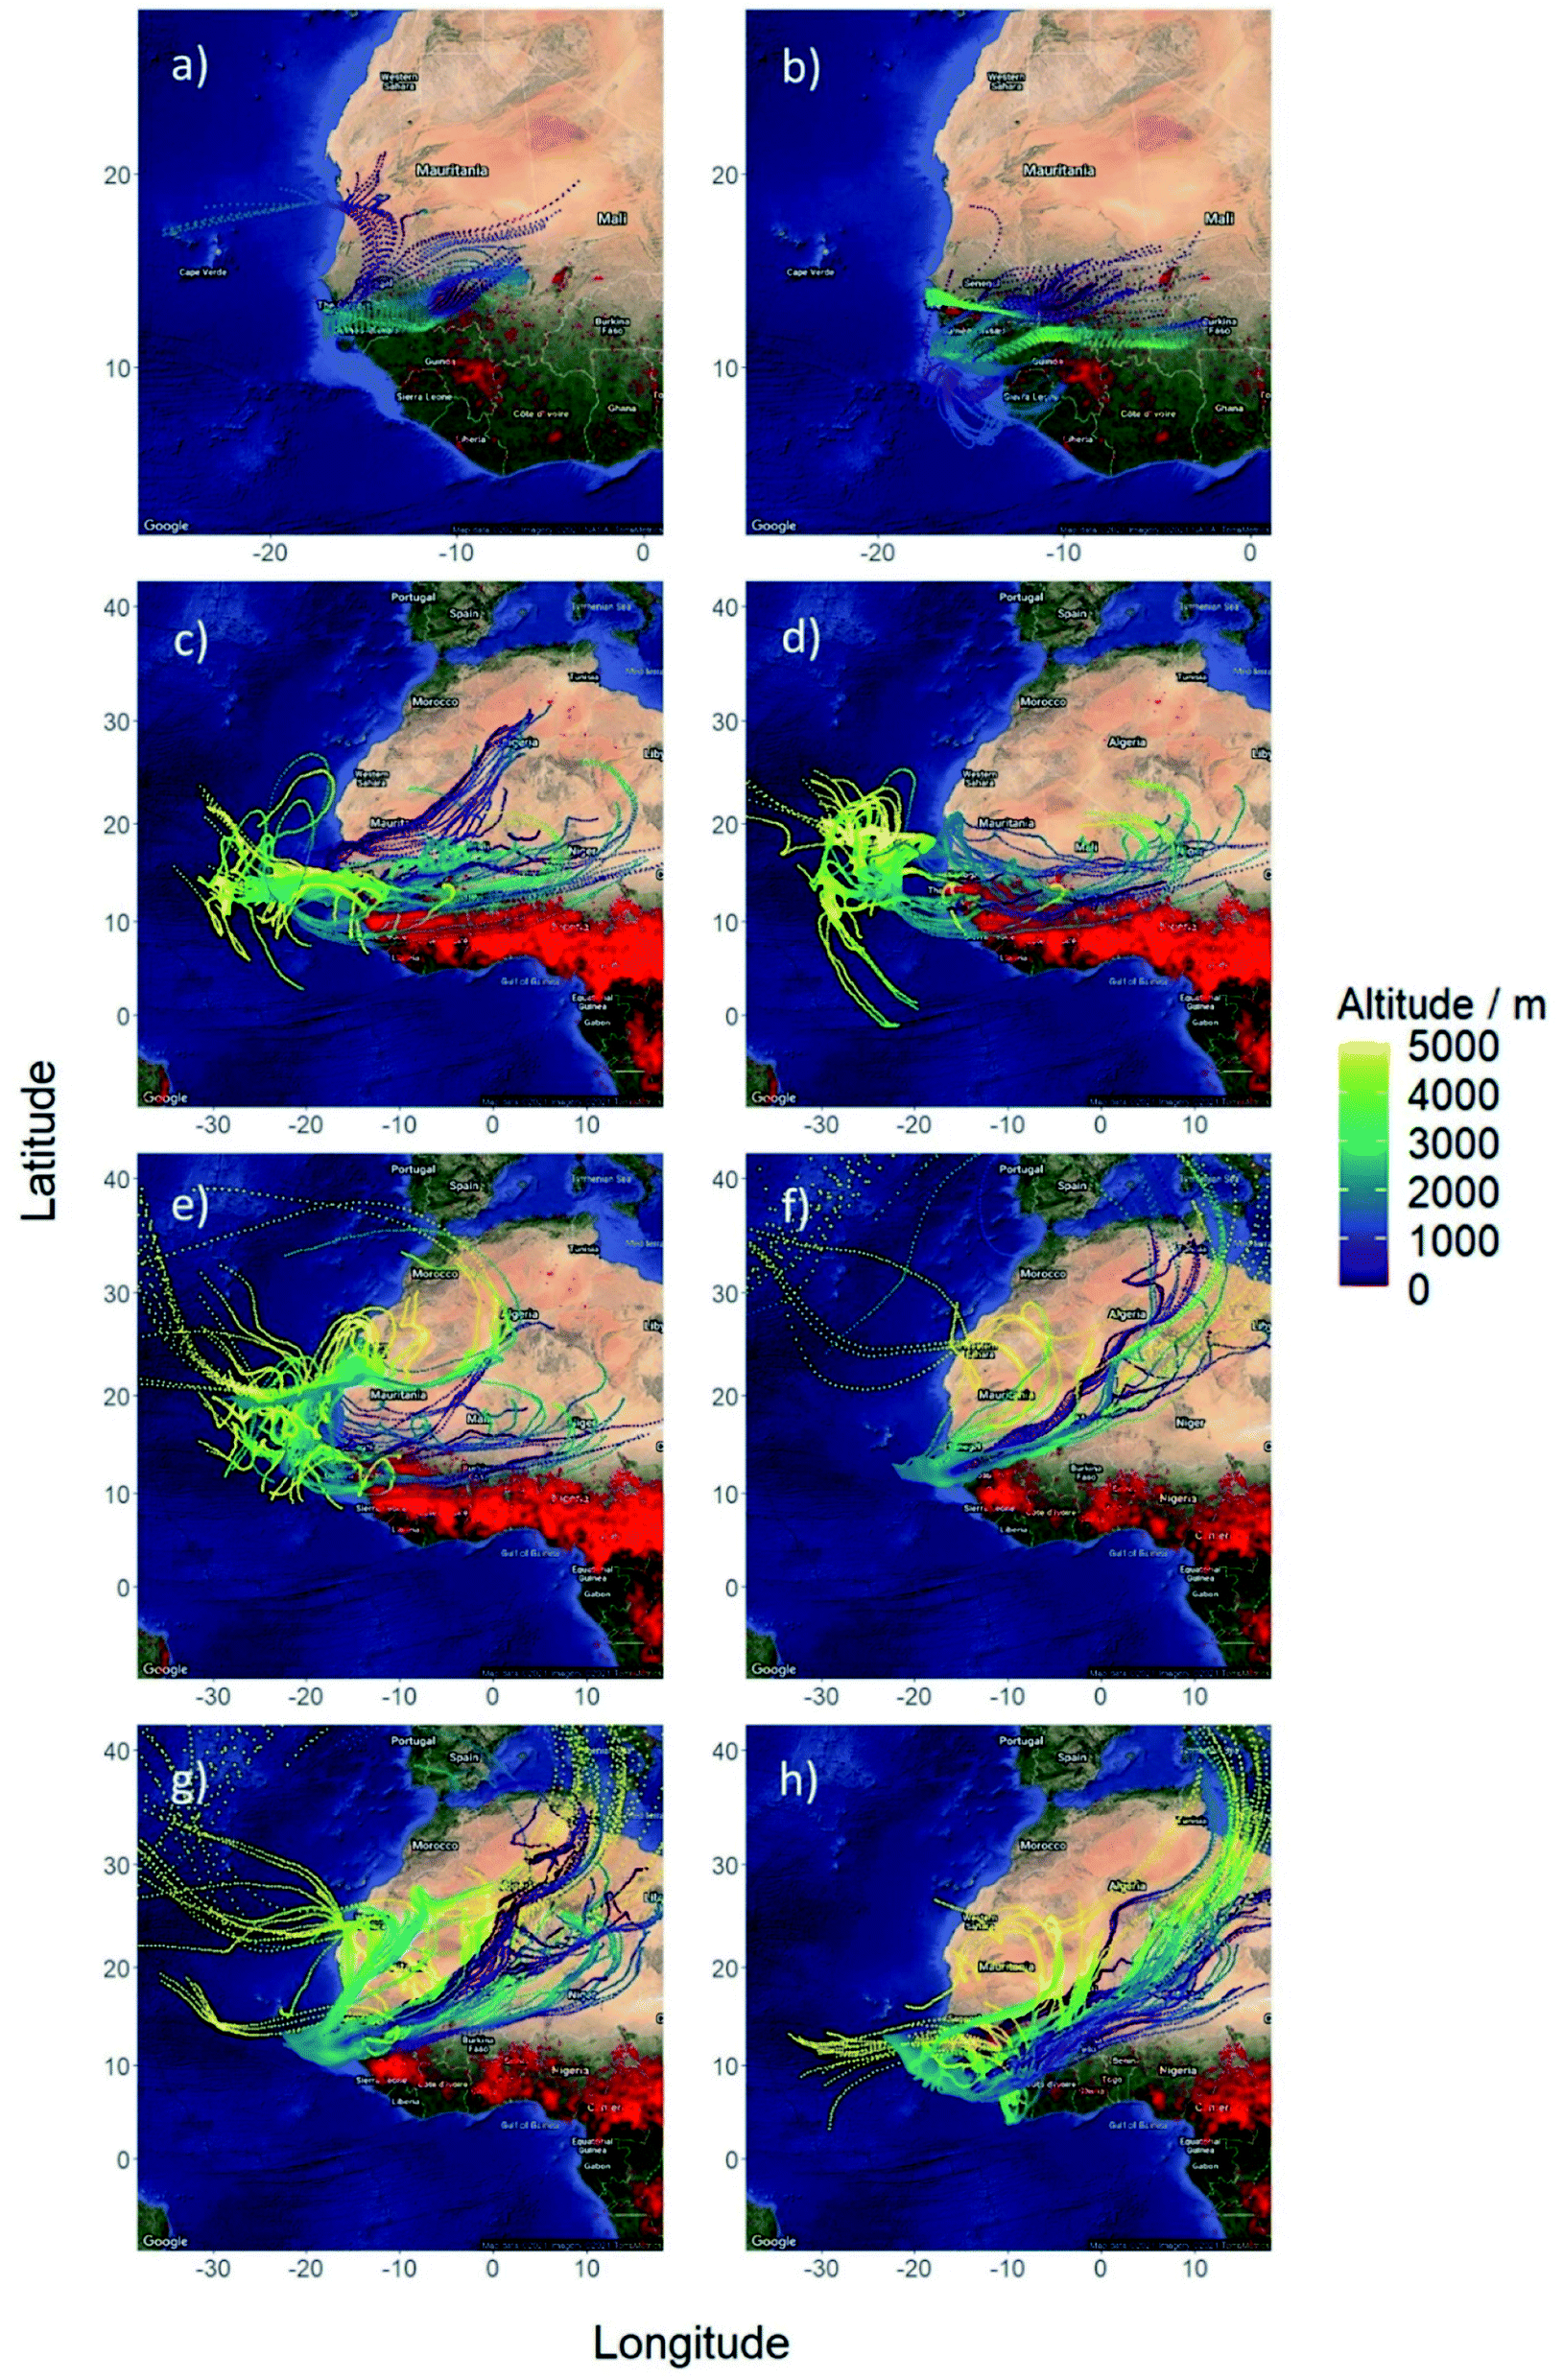 | ||
| Fig. 2 5 day HYSPLIT back trajectories for a single point on each straight and level run for flights (a) C006, (b) C007, (c) C218, (d) C219, (e) C221, (f) C223, (g) C224, (h) C225. | ||
2.2 Aircraft instrumentation
During the all three campaigns, the aircraft was equipped with a suite of instrumentation for high-precision trace gas measurements.Measurements of CO dry-air mole fractions were sampled using an Aerolaser AL5002 Vacuum-UV fast fluorescence instrument. Specifics about the principles of operation for this instrument are provided by Gerbig et al.31 The total 1σ at 1 Hz precision for airborne CO measurements is estimated to be ±1.8 ppb at 100 ppb mixing ratio (typical background CO mixing ratio in the free troposphere), with an overall uncertainty of ±2.7 ppb (or 2.4%), whichever is greatest.22 O3 concentrations were measured using a UV photometric analyser (model TEi-49i, Thermo Fisher Scientific Inc., USA), with a precision of 0.3 ppbv and overall uncertainty of 4%. Both the Aerolaser CO and the TEi ozone instruments were mounted within the pressurised cabin of the aircraft within a single 19′′ rack. Air was sampled by means of a window-mounted rearward facing inlet comprising of 1/4′′ PFA tubing housed within 3/8′′ stainless steel tubing.
In situ measurements of NO were made using a custom built chemiluminescence instrument with NO2 measured by photolytic conversion at 385 nm to NO on a second channel following the design of Pollack.32 In-flight calibrations for NO sensitivity and NO2 conversion efficiency were carried out a minimum of three times per flight by standard addition of 5 ppmV NO in nitrogen (BOC) to the sample inlet resulting in a calibration concentration of ∼5.1 ppbV. NO2 conversion efficiency was determined by gas phase titration of a portion (∼90%) of the NO standard with ozone generated from pure O2 by low pressure mercury discharge lamp. The calibration factors were interpolated throughout the flight to account for any sensitivity drifts in the instrument. The chemiluminescent zero was determined every 5 minutes and also interpolated between. 3σ detection limits were ∼30 pptv for NO and ∼60 pptv for NO2 for 1 Hz data, with root sum square uncertainties of ∼17% for NO at 0.1 ppbv and ∼23% for NO2 at 0.1 ppbv.
VOCs were measured using a whole air sampling (WAS) system on board the aircraft. The WAS system consists of sixty-four silica passivated stainless steel canisters of three litre internal volume (Thames Restek UK) fitted to the rear hold of the aircraft and connected to an all-stainless steel assembly double headed bellows pump (Senior Aerospace, USA). The pump draws air from the main sampling manifold of the aircraft and pressurises it in to canisters.33 Each WAS canister took approximately 10–20 seconds to fill, corresponding to roughly 1–2 km of horizontal flight. For the MOYA-2 and ARNA-2 campaigns, the aircraft was additionally fitted with an updated version of the parent WAS system. Essentially, the system comprises a multitude of inert Silonite coated (Entech) stainless steel canisters, grouped together modularly in cases with up to 16 per case. Canisters are sealed by pneumatically actuated bellows valves (Swagelok, SS-BNVS4-C). A maximum of 96 canisters can be filled per flight, with a fill time of 10 seconds. The air samples were analysed post-flight using a dual-channel gas chromatograph with flame ionisation detectors.34,35
Formaldehyde (HCHO) was measured by laser-induced fluorescence spectroscopy using an instrument design based on that of Hottle et al. (2009).36 A high-pulse repetition frequency (300 kHz) tuneable fibre laser (TFL3000, Novawave) was used to generate UV radiation at 353.370 nm, which excites the HCHO 50,5 ← 51,4 rotational transition of the 4 A1A2 ← X1A1 vibronic band. Ambient air was sampled from the common manifold on the aircraft into a low-pressure detection cell, and following laser-excitation fluorescence was collected at red-shifted wavelengths (λ ∼390–550 nm) using a photomultipier (Sens-Tech P25PC photodetector module), and the signal recorded by gated photon counting (PMS400A, Becker and Hickl). Data were recorded at 1 Hz and the background signal was determined by changing the laser wavelength to an offline position (λ = 353.360 nm). The laser was also directed into a small cell containing HCHO and used to generate a reference fluorescence signal to calibrate the laser wavelength. Further details of the instrument can be found in Cryer (2016).37 The instrument was calibrated in situ periodically on the aircraft (2 or 3 times per flight) using a HCHO permeation source, with a calibration uncertainty of ∼15% (2σ). The instrument sensitivity is a function of the pressure in the fluorescence cell, which varies with altitude, and so a calibration factor appropriate to the altitude was used.
Measurements of 1 Hz hydrogen cyanide (HCN) were used during the MOYA-2 and ARNA-2 flights as a means to define fire emissions in the sampled dataset. The HCN measurements were recorded by a Time of Flight Chemical Ionisation Mass Spectrometer (ToF-CIMS), a detailed instrument description of which can be found in Barker et al., 2020.22 The ability to of I-CIMS measure HCN for use as a biomass burning tracer is provided by Priestley et al. (2018)38 and Le Breton et al. (2013).39 No HCN measurements were made during the MOYA-1 flights.
2.3 Model calculations
We use modelling output from the GEOS composition forecast model (GEOS-CF), which employs the GEOS-Chem model21 as the chemistry module run online within the NASA GEOS model architecture as described by Knowland et al. (2020)30 and Keller et al. (2021).25 Whilst the near-real time 5 day forecasts were used to inform the field team during ARNA-2, here we evaluate the GEOS-CF best estimate of the 3D atmospheric composition; prior to the launch of the forecast, the GEOS-CF runs a short historical simulation with the atmospheric general circulation model forced to the analysed meteorological fields from an assimilated GEOS product40 and stratospheric O3 is nudged toward the O3 fields produced by the GEOS forward processing (GEOS FP) system, which is constrained by ozone observations from the Microwave Limb Sonder (MLS), Ozone Monitoring Instrument (OMI), and the Ozone Mapping and Profiler Suite (OMPS).41,42 No other trace gas observations are assimilated into GEOS-CF v1.0.Tropospheric and stratospheric chemistry is calculated online by GEOS-chem (v12.0.1, http://geos-chem.org) using a HOx–NOx–BrOx–VOC–O3 scheme.43,44 Biomass burning emissions are from the near-real time satellite-based emissions from the Quick Fire Emission Database,45 with 35% of the fire emissions emitted above the boundary layer, evenly between 3.5 and 5.5 km altitude. Anthropogenic emissions are monthly averages from HTAP v2.2 (ref. 46) and RETRO,47 broken down into hourly values using sector-specific day-of-week and diurnal scale factors.48
The GEOS-CF model output from publicly accessible archived hourly model output at a global ∼25 × 25 km (0.25°) horizontal resolution is extracted along the flight tracks at the nearest point in time and space for ARNA-2 campaign. Since the archived model output is only currently available for the period of January 1st 2018 to present day (https://gmao.gsfc.nasa.gov/weather_prediction/GEOS-CF/data_access/), modelled values are only available for the ARNA-2 campaign within this study.
3 Results and discussion
3.1 Aircraft measurements
Fig. 3 shows time series of CO, O3, NOx, HCN (where available) and aircraft altitude, for all 12 flights used in this analysis. The grey shaded areas on the plots indicate where sampling was taking place in areas affected by emission from fires. Flights C004 and C005, the flights near to the fires in Senegal, show distinct peaks as the aircraft flew through the fire plumes. Distinct enhancements of CO and NOx were observed, up to 12000 ppb and 260 ppb respectively. Small O3 enhancements were also seen, up to around 15 ppb above background levels. It should be noted that these O3 enhancements were observed in the general area of the fires, however when sampling in the main part of the fire plume no O3 enhancement was observed and in some cases O3 was depleted relative to the background. This is likely due to titration with the emitted NO and will be discussed further below. During flights C133 and C134, which were close to the fires in Uganda, similar distinct enhancements of CO and NOx were observed, although with slightly lower peak levels of 7000 ppb for CO and significantly lower peak NOx of up to ∼10 ppb. Flights C006 and C007 sampled air further afield from the fires in Senegal (typically 20–50 km from the coast), and as a result of atmospheric dilution, the levels measured were much lower than the near-field flights, with CO and NOx enhancements up to 110 and 2.5 ppb above background respectively. However, due to the longer transport time and increased photochemical processing of the air compared to the near-field flights, observed O3 enhancements were higher at up to 35 ppbv above background. Flights C218, C219, C221, C223, C224 and C225 all took place around the Cape Verde islands, typically 500–800 km from the African coast. As a result, the fire plumes sample showed even lower concentrations of the primary emitted species, with CO up to 70 ppb above background and NOx up to 0.3 ppb above background. Whilst the CO lifetime in the atmosphere is relatively long compared to the transport time observed here, NOx has a relatively short lifetime of a few hours, and thus the concentrations have reduced by a much greater amount in these flights compared to those nearer the fire source. HCN measurements were also available for these flights and were observed to be 250–450 ppt above background in the fire plumes, helping to confirm that the air sampled was indeed from biomass burning. O3 was observed to have larger enhancements of up to 50 ppb above background in these further afield flights. Fig. 4 shows box whisker plots of CO, O3, NOx, HCN (where available) averaged for different altitude bins for each flight. The behaviour for the near-field flights (C004 and C005 for Senegal; C133 and C134 for Uganda) is as expected, with the enhancement observed close to the surface and not much mixing above. For the further afield flights, the enhancements due to fires were generally observed over a relatively small altitude range, usually between 1500 and 2500 metres above mean sea level. This demonstrates the distinct nature of the fire plumes and that aircraft surveys are required in order to fully sample the biomass burning outflow.
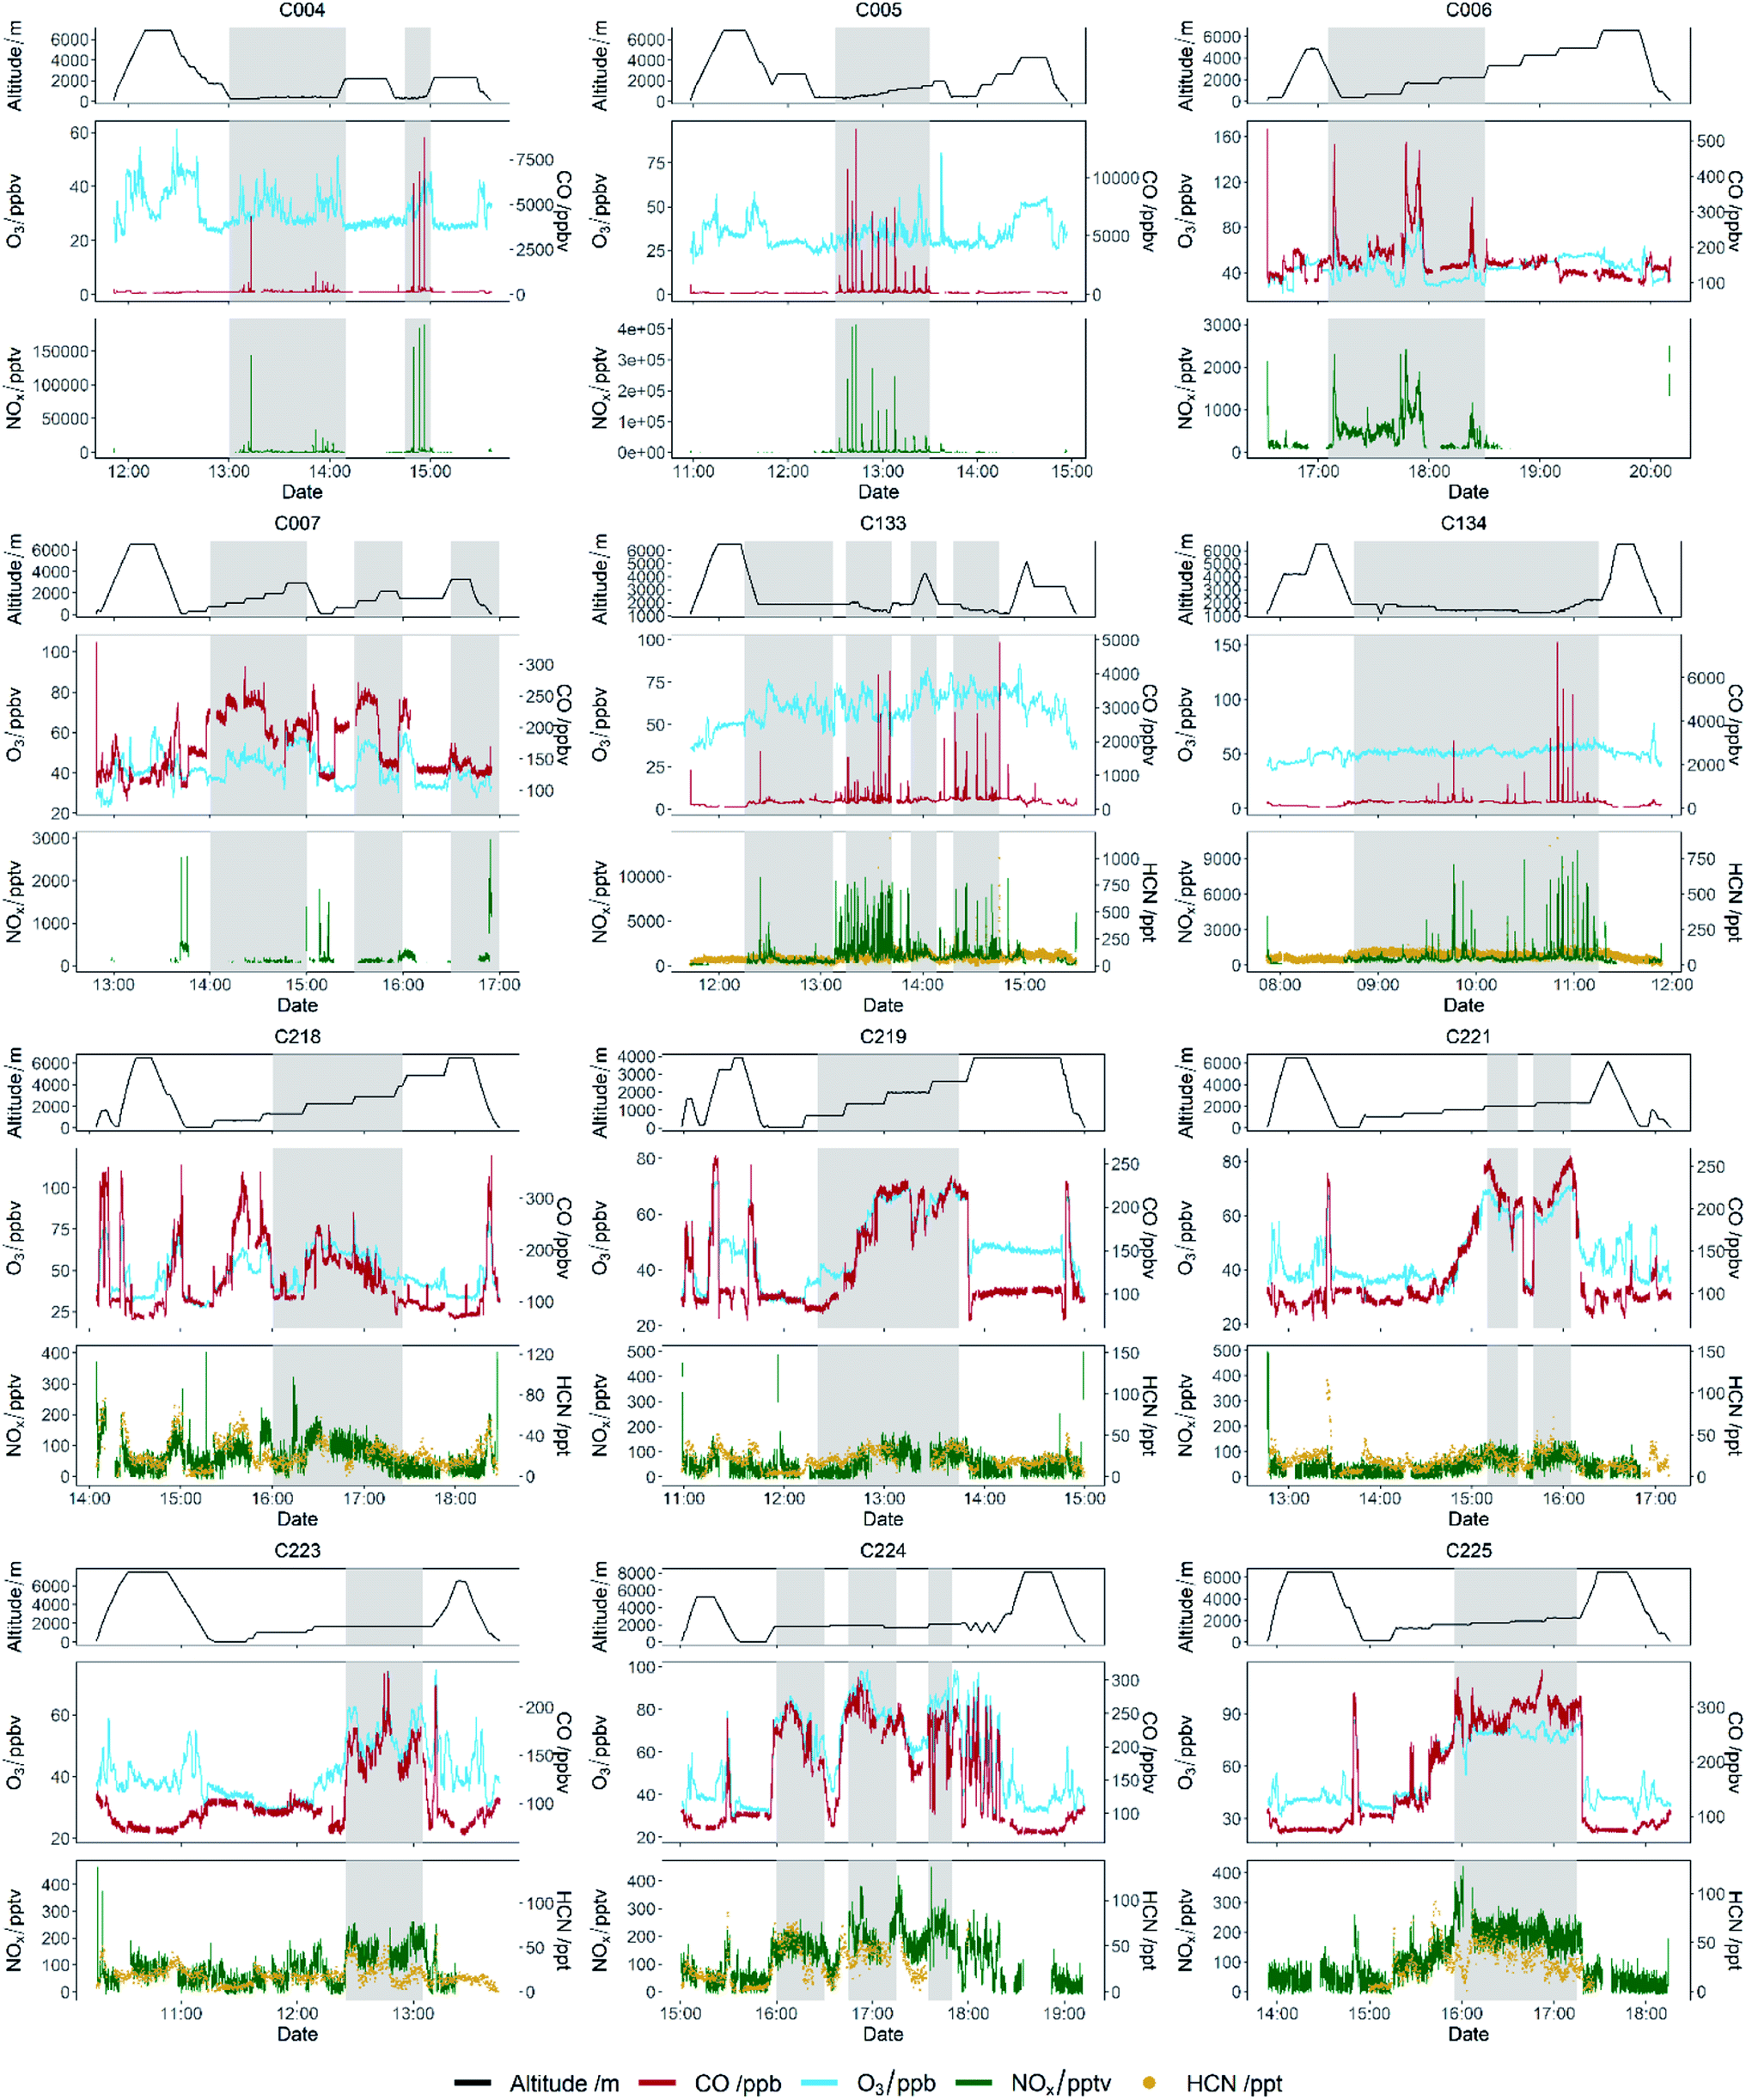 | ||
| Fig. 3 Time series of NOx, HCN, altitude, O3, and CO for each flight. Grey shaded areas show when fire plumes were being sampled (see text for description of plume identification). | ||
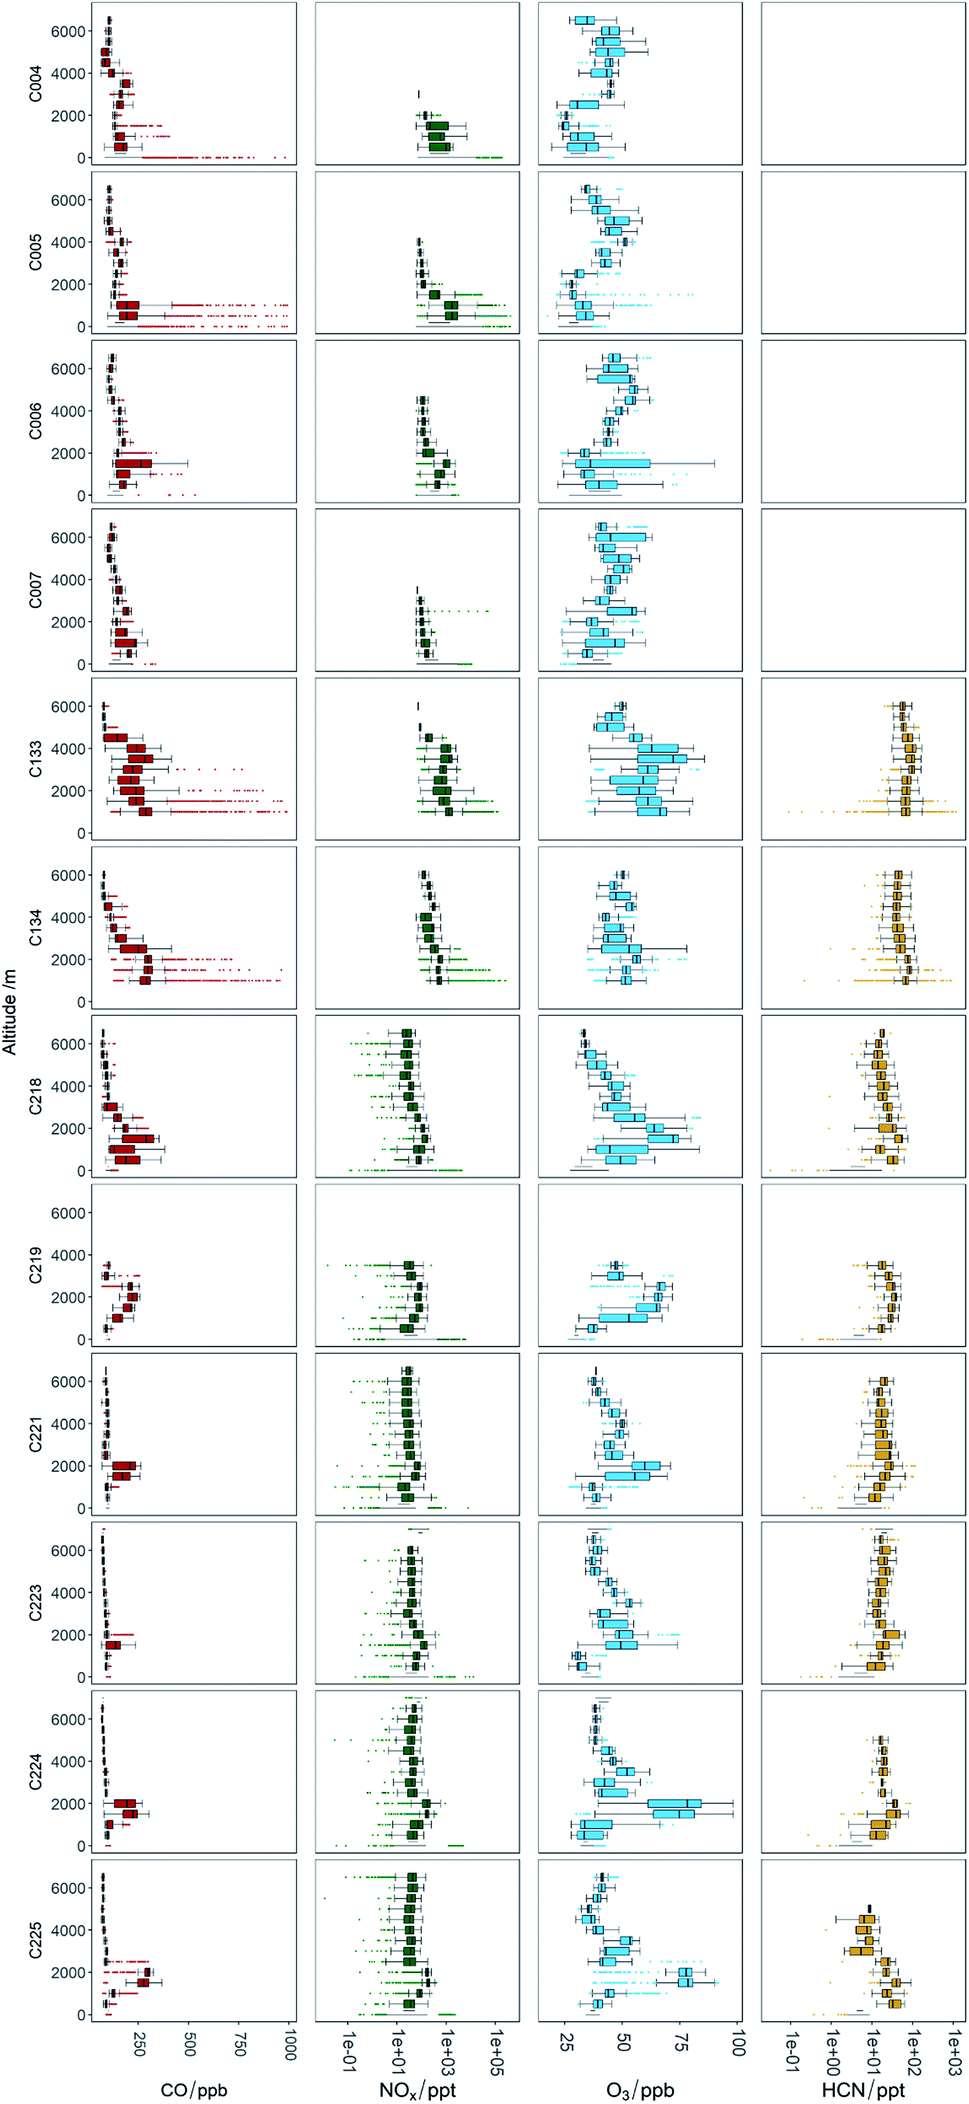 | ||
| Fig. 4 Altitude binned box/whisker plots of NOx, HCN, O3, and CO for each flight. NOx concentrations higher than 1000 ppt are not included in these plots so profile details are clearer at high altitude. | ||
3.2 Emission factors
Data collected on the near-field flights close to the fires (C004 and C005 in Senegal and C133 and C134 in Uganda) was used to calculate emission factors for VOCs and NOx. Emission factors of various species (EFX) were calculated using the method described in Andreae (2019)49 and Barker et al. (2020),22 whereby emission ratios to a reference species (in this case CO) were calculated in each plume, then converted to emission factors using eqn (1). | (1) |
 | ||
| Fig. 5 (a) Enhancement ratio (ΔVOC/ΔCO) and emission factor calculations for selected VOCs, (b) plot of measured against literature emission factors (taken from Andreae (2019)49). The dash line represents 1:1. | ||
| Species | Calculated EF Senegal | Calculated EF Uganda | Literature (West or North African savannah from Andreae (2019)) |
|---|---|---|---|
| NOx (as NO) | 2.05 ± 0.43 | 1.202 ± 0.28 | 1.13 ± 0.6 |
| Ethane | 0.284 ± 0.023 | 0.133 ± 0.037 | 0.450 ± 0.26 |
| Propane | 0.078 ± 0.006 | 0.026 ± 0.011 | 0.088 ± 0.05 |
| Ethene | 0.916 ± 0.04 | 0.791 ± 0.22 | 1.12 ± 0.87 |
| Propene | 0.323 ± 0.02 | 0.156 ± 0.039 | 0.540 ± 0.29 |
| i-Butane | 0.007 ± 0.001 | 0.004 ± 0.002 | 0.004 ± 0.003 |
| n-Butane | 0.030 ± 0.003 | 0.028 ± 0.02 | 0.014 ± 0.013 |
| Benzene | 0.257 ± 0.018 | 0.164 ± 0.05 | 0.250 ± 0.22 |
| Toluene | 0.119 ± 0.01 | 0.070 ± 0.02 | 0.114 ± 0.14 |
| Acetylene | 0.270 ± 0.01 | 0.315 ± 0.03 | 0.676 ± 0.35 |
| HCHO | N/A | 1.07 ± 0.51 | 1.23 ± 0.65 (all locations) |
For most VOCs, EFs in Uganda were lower by factors of 20–50% compared to Senegal, the exceptions being acetylene, which was 35% higher in Uganda (although within the error of the calculation) and n-butane, which was only 5% lower in Uganda but again within experimental error. The lower values for Uganda could possibly be accounted for by differences in the Senegalese and Ugandan fuel mixtures. However, due to detailed analysis of the fuel burned in this study being impossible, and with the likelihood of the fuel source being mixed, the effect of differing fuel content is difficult to quantify. Another possibility is the higher soil moisture present in Uganda compared to Senegal,22 could be suppressing the release of VOC-rich air from the surrounding wildfires. More work, and in particular more detailed measurements, are required to investigate whether soil moisture could affect wildfire VOC EFs in this way. Fig. 5(b) shows the measured emission factors for the 9 VOCs plotted against the average West and North African literature values given in Andreae, 2019. In general the measured values for Senegal tend to agree quite well for the larger VOCs. For example toluene, benzene, n-butane, iso-butane and propane all sit very close to the 1:1 line, within 10% of the literature values. Measured values for Uganda for these species are lower but still within the scatter of the literature data. The smaller VOCs (e.g. acetylene, ethane, ethane and propene) show the most discrepancy, with the measured values being 60%, 37%, 19% and 40% lower than the average literature respectively for Senegal and 46%, 71%, 29% and 71% lower respectively for Uganda. The extensive review on biomass burning emission factors presented by Andreae (2019),49 includes very few measurements from African savannah or grassland and those that are reported tend to show significantly different emission factors to other savannah regions. This demonstrates the paucity of data from regions in Africa and the pressing need for further study. For the Uganda flights we also had measurements of HCHO and these also showed some correlation with CO. We were able to calculate the emission factor for HCHO for the two flights as 1.73 ± 0.51 g kg−1. Whilst we could not find any literature values for HCHO for African savannah fires, this value is ∼40% higher than the average HCHO emission factor for all savannah fires reported in Andreae (2019).49 We cannot separate directly emitted HCHO with any that may have been formed in the time from emission to our measurements (1–2.4 hours) so our emission factor should be treated as an upper limit. Finally, we also examined the NOx/total VOC ratios for the different areas and a correlation plot of NOx against total VOC is shown in Fig. S2.† Whilst measurements of only 10 VOCs were made from the whole air samples during this study neglecting potentially important compounds such as furans, the measured ratio is similar for the Senegal (0.93) and Uganda (0.85) fires, suggesting that chemistry maybe similar for the two types. Again it should be noted that as the fires sampled are mixed in nature, and VOCs and NOx are emitted from different types of fires, we would not necessarily expect these numbers to be consistent.
3.3 O3 enhancement
O3 production was studied from biomass burning plumes by examining the relationship of the enhancement above background of O3 to CO. The plumes were characterised by their ΔO3/ΔCO enhancement ratio, calculated from the linear regression fit using RMA of each flight's plume O3 and CO datasets. For the ARNA-2 flights, a statistical threshold approach, similar to that conducted by Le Breton et al. (2013)39 and Barker et al. (2020)22 was used to determine when a biomass burning plume was being sampled. The quality of the regression fit was studied in relation to enhancements in both CO and HCN individually, and concurrently. A simultaneous enhancement of CO and HCN, seven standard deviations above their respective background concentrations, afforded the highest average coefficient of determinations (r2) in the O3/CO regression fit for the six flights and thus this was used as the biomass burning filter for the analysis. For the near-field MOYA sampling flights (C006 and C007) where HCN was not available, all data below the boundary layer was used to calculate the enhancement ratio. An additional filter was applied to flights C004, C005, C133 and C134 to remove data very close to the plume source where no O3 production was observed. This was done individually for each flight, with the cut-off determined when the high CO concentrations clearly deviated from the O3/CO regression fit. Finally, it was evident that flights C007 and C218 were sampling multiple plumes of different ages; all easily distinguishable by their time sampled during each flight. To get the most meaningful data from each flight, the plume sampled when the majority of the VOC measurements were taken was used for the analysis due to the ability to calculate the plume age from these measurements. Fig. 6 shows O3/CO scatter plots for all measurements within fire plumes for all flights. Values of ΔO3/ΔCO range from <0.1 for flights close to the fires in Senegal and Uganda (C004, C005, C133 and C134), to >0.25 for flights around Cape Verde (C219 and C224). Flights over the Atlantic Ocean closer to the coast (C006 and C007) have intermediate values of ΔO3/ΔCO (0.16–0.17). The flights over the ocean have r2 values between 0.58 and 0.94, giving confidence in these measured O3 enhancement ratios. For the near-field flights in Senegal and Uganda, the r2 values are smaller (0.26–0.69), suggesting the O3 enhancement ratios from these should be treated with more caution. We also plotted Ox (NO2 + O3) against CO for all the flights to ascertain if the observed enhancements were being affect by titration of O3 with NO close to the fires (see Fig. S3†). However, we see no significant difference to the corresponding O3/CO linear regression slope (all values are within uncertainty), suggesting that titration O3 + NO does not play a major role in determining the O3 enhancement. | ||
| Fig. 6 O3/CO scatter plots for periods in fires on each flight. The linear regression fit for each dataset was carried out using reduced major axis (RMA) regression. | ||
The age of the air sampled in this analysis ranges from under an hour (for the near field flights close to the fires), to several days (for the flights around Cape Verde). In order to properly assess the magnitude of the O3 production in the fire plumes, and to compare with previous measurements, it is necessary to know the air mass age for the measured O3 enhancement. We used the ratio of toluene:benzene to calculate air mass age for the flights close to the fires (eqn (2))64 and benzene:CO for the flights further afield (eqn (3)).
 | (2) |
 | (3) |
:benzene ratio at t = 0 was determined using the measurements made very close to the fires which was removed from the O3 enhancement analysis as described above. Reaction rates for their reaction with OH were taken from the Master Chemical Mechanism website (http://mcm.york.ac.uk). The OH concentration was estimated (from the findings of Lelieveld et al. (2016)53) to be 1.65 × 10⁶ molecules per cm3. The concentrations measured and the calculating age of each plume sampled on each flight are shown in Tables S1a and S1b.†Fig. 7 shows the average O3 enhancement ratio (ΔO3/ΔCO) for each flight, plotted against calculated average air mass age for that flight. It can be seen that O3 enhancement increases with increasing age, from 0.07–0.14 for flights close to the fires up to 0.25 for flights close to Cape Verde. There is a linear relationship between ΔO3/ΔCO and air mass age for the flights close to the fires (Senegal and Uganda), followed by a flattening of the relationship for the older air. This is likely due to NOx, the ‘fuel’ for O3 production, being used up as the air ages. Once the air is over the ocean there are virtually no other sources of NOx (or VOCs) and measurements of NOx on the flights close to Cape Verde, show levels of up to 100–200 pptv, which is getting close to levels where O3 production would no longer occur.54 Previous measurements of O3 enhancement in air from biomass burning in Africa are rare. The review of O3 production in fires by Jaffe et al. (2012)2 included only one study of air from northern Africa,55 which showed a ΔO3/ΔCO of 0.23 for air mass age of around 2 days, very similar to our study. Most of the other measurements of ΔO3/ΔCO from other tropical regions presented in the Jaffe et al. study show values in a similar range to those presented here. Cristofanelli et al. (2009)56 observed a ΔO3/ΔCO enhancement of 0.10 in air originating from biomass burning in North Africa (2–4 days old) at a WMO-GAW mountain observatory in northern Italy. Henne et al. (2008)57 analysed measurements from an observatory on Mount Kenya in East Africa and calculated ΔO3/ΔCO enhancements of average ratio of 0.36 (±0.24) for biomass burning plumes aged 2–5 days. All of these previous measurements show a similar relationship between O3 enhancement and plume age to the results presented in this work.
 | ||
| Fig. 7 ΔO3/ΔCO ratio plotted against age mass age for flights C004, C005, C006, C007, C132, C133, C218, C219, C221, C223, C224 and C225. The error bars indicate standard error in the enhancement ratio and age calculation. The inset shows a zoom of the lower air mass age data. The two black dots show the average ratio of the model ΔO3/ΔCO for the younger (C225) and older plumes (C218–C224) during the ARNA-2 campaign. | ||
3.4 Comparison GEOS CF model
The data presented above shows a series of measured emission factors for NOx and VOCs from wildfires in Senegal and Uganda, along with O3 enhancements in the plume as the air ages and is transported over the Atlantic Ocean. Whilst this data is a useful addition to the literature, especially as measurements from fires in Africa are so scarce, it is through comparison with a chemistry transport model where we can really start to assess our understanding of O3 production in biomass burning plumes in Africa.Fig. 8 provides time series of measured and model data for CO, O3, NOx and HCHO for the flights over the Atlantic Ocean close to Cape Verde (C218, C219, C221, C223, C224 and C225). At the time of writing, the GEOS-CF model was not available before 2018 so there is no model data for flights C004, C005, C006 or C007. Measurements from the flights close to the fires in Uganda (C133 and C134) are not compared to the model as they are largely affected by sampling very close to fresh fire plumes, which the relatively coarse resolution model could not be expected to reproduce. The grey shaded regions indicate when outflow from burning was being sampled. It can be seen that on almost all flights, the position of the burning plume is reasonably well represented, indicated by increases of CO, NOx and O3 in both the measured and modelled data, but the magnitude of the enhancement is much smaller in the model. For instance, flight C224 shows an enhancement above the background of around 120 ppb of CO and 55 ppb of O3, whereas at the same time, the model shows enhancements of 50 ppb for CO and 25 ppb for O3. During flight C221 the model does not capture the observations, with the measured data almost anti-correlated with the middle for much of the flight. In general, outside of the model plumes the model and measured data appear to be in reasonable agreement for all flights.
 | ||
| Fig. 8 Time series of measured and modelled (GEOS-CF) O3, CO, NOx and HCHO. | ||
In order to provide a statistically sound measure of how the modelled and measured data compare, Fig. 9(a) shows the normalise mean bias (NMB) between the modelled and measured data for all flights. NMB is a commonly used statistical method for evaluating atmospheric model performance,58 with a value over 0% indicating a positive bias in the model (i.e. the model overpredicts compared to the observed value) and a negative NMB indicating a negative bias in the model (i.e. the model underpredicts compared to the observed value). Data has been separated into inside and outside fire plumes according to the plume identification described earlier. For the flights over the Atlantic Ocean outside of fire plumes, the model does a good job of reproducing the measurements. For CO, the model under-predicts the observations by between 2 and 13% outside of the plumes, with a total NMB across all flights of −4.6%. O3 shows a similar agreement with NMB between −5.0 and 11.2% and a total of 0.7%. In both cases the comparison between modelled and measured data is within the standard deviation of the data. For NOx the agreement outside of the plumes is poorer, with NMB between −20.1 and 3.2% for the flights and a total across all flights of −9.9%. Inside the fire plumes, the agreement between modelled and measured values is worse, with the model being biased significantly lower for all three species. In total across all flights, the NMB is −29.4%, −16.5% and −37.5% for CO, O3 and NOx respectively. In all flights the comparison also falls outside the standard deviation and quartile range of the data. If we do not include flight C221, where the model does not reproduce the structure of the observations, in our analysis, the NMB improves slightly for all species to −26.9%, −16.4% and −34.3% for CO, O3 and NOx respectively. However, considering plume dilution that occurs due to model resolution we would expect concentrations to be somewhat lower.
 | ||
| Fig. 9 Box and whisker plots to show normalised mean bias (NMB) of the model (GEOS-CF) in and out of fire plumes for (a) CO, NOx, O3 and HCHO by flight (b) VOCs for all flights. The bold horizontal lines show the median NMB, the edge of the boxes show the lower and upper quartiles, the vertical lines show the minimum and maximum values no more than 1.5 times the interquartile range and NMB values greater than these are represented by black dots. | ||
We also examined the NMB between modelled and measured VOCs with the average comparison for all the flights over the Atlantic Ocean shown in Fig. 9(b). Four species (ethane, propane, acetaldehyde and acetone) are present in both the measurements and the GEOS-CF model output. While none of these species can particularly be thought of as typically from biomass burning sources, a comparison between model and measurements is still informative. We see that for propane, acetaldehyde and acetone, the observation-model agreement is better outside the fire plume than inside, with all three species showing the model to be biased low inside the plumes (−25.1%, −82.3% and −26.1% respectively). For ethane, the agreement is similar inside and outside the fire plumes, with both seeing the model biased high (19.2% and 20.1% respectively). The comparisons described above demonstrate that, whilst the model does a good job of predicting CO, O3 and NOx in the clean background air of the North Atlantic, it cannot reproduce CO or NOx (or VOCs) in the fire plumes, which in turn leads to the negative bias in O3. For formaldehyde (HCHO) in all flights, the modelled data is biased significantly low (−66.3%) inside the fire plumes, with slightly less negative bias (−48.2%) outside of the plumes. HCHO can be thought of as a marker for photochemical activity and VOC oxidation and thus the negative bias suggests that the model is missing VOCs both inside and outside the fire plumes, whose oxidation eventually causes HCHO formation. It is worth noting too, that the QFED emission inventory used here prescribes higher fluxes of CO (as well as organic carbon and black carbon) than other inventories for this region66 and some of the missing sources of formaldehyde could be due to carbon being emitted as CO within the inventory when it in fact it should be emitted as more reactive VOCs. This could be another reason for the low bias of O3 in the model compared to observations in the plumes.
3.5 O3 enhancement in the model
To further assess the model performance and attempt to ascertain why it is biased low compared to measurements in the fire plumes, we have examined the relationship of the enhancement above background of O3 to CO. We resampled the observations to the same 1 minute frequency of the extracted model data and plotted O3 against CO to calculate a slope based on RMA (similar to the method used in Section 3.3). Minute-averaged regressions for both the measurements and the model for the 5 flights over the North Atlantic are shown in Fig. 10, with the enhancement ratios and air mass age shown in Table 2. We also give an average of the younger (C225) and older (C218–C224) air masses to allow comparison with the average oxidation ratios seen in plumes within the region. In general, the O3 enhancement ratio (ΔO3/ΔCO), is lower in the model compared to the measurement. On average across the six flights, measured ΔO3/ΔCO is 0.24 ± 0.02, whereas in the model the value is 0.15 ± 0.11. Flight C224 is the closest to the measurements, giving a value of 0.24 ± 0.16 in the model compared to 0.25 ± 0.06 in the measurement. Flight C223 sees a higher value in the model (0.36 ± 0.02) compared to the measurement (0.24 ± 0.08). It is not immediately clear why these two flights are different to the rest. They do not show any particular difference in the NMB analysis of measured and modelled data, in fact C224 shows the highest discrepancy in CO and O3. When we consider the broader ΔO3/ΔCO enhancement ratios within the older plumes (not including flight C225), we see a value of 0.17 ± 0.03 versus an observed value of 0.29 ± 0.05. The modelled ΔO3/ΔCO enhancement ratio increases to 0.19 ± 0.03 when we exclude the flight where the model did reproduce biomass burning enhancement (C221 – as discussed in Section 4.1), which is in better agreement with the observations, which are unchanged. The modelled point is also shown on Fig. 7.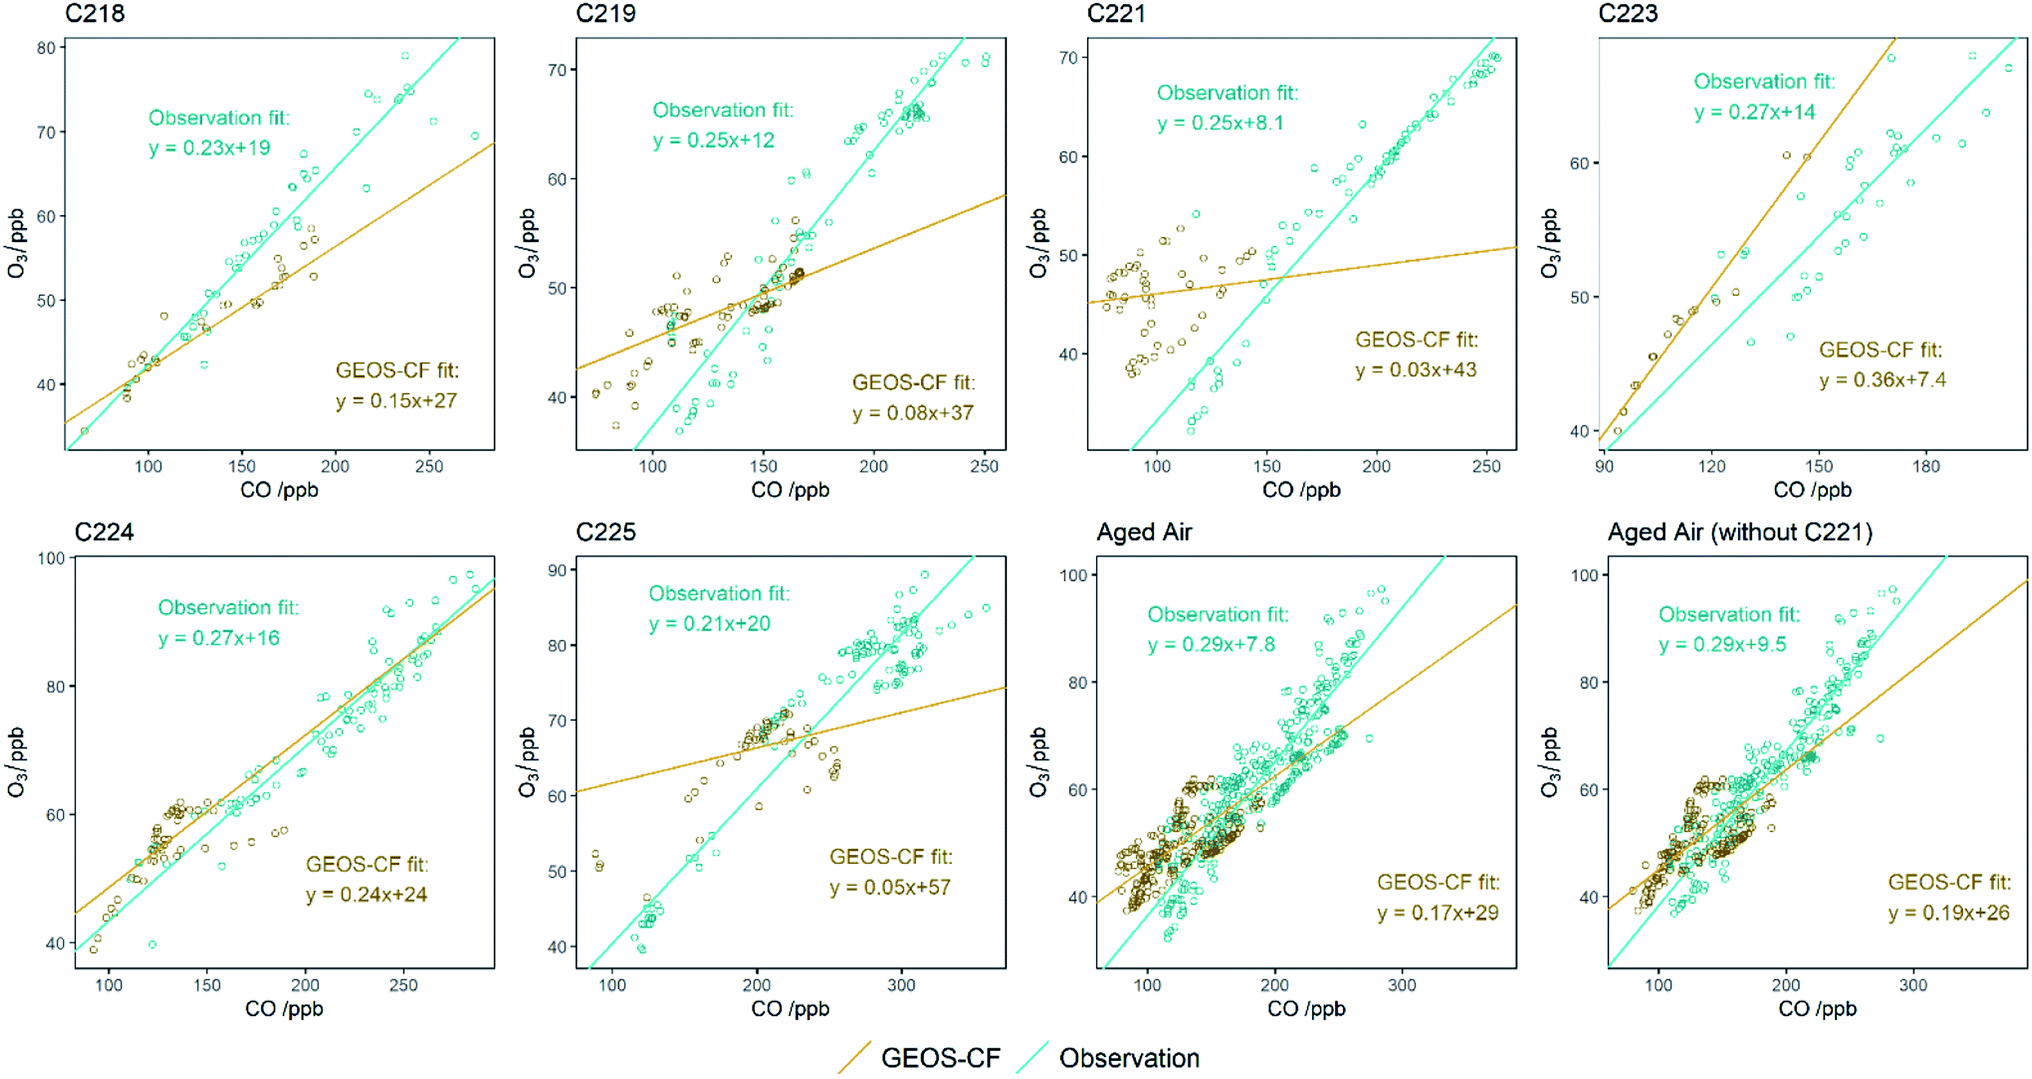 | ||
| Fig. 10 O3vs. CO scatter plots for 1 minute averaged data from the aircraft measurements (red) and the GEOS-CF model (blue). | ||
| Flight number | Air mass age/h | Measured O3/CO | Modelled O3/CO |
|---|---|---|---|
| C218 | 201.3 | 0.23 ± 0.045 | 0.15 ± 0.01 |
| C219 | 179.9 | 0.25 ± 0.034 | 0.08 ± 0.035 |
| C221 | 147.2 | 0.25 ± 0.017 | 0.03 ± 0.03 |
| C223 | 166.8 | 0.27 ± 0.080 | 0.36 ± 0.02 |
| C224 | 156.5 | 0.27 ± 0.060 | 0.24 ± 0.16 |
| C225 | 76.8 | 0.21 ± 0.043 | 0.05 ± 0.04 |
| Aged air (C218–C224) | 170.4 | 0.29 ± 0.050 | 0.17 ± 0.03 |
| Aged air (C218–C224, not C221) | 176.1 | 0.29 ± 0.045 | 0.19 ± 0.03 |
This analysis shows that the low bias of O3 in the model is not purely due to the low bias of CO (and NOx). It is known too that Eulerian models will struggle to represent individual plumes on the scales of these fires,12 as least in part due to their limited vertical resolution, and coarser model resolution can fail to capture non-linearity of O3 formation chemistry. The fact that the O3-to-CO enhancement ratio is also lower in the model suggests that the model may also be missing chemistry, a hypothesis that is backed up by the low bias of VOCs and HCHO in the model, although the VOC analysis is only for a few compounds and is missing potentially important and very reactive compounds such as oxygenated VOCs, isoprenoids and furans.65 The implication of this work is that the contribution of biomass burden over to the O3 burden over the Atlantic Ocean could be underestimated, especially when considering the impact of uncertainty in biomass burning's contribution to O3's radiative forcing through time.59 It is clear that more studies of O3 and its precursors from wildfires in Africa are required in order to properly understand the effect on the wider North Atlantic Ocean.
4 Conclusions
Aircraft based measurements of O3 and a range of its precursors were made in African wildfire outflow during 12 research flights spanning March 2017 to February 2020. The flights ranged from within a few kilometres of the fires over Senegalese and Ugandan savannah to several hundred kilometres away over the North Atlantic Ocean near Cape Verde. Close to the fires, large enhancements of NOx (>100 ppbv), CO (>10000 ppbv) and VOCs (>20 ppbv) were observed, and the measurements allowed emission factors (EFs) for NOx and VOCs to be calculated. For NOx EFs of 2.05 ± 0.43 for Senegal and 1.20 ± 0.28 for Uganda were calculated, both higher than the average value of 1.13 ± 0.6 for North and West Africa given in Andreae 2019.49 For most VOCs, EFs in Uganda were lower by factors of 20–50% compared to Senegal, with values comparing well to literature for larger VOCs (e.g. benzene, toluene and the butanes). The agreement with literature for the smaller VOCs is poorer, with measured values 30–70% lower. We examined the ΔO3/ΔCO enhancement ratio for all the flights and found values from 0.06 close to the fires (within 1–2 hours of emission) to 0.29 over the Atlantic Ocean (>150 hours from emission).
We also compared our observations against an archived global high resolution (∼25 × 25 km2) state-of-the-art chemistry model, which was also used in forecast mode to guide which air masses were targeted by the aircraft-based ARNA-2 campaign. The model shows skill in capturing the biomass burning plumes, as well as reproducing the background atmospheric composition for the region. Within biomass-burning plumes the model showed an ability to capture enhancements in O3, CO and NOx in all but one flight. A model underestimate of O3 and CO was seen in biomass-burning plumes, along with a 35% underestimate of the observed O3:CO ratio in older plumes. These differences between the model and observations can be attributed to an underestimate in biomass burning emissions (of CO and VOCs), insufficient oxidation of emissions within the model, and the ability to represent plumes within a global model.
This study suggests that the contribution of biomass burning to O3 burden over the Atlantic could be underestimated, which has implications for calculations of radiative forcing both in the present day, as well as the past and future. When the GEOS-CF model product is available for dates prior to 2018, we wish to expand the model-observation comparison to include data from more research campaigns in this region. This would allow reduction in the uncertainty in predicted emission factors for more species and explore other source regions.
Data availability
Data described in this analysis can be accessed at the Centre for Environmental Data Analysis (http://catalogue.ceda.ac.uk/uuid/d309a5ab60b04b6c82eca6d006350ae6; CEDA, 2019 (for MOYA data) and https://catalogue.ceda.ac.uk/uuid/31ae96f9cfc54ef9a38638f8723a1d17; CEDA, 2020 (for ARNA-2 data)). GEOS-CF is data openly available via OPeNDAP hosted by NASA's fluid server (https://opendap.nccs.nasa.gov/dods/GEOS-5/).Code availability
Data analysis and processing used open-source R and Python packages, including Pandas,60 Xarray,61 and specific routines for handling GEOS-CF model output from AC_tools.62,67Author contributions
JDL wrote the paper with input from TS, FAS, KEK and CAK. FAS, SEW and JDL designed and produced the figures. FAS, SJC, SJB, CR, PB, TJB, EM, AM, CP, DEH, LKW, GVR, SS and TI made the measurements across the three field campaigns. TS, CAK and KEK did the GEOS modelling work, LJC, GA and EGN conceived the projects.Conflicts of interest
The authors declare no conflicts of interest.Acknowledgements
Thanks to Euan Nesbit at RHUL and Lucy Carpenter at the University of York for conceiving the MOYA and ARNA projects respectively. Thanks to the FAAM and Airtask team for supporting the flights, including Maureen Smith, Doug Anderson and Alan Woolley. Thanks to the staff from Airtask for campaign organisation, flight planning and resolving any safety issues: Barney Black, Finbarre Brennan, Peter Chappell, Steve James, Mark Keeble, Mark Robinson and David Simpson. The authors gratefully acknowledge the financial support provided by the UK Natural Environment Research Council (grant no. NE/N016238/1 (MOYA), NE/S000518/1 (ARNA)). FS and GR thank the NERC Spheres Doctoral Training Program for studentships and SC thanks the NERC Panorama Doctoral Training Program.References
- J. R. Ziemke, S. Chandra, B. N. Duncan, M. R. Schoeberl, O. Torres, M. R. Damon and P. K. Bhartia, Recent biomass burning in the tropics and related changes in tropospheric ozone, Geophys. Res. Lett., 2009, 36 DOI:10.1029/2009GL039303.
- D. A. Jaffe and N. L. Wigder, Ozone production from wildfires: A critical review, Atmos. Environ., 2012, 51, 1–10 CrossRef CAS.
- L. Marufu, F. Dentener, J. Lelieveld, M. O. Andreae and G. Helas, Photochemistry of the African troposphere: Influence of biomass-burning emissions, J. Geophys. Res.: Atmos., 2000, 105, 14513–14530 CrossRef CAS.
- S. K. Akagi, R. J. Yokelson, C. Wiedinmyer, M. J. Alvarado, J. S. Reid, T. Karl, J. D. Crounse and P. O. Wennberg, Emission factors for open and domestic biomass burning for use in atmospheric models, Atmos. Chem. Phys., 2011, 11, 4039–4072 CrossRef CAS.
- A. T. Archibald, J. L. Neu, Y. F. Elshorbany, O. R. Cooper, P. J. Young, H. Akiyoshi, R. A. Cox, M. Coyle, R. G. Derwent, M. Deushi, A. Finco, G. J. Frost, I. E. Galbally, G. Gerosa, C. Granier, P. T. Griffiths, R. Hossaini, L. Hu, P. Jöckel, B. Josse, M. Y. Lin, M. Mertens, O. Morgenstern, M. Naja, V. Naik, S. Oltmans, D. A. Plummer, L. E. Revell, A. Saiz-Lopez, P. Saxena, Y. M. Shin, I. Shahid, D. Shallcross, S. Tilmes, T. Trickl, T. J. Wallington, T. Wang, H. M. Worden and G. Zeng, Tropospheric Ozone Assessment Report: A critical review of changes in the tropospheric ozone burden and budget from 1850 to 2100, Elementa: Science of the Anthropocene, 2020, vol. 8 Search PubMed.
- C. Granier, B. Bessagnet, T. Bond, A. D'Angiola, H. Denier van der Gon, G. J. Frost, A. Heil, J. W. Kaiser, S. Kinne, Z. Klimont, S. Kloster, J.-F. Lamarque, C. Liousse, T. Masui, F. Meleux, A. Mieville, T. Ohara, J.-C. Raut, K. Riahi, M. G. Schultz, S. J. Smith, A. Thompson, J. van Aardenne, G. R. van der Werf and D. P. van Vuuren, Evolution of anthropogenic and biomass burning emissions of air pollutants at global and regional scales during the 1980–2010 period, Clim. Change, 2011, 109, 163 CrossRef CAS.
- M. O. Andreae and P. Merlet, Emission of trace gases and aerosols from biomass burning, Global Biogeochem. Cycles, 2001, 15, 955–966 CrossRef CAS.
- P. J. Crutzen, L. E. Heidt, J. P. Krasnec, W. H. Pollock and W. Seiler, Biomass burning as a source of atmospheric gases CO, H2, N2O, NO, CH3Cl and COS, Nature, 1979, 282, 253–256 CrossRef CAS.
- S. R. Arnold, L. K. Emmons, S. A. Monks, K. S. Law, D. A. Ridley, S. Turquety, S. Tilmes, J. L. Thomas, I. Bouarar, J. Flemming, V. Huijnen, J. Mao, B. N. Duncan, S. Steenrod, Y. Yoshida, J. Langner and Y. Long, Biomass burning influence on high-latitude tropospheric ozone and reactive nitrogen in summer 2008: a multi-model analysis based on POLMIP simulations, Atmos. Chem. Phys., 2015, 15, 6047–6068 CrossRef CAS.
- L. K. Emmons, S. R. Arnold, S. A. Monks, V. Huijnen, S. Tilmes, K. S. Law, J. L. Thomas, J. C. Raut, I. Bouarar, S. Turquety, Y. Long, B. Duncan, S. Steenrod, S. Strode, J. Flemming, J. Mao, J. Langner, A. M. Thompson, D. Tarasick, E. C. Apel, D. R. Blake, R. C. Cohen, J. Dibb, G. S. Diskin, A. Fried, S. R. Hall, L. G. Huey, A. J. Weinheimer, A. Wisthaler, T. Mikoviny, J. Nowak, J. Peischl, J. M. Roberts, T. Ryerson, C. Warneke and D. Helmig, The POLARCAT Model Intercomparison Project (POLMIP): overview and evaluation with observations, Atmos. Chem. Phys., 2015, 15, 6721–6744 CrossRef CAS.
- B. Newsome and M. Evans, Impact of uncertainties in inorganic chemical rate constants on tropospheric composition and ozone radiative forcing, Atmos. Chem. Phys., 2017, 17, 14333–14352 CrossRef CAS.
- S. D. Eastham and D. J. Jacob, Limits on the ability of global Eulerian models to resolve intercontinental transport of chemical plumes, Atmos. Chem. Phys., 2017, 17, 2543–2553 CrossRef CAS.
- P. A. Cook, N. H. Savage, S. Turquety, G. D. Carver, F. M. O’Connor, A. Heckel, D. Stewart, L. K. Whalley, A. E. Parker, H. Schlager, H. B. Singh, M. A. Avery, G. W. Sachse, W. Brune, A. Richter, J. P. Burrows, R. Purvis, A. C. Lewis, C. E. Reeves, P. S. Monks, J. G. Levine and J. A. Pyle, Forest fire plumes over the North Atlantic: p-TOMCAT model simulations with aircraft and satellite measurements from the ITOP/ICARTT campaign, J. Geophys. Res.: Atmos., 2007, 112 DOI:10.1029/2006JD007563.
- C. L. Heald, D. J. Jacob, A. M. Fiore, L. K. Emmons, J. C. Gille, M. N. Deeter, J. Warner, D. P. Edwards, J. H. Crawford, A. J. Hamlin, G. W. Sachse, E. V. Browell, M. A. Avery, S. A. Vay, D. J. Westberg, D. R. Blake, H. B. Singh, S. T. Sandholm, R. W. Talbot and H. E. Fuelberg, Asian outflow and trans-Pacific transport of carbon monoxide and ozone pollution: An integrated satellite, aircraft, and model perspective, J. Geophys. Res.: Atmos., 2003, 108 DOI:10.1029/2003JD003507.
- E. Real, K. S. Law, B. Weinzierl, M. Fiebig, A. Petzold, O. Wild, J. Methven, S. Arnold, A. Stohl, H. Huntrieser, A. Roiger, H. Schlager, D. Stewart, M. Avery, G. Sachse, E. Browell, R. Ferrare and D. Blake, Processes influencing ozone levels in Alaskan forest fire plumes during long-range transport over the North Atlantic, J. Geophys. Res.: Atmos., 2007, 112 DOI:10.1029/2006JD007576.
- Q. Ren and C. Zhao, NOx and N2O Precursors from Biomass Pyrolysis: Nitrogen Transformation from Amino Acid, Environ. Sci. Technol., 2012, 46, 4236–4240 CrossRef CAS PubMed.
- J. M. Roberts, P. Veres, C. Warneke, J. A. Neuman, R. A. Washenfelder, S. S. Brown, M. Baasandorj, J. B. Burkholder, I. R. Burling, T. J. Johnson, R. J. Yokelson and J. de Gouw, Measurement of HONO, HNCO, and other inorganic acids by negative-ion proton-transfer chemical-ionization mass spectrometry (NI-PT-CIMS): application to biomass burning emissions, Atmos. Meas. Tech., 2010, 3, 981–990 CrossRef CAS.
- M. J. Alvarado, J. A. Logan, J. Mao, E. Apel, D. Riemer, D. Blake, R. C. Cohen, K. E. Min, A. E. Perring, E. C. Browne, P. J. Wooldridge, G. S. Diskin, G. W. Sachse, H. Fuelberg, W. R. Sessions, D. L. Harrigan, G. Huey, J. Liao, A. Case-Hanks, J. L. Jimenez, M. J. Cubison, S. A. Vay, A. J. Weinheimer, D. J. Knapp, D. D. Montzka, F. M. Flocke, I. B. Pollack, P. O. Wennberg, A. Kurten, J. Crounse, J. M. S. Clair, A. Wisthaler, T. Mikoviny, R. M. Yantosca, C. C. Carouge and P. Le Sager, Nitrogen oxides and PAN in plumes from boreal fires during ARCTAS-B and their impact on ozone: an integrated analysis of aircraft and satellite observations, Atmos. Chem. Phys., 2010, 10, 9739–9760 CrossRef CAS.
- J. D. Paris, A. Stohl, P. Nédélec, M. Y. Arshinov, M. V. Panchenko, V. P. Shmargunov, K. S. Law, B. D. Belan and P. Ciais, Wildfire smoke in the Siberian Arctic in summer: source characterization and plume evolution from airborne measurements, Atmos. Chem. Phys., 2009, 9, 9315–9327 CrossRef CAS.
- M. Val Martín, R. E. Honrath, R. C. Owen, G. Pfister, P. Fialho and F. Barata, Significant enhancements of nitrogen oxides, black carbon, and ozone in the North Atlantic lower free troposphere resulting from North American boreal wildfires, J. Geophys. Res.: Atmos., 2006, 111 DOI:10.1029/2006JD007530.
- I. Bey, D. J. Jacob, R. M. Yantosca, J. A. Logan, B. D. Field, A. M. Fiore, Q. Li, H. Y. Liu, L. J. Mickley and M. G. Schultz, Global modeling of tropospheric chemistry with assimilated meteorology: Model description and evaluation, J. Geophys. Res.: Atmos., 2001, 106, 23073–23095 CrossRef CAS.
- P. A. Barker, G. Allen, M. Gallagher, J. R. Pitt, R. E. Fisher, T. Bannan, E. G. Nisbet, S. J. B. Bauguitte, D. Pasternak, S. Cliff, M. B. Schimpf, A. Mehra, K. N. Bower, J. D. Lee, H. Coe and C. J. Percival, Airborne measurements of fire emission factors for African biomass burning sampled during the MOYA campaign, Atmos. Chem. Phys., 2020, 20, 15443–15459 CrossRef CAS.
- P. Kasibhatla, T. Sherwen, M. J. Evans, L. J. Carpenter, C. Reed, B. Alexander, Q. Chen, M. P. Sulprizio, J. D. Lee, K. A. Read, W. Bloss, L. R. Crilley, W. C. Keene, A. A. P. Pszenny and A. Hodzic, Global impact of nitrate photolysis in sea-salt aerosol on NOx, OH, and O3 in the marine boundary layer, Atmos. Chem. Phys., 2018, 18, 11185–11203 CrossRef CAS.
- C. Ye, X. Zhou, D. Pu, J. Stutz, J. Festa, M. Spolaor, C. Tsai, C. Cantrell, R. L. Mauldin, T. Campos, A. Weinheimer, R. S. Hornbrook, E. C. Apel, A. Guenther, L. Kaser, B. Yuan, T. Karl, J. Haggerty, S. Hall, K. Ullmann, J. N. Smith, J. Ortega and C. Knote, Rapid cycling of reactive nitrogen in the marine boundary layer, Nature, 2016, 532, 489–491 CrossRef CAS PubMed.
- C. A. Keller, K. E. Knowland, B. N. Duncan, J. Liu, D. C. Anderson, S. Das, R. A. Lucchesi, E. W. Lundgren, J. M. Nicely, E. Nielsen, L. E. Ott, E. Saunders, S. A. Strode, P. A. Wales, D. J. Jacob and S. Pawson, Description of the NASA GEOS Composition Forecast Modeling System GEOS-CF v1.0, J. Adv. Model. Earth Syst., 2021, 13, e2020MS002413 Search PubMed.
- J. De Wolf, Species composition and structure of the woody vegetation of the Middle Casamance region (Senegal), For. Ecol. Manage., 1998, 111, 249–264 CrossRef.
- P. Frederiksen and J. E. Lawesson, Vegetation Types and Patterns in Senegal Based on Multivariate Analysis of Field and NOAA-AVHRR Satellite Data, J. Veg. Sci., 1992, 3, 535–544 CrossRef.
- A. F. Stein, R. R. Draxler, G. D. Rolph, B. J. B. Stunder, M. D. Cohen and F. Ngan, NOAA's HYSPLIT Atmospheric Transport and Dispersion Modeling System, Bull. Am. Meteorol. Soc., 2015, 96, 2059–2077 CrossRef.
- K. R. M. Beuning and J. E. Scott, Effects of charring on the carbon isotopic composition of grass (Poaceae) epidermis, Palaeogeogr., Palaeoclimatol., Palaeoecol., 2002, 177, 169–181 CrossRef.
- K. E. Knowland, C. A. Keller and R. A. Lucchesi, File Specification for GEOS-CF Products. GMAO Office Note No. 17 (Version 1.1), 2020, p. 37, https://gmao.gsfc.nasa.gov/pubs/office_notes Search PubMed.
- C. Gerbig, S. Schmitgen, D. Kley, A. Volz-Thomas, K. Dewey and D. Haaks, An improved fast-response vacuum-UV resonance fluorescence CO instrument, J. Geophys. Res.: Atmos., 1999, 104, 1699–1704 CrossRef CAS.
- I. B. Pollack, B. M. Lerner and T. B. Ryerson, Evaluation of ultraviolet light-emitting diodes for detection of atmospheric NO2 by photolysis – chemiluminescence, J. Atmos. Chem., 2010, 65, 111–125 CrossRef CAS.
- J. D. Lee, S. D. Mobbs, A. Wellpott, G. Allen, S. J. B. Bauguitte, R. R. Burton, R. Camilli, H. Coe, R. E. Fisher, J. L. France, M. Gallagher, J. R. Hopkins, M. Lanoiselle, A. C. Lewis, D. Lowry, E. G. Nisbet, R. M. Purvis, S. O'Shea, J. A. Pyle and T. B. Ryerson, Flow rate and source reservoir identification from airborne chemical sampling of the uncontrolled Elgin platform gas release, Atmos. Meas. Tech. Discuss., 2017, 2017, 1–28 Search PubMed.
- J. R. Hopkins, A. C. Lewis and K. A. Read, A two-column method for long-term monitoring of non-methane hydrocarbons (NMHCs) and oxygenated volatile organic compounds (o-VOCs), J. Environ. Monit., 2003, 5, 8–13 RSC.
- R. T. Lidster, J. F. Hamilton, J. D. Lee, A. C. Lewis, J. R. Hopkins, S. Punjabi, A. R. Rickard and J. C. Young, The impact of monoaromatic hydrocarbons on OH reactivity in the coastal UK boundary layer and free troposphere, Atmos. Chem. Phys., 2014, 14, 6677–6693 CrossRef.
- J. R. Hottle, A. J. Huisman, J. P. DiGangi, A. Kammrath, M. M. Galloway, K. L. Coens and F. N. Keutsch, A Laser Induced Fluorescence-Based Instrument for In-Situ Measurements of Atmospheric Formaldehyde, Environ. Sci. Technol., 2009, 43, 790–795 CrossRef CAS.
- D. R. Cryer, PhD thesis, University of Leeds, 2016.
- M. Priestley, M. Le Breton, T. J. Bannan, K. E. Leather, A. Bacak, E. Reyes-Villegas, F. De Vocht, B. M. A. Shallcross, T. Brazier, M. Anwar Khan, J. Allan, D. E. Shallcross, H. Coe and C. J. Percival, Observations of Isocyanate, Amide, Nitrate, and Nitro Compounds From an Anthropogenic Biomass Burning Event Using a ToF-CIMS, J. Geophys. Res.: Atmos., 2018, 123, 7687–7704 CAS.
- M. Le Breton, A. Bacak, J. B. A. Muller, S. J. O'Shea, P. Xiao, M. N. R. Ashfold, M. C. Cooke, R. Batt, D. E. Shallcross, D. E. Oram, G. Forster, S. J. B. Bauguitte, P. I. Palmer, M. Parrington, A. C. Lewis, J. D. Lee and C. J. Percival, Airborne hydrogen cyanide measurements using a chemical ionisation mass spectrometer for the plume identification of biomass burning forest fires, Atmos. Chem. Phys., 2013, 13, 9217–9232 CrossRef.
- C. Orbe, L. D. Oman, S. E. Strahan, D. W. Waugh, S. Pawson, L. L. Takacs and A. M. Molod, Large-Scale Atmospheric Transport in GEOS Replay Simulations, J. Adv. Model. Earth Syst., 2017, 9, 2545–2560 CrossRef.
- K. Wargan, N. Kramarova, B. Weir, S. Pawson and S. M. Davis, Toward a Reanalysis of Stratospheric Ozone for Trend Studies: Assimilation of the Aura Microwave Limb Sounder and Ozone Mapping and Profiler Suite Limb Profiler Data, J. Geophys. Res.: Atmos., 2020, 125, e2019JD031892 CAS.
- K. Wargan, S. Pawson, M. A. Olsen, J. C. Witte, A. R. Douglass, J. R. Ziemke, S. E. Strahan and J. E. Nielsen, The global structure of upper troposphere-lower stratosphere ozone in GEOS-5: A multiyear assimilation of EOS Aura data, J. Geophys. Res.: Atmos., 2015, 120, 2013–2036 CAS.
- E. A. Marais, D. J. Jacob, J. L. Jimenez, P. Campuzano-Jost, D. A. Day, W. Hu, J. Krechmer, L. Zhu, P. S. Kim, C. C. Miller, J. A. Fisher, K. Travis, K. Yu, T. F. Hanisco, G. M. Wolfe, H. L. Arkinson, H. O. T. Pye, K. D. Froyd, J. Liao and V. F. McNeill, Aqueous-phase mechanism for secondary organic aerosol formation from isoprene: application to the southeast United States and co-benefit of SO2 emission controls, Atmos. Chem. Phys., 2016, 16, 1603–1618 CrossRef CAS.
- T. Sherwen, J. A. Schmidt, M. J. Evans, L. J. Carpenter, K. Großmann, S. D. Eastham, D. J. Jacob, B. Dix, T. K. Koenig, R. Sinreich, I. Ortega, R. Volkamer, A. Saiz-Lopez, C. Prados-Roman, A. S. Mahajan and C. Ordóñez, Global impacts of tropospheric halogens (Cl, Br, I) on oxidants and composition in GEOS-Chem, Atmos. Chem. Phys., 2016, 16, 12239–12271 CrossRef CAS.
- A. S. Darmenov and A. da Silva, The Quick Fire Emissions Dataset (QFED)—Documentation of versions 2.1, 2.2 and 2.4. Technical Report Series on Global Modeling and Data Assimilation, Environ. Sci., 2015, 38, 212 Search PubMed.
- G. Janssens-Maenhout, M. Crippa, D. Guizzardi, F. Dentener, M. Muntean, G. Pouliot, T. Keating, Q. Zhang, J. Kurokawa, R. Wankmüller, H. Denier van der Gon, J. J. P. Kuenen, Z. Klimont, G. Frost, S. Darras, B. Koffi and M. Li, HTAP_v2.2: a mosaic of regional and global emission grid maps for 2008 and 2010 to study hemispheric transport of air pollution, Atmos. Chem. Phys., 2015, 15, 11411–11432 CrossRef CAS.
- M. G. Schultz, A. Heil, J. J. Hoelzemann, A. Spessa, K. Thonicke, J. G. Goldammer, A. C. Held, J. M. C. Pereira and M. van het Bolscher, Global wildland fire emissions from 1960 to 2000, Global Biogeochem. Cycles, 2008, vol. 22 Search PubMed.
- H. Denier van der Gon, C. Hendriks, J. J. P. Kuenen, A. Segers and A. Visschedijik, Description of Current Temporal Emission Patterns and Sensitivity of Predicted AQ for Temporal Emission Patterns, Utrecht, The Netherlands, 2011 Search PubMed.
- M. O. Andreae, Emission of trace gases and aerosols from biomass burning – an updated assessment, Atmos. Chem. Phys., 2019, 19, 8523–8546 CrossRef CAS.
- R. Delmas, J. P. Lacaux, J. C. Menaut, L. Abbadie, X. Le Roux, G. Helas and J. Lobert, Nitrogen compound emission from biomass burning in tropical African savanna FOS/DECAFE 1991 experiment (Lamto, Ivory Coast), J. Atmos. Chem., 1995, 22, 175–193 CrossRef CAS.
- J. P. Lacaux, J. M. Brustet, R. Delmas, J. C. Menaut, L. Abbadie, B. Bonsang, H. Cachier, J. Baudet, M. O. Andreae and G. Helas, Biomass burning in the tropical savannas of Ivory Coast: An overview of the field experiment Fire of Savannas (FOS/DECAFE 91), J. Atmos. Chem., 1995, 22, 195–216 CrossRef CAS.
- G. P. Ayers, Comment on regression analysis of air quality data, Atmos. Environ., 2001, 35, 2423–2425 CrossRef CAS.
- J. Lelieveld, S. Gromov, A. Pozzer and D. Taraborrelli, Global tropospheric hydroxyl distribution, budget and reactivity, Atmos. Chem. Phys., 2016, 16, 12477–12493 CrossRef CAS.
- J. D. Lee, S. J. Moller, K. A. Read, A. C. Lewis, L. Mendes and L. J. Carpenter, Year-round measurements of nitrogen oxides and ozone in the tropical North Atlantic marine boundary layer, J. Geophys. Res.: Atmos., 2009, 114 DOI:10.1029/2009JD011879.
- I. Jonquières, A. Marenco, A. Maalej and F. Rohrer, Study of ozone formation and transatlantic transport from biomass burning emissions over West Africa during the airborne Tropospheric Ozone Campaigns TROPOZ I and TROPOZ II, J. Geophys. Res.: Atmos., 1998, 103, 19059–19073 CrossRef.
- P. Cristofanelli and P. Bonasoni, Background ozone in the southern Europe and Mediterranean area: influence of the transport processes, Environ. Pollut., 2009, 157, 1399–1406 CrossRef CAS.
- S. Henne, J. Klausen, W. Junkermann, J. M. Kariuki, J. O. Aseyo and B. Buchmann, Representativeness and climatology of carbon monoxide and ozone at the global GAW station Mt. Kenya in equatorial Africa, Atmos. Chem. Phys., 2008, 8, 3119–3139 CrossRef CAS.
- C. Emery, Z. Liu, A. G. Russell, M. T. Odman, G. Yarwood and N. Kumar, Recommendations on statistics and benchmarks to assess photochemical model performance, J. Air Waste Manage. Assoc., 2017, 67, 582–598 CrossRef CAS PubMed.
- M. J. Rowlinson, A. Rap, D. S. Hamilton, R. J. Pope, S. Hantson, S. R. Arnold, J. O. Kaplan, A. Arneth, M. P. Chipperfield, P. M. Forster and L. Nieradzik, Tropospheric ozone radiative forcing uncertainty due to pre-industrial fire and biogenic emissions, Atmos. Chem. Phys., 2020, 20, 10937–10951 CrossRef CAS.
- W. McKinney, in Proceedings of the 9th Python in Science Conference, ed. S. van der Walt and J. Millman, 2010, pp. 51–56 Search PubMed.
- S. Hoyer and J. J. Hamman, xarray: N-D labeled Arrays and Datasets in Python, J. Open Res. Softw., 2017, 5(10) DOI:10.5334/jors.148.
- T. Sherwen, B. Newsome, K. Murphy and D. Ellis, tsherwen/AC_tools: v0.1.2 (Version v0.1.2), Zenodo, accessed May, 2021, DOI:10.5281/zenodo.4789902.
- J. M. Roberts, C. E. Stockwell, R. J. Yokelson, J. de Gouw, Y. Liu, V. Selimovic, A. R. Koss, K. Sekimoto, M. M. Coggon, B. Yuan, K. J. Zarzana, S. S. Brown, C. Santin, S. H. Doerr and C. Warneke, The nitrogen budget of laboratory-simulated western US wildfires during the FIREX 2016 Fire Lab study, Atmos. Chem. Phys., 2020, 20, 8807–8826 CrossRef CAS.
- J. M. Roberts, F. C. Fehsenfeld, S. C. Liu, M. J. Bollinger, C. Hahn, D. L. Albritton and R. E. Sievers, Measurements of aromatic hydrocarbon ratios and NOx concentrations in the rural troposphere: Observation of air mass photochemical aging and NOx removal, Atmos. Environ., 1984, 18, 2421–2432 CrossRef CAS.
- M. M. Coggon, C. Y. Lim, A. R. Koss, K. Sekimoto, B. Yuan, J. B. Gilman, D. H. Hagan, V. Selimovic, K. J. Zarzana, S. S. Brown, J. M. Roberts, M. Müller, R. Yokelson, A. Wisthaler, J. E. Krechmer, J. L. Jimenez, C. Cappa, J. H. Kroll, J. de Gouw and C. Warneke, OH chemistry of non-methane organic gases (NMOGs) emitted from laboratory and ambient biomass burning smoke: evaluating the influence of furans and oxygenated aromatics on ozone and secondary NMOG formation, Atmos. Chem. Phys., 2019, 19, 14875–14899 CrossRef CAS.
- T. S. Carter, C. L. Heald, J. L. Jimenez, P. Campuzano-Jost, Y. Kondo, N. Moteki, J. P. Schwarz, C. Wiedinmyer, A. S. Darmenov, A. M. da Silva and J. W. Kaiser, How emissions uncertainty influences the distribution and radiative impacts of smoke from fires in North America, Atmos. Chem. Phys., 2020, 20, 2073–2097, DOI:10.5194/acp-20-2073-2020.
- T. Sherwen, wacl-york/ARNA: v0.1.0 (v0.1.0), Zenodo, 2021, DOI:10.5281/zenodo.5171877.
Footnotes |
| † Electronic supplementary information (ESI) available. See DOI: 10.1039/d1ea00041a |
| ‡ Now at British Antarctic Survey, Natural Environment Research Council, Cambridge CB3 0ET, UK. |
| § Now at Faculty of Science and Engineering, University of Chester, Chester, UK. |
| This journal is © The Royal Society of Chemistry 2021 |