 Open Access Article
Creative Commons Attribution 3.0 Unported Licence
Dependence of phase transitions on halide ratio in inorganic CsPb(BrxI1−x)3 perovskite thin films obtained from high-throughput experimentation†
H.
Näsström
 ab,
P.
Becker
bd,
J. A.
Márquez
 b,
O.
Shargaieva
a,
R.
Mainz
 *d,
E.
Unger
*ac and
T.
Unold
 *b
*b
aYoung Investigator Group Hybrid Materials Formation and Scaling, Helmholtz-Zentrum Berlin für Materialien und Energie GmbH, Kekuléstraße 5, 12489 Berlin, Germany. E-mail: eva.unger@helmholtz-berlin.de
bDepartment Structure and Dynamics of Energy Materials, Helmholtz-Zentrum Berlin für Materialien und Energie GmbH, Hahn-Meitner-Platz 1, 14109 Berlin, Germany. E-mail: unold@helmholtz-berlin.de
cLund University, Chemical Physics and Nano Lund, Sweden
dDepartment Microstructure and Residual Stress Analysis, Helmholtz-Zentrum Berlin für Materialien und Energie GmbH, Hahn-Meitner Platz 1, 14109 Berlin, Germany. E-mail: roland.mainz@helmholtz-berlin.de
First published on 22nd October 2020
Abstract
In this communication, we present the phase diagram of CsPb(BrxI1−x)3 (0 ≤ x ≤ 1, 300–585 K) obtained by high-throughput in situ GIWAXS measurements of a combinatorial thin film library. We find that all compositions convert to the cubic perovskite phase at high temperature and that the presence of bromide in the films stabilizes the metastable perovskite phases upon cool down. In accordance with recent predictions from DFT-calculations, the transition temperatures monotonically decrease with increasing bromide content.
Introduction
In recent years, hybrid perovskites (ABX3) have proven to be an excellent absorber material for photovoltaic applications and are currently the best performing thin-film materials with power conversion efficiencies above 25%.1 Many of these perovskite materials can easily be processed from solution by spin-coating, slot-dye coating,2 or inkjet printing3 at moderate processing temperatures. An advantage for the application of halide perovskite materials in optoelectronics is the tunability of their structural and optoelectronic properties through the substitution or mixing of their constituents.4 By varying the A-site cation (e.g. methylammonium, formamidinium, Cs), the B site metal (e.g. Pb, Sn, Ge), or the X site halide (e.g. I, Br, Cl) a vast compositional space is created and the majority of it still remains uninvestigated.Aside from many favorable optoelectronic properties,5 issues related to material stability have been of major concern for halide perovskite materials, because any possible instability or degradation may impose a serious limitation on commercial applications of these materials. The limited thermal stability of halide hybrid perovskites is in part due to the use of volatile organic cations such as methylammonium and formamidinium.6,7 Therefore, a possible improvement can be expected from using inorganic cations, such as cesium.8 For cesium lead halide perovskites, CsPbI3 with an optical bandgap of Eg = 1.73 eV (ref. 8) and CsPbBr3 with a bandgap of 2.37 eV (ref. 9) are the most interesting for photovoltaic applications. However, it has been found that the cubic perovskite α-phase of CsPbI3 is only stable at high temperatures T > 570 K and undergoes a phase transition into the distorted perovskite β- and γ-phases upon cool down.10 The γ-phase shows favorable optical and electronic properties with a bandgap of 1.73 eV and charge carrier mobilities larger than 30 cm2 V−1 s−1.12 However, these distorted perovskite phases are metastable at room temperature, due to the low Goldschmidt tolerance factor11 of CsPbI3 (0.822). At room temperature, CsPbI3 samples tend to transform into the non-semiconducting orthorhombic δ-phase,10 which does not have a perovskite structure and is not suitable for solar cell applications, because of its large bandgap of 2.7 eV and vanishing charge carrier mobility < 0.1 cm2 V−1 s−1.12 CsPbBr3, on the other hand, is stable in a semiconducting orthorhombic perovskite phase at room temperature,13 but its bandgap of 2.37 eV is too high for tandem or single junction photovoltaic applications. A natural compromise arises from the use of bromide–iodide mixtures of CsPb(BrxI1−x)3, with tunable optical band gaps between 1.73 and 2.37 eV, which makes these mixtures interesting for multi-junction solar cell applications, in particular for tandem devices.14 In addition, improved phase stability at room temperature is reported for certain compositions.15–18 However, in contrast to more detailed investigations for CsPbI3 found in literature,10,19 the high-temperature phase diagram of these mixtures remains so far mostly unexplored.
For CsPbI3 the phase transition during heating up and cooling down differ. In particular, during heating up the non-perovskite orthorhombic phase converts into the cubic α-phase, which requires a substantial reordering of the crystal structure.10 On the contrary, during cooling down, the phase transition from the high-temperature cubic α-phase may be described within the framework of displacive phase transitions, involving only small movements to change the symmetry of the crystal structure.20 A recent DFT-based study on the lattice dynamics of Cs-based halide perovskites proposed that the high-temperature α-phase can be viewed as a dynamically disordered phase, in which fast transitions of the lattice between symmetrically octahedrally-tilted local structures lead to an average cubic structure.21 Within this model, the transition from the cubic structure to the lower symmetry orthorhombically-tilted structures during cooling down is viewed as a freezing-in of the crystal structure in these local lower-symmetry structures. The phase transition temperature for this freezing-in was predicted to depend on the energy barrier separating the local potential minima arising from the anharmonic lattice potentials. The DFT calculations showed a dependence of the potential barrier on the chemical composition and, in particular, the Goldschmidt tolerance factor. These calculations, thus, predicted that for increasing the Goldschmidt tolerance factor the phase-transition temperature between the high-temperature cubic and the lower symmetry orthorhombic phases is lowered, which can be tested by investigating mixed halide Cs–Pb based perovskite materials.
In this work, we fabricate a material library of CsPb(BrxI1−x)3 by combinatorial inkjet printing of 9 different compositions between x = 0 and x = 2/3 on a single 50 × 25 mm2 substrate. Additionally, two samples with x = 0.85 and x = 1 are prepared by spin-coating. This library is then simultaneously investigated by in situ grazing-incidence wide-angle X-ray scattering (GIWAXS) and X-ray fluorescence (XRF) in a temperature range of 300–585 K to determine the temperature-dependent phase diagrams. We find that all investigated compositions convert to a cubic perovskite phase at high temperature and transition to metastable tetragonal and orthorhombic distorted perovskite phases upon cool down. The transition temperatures for all phase transitions are found to decrease with increasing bromide content.
Methods
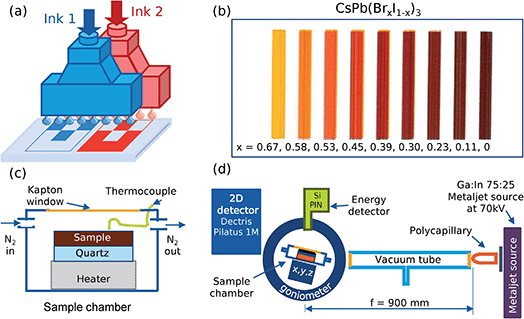
The compositional variation was achieved by combinatorial inkjet printing with two different inks that intermix locally to provide the desired composition on the substrate. For this, a PiXDRO LP50 printer with dual Spectra SE-128 print-heads was used where one ink was fed into the first print-head and the other ink into the second print-head (Fig. 1a). The first print-head was then programmed to print an image with varying coverage across the substrate whilst the second print-head, simultaneously, printed an image with the opposite variation. This resulted in a substrate with an overall constant density of ink across its surface but with the ratio of the two inks varying according to the input images.A combinatorial sample of CsPb(BrxI1−x)3 was printed in a nitrogen-filled glovebox using CsPbBr2I in anhydrous dimethyl sulfoxide, DMSO, (≥99.9% Sigma Aldrich) as the first ink and CsPbI3 in DMSO as the second ink, corresponding to x = 0.67 and x = 0, see Fig. 1b. The inks were prepared by dissolving 4 mmol of PbI2 (≥99.99% TCI) and PbBr2 (≥99.99% TCI) in 4 ml of DMSO and was then added respectively to 4 mmol of CsI (≥99.999% ABCR) and left to shake at 60 °C for 12 h. A pure CsPbBr3 solution was prepared in the same way by dissolving 0.6 mmol PbBr2 in 2 ml of DMSO and was then added to 0.6 mmol of CsBr (≥99.999% ABCR). Nine rectangles, with decreasing coverage from left to right for the first image and increasing coverage for the second image, were printed on a 50 × 25 mm2 quartz substrate (GVB GmbH) at 450 dpi with dual spectra SE-128 (30 pl drops) print-heads. After printing, the film was evacuated at ∼100 Pa for 450 s and annealed at 100 °C for 90 min to crystalize the sample and remove any remaining DMSO molecules, all in a nitrogen atmosphere. The rectangles were elongated in the direction normal to the gradient, in order to accommodate the extended projection of the X-ray beam for the GIWAXS characterization. For reference measurements, a blade-coated CsPbBr3 and a spin-coated CsPb(BrxI1−x)3 (x = 0.85) sample was prepared from the CsPbBr3 solution in DMSO and a mixture with the CsPbI3 solution in DMSO respectively.
After printing and annealing, the sample was exposed to a humid environment (∼60% relative humidity) at room temperature for 24 hours to convert all compositions to the thermodynamically most stable phase. Subsequently, the sample was placed on top of a quartz substrate in an air-tight heating chamber with a polyamide window, to allow transmission of X-rays, and flushed with dry nitrogen at a rate of 0.2 l min−1, replacing the gas volume of the chamber every 30 s. For the acquisition of the diffractogram and X-ray fluorescence spectrum, a holding time of 10 s was used. The measurement spot of the X-rays was cycled between each of the rectangles as the heater was continuously heated up from 298 K to 673 K at a rate of 2.5 K min−1, held at 673 K for 5 min and then cooled down again at a rate of 2.5 K min−1.
The composition, x in CsPb(BrxI1−x)3, was determined by fitting the linear combination of the two XRF end spectra, corresponding to CsPbI3 and CsPbBr2I respectively, to the sum of the spectra collected from each rectangle over time.
The collected 2D diffractograms were calibrated using a LaB6 reference measurement and integrated azimuthally to obtain 1D patterns.
Results
Fig. 2 shows the radially integrated GIWAXS patterns as a function of temperature for CsPb(Br0.23I0.77)3 (x = 0.23) both during heating up to the highest temperature (585 K) and during cooling down to room temperature. The patterns for the other compositions can be found in the ESI (Fig. S3–S13†).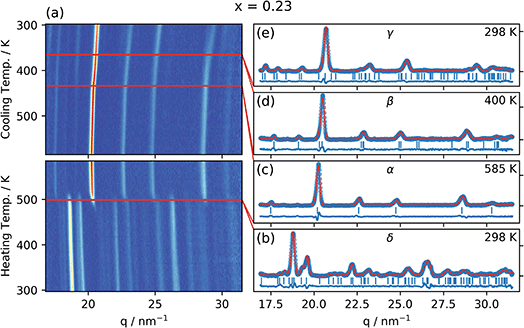 | ||
Fig. 2 (a) Integrated GIWAXS pattern as a function of temperature for CsPb(BrxI1−x)3 with x = 0.23 (determined by in situ XRF) as the sample is heated and then cooled at a rate of 2.5 K min−1. Red lines indicate the phase transitions. (b)–(e) Integrated GIWAXS patterns for the four different phases in the sample (blue circles), Le Bail refinement (red line), peak positions (vertical blue lines), and the residuals (blue line). (b) The non-perovskite Pnma orthorhombic δ-phase in which the sample (aged in a humid environment) is in the beginning of the experiment, (c) the Pm![[3 with combining macron]](https://www.rsc.org/images/entities/char_0033_0304.gif) m cubic perovskite α-phase to which the sample transitions at 499 K, (d) the P4/mbm tetragonal perovskite β-phase to which the sample transitions at 433 K when cooling down from the α-phase, and finally, (e), the Pbnm orthorhombic perovskite γ-phase to which the sample transitions at 365 K when cooling down from the β-phase. Figures for the other nine compositions can be found in the ESI.† m cubic perovskite α-phase to which the sample transitions at 499 K, (d) the P4/mbm tetragonal perovskite β-phase to which the sample transitions at 433 K when cooling down from the α-phase, and finally, (e), the Pbnm orthorhombic perovskite γ-phase to which the sample transitions at 365 K when cooling down from the β-phase. Figures for the other nine compositions can be found in the ESI.† | ||
A clear phase transition is observed during the heating period at about 500 K, whereas more subtle changes occur during cooling down, as discussed in more detail below. The initial phase observed at room temperature can be refined with the Pnma orthorhombic, non-perovskite, δ-phase previously reported for CsPbI3,10 as shown by the solid line in Fig. 2b. This is also the main initial phase for most of the compositions investigated, together with a small but increasing fraction of the perovskite phase present for the higher bromide contents (Fig. S1†). For the two reference samples with the highest Br content, no δ-phase was observed and instead the γ-phase was the initial polymorph observed in these samples. The phase at the highest temperature (585 K) was identified as and refined with the Pm![[3 with combining macron]](https://www.rsc.org/images/entities/char_0033_0304.gif) m cubic α-phase, previously found for CsPbI3,10 as shown by the solid line in Fig. 2c. This α-phase was identified for all investigated compositions at this temperature as shown in the ESI.†
m cubic α-phase, previously found for CsPbI3,10 as shown by the solid line in Fig. 2c. This α-phase was identified for all investigated compositions at this temperature as shown in the ESI.†
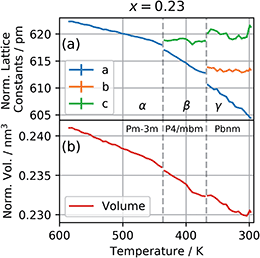
The patterns obtained during the cooling down of the samples were evaluated by a series of Le Bail refinements using Fullprof starting from the high-temperature α-phase.22 The starting value was determined by the position of the 002 peak and each consecutive refinement was based on the results of the previous one. As previously found for CsPbI3 the crystal structure is expected to lose symmetry during cool down and transition to the P4/mbm tetragonal perovskite β-phase followed by a transition to the Pbnm orthorhombic perovskite γ-phase.10 The refined lattice parameters were converted to pseudo-cubic lattice parameters by dividing a and b by  for the tetragonal and orthorhombic phase and by dividing c by 2 for the orthorhombic phase. The variation of lattice parameters a, b, and c translated to pseudo-cubic lattice parameters for the composition x = 0.23 and the pseudo-cubic cell volume for the same composition are shown in Fig. 3a and b respectively.
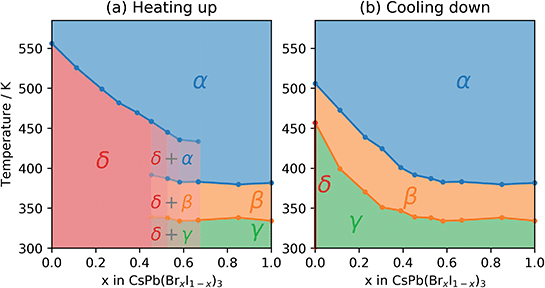
During heating up, the phase transition temperature between the initial δ-phase and the α-phase was determined by fitting a Gaussian function to the 002 peak of the α-phase as well as the 204 and 105 peaks of the δ-phase. The integrated area of these peaks as a function of temperature was then fitted with a sigmoid function and the transition temperature defined as the average of the inflection points for the three peak areas (Fig. S1†). Based on the fitted transition temperatures the phase diagram as a function of temperature for the heating of CsPb(BrxI1−x)3 was constructed as shown in Fig. 4a.
During the cool down, the transitions to the lower symmetry phases were determined by evaluating the deviation from a linear decrease in the pseudo-cubic cell volume as well as the deterioration of the fit (Fig. S2†). Additionally, in the samples with high Br content, the transition from the β- to the γ-phase was determined by the intensity of the emerging 121 and 211 peaks. The resulting phase diagram as a function of temperature for cooling down CsPb(BrxI1−x)3 is shown in Fig. 4b. For pure CsPbI3 (x = 0), the thin film sample degraded to the δ-phase during cool down in contrast to previous studies on powders10 but in agreement with previous studies on thin films employing slow cooling rates.23 It appears that for the slow rate of 2.5 K min−1 the pure CsPbI3 sample has enough time at high temperature to convert to the δ-phase at around 455 K, which coincides with the previously reported value for the β to γ transition.10
The transition temperatures for all three phase transitions are listed in Table 1.
| Composition, x | Transition temperature/K | ||
|---|---|---|---|
| δ → α | α → β | β → γ | |
| 0.00 | 556 | 506 | 457 (ref. 10) |
| 0.11 | 526 | 473 | 399 |
| 0.23 | 499 | 439 | 370 |
| 0.30 | 482 | 425 | 351 |
| 0.39 | 470 | 401 | 347 |
| 0.45 | 459 | 392 | 339 |
| 0.53 | 445 | 387 | 338 |
| 0.58 | 436 | 383 | 334 |
| 0.67 | 433 | 383 | 335 |
| 0.85 | — | 380 | 338 |
| 1.00 | — | 382 | 334 |
Finally, the refined lattice parameter, a, at 575![[thin space (1/6-em)]](https://www.rsc.org/images/entities/char_2009.gif) K is plotted as a function of the bromide content, x, in Fig. 5.
K is plotted as a function of the bromide content, x, in Fig. 5.
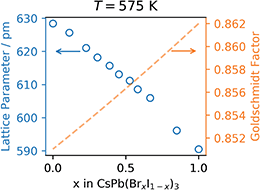 | ||
| Fig. 5 Left axis, refined lattice parameter at 575 K and right axis Goldschmidt tolerance factor, both as a function of Br content, x. | ||
Discussion
As seen in Fig. 5, the refined lattice parameter of the CsPb(BrxI1−x)3 mixture in the cubic phase at 575 K decreases linearly as a function of the bromide content in accordance with Vegard's law.24 This implies that the mixture is in fact a solid solution and explains the tunability in optical properties previously reported.25,26 This tunability is of great importance for 4-terminal or triple junction tandems where a bandgap between 1.8 and 2.0 eV is required depending on the choice of the bottom cell(s).14 However, the phase instability still remains a limitation for the pure cesium lead iodide and its mixed halide solid solutions. This can be rationalized using the Goldschmidt tolerance factor,11 which has been shown to be applicable also in the estimation of thermodynamic stability of halide perovskites.27For CsPbI3 the Goldschmidt tolerance factor is well below one (0.851) due to the small ionic radius of the cesium cation (r = 188 pm) relative to the cuboctahedral cavity formed by the lead cation (r = 119 pm) and the iodide anion (r = 220 pm).28 As iodide is gradually being replaced by the smaller bromide cation (r = 196 pm) the effective halide radius decreases causing a reduction in the size of the cuboctahedral cavity and an improvement of the tolerance factor as plotted using a dashed orange line in Fig. 5.
For CsPbI3 the initial non-perovskite δ-phase reorganizes into the cubic perovskite α-phase at a high temperature of 556 K, similar to previously reported.10 From the phase diagram in Fig. 4 we can see that the solid solutions go through the same reorganization, but the temperature required for the δ to α phase transition decreases with increasing bromide content. This agrees well with previous studies on powders,29 where a decreasing phase transition temperature during heating was found for higher bromide content. During cool down, the solid solutions undergo a successive phase transition due to the collapse of the cuboctahedral cavity causing a tilting of the octahedra and first transitions to a tetragonal β-phase followed by an orthorhombic γ-phase. This successive phase transition as well as the anisotropic temperature evolution of the individual cell parameters shown in Fig. 3 agrees well with previous work on CsPbI3.10 The phase diagram established in this study shows that the incorporation of the smaller bromide ions reduces the temperature at which phase transitions associated with octahedral tilting occur.
Although the change in the Goldschmidt factor resulting from the substitution of iodide by bromide is rather small for the investigated samples, this quantity may still be a good descriptor for the observed changes in the phase diagram. As discussed above, Yang et al.21 calculated the energy barrier in the anharmonic potential landscape of various Cs-based halide perovskites and found a clear non-linear correlation of the height of this barrier with the decreasing value of the Goldschmidt factor. In particular, they find an initial sharp decrease which levels out for larger values of the Goldschmidt factor. We note that these calculations can be used to describe the symmetry-breaking transitions during cool down, but not the δ to α phase transition during the heating up cycle. The observed lowering of the phase transition temperatures during cool down with increasing bromide content (increasing the Goldschmidt factor), that levels out for high Br content, clearly shows that this conceptual framework can be applied not only to different (Cs, Pb, and Sn-based) ternary halide perovskites but also to solid solutions composed of these materials.
The reduced transition temperature is accompanied by an increase in the stability of the metastable perovskite phase. This was visible during the aging of the CsPb(BrxI1−x)3 material library before the measurement, where the samples containing bromide took substantially longer time to convert to the yellow non-perovskite phase. After 48 h at ∼60% relative humidity, there is also a larger fraction of the perovskite phase left in the samples with increased bromide content (Fig. S1†). However, a quantitative study of this phenomenon still needs to be conducted. Additionally, the addition of Br to the pure CsPbI3 stabilizes the perovskite phase at high temperature which was otherwise observed to degrade to the δ-phase, when cooling at a rate of 2.5 K min−1, at the temperature where the β to γ transition was expected.
Finally, we would like to point out that this study was enabled by the fast combinatorial printing of a material library and the use of a high-flux metaljet X-ray source. This reduces the time for sample preparation and characterization to less than a day without the need of synchrotron radiation, presenting an important milestone for the future acceleration of materials research by high-throughput and combinatorial methods.
In conclusion, we have determined the temperature-dependent phase diagram of the CsPb(BrxI1−x)3 solid solution for 0 ≤ x ≤ 1 both during heating up and cooling down. From the phase diagram it is evident that the substitution of the large iodide ions with smaller bromide ions reduces the temperature required to transition to the perovskite phase as well as the octahedral distortion during cool down.
Conflicts of interest
There are no conflicts to declare.Acknowledgements
The authors would like to acknowledge the support of Malte Wansleben during the measurements, the guidance of Florian Mathies during the inkjet printing, and the help with Fullprof from Rene Gunder. HN, OS, and EU acknowledge funding from the German Ministry of Education and Research (BMBF) for the Young Investigator Group Hybrid Materials Formation and Scaling (HyPerFORME) within the program “NanoMatFutur” (grant no. 03XP0091). HN, PB, JM, and TU acknowledge the support from the HyPerCells graduate school and HN thanks the HI-SCORE research school.Notes and references
- Best Research-Cell, Efficiency Chart | Photovoltaic Research | NREL, https://www.nrel.gov/pv/cell-efficiency.html, accessed 23 February 2020 Search PubMed.
- Y. Rong, Y. Ming, W. Ji, D. Li, A. Mei, Y. Hu and H. Han, J. Phys. Chem. Lett., 2018, 9, 2707–2713 CrossRef CAS
.
- F. Mathies, E. J. W. List-Kratochvil and E. L. Unger, Energy Technol., 2020, 8, 1900991 CrossRef CAS
.
- T. J. Jacobsson, J.-P. Correa-Baena, M. Pazoki, M. Saliba, K. Schenk, M. Grä and A. Hagfeldt, Energy Environ. Sci., 2016, 9, 1706 RSC
.
- Q. Dong, Y. Fang, Y. Shao, P. Mulligan, J. Qiu, L. Cao and J. Huang, Science, 2015, 347, 967–970 CrossRef CAS
.
- Z. Song, S. C. Watthage, A. B. Phillips, B. L. Tompkins, R. J. Ellingson and M. J. Heben, Chem. Mater., 2015, 27, 4612–4619 CrossRef CAS
.
- E. J. Juarez-Perez, L. K. Ono, M. Maeda, Y. Jiang, Z. Hawash and Y. Qi, J. Mater. Chem. A, 2018, 6, 9604–9612 RSC
.
- G. E. Eperon, G. M. Paternò, R. J. Sutton, A. Zampetti, A. A. Haghighirad, F. Cacialli and H. J. Snaith, J. Mater. Chem. A, 2015, 3, 19688–19695 RSC
.
- G. Mannino, I. Deretzis, E. Smecca, A. La Magna, A. Alberti, D. Ceratti and D. Cahen, J. Phys. Chem. Lett., 2020, 11, 2490–2496 CrossRef CAS
.
- A. Marronnier, G. Roma, S. Boyer-Richard, L. Pedesseau, J. M. Jancu, Y. Bonnassieux, C. Katan, C. C. Stoumpos, M. G. Kanatzidis and J. Even, ACS Nano, 2018, 12, 3477–3486 CrossRef CAS
.
- V. M. Goldschmidt, Naturwissenschaften, 1926, 14, 477–485 CrossRef CAS
.
- P. Becker, J. A. Márquez, J. Just, A. Al-Ashouri, C. Hages, H. Hempel, M. Jošt, S. Albrecht, R. Frahm and T. Unold, Adv. Energy Mater., 2019, 9, 1900555 CrossRef
.
- M. R. Linaburg, E. T. McClure, J. D. Majher and P. M. Woodward, Chem. Mater., 2017, 29, 3507–3514 CrossRef CAS
.
- M. T. Hörantner, T. Leijtens, M. E. Ziffer, G. E. Eperon, M. G. Christoforo, M. D. McGehee and H. J. Snaith, ACS Energy Lett., 2017, 2, 2506–2513 CrossRef
.
- Y. Jiang, J. Yuan, Y. Ni, J. Yang, Y. Wang, T. Jiu, M. Yuan and J. Chen, Joule, 2018, 2, 1356–1368 CrossRef
.
- J. Tian, Q. Xue, X. Tang, Y. Chen, N. Li, Z. Hu, T. Shi, X. Wang, F. Huang, C. J. Brabec, H. Yip and Y. Cao, Adv. Mater., 2019, 31, 1901152 CrossRef
.
- W. Chen, H. Chen, G. Xu, R. Xue, S. Wang, Y. Li and Y. Li, Joule, 2019, 3, 191–204 CrossRef CAS
.
- W. Zhu, Q. Zhang, D. Chen, Z. Zhang, Z. Lin, J. Chang, J. Zhang, C. Zhang and Y. Hao, Adv. Energy Mater., 2018, 8, 1802080 CrossRef
.
- J. A. Steele, H. Jin, I. Dovgaliuk, R. F. Berger, T. Braeckevelt, H. Yuan, C. Martin, E. Solano, K. Lejaeghere, S. M. J. Rogge, C. Notebaert, W. Vandezande, K. P. F. Janssen, B. Goderis, E. Debroye, Y. K. Wang, Y. Dong, D. Ma, M. Saidaminov, H. Tan, Z. Lu, V. Dyadkin, D. Chernyshov, V. Van Speybroeck, E. H. Sargent, J. Hofkens and M. B. J. Roeffaers, Science, 2019, 365, 679–684 CrossRef CAS
.
- M. T. Dove, Am. Mineral., 1997, 82, 213–244 CAS
.
- R. X. Yang, J. M. Skelton, E. L. Da Silva, J. M. Frost and A. Walsh, J. Phys. Chem. Lett., 2017, 8, 4720–4726 CrossRef CAS
.
- J. Rodríguez-Carvajal, Phys. B, 1993, 192, 55–69 CrossRef
.
- J. A. Steele, H. Jin, I. Dovgaliuk, R. F. Berger, T. Braeckevelt, H. Yuan, C. Martin, E. Solano, K. Lejaeghere, S. M. J. Rogge, C. Notebaert, W. Vandezande, K. P. F. Janssen, B. Goderis, E. Debroye, Y. K. Wang, Y. Dong, D. Ma, M. Saidaminov, H. Tan, Z. Lu, V. Dyadkin, D. Chernyshov, V. Van Speybroeck, E. H. Sargent, J. Hofkens and M. B. J. Roeffaers, Science, 2019, 365, 679–684 CrossRef CAS
.
- L. Vegard, Z. Phys., 1921, 5, 17–26 CrossRef CAS
.
- R. J. Sutton, G. E. Eperon, L. Miranda, E. S. Parrott, B. A. Kamino, J. B. Patel, M. T. Hörantner, M. B. Johnston, A. A. Haghighirad, D. T. Moore and H. J. Snaith, Adv. Energy Mater., 2016, 6, 1502458 CrossRef
.
- R. E. Beal, D. J. Slotcavage, T. Leijtens, A. R. Bowring, R. A. Belisle, W. H. Nguyen, G. F. Burkhard, E. T. Hoke and M. D. Mcgehee, J. Phys. Chem. Lett., 2016, 7, 746–751 CrossRef CAS
.
- S. Burger, M. G. Ehrenreich and G. Kieslich, J. Mater. Chem. A, 2018, 6, 21785–21793 RSC
.
- R. D. Shannon, Acta Crystallogr., Sect. A: Cryst. Phys., Diffr., Theor. Gen. Crystallogr., 1976, 32, 751–767 CrossRef
.
- S. Sharma, N. Weiden and A. Weiss, Z. Phys. Chem., 1992, 175, 63–80 CrossRef CAS
.
Footnote |
| † Electronic supplementary information (ESI) available. See DOI: 10.1039/d0ta08067e |
| This journal is © The Royal Society of Chemistry 2020 |

