Porous V2O5 yolk–shell microspheres for zinc ion battery cathodes: activation responsible for enhanced capacity and rate performance†
Rui
Li
ab,
Huamin
Zhang
 a,
Qiong
Zheng
 *a and
Xianfeng
Li
 *a
*a
aDivision of Energy Storage, Dalian National Laboratory for Clean Energy, Dalian Institute of Chemical Physics, Chinese Academy of Sciences, Zhongshan Road 457, Dalian 116023, P. R. China. E-mail: lixianfeng@dicp.ac.cn; zhengqiong@dicp.ac.cn
bUniversity of Chinese Academy of Sciences, Beijing 100039, P. R. China
First published on 31st January 2020
Abstract
Rechargeable aqueous zinc ion batteries have attracted significant attention for practical energy storage due to their low cost and high safety, however, it is still a hard task to find suitable cathode materials to meet the demand of both high capacity and rate performance. Here, we propose a high-performance anhydrous V2O5 yolk–shell cathode via a facile template-free solvothermal technique. Owing to its porous structure, the V2O5 cathode could largely facilitate rapid electrolyte transportation and restrain structural collapse during cycling. Moreover, it is interesting to find that the interlayer spacing expands from 4.37 to 13.45 Å through an interesting activation process, as a result, the prepared V2O5 cathode demonstrated high reversible capacities of 410 mA h g−1 at 0.1 A g−1 and 182 mA h g−1 at 20 A g−1 and a capacity retention of 80% can be achieved over 1000 cycles at 5.0 A g−1, which is superior to those of most commonly reported anhydrous V2O5 cathodes. Therefore, this paper demonstrates the potential of V2O5 for achieving high energy/power densities as a cathode material in ZIBs.
1. Introduction
As global warming is attracting more and more attention, renewable energy sources such as wind and solar energy are playing more and more important roles in future sustainable energy systems.1–3 Nevertheless, due to the random and intermittent nature of these renewable energies, electrical energy storage systems (ESSs) are vital to realize wide application or increase the reliability of these renewable energies. Nowadays, Li-ion batteries (LIBs) have occupied a leading position in the commercial ESS market compared to other rechargeable batteries owing to their attractive properties of high energy density and a long cycle life, yet the ever-growing demands for low cost and safety have motivated the pursuit of alternative battery systems when it comes to large-scale applications. Rechargeable aqueous zinc-ion batteries (ZIBs) are considered as one of the most promising candidates because of the abundant distribution of zinc sources and mild aqueous electrolyte. What's more, zinc possesses a low redox potential (−0.76 V vs. standard hydrogen electrode) and a high theoretical capacity (820 mA h g−1, 5851 mA h cm−3) compared with other metal anodes,4 providing the battery with a high energy density in an aqueous system.However, the multivalent nature and large size of Zn2+ are a huge hindrance for the development of ZIBs that require a suitable cathode material to intercalate Zn2+.5,6 To date, materials with large open frameworks, such as manganese-based oxides,7–13 Prussian blue analogs14–16 and NASICON-type polyanion compounds,17–19 have been reported as hosts for Zn2+ intercalation, however, they all suffer from a poor cycling life or limited specific capacity.
Very recently, a series of vanadium-based compounds possessing a layered or tunnel structure have received much attention for their low cost and multiple oxidation states of vanadium.20 For example, Nazar et al. reported Zn0.25V2O5·nH2O as a cathode,21 which showed a considerable capacity of 300 mA h g−1 (50 mA g−1) and excellent rate performance. Later, MxV2O5·nH2O (M = Mg,22 Ca,23 Ag,24 Na,25 K,26 Li,27 and NH4![[thin space (1/6-em)]](https://www.rsc.org/images/entities/char_2009.gif) 28etc.) with different morphologies were reported with enhanced performance by introducing different metal ions. Typically, the intercalated metal ions24 and H2O molecules29 play a crucial role in expanding the V–O layer to facilitate the transport of Zn2+ and enhance its rate performance, however, they will inevitably sacrifice their theoretical specific capacity compared with anhydrous V2O5 at the same time. So Yu30et al. and Liang31et al. have tried to adopt anhydrous V2O5 as a cathode, but unlike bilayered V2O5·nH2O (space group C2/m), it is disappointing that the distance between the two single chains in orthorhombic V2O5 is only 4.4 Å, which leads to greater coulombic interaction with the intercalated Zn2+ ion thus hindering its diffusion across the electrode. Therefore, they demonstrated low reversible capacity or rapid capacity fading resulting from strong electrostatic interaction and poor structural stability during the Zn2+ ion de/intercalation.
28etc.) with different morphologies were reported with enhanced performance by introducing different metal ions. Typically, the intercalated metal ions24 and H2O molecules29 play a crucial role in expanding the V–O layer to facilitate the transport of Zn2+ and enhance its rate performance, however, they will inevitably sacrifice their theoretical specific capacity compared with anhydrous V2O5 at the same time. So Yu30et al. and Liang31et al. have tried to adopt anhydrous V2O5 as a cathode, but unlike bilayered V2O5·nH2O (space group C2/m), it is disappointing that the distance between the two single chains in orthorhombic V2O5 is only 4.4 Å, which leads to greater coulombic interaction with the intercalated Zn2+ ion thus hindering its diffusion across the electrode. Therefore, they demonstrated low reversible capacity or rapid capacity fading resulting from strong electrostatic interaction and poor structural stability during the Zn2+ ion de/intercalation.
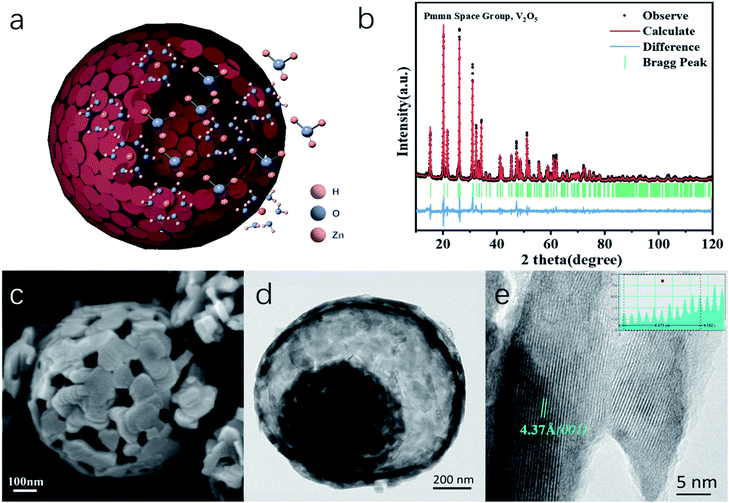
Herein, we present a novel V2O5 yolk–shell microsphere (V2O5-YS) as the low-cost ZIB cathode, showing high capacity, excellent rate performance and a long cycle life. In this design, yolk–shell architectures of V2O5 could achieve an outstanding performance in ZIBs for the following reasons: (i) an increased contact area for electrodes and electrolytes and shortened paths for Zn2+ and electronic transport, providing a superior rate capability and (ii) easy accommodation of the strain due to zinc-ion (de)intercalation, enhancing its cycling stability. Moreover, it is worth noting that an interesting activation process expanding its lamellar spacing has been discussed as shown schematically in Fig. 1a, which involves H+/Zn2+ co-insertion during the activation.
2. Results and discussion
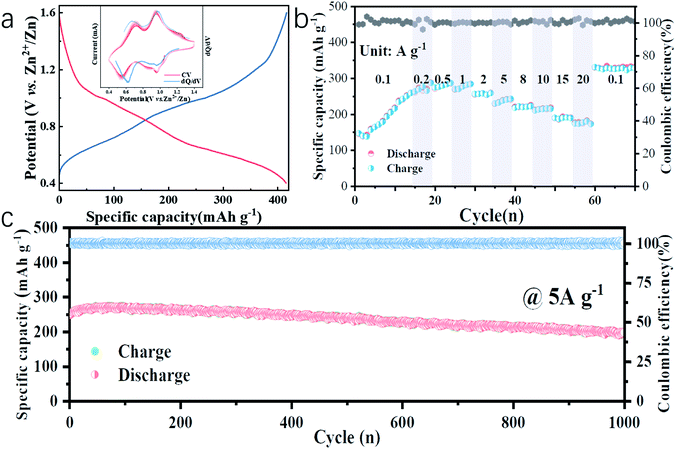
In this work, water-free V2O5-YS is synthesized via a simple template-free solvothermal method. The crystal structure of the as-prepared V2O5 is determined by Rietveld refinement by assuming an orthorhombic structure in the Pmmn(59) space group (Fig. 1b). All characteristic peaks are in accordance with the standard card of V2O5 (JCPDS card no. 41-1426), demonstrating its high purity and good crystallinity. The morphology and microstructures of the as-prepared V2O5-YS are investigated by field emission scanning electron microscopy (SEM) and high-resolution TEM (HRTEM). As shown in Fig. 1c and S1,† the as-prepared products display porous spheres with a diameter of 1–2 μm, which are assembled from pieces of nanosheets with a width of about 100 nm. The yolk–shell morphology can be seen in some broken balls and the thickness of their shell is dozens of nanometers (Fig. S2†). To further prove the microstructure, a typical TEM image of an individual yolk–shell structure is illustrated in Fig. 1d. Its HRTEM image is shown in Fig. 1e, where fringes are clearly visible and the d-spacing of 4.37 Å matches well with the (001) plane of V2O5.In order to investigate the electrochemical performances of V2O5-YS, CR-2016 coin-type cells are fabricated in ambient air, where zinc foil and 3 M Zn(CF3SO3)2 are adopted as an anode and an electrolyte, respectively. The V2O5-YS cathode shows a remarkably high reversible capacity of 410 mA h g−1 at a current density of 0.1 A g−1 (Fig. 2a) and simultaneously demonstrates superior rate performance at the current densities ranging from 0.1 to 20 A g−1 (Fig. 2b). Even at a current density of 20 A g−1, a superior capacity of 182 mA h g−1 can be obtained. This result could be ascribed to its unique construction. Likewise, the powder possesses a larger specific surface area than commercial layered V2O5 (Fig. S3†), which facilitates the infiltration of the electrolyte and thus shortens the diffusion distance of Zn2+. Meanwhile, the yolk–shell structure of V2O5 can also buffer the volume expansion and maintain its architecture during the charge and discharge process (Fig. S4†) thus improving the cycling performance (Fig. S5†). Compared with the cycling performance of pristine V2O5 (Fig. S6†) and other V2O5-based materials (Table S1†), V2O5-YS demonstrates a better capacity of 200 mA h g−1 (a capacity retention of 80%) after 1000 cycles at 5 A g−1 as shown in Fig. 2c.
Since no clear plateau can be observed from the charge and discharge curves, the corresponding differential capacity (dQ/dV) curve (the inset of Fig. 2a, blue line) is fitted, where two couples of peaks at 0.62/0.68 V and 0.97/0.98 V in accordance with the cyclic voltammetry (CV) curves at a san rate of 0.2 mV s−1 (the inset of Fig. 2a, red lines) can be observed, suggesting the multistep (de)intercalation of Zn2+. It is worth noting that the discharge capacity increased slowly from 150 to 250 mA h g−1 within the first 15 cycles, which can be due to the activation process of V2O5-YS, which was similar to those reported in previous articles31–33 while there is a lack of specific explanation. A detailed exploration in this respect will accelerate the understanding of the energy storage mechanism, which is still controversial in rechargeable ZIBs. Herein, the activation process was investigated in detail. More impressively, after the activation and high-rate cycling, the capacity could recover back to 320 mA h g−1 at 0.1 A g−1, even a bit higher than that in the beginning.
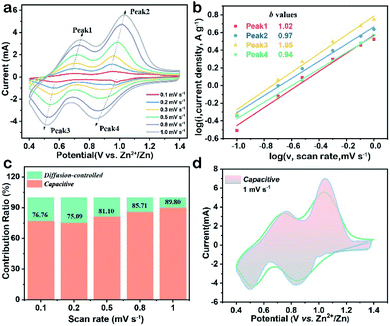
To explain the high-rate performance, CV measurements were performed to investigate the electrochemical kinetics of the V2O5-YS cathode in detail. Fig. 3a exhibits representative CV curves measured at different scan rates and the CV profiles (peak 1–4) retain their shapes while increasing the scan rates from 0.1 to 1.0 mV s−1. To further understand the charge storage kinetics in the V2O5 hosts, we calculated the capacitive contribution of measured current using the following equation34
| i = avb | (1) |
| i(V) = k1v + k2v1/2 | (2) |
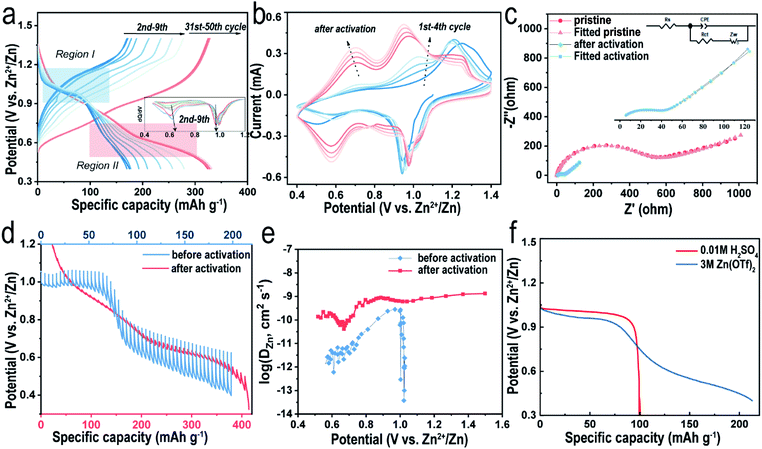
As mentioned above, the reversible capacity increases significantly in the beginning and eventually remains constant after several cycles (Fig. 4a). Such an electrochemical phenomenon was reported in previous articles32,40 and explained simply for the gradual utilization of active materials30 in the activation process, where their intrinsic nature is still retained in the dark. As shown in Fig. 4a, during the first discharging at 0.1 A g−1, a plateau appears at ∼0.98 V, followed by a slope area gradually dropping to the cutoff of 0.4 V, delivering a total capacity of 160 mA h g−1. To clearly see the reactions during the discharging process, differential capacity curves are shown in Fig. 4a, where we can observe the variation of two peaks. During the activation, the peak corresponding to the plateau area stays still and that assigned to the slope area gradually appears. Therefore, we assume that the discharge process can be divided into a two-phase reaction region (Region I) and a solid-solution region (Region II). However, the plateau disappears in the subsequent charging curve, indicating an irreversible electrochemical process. Interestingly, although the specific discharge capacity increases in the following 10 cycles, the plateau retains a capacity of ∼100 mA h g−1 and its voltage versus Zn2+/Zn, suggesting that the slope area accounts for most of the increasing capacity. It is well known that a single-phase reaction would not form phase boundaries and thus lead to a superior rate performance.41 As the capacity becomes stable after several cycles, the plateau region is not obvious anymore and the discharge and charge curves become more symmetrical, implying that the faradaic reaction has become more favorable. Meanwhile, the electrode polarization indicated by the voltage difference at this moment is smaller than that in the beginning, which agrees with the sharp decrease of the charge-transfer resistance (Rct) value as revealed by the electrochemical impedance spectra (EIS, Fig. 4c, S7 and Table S2†). V2O5-YS presents a Rct value of 380 Ω in the initial state and the value decreases to 39.8 Ω after activation. Similar observations were interpreted as the intercalated H2O can effectively shield the electrostatic reaction.29 Furthermore, the peaks of CV curves could also suggest that it becomes more reversible after activation. As illustrated in Fig. 4b, the CV profile in the first cycle only has a pair of redox peaks which gradually turns into two pairs of reversible peaks in the following cycles, which resembles to some V2O5·nH2O electrodes.29,42 This may be attributed to the trapped H2O acting as interlayer pillars consequently stabilizing the structure during the (de)intercalation of Zn2+.
Additionally, in order to gain insights into the electrochemical behavior, the Zn2+ diffusion coefficient (DZn2+) of the V2O5-YS cathode at different states was calculated by the galvanostatic intermittent titration technique (GITT, see details in the ESI†). As seen in Fig. 4d and e, during the first discharge, the GITT curve confirms the plateau region (Region I, above 0.8 V) and the slope area (Region II, 0.4–0.8 V). It is worthwhile to note that the overvoltage in Region I is much smaller than that in Region II, indicating a significant difference in kinetics between the two regions. According to Fig. 4e (see detailed calculations in the ESI†), the calculated DZn2+ values in Region I are two orders of magnitude higher than those in the slope area. We assume that it may also involve H+ insertion due to its much smaller size and higher reaction kinetics in Region I, whereas overvoltage in Region II is mainly attributed to the Zn2+ insertion. Considering that the pH value of 3 M Zn(CF3SO3)2 electrolyte is 4.8, a three-electrode cell test was performed on the V2O5-YS cathode in 0.01 M H2SO4 electrolyte without Zn2+. As illustrated in Fig. 4f, the discharge curve of the Zn2+-absent electrolyte displays only one plateau with similar voltage and capacity to those of the Zn2+ contained electrolyte in Region I, confirming that H+ ions can be inserted into V2O5. In addition, with the decrease of the H+ concentration (Fig. S8†), the capacity provided by H+ will accordingly decrease, suggesting that Zn2+ ions partly contribute to the capacity of the Zn(CF3SO3)2 electrolyte as well. These results could also give an explanation for the variation of CV curves after activation. The peaks in the first cycle refer to H+ insertion and gradually decay on account of Zn2+ insertion. To investigate the reaction kinetics of the cathode after activation, the GITT experiment is carried out on the V2O5-YS cathode after activating for 10 cycles at 0.05 A g−1 (Fig. 4d and e). It is observed that the overvoltage during each pulse after activation is drastically decreased and the corresponding diffusion coefficient of Zn ions shows a reverse variation. The high ionic conductivity can be ascribed to the activation process and may provide an effective Zn2+ diffusion path in the discharge and charge process to achieve excellent rate performance.
To confirm the charge storage mechanism, the phase transitions in the electrochemical process were detected by ex situ XRD and the patterns in the initial and after activation are shown in Fig. 5a and b, respectively. As can be seen in Fig. 5a, the XRD pattern of the V2O5-YS electrode displays only peaks of V2O5 and Ti foil (JCPDS no. 89-2762) in the initial phase and the peaks at 15.35°/26.13°/31.00°/34.28°, corresponding to the (200), (110), (040) and (310) planes of V2O5, respectively, shift noteworthily to a lower degree upon being soaked in an aqueous electrolyte, indicating the increasing of the interlayer spacing as a result of the water molecule intercalation. Meanwhile, several new peaks are observed at 12.29°/16.90°/30.10°/36.46°, which indicate the formation of a new phase of Zn3V2O7(OH)2·2H2O (JCPDS no. 50-0570) and accordingly release of more H+ ions in the aqueous electrolyte. What's more, these peaks will not change during cycling due to the strong electrostatic interaction between the inserted Zn2+ and the vanadium–oxygen layer.43 It could also be found in SEM images (Fig. S9†) that present nanoflake shapes. As discussed above, the XRD patterns can be divided into two regions consistent with the first discharge curve. In Region I, the V2O5 phase remains during the discharging process with the peaks slightly shifting left. Taking the (200) and (110) planes as an example, the insertion of hydrated Zn2+ and H+ ions into V2O5 enlarges the lattice spacing, but at the same time the intensity of diffraction planes diminishes little by little until it discharges to 0.8 V. Meanwhile, a new layered phase of ZnxV2O5·nH2O was found for a series of new peaks located at 14.18°/21.28°/28.62°/43.48°, corresponding to a series of (00l) reflections with the interlayer distances of 6.24, 4.16, 3.12 and 2.08 Å, respectively. This indicates a larger interlayer spacing which agrees with recent reports on bi-layered V2O5·nH2O29,44,45 and the CV tests above. Besides, some new peaks also appeared, such as the peak at 26.38°, whose corresponding species are difficult to find and remain to be further investigated. When discharged to 0.4 V, in the XRD pattern of the newly formed phase there is hardly any change observed. However, for the (004) reflection (see the magnified image in Fig. S10†), it is found that the peak shifts to a higher degree and then turns reversely when it charges to 1.2 V, further suggesting that the charged material undergoes a solid-solution reaction in Region II. The contraction of the interlayer distance results from the expulsion of water from the interlayer and the strong electrostatic interaction between the intercalated zinc ions and the V–O layer.21 Although the good structural reversibility of the material is proven by reappearance of the diffraction pattern in the charged state, the slightly left shifting of the XRD pattern after the first cycle proves the pristine structural evolution, namely the activation process, from V2O5 to V2O5·nH2O as well. Besides, SEM images could also reflect the structural change during the discharge and charge process, as shown in Fig. 6. It can be clearly observed that a new phase is formed vertically on the nanosheets inside and outside the structure during the discharge process which then fades away in the subsequent charging.
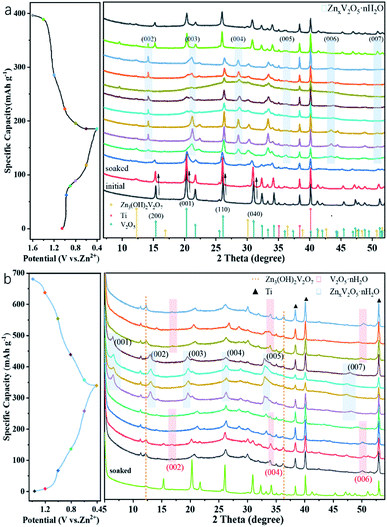 | ||
| Fig. 5 Typical discharge–charge curve at 0.05 A g−1 and ex situ XRD patterns of the V2O5-YS cathode at different voltages vs. Zn2+/Zn (a) in the first cycle (b) and in the 11th cycle. | ||
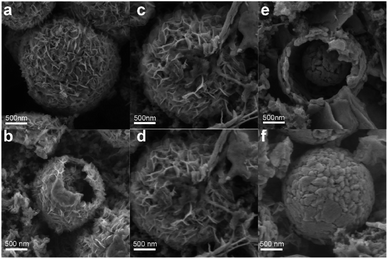 | ||
| Fig. 6 The ex situ SEM images of the V2O5-YS cathode at different voltage states (a and b) 1st discharged to 0.98 V (c and d) 1st fully discharged to 0.4 V (e and f) 1st fully charged to 1.6 V. | ||
After activating for 10 cycles, the insertion mechanism was further investigated as shown in Fig. 5b. It was found that the charged state of the XRD pattern was remarkably different from the initial state. Compared with the initial pattern, only a few Bragg reflections are detectable in a typical XRD test as a result of the low crystallinity of V2O5·nH2O,44 and a set of peaks located at 16.75°/33.58°/51.88° appears, corresponding to the interlayer distance of 5.29, 2.66 and 1.76 Å, respectively. This value indicates that the interlayer distance of the (00l) plane has broadened sharply from 4.37 to 10.58 Å ascribed to the activation process. In Region I, only a small expansion of the interlayer distance is observed for the considerably lower amount of inserted zinc ions. With further intercalation of zinc ions, a set of peaks assigned to the layered ZnxV2O5·nH2O phase occurs at 6.56°, 13.08°, 19.66°, 26.30°, 33.50° and 47.36°, suggesting that the d-spacing of the (001) plane ultimately enlarges up to 13.45 Å. Interestingly, it is worth noting that the change of d-spacing (007) in Region II (Fig. S10†) demonstrates a different tendency from that of the (004) plane in the initial cycle. The interlayer distance exhibits an increase with the zinc content and follows the reverse evolution of discharge. This could be attributed to the increased screening of the interlayer electrostatic repulsion as the Zn2+ content increases.
Based on the analysis and discussion outlined above, we proposed the storage mechanism as illustrated in Scheme 1. In the first few cycles, the V2O5-YS cathode undergoes the activation process where hydrated vanadium oxide is produced with the insertion of water and H+. Owing to the dissociation of water, Zn3V2O7(OH)2·2H2O would come into being as a by product in the meantime. In the subsequent cycles, reversible insertion of Zn2+ takes place in V2O5·nH2O, which corresponds to the cycles with stable capacity. For better understanding the charge and discharge process, the electrode reaction formulas are shown as follows:
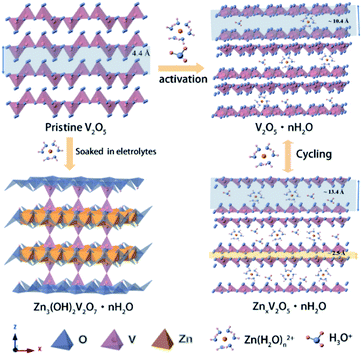 | ||
| Scheme 1 Schematic illustration of the energy storage mechanism during activation and cycling processes. | ||
The first few cycles on the V2O5-YS cathode
| H2O → H+ + OH− |
By-product:
| 3Zn2+ + 6OH− + V2O5 → Zn3(OH)2V2O7 + 2H2O |
Discharge:
Region I:
| V2O5 + nH2O + me− + xZn2+ + mH+ → ZnxHmV2O5·nH2O |
Region II:
| ZnxHmV2O5·nH2O + 2ye− + yZn2+ + mH+ → Znx+yHmV2O5·nH2O |
Charge:
| Znx+yHmV2O5·nH2O − 2(x + y + m)e− → V2O5·nH2O + mH+ + (x + y)Zn2+ |
The subsequent cycles:
| V2O5·nH2O + 2xe− + xZn2+ ↔ ZnxV2O5·nH2O (H+ is negligible here) |
The reaction on the zinc anode:
| Zn ↔ 2e + Zn2+ |
3. Conclusions
In summary, we have synthesized V2O5-YS by a simple solvothermal method followed by an annealing process as a cathode for ZIBs in an aqueous electrolyte. The V2O5-YS cathode delivers high capacities of 410 and 182 mA h g−1 at current densities of 0.1 and 20 A g−1, respectively. A combination of varieties of tests was carried out to illustrate the activation process from V2O5-YS to V2O5·nH2O with the insertion of water and H+. Meanwhile, the interspace accordingly changes from 4.4 Å to 13.5 Å, which facilitates Zn2+ insertion and stabilizes the structure during cycling. Moreover, owing to the porous yolk shell microstructure, the cavities and holes could alleviate the volume expansion and thus exhibit excellent reversibility as well, showing promising application as a ZIB cathode material.4. Experimental
4.1 Preparation of V2O5 yolk–shell
V2O5-YS was prepared using a modified method reported in the previous research.45 In a typical synthesis, 2 mmol NH4VO3 and 2 mmol citric acid monohydrate (C6H8O7·H2O) were dissolved in 10 mL de-ionized water at 60 °C in a water bath with constant stirring for 30 min until a dark blue solution was obtained, and then 40 mL of isopropanol and 20 mL of glycerol were added. The resulting precursor solution was transferred into a sealed 100 mL Teflon-lined autoclave and heated to 200 °C for 10 h. After naturally cooling to room temperature, the as-synthesized product was collected and rinsed with de-ionized water and ethanol and dried in a vacuum at 60 °C for 6 h. Finally, the as-obtained precursor was annealed in air at 400 °C at a heating rate of 1 °C min−1 for 2 h.4.2 Materials characterization
X-ray powder diffraction (XRD) patterns and ex situ XRD patterns were recorded on a powder X-ray diffractometer (Rigaku Ultima IV) with Cu Kα radiation at λ = 1.5418 Å. The morphologies and nano-crystalline nature of the samples were observed using a scanning electron microscope (SEM, JSM-7800F) and a transmission electron microscope (TEM, JEM-2100). Energy dispersive X-ray spectra (EDS) were recorded using an Oxford EDS IE250 system.4.3 Electrochemical measurements
Electrochemical tests of the V2O5-YS and pristine V2O5 cathodes were performed with CR-2016 coin-type cells and three-electrode cells. The working electrode was fabricated by mixing the active material (70 wt%), conductive carbon (Super-P, 20 wt%) and polyvinylidene fluoride (PVDF, 10 wt%), and then the slurry was cast onto Ti foil and dried in a vacuum oven at 60 °C for 8 h. The cathode was cut into Φ14 with an active material mass loading of ∼1.0 mg cm−2. In a CR-2016-type cell, zinc foil and a glass fiber membrane were used as an anode and a separator, respectively, and 3 M zinc trifluoromethanesulfonate (Zn(CF3SO3)2) aqueous solution was used as an electrolyte. In a typical three-electrode cell, the V2O5-YS cathode was adopted as the working electrode, Pt foil as the counter electrode and Hg/Hg2SO4 as the reference electrode.CR-2016-type coin cells were assembled in the air atmosphere to evaluate the electrochemical performances with a LAND battery testing system (CT2001A) at 25 °C. Galvanostatic charge–discharge tests and the galvanostatic intermittent titration technique (GITT) were performed on a LAND battery testing system. In the GITT test, a battery was charged or discharged at a current density of 0.05 A g−1 for 5 min, followed by a 1 h rest. The procedure was repeated until the battery reached the cut off voltage. The tests for cycling at 0.2 A g−1 or 5 A g−1 were performed after full activation for 10 cycles from 0.4 V to 1.6 V at 0.1 A g−1. The tests for rate performance were performed after activation for 10 cycles from 0.4 V to 1.4 V at 0.1 A g−1. Cyclic voltammetry (CV) and electrochemical impedance spectroscopy (EIS) were carried out on an electrochemical workstation (Biologic VMP3 station).
Conflicts of interest
The authors declare no competing financial interests.Acknowledgements
The authors acknowledge the Strategic Priority Research Program of the Chinese Academy of Sciences (XDA21070500).Notes and references
- M. Song, H. Tan, D. Chao and H. J. Fan, Adv. Funct. Mater., 2018, 28, 1802564 CrossRef
.
- T. Liu, X. Cheng, H. Yu, H. Zhu, N. Peng, R. Zheng, J. Zhang, M. Shui, Y. Cui and J. Shu, Energy Storage Materials, 2019, 18, 68–91 CrossRef
.
- J. Ming, J. Guo, C. Xia, W. Wang and H. N. Alshareef, Mater. Sci. Eng., R, 2019, 135, 58–84 CrossRef
.
- A. Konarov, N. Voronina, J. H. Jo, Z. Bakenov, Y.-K. Sun and S.-T. Myung, ACS Energy Lett., 2018, 2620–2640, DOI:10.1021/acsenergylett.8b01552
.
- T. H. Wu, Y. Zhang, Z. D. Althouse and N. Liu, Materials Today Nano, 2019, 6, 323–330 CrossRef
.
- X. Zeng, J. Hao, Z. Wang, J. Mao and Z. Guo, Energy Storage Materials, 2019, 20, 410–437 CrossRef
.
- W. Sun, F. Wang, S. Hou, C. Yang, X. Fan, Z. Ma, T. Gao, F. Han, R. Hu, M. Zhu and C. Wang, J. Am. Chem. Soc., 2017, 139, 9775–9778 CrossRef CAS PubMed
.
- D. Chao, W. Zhou, C. Ye, Q. Zhang, Y. Chen, L. Gu, K. Davey and S. Qiao, Angew. Chem., Int. Ed. Engl., 2019, 58, 7823–7828 CrossRef CAS PubMed
.
- N. Zhang, F. Cheng, J. Liu, L. Wang, X. Long, X. Liu, F. Li and J. Chen, Nat. Commun., 2017, 8, 405 CrossRef PubMed
.
- S. Islam, M. H. Alfaruqi, V. Mathew, J. Song, S. Kim, S. Kim, J. Jo, J. P. Baboo, D. T. Pham, D. Y. Putro, Y.-K. Sun and J. Kim, J. Mater. Chem. A, 2017, 5, 23299–23309 RSC
.
- T. Xiong, Z. G. Yu, H. Wu, Y. Du, Q. Xie, J. Chen, Y. W. Zhang, S. J. Pennycook, W. S. V. Lee and J. Xue, Adv. Energy Mater., 2019, 9, 1803815 CrossRef
.
- H. Li, Z. Liu, G. Liang, Y. Huang, Y. Huang, M. Zhu, Z. Pei, Q. Xue, Z. Tang, Y. Wang, B. Li and C. Zhi, ACS Nano, 2018, 12, 3140–3148 CrossRef CAS PubMed
.
- G. Fang, C. Zhu, M. Chen, J. Zhou, B. Tang, X. Cao, X. Zheng, A. Pan and S. Liang, Adv. Funct. Mater., 2019, 1808375, DOI:10.1002/adfm.201808375
.
- K. Lu, B. Song, Y. Zhang, H. Ma and J. Zhang, J. Mater. Chem. A, 2017, 5, 23628–23633 RSC
.
- M. S. Chae, J. W. Heo, H. H. Kwak, H. Lee and S. T. Hong, J. Power Sources, 2017, 337, 204–211 CrossRef CAS
.
- Z. Liu, G. Pulletikurthi and F. Endres, ACS Appl. Mater. Interfaces, 2016, 8, 12158–12164 CrossRef CAS PubMed
.
- G. Li, Z. Yang, Y. Jiang, C. Jin, W. Huang, X. Ding and Y. Huang, Nano Energy, 2016, 25, 211–217 CrossRef CAS
.
- W. Li, K. Wang, S. Cheng and K. Jiang, Energy Storage Materials, 2018, 15, 14–21 CrossRef
.
- S. Islam, M. H. Alfaruqi, D. Y. Putro, V. Mathew, S. Kim, J. Jo, S. Kim, Y. K. Sun, K. Kim and J. Kim, ChemSusChem, 2018, 11, 2239–2247 CrossRef CAS PubMed
.
- F. Wan and Z. Niu, Angew. Chem., Int. Ed. Engl., 2019, 58, 16358–16367 CrossRef CAS PubMed
.
- D. Kundu, B. D. Adams, V. Duffort, S. H. Vajargah and L. F. Nazar, Nat. Energy, 2016, 1, 16119 CrossRef CAS
.
- F. Ming, H. Liang, Y. Lei, S. Kandambeth, M. Eddaoudi and H. N. Alshareef, ACS Energy Lett., 2018, 3, 2602–2609 CrossRef CAS
.
- C. Xia, J. Guo, P. Li, X. Zhang and H. N. Alshareef, Angew. Chem., Int. Ed. Engl., 2018, 57, 3943–3948 CrossRef CAS PubMed
.
- Y. Yang, Y. Tang, S. Liang, Z. Wu, G. Fang, X. Cao, C. Wang, T. Lin, A. Pan and J. Zhou, Nano Energy, 2019, 61, 617–625 CrossRef CAS
.
- P. He, G. Zhang, X. Liao, M. Yan, X. Xu, Q. An, J. Liu and L. Mai, Adv. Energy Mater., 2018, 8, 1702463 CrossRef
.
- B. Tang, G. Fang, J. Zhou, L. Wang, Y. Lei, C. Wang, T. Lin, Y. Tang and S. Liang, Nano Energy, 2018, 51, 579–587 CrossRef CAS
.
- Y. Yang, Y. Tang, G. Fang, L. Shan, J. Guo, W. Zhang, C. Wang, L. Wang, J. Zhou and S. Liang, Energy Environ. Sci., 2018, 11, 3157–3162 RSC
.
- D. Bin, Y. Liu, B. Yang, J. Huang, X. Dong, X. Zhang, Y. Wang and Y. Xia, ACS Appl. Mater. Interfaces, 2019, 11, 20796–20803 CrossRef CAS PubMed
.
- M. Yan, P. He, Y. Chen, S. Wang, Q. Wei, K. Zhao, X. Xu, Q. An, Y. Shuang, Y. Shao, K. T. Mueller, L. Mai, J. Liu and J. Yang, Adv. Mater., 2018, 30, 1703725 CrossRef PubMed
.
- D. Chen, X. Rui, Q. Zhang, H. Geng, L. Gan, W. Zhang, C. Li, S. Huang and Y. Yu, Nano Energy, 2019, 60, 171–178 CrossRef CAS
.
- J. Zhou, L. Shan, Z. Wu, X. Guo, G. Fang and S. Liang, Chem. Commun., 2018, 54, 4457–4460 RSC
.
- N. Zhang, Y. Dong, M. Jia, X. Bian, Y. Wang, M. Qiu, J. Xu, Y. Liu, L. Jiao and F. Cheng, ACS Energy Lett., 2018, 3, 1366–1372 CrossRef CAS
.
- H. Qin, L. Chen, L. Wang, X. Chen and Z. Yang, Electrochim. Acta, 2019, 306, 307–316 CrossRef CAS
.
- V. Augustyn, J. Come, M. A. Lowe, J. W. Kim, P. L. Taberna, S. H. Tolbert, H. D. Abruna, P. Simon and B. Dunn, Nat. Mater., 2013, 12, 518–522 CrossRef CAS PubMed
.
- G. Yang, T. Wei and C. Wang, ACS Appl. Mater. Interfaces, 2018, 10, 35079–35089 CrossRef CAS PubMed
.
- N. Zhang, M. Jia, Y. Dong, Y. Wang, J. Xu, Y. Liu, L. Jiao and F. Cheng, Adv. Funct. Mater., 2019, 29, 1807331 CrossRef
.
- C. Xia, J. Guo, Y. Lei, H. Liang, C. Zhao and H. N. Alshareef, Adv. Mater., 2018, 30, 1705580 CrossRef PubMed
.
- T. Wei, Q. Li, G. Yang and C. Wang, J. Mater. Chem. A, 2018, 6, 20402–20410 RSC
.
- F. Wan, L. Zhang, X. Dai, X. Wang, Z. Niu and J. Chen, Nat. Commun., 2018, 9, 1656 CrossRef PubMed
.
- V. Soundharrajan, B. Sambandam, S. Kim, M. H. Alfaruqi, D. Y. Putro, J. Jo, S. Kim, V. Mathew, Y. K. Sun and J. Kim, Nano Lett., 2018, 18, 2402–2410 CrossRef CAS PubMed
.
- J. Shin, D. S. Choi, H. J. Lee, Y. Jung and J. W. Choi, Adv. Energy Mater., 2019, 9, 1900083 CrossRef
.
- Y. Wang, K. Takahashi, H. Shang and G. Cao, J. Phys. Chem. B, 2005, 109, 3085–3088 CrossRef CAS PubMed
.
- B. Tang, J. Zhou, G. Fang, F. Liu, C. Zhu, C. Wang, A. Pan and S. Liang, J. Mater. Chem. A, 2019, 7, 940–945 RSC
.
- A. Moretti and S. Passerini, Adv. Energy Mater., 2016, 6, 1600868 CrossRef
.
- J. Zhu, L. Cao, Y. Wu, Y. Gong, Z. Liu, H. E. Hoster, Y. Zhang, S. Zhang, S. Yang, Q. Yan, P. M. Ajayan and R. Vajtai, Nano Lett., 2013, 13, 5408–5413 CrossRef CAS PubMed
.
Footnote |
| † Electronic supplementary information (ESI) available. See DOI: 10.1039/c9ta11750d |
| This journal is © The Royal Society of Chemistry 2020 |

