Pr2BaNiMnO7−δ double-layered Ruddlesden–Popper perovskite oxides as efficient cathode electrocatalysts for low temperature proton conducting solid oxide fuel cells†
Qi
Wang
 ab,
Jie
Hou
 a,
Yun
Fan
a,
Xiu-an
Xi
a,
Jun
Li
ab,
Ying
Lu
ab,
Ge
Huo
ab,
Lin
Shao
ab,
Xian-Zhu
Fu
a,
Yun
Fan
a,
Xiu-an
Xi
a,
Jun
Li
ab,
Ying
Lu
ab,
Ge
Huo
ab,
Lin
Shao
ab,
Xian-Zhu
Fu
 *a and
Jing-Li
Luo
 *ac
*ac
aCollege of Materials Science and Engineering, Shenzhen University, Shenzhen 518060, China. E-mail: xz.fu@szu.edu.cn; Jingli.Luo@ualberta.ca
bKey Laboratory of Optoelectronic Devices and Systems of Ministry of Education and Guangdong Province, College of Optoelectronic Engineering, Shenzhen University, Shenzhen 518060, China
cDepartment of Chemical and Materials Engineering, University of Alberta, Edmonton, Alberta T6G 2G6, Canada
First published on 25th December 2019
Abstract
The performance of low-temperature solid-oxide fuel cells (LT-SOFCs) is heavily dependent on the electrocatalytic activity of the cathode toward the oxygen reduction reaction (ORR). To overcome the obstacles of the poor activity and stability of traditional cathode materials, a Pr2BaNiMnO7−δ double-layered Ruddlesden–Popper structural oxide was developed that exhibits high ORR activity, exceptional low-temperature cell performance, long-term stability, and excellent chemical compatability with a BaZr0.1Ce0.7Y0.1Yb0.1O3−δ (BZCYYb) proton-conducting electrolyte. When Pr2BaNiMnO7−δ is used as the cathode electrocatalyst for BZCYYb-based SOFCs, it demonstrates a peak power density of 1070 mW cm−2 at 700 °C with excellent stability under 0.7 V after 100 h of discharging. Even at 500 and 400 °C, the peak power densities still reach 259 and 135 mW cm−2, respectively. The area-specific polarization resistance of this cell is 0.084 Ω cm2 at 700 °C under open-circuit voltage (OCV) conditions. Interestingly, the activation energy (Ea) of the polarization resistance derived from the assembled single cell is lower than that in the reported literature, corresponding to a value of 0.96 eV. The excellent performance is higher than those of the state-of-the-art Ruddlesden–Popper structure materials used as cathode electrocatalysts for LT-SOFCs. Thus, these results suggest that the double-layered Ruddlesden–Popper perovskite oxide Pr2BaNiMnO7−δ is a preeminent highly active low-temperature cathode material.
1. Introduction
Solid-oxide fuel cells (SOFCs) can directly convert the chemical energy of fuels into electricity, and have attracted special attention for their high fuel conversion efficiency, low environmental impact, and excellent fuel flexibility.1–6 To overcome the construction and durability limitations of the stacking system that accompanies the high operating temperatures (800–1000 °C) of conventional SOFCs, lowering the operating temperature to a low temperature (LT, below 600 °C) is the inevitable choice of research direction for an SOFC development regime.6–8 However, the oxygen reduction reaction (ORR) at the cathode is thermally activated and the exponentially increased cathode polarization resistances directly lead to drastically decreased performances of the SOFCs. In this case, cathode resistance is a serious drawback for operation at low temperature. Therefore, cathode materials showing high performance at low temperature are required for the development of LT-SOFCs. And thus a good cathode should possess enough electrical conductivity (above 100 S cm−1), excellent electrocatalytic activity, good chemical compatibility, a thermal expansion coefficient (TEC) compatible with the electrolyte and excellent stability.9–12To achieve a feasible, alternative cathode, research efforts have concentrated on developing a novel cathode material with good properties. Traditional cathode materials, such as La0.6Sr0.4MnO3 (LSM), show a relatively high area specific resistance (ASR) compared to the available anode materials.13 A layered LnBaCo2O5+δ perovskite oxide cathode suffers from various stability issues during long-term operation, including A-site segregation, CO2 poisoning to form carbonates and unmatched TEC compared to those of typical electrolytes.14,15 As an alternative cathode material system, Ruddlesden–Popper (R–P) perovskite oxides with layered structures have attracted attention, in consideration of their extremely high oxygen ion conductivities and electronic conductivity inside the rock salt layer.11,16 R–P series materials have promising ORR applications for high-temperature SOFC electrodes. As reported in the literature, one layered R–P oxides have been studied extensively, such as La2NiO4 and Pr2NiO4,17–26 and Pr2NiO4 has better ORR activity than La2NiO4 or Nd2NiO4.27,28 In addition, according to the calculated and experimental results, the double-layered R–P phase structure La3Ni2O7 exhibits better oxygen ion and proton transport behaviour than single-layered La2NiO4.29 In the double-layered Ln3Ni2O7, the transition dopant metals (Mn, Fe, Co and Cu) are favourable for enhancing oxygen diffusion and proton diffusivity to some extent at the same time. Oxygen ion conduction is found to be closely related to the microelectronic structure and charge density gradients generated from the chemical bonding between O and the B-site atoms along the oxygen migration pathway. While, for proton diffusion, the dopants can weaken the proton association and enlarge the capacity of the ‘electron pocket’ around the Fermi level, which is beneficial to fast proton diffusivity in the R–P phase structure.29 Intuitively, the typological transfer mode for the R–P cathode is shown in Fig. 1, in which the proton electrolyte SOFC cathode allows simultaneous oxygen ion, electron and proton transportation. The ORR routes are similar to those reported in the literature,30 and a recent report31 demonstrated that oxygen vacancy is not the key point for R–P oxides to realize high ORR activity at high temperature. Instead, a high concentration and fast migration of the interstitial oxygen  and lattice oxygen with high activity are favourable for high-temperature catalytic activity. High-valence ion doping can enhance the
  concentration and the lattice oxygen activity.
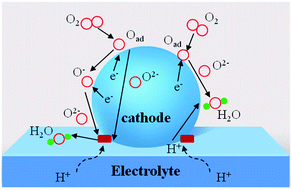 | ||
| Fig. 1 Schematic diagram of R–P cathode with different transportation routes (including e−, O2−, H+). | ||
Inspired by previous research on the R–P phase cathode, in this study we have developed a novel double-layered R–P structure Pr2BaNiMnO7−δ cathode material. Normally, the structural stability of ABO3 perovskite is related to the ionic radii of the A- and B-sites and the stability is usually evaluated by the Goldschmidt tolerance factor ‘t’ (eqn (1)).32–34 Consideration is given to the ionic radii of Ba2+ (12-coordination with oxygen, 1.61 Å) and Pr3+/Pr4+ (8-coordination, 1.126/0.96 Å) compared with Ni3+ (6-coordination with oxygen, high spin, 0.6 Å) and Ni2+ (6-coordination with oxygen, 0.69 Å). If the A-site is Pr3+/Pr4+, the ‘t’ value is about 0.80–0.86, which is lower than 1. If the A-site is changed to Ba2+, the ‘t’ value is very close to 1 and Ba2+ can easily form a 12-coordination structure with oxygen. In this case, the stability of the perovskite structure layer is significantly improved when the Pr3+/Pr4+ are partially replaced with Ba2+. In the B-site, the ionic radii and valence state of doped Mn3+/Mn4+ (6-coordination, 0.645/0.53 Å) is lower than that of Ni2+/Ni3+. The Mn substitution in the B-site lattice in the perovskite structure layer could cause some distortion to the BO6 octahedra. Further, the changed microelectronic structures of perovskite may improve the oxygen ion conduction.29 Hence, in the selected Pr3Ni2O7 system, the barium element is doped into the A-site for considerations of structural stability, and the aliovalent Mn (Mn3+/Mn4+) cation doping in the B-site is an effective strategy for modifying the catalytic activity. Pr2BaNiMnO7−δ (PrBaNiMn) was synthesized via a facile citric-acid–nitrate combustion process. The physicochemical and electrical properties of the powders and the anode-supporting single-cell NiO–BZCYYb/AFL/BZCYYb/PrBaNiMn were also investigated using corresponding techniques. Finally, the electrochemical performance in terms of the power output and the polarization impedance of the SOFC with the PrNaNiMn cathode was evaluated to demonstrate the feasibility of the materials as promising ORR catalysts for LT-SOFCs.
 | (1) |
2. Experimental
2.1. Material synthesis
BZCYYb and PrBaNiMn powders were synthesized via a citric acid–nitrate gel combustion method.35 For PrBaNiMn powder, Pr6O11, Ba(NO3)2, Ni(NO3)2·6H2O and Mn(NO3)2 at a stoichiometric ratio of 2![[thin space (1/6-em)]](https://www.rsc.org/images/entities/char_2009.gif) :
:![[thin space (1/6-em)]](https://www.rsc.org/images/entities/char_2009.gif) 1
1![[thin space (1/6-em)]](https://www.rsc.org/images/entities/char_2009.gif) :
:![[thin space (1/6-em)]](https://www.rsc.org/images/entities/char_2009.gif) 1
1![[thin space (1/6-em)]](https://www.rsc.org/images/entities/char_2009.gif) :
:![[thin space (1/6-em)]](https://www.rsc.org/images/entities/char_2009.gif) 1 were dissolved and well mixed, with citric acid as the chelating agent n(citric acid)/n(metals) = 1.5 in the raw material solution. Then, the solution was heated to evaporate under continuous stirring until it changed into a sol–gel and finally ignited into a flame. The electrolyte powder BZCYYb was synthesized using BaCO3, Zr(NO3)4·5H2O, Ce(NO3)3·6H2O, Y(NO3)3·6H2O, and Yb(NO3)3·6H2O. After combustion, the two as-prepared ash-like precursors were calcined at 1250 and 1000 °C for 5 h in air to obtain PrBaNiMn and BZCYYb powders, respectively.
1 were dissolved and well mixed, with citric acid as the chelating agent n(citric acid)/n(metals) = 1.5 in the raw material solution. Then, the solution was heated to evaporate under continuous stirring until it changed into a sol–gel and finally ignited into a flame. The electrolyte powder BZCYYb was synthesized using BaCO3, Zr(NO3)4·5H2O, Ce(NO3)3·6H2O, Y(NO3)3·6H2O, and Yb(NO3)3·6H2O. After combustion, the two as-prepared ash-like precursors were calcined at 1250 and 1000 °C for 5 h in air to obtain PrBaNiMn and BZCYYb powders, respectively.
2.2. Fabrication of anode-supported single cells
The anode substrate composite powder NiO–BZCYYb (65![[thin space (1/6-em)]](https://www.rsc.org/images/entities/char_2009.gif) :
:![[thin space (1/6-em)]](https://www.rsc.org/images/entities/char_2009.gif) 35 weight ratio) was also prepared by the one-step gel combustion process and calcined at 1000 °C for 5 h. The 80 wt% composite powder NiO–BZCYYb and pore-forming material (20 wt% starch) were well mixed to prepare a porous anode powder. The anode supported half cells (NiO–BZCYYb/AFL/BZCYYb) with a tri-layered structure were fabricated by a co-pressing method36 and then co-sintered at 1350 °C for 5 h at a 3 °C min−1 heating rate. The cathode paste was obtained by mixing the PrBaNiMn powder and a 10 wt% ethylcellulose–terpineol binder to get PrBaNiMn ink. Then, the ink was painted onto a dense BZCYYb electrolyte membrane surface with a 0.28 cm2 effective area and about 20 μm thickness, and sintered at 1100 °C for 3 h in air to get a porous cathode layer. Ag paste and wire were applied as a current collector and the conducting wire, respectively. Then, the button anode supported single cells were installed on an alumina supporting tube for further measurements. A scheme of the fabrication process for anode-supported single cells is shown in Fig. S1.†
35 weight ratio) was also prepared by the one-step gel combustion process and calcined at 1000 °C for 5 h. The 80 wt% composite powder NiO–BZCYYb and pore-forming material (20 wt% starch) were well mixed to prepare a porous anode powder. The anode supported half cells (NiO–BZCYYb/AFL/BZCYYb) with a tri-layered structure were fabricated by a co-pressing method36 and then co-sintered at 1350 °C for 5 h at a 3 °C min−1 heating rate. The cathode paste was obtained by mixing the PrBaNiMn powder and a 10 wt% ethylcellulose–terpineol binder to get PrBaNiMn ink. Then, the ink was painted onto a dense BZCYYb electrolyte membrane surface with a 0.28 cm2 effective area and about 20 μm thickness, and sintered at 1100 °C for 3 h in air to get a porous cathode layer. Ag paste and wire were applied as a current collector and the conducting wire, respectively. Then, the button anode supported single cells were installed on an alumina supporting tube for further measurements. A scheme of the fabrication process for anode-supported single cells is shown in Fig. S1.†
2.3. Characterization and electrochemical measurements
X-ray diffraction (XRD) analysis was performed to investigate the crystalline structure of the electrode and electrolyte powders using a SmartLab diffractometer with Cu Kα radiation. For the PrBaNiMn structural refinement, the test angular range was 10 to 135 degrees, and the step size and counting times were varied to ensure the required data quality and resolution. Diffraction data was analyzed using professional software and the peak shape was described by a pseudo-Voigt function, and the background level was inserted with linear interpolation. The chemical stability of PrBaNiMn and BZCYYb was investigated using a PrBaNiMn/BZCYYb mixture at a weight ratio 1![[thin space (1/6-em)]](https://www.rsc.org/images/entities/char_2009.gif) :
:![[thin space (1/6-em)]](https://www.rsc.org/images/entities/char_2009.gif) 1 calcined at 1000 °C for 5 h. Then, the mixture was studied to characterize the crystalline structure via XRD.
1 calcined at 1000 °C for 5 h. Then, the mixture was studied to characterize the crystalline structure via XRD.
The valence states and the composition of the elements on the PrBaNiMn surface were investigated using an X-ray photon spectroscopy (XPS, Thermo ESCALAB 250) method. The thermal expansion coefficient (TEC) of the PrBaNiMn sample was measured using a thermal expansion instrument (DIL402C). For this measurement, 2 g of PrBaNiMn powder were dry-pressed into a rectangular bar of dimensions 2.50 × 0.45 × 0.30 cm (length × width × height) after sintering at 1450 °C for 10 h in air. The performance of the button single fuel cells installed on an alumina supporting tube was measured at 400–700 °C with wet hydrogen (∼3% H2O) as fuel and stationary air as oxidant. The linear sweep voltammetry (LSV) and electrochemical impedance spectroscopy (EIS) characteristics of the cells were measured using an electrochemistry workstation (Solartron 1287 and 1260). The EIS measurements were carried out under open circuit conditions at 5 mV with AC amplitude 0.1–100 kHz. The cell ohmic and polarization resistances were clearly obtained from the EIS under open circuit conditions. The morphology, microstructure, and mapping of the tested single cell were examined using a scanning electron microscope (SEM, Hitachi, SU-70). The HRTEM and lattice fringes of the cathode material PrBaNiMn were measured by JEM-F200 at 200 kV accelerating voltage.
3. Results and discussion
3.1. Structural analysis
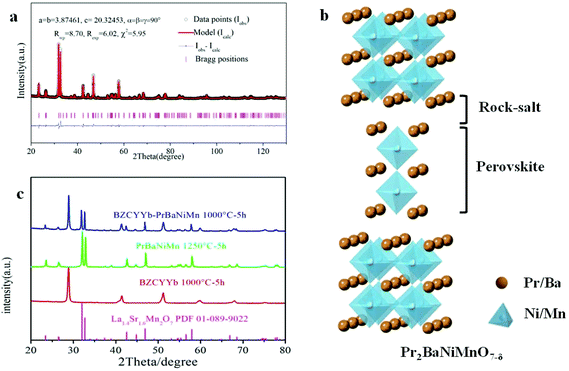
Fig. 2a shows the Rietveld refinement of the XRD pattern of the PrBaNiMn powder carried out using the FullProf program. It shows a tetragonal phase structure with I4/mmm symmetry, a = b = 3.8746(1) Å and c = 20.3245(3) Å. The reliability factors of the refinement are Rwp = 8.70, Rexp = 6.02 and χ2 = 5.95. The tetragonal phase structural obtained based on a Ruddlesden–Popper-type A3B2O7 model is in good agreement with the values of La1.4Sr1.6Mn2O7 on the JCPDS card (PDF#01-089-9022).37Fig. 2b shows the crystal structure of PrBaNiMn according to the Rietveld analysis result, which consists of alternating rock-salt (A2O2) layers and perovskite-like (BO6) layers along the c-axis. The Ni/Mn atoms located in the octahedron centers with corner-shared BO6 build the perovskite-like layers and are then connected with two A2O2 layers. The rock-salt A2O2 layers have abundant transporting pathways for interstitial oxygen along the (a–b) plane. And the perovskite-like sheets have rich oxygen vacancies and excellent electrical conductivity which are beneficial for the ORR and electron transportation. In this case, the obtained powder PrBaNiMn should be a good cathode material for SOFCs. In addition, the XRD patterns of the powder mixture of PrBaNiMn and BZCYYb (50
![[thin space (1/6-em)]](https://www.rsc.org/images/entities/char_2009.gif) :
:![[thin space (1/6-em)]](https://www.rsc.org/images/entities/char_2009.gif) 50 wt%) after annealing at 1000 °C for 5 h (Fig. 2c), with no detectable impurity peaks, suggests good chemical compatibility between the cathode and the electrolyte phases.
50 wt%) after annealing at 1000 °C for 5 h (Fig. 2c), with no detectable impurity peaks, suggests good chemical compatibility between the cathode and the electrolyte phases.
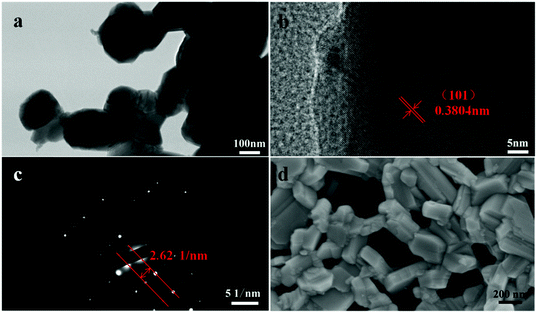
Fig. 3a displays a TEM image of PrBaNiMn powder with an average particle size of ∼300 nm. Corresponding energy dispersive X-ray spectroscopy (EDS) mapping images of PrBaNiMn for Pr, Ba, Ni, Mn and O elements exhibit a homogeneous distribution, and no observable elemental segregation could be detected (Fig. S2†). All this evidence suggests that PrBaNiMn double-layered R–P perovskite oxides have been successfully prepared without a secondary phase or elemental segregation, which is essential for the R–P structural cathodes to take part in an ORR in the fuel cell operating process. In addition, from the high-resolution TEM image (Fig. 3b and c) of the powder, the interplanar crystal spacing is calculated to be 3.804 Å, which corresponds to the (101) plane for the R–P structure (space group I4/mmm). The SEM image of the powder indicates the porous structure and good dispersibility of the prepared PrBaNiMn, which is beneficial for oxygen adsorption and transportation (Fig. 3d).
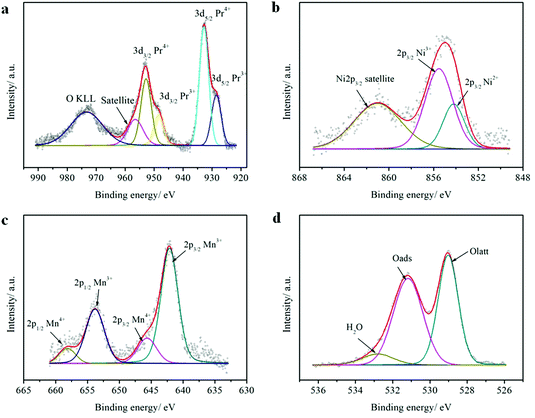
The elemental compositions and valence states of PrBaNiMn were investigated by XPS. Table 1 shows the elemental compositions (Pr, Ba, Ni, Mn, O), valence states and content of the elements with multiple valence states (Pr, Ni, Mn) which are calculated from the peak fitting by XPSPEAK4.1 software. The elemental compositions are close to the stoichiometric ratio of the designed material. In A-sites, the Pr 3d spectrum of PrBaNiMn (Fig. 4a) comprises four intense peaks at 928.5 (Pr3+ 3d5/2), 948.4 (Pr3+ 3d3/2), 932.8 (Pr4+ 3d5/2) and 952.8 (Pr4+ 3d3/2), respectively, with a splitting energy of about 20 eV between 3d5/2 and 3d3/2 core-levels, in agreement with the reported literature.38 The spectrum of the satellite located at 956.5 eV corresponds to Pr6O11 (Fig. 4a) which is associated with the multiple valence effect of the Pr and oxygen O KLL Auger peak at 971.5 eV.38–40 The tetravalent Pr atoms are the charge compensation for the Ba atoms with bivalence. For the B-site atoms Ni and Mn, both have two oxidation states: these are 854.2 eV (Ni2+ 2p3/2) and 855.5 eV (Ni3+ 2p3/2) for Ni atoms (Fig. 4b), and 642.1 eV (Mn3+ 2p3/2), 653.8 (Mn3+ 2p1/2), 645.6 eV (Mn4+ 2p3/2) and 658.2 eV (Mn4+ 2p1/2) for Mn atoms (Fig. 4c).41,42 The discrepancy between the Ni2+/Ni3+ and Mn3+/Mn4+ atomic ratios at the B-sites in the surface of the sample reflect the charge and structural adjustments. Under these conditions, the percentage of Oads (adsorbed oxygen) at 531.2 eV is higher than the Olatt (lattice oxygen) at 529.0 eV, which is beneficial for oxygen ion transportation and ORR at the surface of the samples (Fig. 4d). What is more, the rich Oads can increase the proton (H+/OH−) conduction, which can enhance the cathode activity.29 The 7.34% oxygen species at 532.8 eV for O 1s indicates the porous surface in the contaminants (hydroxyl/carbonyl groups).43 The Ba 3d5/2 peaks show that two chemical states are present (Fig. S3†). The lower binding energy (BE) peak at 778.2 eV can be related to PrBaNiMn while the higher BE peak at 779.8 eV is typical of BaCO3 as a result of the adsorption of CO2 by the sample in an ambient environment.44
| The sample PrBaNiMn surface elemental composition (at%) | ||||
|---|---|---|---|---|
| Pr 3d | Ba 3d | Ni 2p | Mn 2p | O 1s |
| 14.42 | 7.10 | 5.44 | 6.22 | 66.82 |
| Pr3+ | Pr4+ | Ni2+ | Ni3+ | Mn3+ | Mn4+ | Olatt | Oads | H2O |
|---|---|---|---|---|---|---|---|---|
| 30.59 | 69.41 | 30.09 | 69.91 | 81.12 | 18.88 | 44.11 | 48.55 | 7.34 |
Along the ab-plane in the R–P structure, the rock-salt A2O2 layers leave favorable transportation pathways for  and the electron transportation occurs predominantly along the perovskite-like layers. Because of the variable oxidation state in both the A- and B-site cations of the R–P structure, the O2− can transport via the 3D channels in the perovskite-like layers by the hopping mechanism and in the rock-salt layers by the
  migration mechanism. The formation of oxygen vacancies
  can be expressed by eqn (2)–(4). Although the perovskite-like layers do not allow for the existence of interstices, the O2− ions can diffuse via the BO6 octahedra with a corner-shared structure between perovskite-like layers and the rock-salt layers (shown in Fig. 2b). As mentioned above, the obtained PrBaNiMn should be a good cathode material in SOFC with nice ORR activity.
 | (2) |
 | (3) |
 | (4) |
These three redox couples accelerate the ORR reaction, which could be described in Kröger–Vink notation as follows:45,46
 | (5) |
It is generally accepted that the ORR at the cathode of H–SOFC could be described with the most plausible rate-limiting steps 1–4, as follows:
Step 1: O2 → 2Oad (dissociative adsorption).
Step 2: Oad + e− → Oad− (charge transfer).
Step 3: Oad− → OTPB− (surface diffusion, TPB, three-phase boundary).
Step 4: OTBP− + e− → OTPB2− (charge transfer at TPB).
The adsorbed Oad, Oad− and Oad2− could be incorporated into the PrBaNiMn phase, combining with the oxygen vacancies directly in the double-layered R–P structure cathode PrBaNiMn, which could be written as steps 5–7.
Furthermore, the OTPB2− at the TPB of PrBaNiMn–BZCYYb-gas could be injected into the PrBaNiMn phase (step 8) and react with HTPB+ conducted from the electrolyte (steps 9–12).
Step 9: Helectrolyte+ → HTPB+.
Step 10: OTPB2− + HTPB+ → OHTPB−.
Step 11: OHTPB− + HTPB+ → H2OTPB.
Step 12: H2OTPB → H2O(g).
3.2. Microstructures of the fuel cell
As shown in Fig. 5, the cross sectional images of the single cell have four apparent layers (PrBaNiMn cathode, BZCYYb electrolyte, AFL and anode support) and no layers show any sign of delamination or cracking after a long-term test for 100 hours, suggesting that the four-layered cell structure is able to retain chemical and thermal stability with no thermal mismatch occurring during the thermal cycles. The cathode PrBaNiMn undergoes no reaction with the electrolyte BZCYYb after long-term operation according to the EDS mapping shown in Fig. S4,† which further verifies the chemical compatibility of the cathode material with the electrolyte after the XRD results in Fig. 1c. The thicknesses of the electrolyte and AFL are around 12 and 15 μm (Fig. 5a), respectively. Under SOFC working conditions, the dense BZCYYb electrolyte can prevent gas leakage, allow the efficient transportation of protons and retain a stable open-circuit voltage (Fig. 5d). Moreover, the uniform nano particles (∼300 nm) with a continuous porous structure of the PrBaNiMn cathode accelerate gas diffusion and electrochemical reactions (Fig. 5b and c). Apart from the cathode, the firm adhered anode.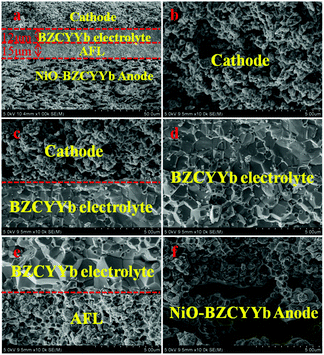 | ||
| Fig. 5 Cross-sectional SEM images of the single cell. (a) The four-layer single cell with an anode functional layer (AFL) and PrBaNiMn cathode after testing; (b) PrBaNiMn cathode layer; (c) the cathode/BZCYYb; (d) BZCYYb electrolyte; (e) AFL/BZCYYb; (f) the porous anode NiO–BZCYYb and anode functional layer (AFL) AFL provides abundant triple-phase boundaries (TPBs) with the electrolyte allowing fast dissociation of the fuel gas and the rapid occurrence of charge transfer after the reduction of NiO (Fig. 5e). The larger pores in the anode support obtained from the pore-forming materials offer rapid diffusion of fuel gas to the AFL layer and then to the TPBs (Fig. 5f). The pore size distribution of the anode support plates is measured by the mercury porosimeter method described in theESI.†47 As shown in Fig. S5 and S6,† the cumulative intrusion of mercury has three stages as the pressure increases and the corresponding pore size distributions are about 100–200 μm, 1–0.4 μm and 50–250 nm. The rational distributions of pore sizes for the anode support accelerate the fuel gas diffusion, transmission and reaction. On the basis of the superior single-cell components and microstructures, infusive electrochemical performance in an intermediate temperature range should be achieved when a PrBaNiMn cathode is applied to BZCYYb-based solid-oxide fuel cells. | ||
3.3. Electrochemical performance of the single cells
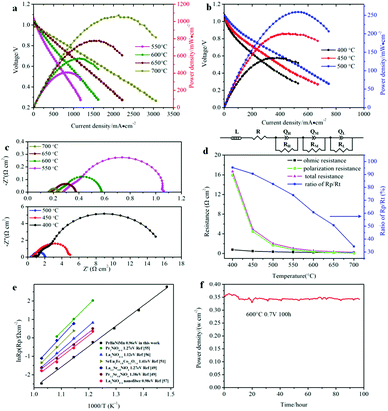
The button single-cell NiO–BZCYYb/AFL/BZCYYb/PrBaNiMn was assembled and then measured under conventional conditions (3% H2O hydrogen as the fuel gas and static air as the oxidant) to assess the cathode performance of H–SOFC at 400–700 °C. Fig. 6a and b show the typical V–I and P–I curves of the single cell obtained at 400–700 °C. The open circuit voltage (OCV) of the cell using the PrBaNiMn cathode were found to be 1.091, 1.079, 1.068, 1.059, 1.047, 1.017 and 1.002 V at 400, 450, 500, 550, 600, 650 and 700 °C, respectively. And the corresponding peak power densities (PPDs) were 135, 201, 259, 407, 570, 776 and 1070 mW cm−2 from 400 to 700 °C with 50 °C intervals (Table S1†). The close-to-theoretical OCV values indicated that the BZCYYb electrolyte layer is dense enough to prevent gas leakage with no leakage current. Meanwhile, the single cell with a PrBaNiMn cathode shows the highest PPD among the R–P structured single-phase cathode materials reported in the literature under similar testing conditions, as shown in Table 2. Fig. 6c shows the typical electrochemical impedance spectra (EIS) plots of the single cell with a PrBaNiMn cathode at 400–700 °C. The high-frequency intercept and low-frequency intercept correspond to the ohmic resistance (RO) and the total resistance (RT) of the cell, respectively. The low-frequency intercepts for 400 °C and 450 °C EIS are obtained from the simulated plots (Fig. S7†) according to the equivalent circuits using the model LR(RHQH)(RMQM)(RLQL) presented as an inset in Fig. 6d. In the equivalent circuit curves, the ohmic contribution and the inductive process are considered by the introduction of a resistance (R) and an inductance (L) in series with three RQ elements corresponding to the electrode processes involved (R and Q are the resistance and the constant phase element, respectively). And the difference between the two intercepts represents the interfacial polarization resistance (RP). All resistances containing RO, RP, RT and the ratios of RP/RT are shown in Fig. 6d and Table S1.† It is clear from the relationship between impedance and temperature that the electrochemical reaction processes are thermally activated. The RP of the PrBaNiMn cathode cell decreases from 15.915 to 0.084 Ω cm2 along with the RO alone from 0.759 to 0.162 Ω cm2 at temperatures from 400 °C to 700 °C. The RP values are 0.084, 0.191, 0.350, 0.785, 1.675, 4.473 and 15.915 Ω cm,2 and the corresponding RO values are 0.162, 0.185, 0.227, 0.275, 0.354, 0.468 and 0.759 Ω cm2 at 700, 650, 600, 550, 500, 450 and 400 °C, respectively. In addition, the ratios of RP/RT are 34.24%, 50.72%, 60.69%, 74.03%, 82.57%, 90.54% and 95.45% when the temperature decreases from 700 to 400 °C. And RP obviously plays a predominant role in determining the total resistance and the performance of the single cell, especially at low temperatures, which is also similar to the reported literature.48 Therefore, under these circumstances, more attention should be paid to an exploration of electrode materials with lower RP and high activity at low temperatures.| Year | Cathode | Electrolyte (thickness, μm) | 700 | 650 | 600 | 550 | 500 | 450 | 400 | Ref. |
|---|---|---|---|---|---|---|---|---|---|---|
| 2009 | Pr2NiO4+δ | BaCe0.9Y0.1O3−δ (40) | 132 | 96 | 53 | 55 | ||||
| 2014 | La2NiO4+δ | BaZr0.1Ce0.7Y0.2O3−δ (20) | 398 | 283 | 196 | 120 | 56 | |||
| 2017 | La3Ni1.6Co0.4O7−δ | BaZr0.3Ce0.5Y0.2O3−δ (20) | 398 | 293 | 215 | 50 | ||||
| 2018 | SrEu2Fe1.8Co0.2O7−δ | BaZr0.1Ce0.7Y0.2O3−δ (15) | 562 | 365 | 210 | 51 | ||||
| 2018 | La1.2Sr0.8NiO4 | BaZr0.1Ce0.7Y0.2O3−δ (30) | 461 | 330 | 223 | 49 | ||||
| 2018 | Pr1.2Sr0.8NiO4 | BaZr0.1Ce0.7Y0.2O3−δ (30) | 352 | 212 | 127 | 49 | ||||
| 2019 | La2NiO4+δ nanofiber | BaZr0.1Ce0.7Y0.2O3−δ (15) | 508 | 349 | 246 | 175 | 57 | |||
| 2019 | La1.2Sr0.8Ni0.6Fe0.4O4+δ | BaZr0.1Ce0.7Y0.2O3−δ (15) | 782 | 658 | 421 | 257 | 139 | 58 | ||
| This work | PrBaNiMn | BaZr0.1Ce0.7Y0.1Yb0.1O3−δ (12) | 1070 | 776 | 570 | 407 | 259 | 245 | 135 |
In detail, the activation energy Ea of the assembled single cell in this work was calculated with the Arrhenius equation and compared with various R–P single-phase cathodes for BaCeO3-based proton electrolytes under the same conditions (hydrogen with about 3% H2O as fuel gas).
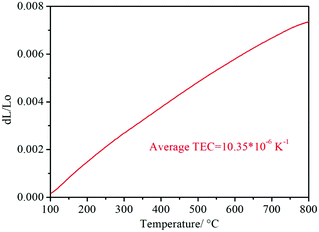
As shown in Fig. 6e, the Ea of the RP of the PrBaNiMn cathode is lower than that in the reported literature, corresponding to the value of 0.96 eV, being comparable with the singe-phase cathode with a one-layer R–P structure La1.2Sr0.8NiO4+δ and Pr1.2Sr0.8NiO4+δ with Ea values of 1.27 and 1.38 eV, respectively.49 In addition, the PrBaNiMn cathode also has a relatively lower Ea than double-layered R–P structure cathode materials, such as La3Ni1.6Co0.4O7−δ or SrEu2Fe1.8Co0.2O7−δ.50,51 Although the La2NiO4+δ nano-fiber presents relatively lower Ea at 0.98 eV, which is also little higher than the PrBaNiMn cathode in this study. Hence, it is clear that PrBaNiMn is a novel single-phase cathode material for H–SOFC combined with the compatibility analysis by XRD and EDS mapping mentioned above. And the thermal expansion coefficient (TEC) of the prepared PrBaNiMn is 10.35 × 10⁻⁶ K−1 (Fig. 7), which is close to that of the BaCeO3-based electrolyte.52 In this case, it possesses better compatibility with the electrolyte than conventional perovskite materials. From the XPS study, the variable valence of the cations in the R–P structure can accelerate the oxygen transfer ability and oxygen reduction reaction catalytic activity. The lower Ea of the PrBaNiMn cathode can mitigate the performance degradation of the cell with a reduction in operation temperature. As expected, the performance of the PrBaNiMn cathode may be improved further when it is prepared by special synthesis methods or the particle size is decreased by reducing the roasting temperature with the guarantee of a single R–P phase structure. The molten salt,53 electrostatic spinning7 and microwave sintering54 methods may provide a new approach to improve the properties of the cathode further. In the stability test, the single cell with the PrBaNiMn cathode remains stable for 100 hours with no degradation and a power output of around 350 mW cm−2 under a cell voltage of 0.7 V at 600 °C (Fig. 6f). This demonstrates that the PrBaNiMn cathode possesses fine chemical stability and compatibility with the electrolyte layer against water vapor and CO2 under working condition. Combined with the higher peak power density and lower RP compared with other reported cathodes under similar testing conditions, PrBaNiMn could be an outstanding alternative cathode material for proton-conducting SOFCs (H–SOFCs).
4. Conclusions
A novel double-layered R–P oxide of Pr2BaNiMnO7−δ was developed as an efficient cathode electrocatalyst for low-temperature H–SOFCs. Polycrystalline PrBaNiMn constitutes two members of a homologous series, the essential feature of which is the existence of two connected Ni/Mn octahedral layers with a perovskite-like structure, linked by a PrO/BaO rock-salt-like layer. Random distributions of 3d-metals, variable valence of the cation and oxygen vacancies in the perovskite blocks and interstitial oxygen in the rock-salt layers are directly associated with high ionic transformation and ORR activity. Moreover, the tetragonal PrBaNiMn with I4/mmm space group symmetry has excellent chemical compatibility and similar TEC to the BaCeO3-based electrolyte. The electrochemical study shows that the peak power density of the anode supported single cell with PrBaNiMn is 1070 mW cm−2 at 700 °C, with stable performance at 600 °C under 0.7 V without any degradation after 100 hours. Even at 500 and 400 °C, the peak power density of the cell reached 259 and 135 mW cm−2, respectively. The area-specific polarization resistance of this cell is 0.084 Ω cm2 at 700 °C under OCV conditions. Interestingly, the activation energy (Ea) for the polarization resistance of the assembled single cell is lower than that reported in the literature, corresponding to a value of 0.96 eV. The excellent performance is higher than those of state-of-the-art R–P structure materials used as cathodes in LT-SOFCs. Thus, the double-layered Ruddlesden–Popper perovskite oxide Pr2BaNiMnO7−δ is a preeminent highly active low-temperature cathode material.Conflicts of interest
There are no conflicts to declare.Acknowledgements
This work is financially supported by the National Natural Science Foundation of China (21975163 & 51802200), the China Postdoctoral Science Foundation (Grant No. 2018M643172) and the National Science Foundation of Guangdong Province of China (No. 2018A030310421). We also acknowledge the Instrumental Analysis Center of Shenzhen University (Xili Campus) and Principal Yu Zhang for his help with the TEM measurements.Notes and references
- L. Fan, B. Zhu, P.-C. Su and C. He, Nano Energy, 2018, 45, 148–176 CrossRef CAS
.
- A. M. Abdalla, S. Hossain, A. T. Azad, P. M. I. Petra, F. Begum, S. G. Eriksson and A. K. Azad, Renewable Sustainable Energy Rev., 2018, 82, 353–368 CrossRef CAS
.
- C. Zuo, S. Zha, M. Liu, M. Hatano and M. Uchiyama, Adv. Mater., 2006, 18, 3318–3320 CrossRef CAS
.
- C. Duan, R. J. Kee, H. Zhu, C. Karakaya, Y. Chen, S. Ricote, A. Jarry, E. J. Crumlin, D. Hook, R. Braun, N. P. Sullivan and R. O'Hayre, Nature, 2018, 557, 217–222 CrossRef CAS PubMed
.
- S. Choi, C. J. Kucharczyk, Y. Liang, X. Zhang, I. Takeuchi, H.-I. Ji and S. M. Haile, Nat. Energy, 2018, 3, 202–210 CrossRef CAS
.
- Y. Chen, B. deGlee, Y. Tang, Z. Wang, B. Zhao, Y. Wei, L. Zhang, S. Yoo, K. Pei, J. H. Kim, Y. Ding, P. Hu, F. F. Tao and M. Liu, Nat. Energy, 2018, 3, 1042–1050 CrossRef CAS
.
- J. G. Lee, J. H. Park and Y. G. Shul, Nat. Commun., 2014, 5, 4045 CrossRef CAS PubMed
.
- Y. Zhu, W. Zhou, R. Ran, Y. Chen, Z. Shao and M. Liu, Nano Lett., 2016, 16, 512–518 CrossRef CAS PubMed
.
- A. Chroneos, B. Yildiz, A. Tarancón, D. Parfitt and J. A. Kilner, Energy Environ. Sci., 2011, 4, 2774 RSC
.
- D. Ding, M. Liu, Z. Liu, X. Li, K. Blinn, X. Zhu and M. Liu, Adv. Energy Mater., 2013, 3, 1149–1154 CrossRef CAS
.
- K. Boulahya, D. Muñoz-Gil, A. Gómez-Herrero, M. T. Azcondo and U. Amador, J. Mater. Chem. A, 2019, 7, 5601–5611 RSC
.
- Z. Wang, W. Yang, S. P. Shafi, L. Bi, Z. Wang, R. Peng, C. Xia, W. Liu and Y. Lu, J. Mater. Chem. A, 2015, 3, 8405–8412 RSC
.
- A. Aguadero, L. Fawcett, S. Taub, R. Woolley, K.-T. Wu, N. Xu, J. A. Kilner and S. J. Skinner, J. Mater. Sci., 2012, 47, 3925–3948 CrossRef CAS
.
- A. Jun, J. Kim, J. Shin and G. Kim, ChemElectroChem, 2016, 3, 511–530 CrossRef CAS
.
- H. Téllez, J. Druce, Y.-W. Ju, J. Kilner and T. Ishihara, Int. J. Hydrogen Energy, 2014, 39, 20856–20863 CrossRef
.
- S. Chaianansutcharit, K. Hosoi, J. Hyodo, Y. W. Ju and T. Ishihara, J. Mater. Chem. A, 2015, 3, 12357–12366 RSC
.
- R. J. Woolley, B. N. Illy, M. P. Ryan and S. J. Skinner, J. Mater. Chem., 2011, 21, 18592 RSC
.
- J. Wu, S. S. Pramana, S. J. Skinner, J. A. Kilner and A. P. Horsfield, J. Mater. Chem. A, 2015, 3, 23760–23767 RSC
.
- V. Vibhu, M. R. Suchomel, N. Penin, F. Weill, J. C. Grenier, J. M. Bassat and A. Rougier, Dalton Trans., 2018, 48, 266–277 RSC
.
- E. Pikalova, A. Kolchugin, N. Bogdanovich, D. Medvedev, J. Lyagaeva, L. Vedmid, M. Ananyev, S. Plaksin and A. Farlenkov, Int. J. Hydrogen Energy, 2018 DOI:10.1016/ j.ijhydene.2018.06.023
.
- J. Yang, J. Cheng, Q. Jiang, Y. Wang, R. Wang and J. Gao, Int. J. Hydrogen Energy, 2012, 37, 1746–1751 CrossRef CAS
.
- W. Li, B. Guan, L. Ma, S. Hu, N. Zhang and X. Liu, J. Mater. Chem. A, 2018, 6, 18057–18066 RSC
.
- R. K. Sharma, S.-K. Cheah, M. Burriel, L. Dessemond, J.-M. Bassat and E. Djurado, J. Mater. Chem. A, 2017, 5, 1120–1132 RSC
.
- R. J. Woolley and S. J. Skinner, J. Power Sources, 2013, 243, 790–795 CrossRef CAS
.
- S. S. Bhoga, A. P. Khandale and B. S. Pahune, Solid State Ionics, 2014, 262, 340–344 CrossRef CAS
.
- G. Yang, C. Su, R. Ran, M. O. Tade and Z. Shao, Energy Fuels, 2013, 28, 356–362 CrossRef
.
- E. Boehm, J. Bassat, P. Dordor, F. Mauvy, J. Grenier and P. Stevens, Solid State Ionics, 2005, 176, 2717–2725 CrossRef CAS
.
- J.-M. Bassat, M. Burriel, O. Wahyudi, R. Castaing, M. Ceretti, P. Veber, I. Weill, A. Villesuzanne, J.-C. Grenier, W. Paulus and J. A. Kilner, J. Phys. Chem. C, 2013, 117, 26466–26472 CrossRef CAS
.
- L. Zhang, F. Yao, J. Meng, W. Zhang, H. Wang, X. Liu, J. Meng and H. Zhang, J. Mater. Chem. A, 2019, 7, 18558–18567 RSC
.
- J. Hou, L. Miao, J. Hui, L. Bi, W. Liu and J. T. S. Irvine, J. Mater. Chem. A, 2018, 6, 10411–10420 RSC
.
- Y. Huan, S. Chen, R. Zeng, T. Wei, D. Dong, X. Hu and Y. Huang, Adv. Energy Mater., 2019, 9, 1901573 CrossRef
.
- V. M. Goldschmidt, Naturwissenschaften, 1926, 14, 477–485 CrossRef CAS
.
- J. Vieten, B. Bulfin, P. Huck, M. Horton, D. Guban, L. Zhu, Y. Lu, K. A. Persson, M. Roeb and C. Sattler, Energy Environ. Sci., 2019, 12, 1369–1384 RSC
.
- X. Chen, J. Xu, Y. Xu, F. Luo and Y. Du, Inorg. Chem. Front., 2019, 6, 2226–2238 RSC
.
- W. Wang, G. McCool, N. Kapur, G. Yuan, B. Shan, M. Nguyen, U. M. Graham, B. H. Davis, G. Jacobs, K. Cho and X. Hao, Science, 2012, 337, 832–835 CrossRef CAS PubMed
.
- W. Sun, L. Yan, Z. Shi, Z. Zhu and W. Liu, J. Power Sources, 2010, 195, 4727–4730 CrossRef CAS
.
- T. Sivakumar and J. B. Wiley, Mater. Res. Bull., 2009, 44, 74–77 CrossRef CAS
.
- A. A. Yaremchenko, S. G. Patrício and J. R. Frade, J. Power Sources, 2014, 245, 557–569 CrossRef CAS
.
- J. Gurgul, M. T. Rinke, I. Schellenberg and R. Pöttgen, Solid State Sci., 2013, 17, 122–127 CrossRef CAS
.
- E. Y. Konysheva and M. V. Kuznetsov, RSC Adv., 2013, 3, 14114 RSC
.
- R. M. García de la Cruz, H. Falcón, M. A. Peña and J. L. G. Fierro, Appl. Catal., B, 2001, 33, 45–55 CrossRef
.
- C. Zhang, C. Wang, W. Zhan, Y. Guo, Y. Guo, G. Lu, A. Baylet and A. Giroir-Fendler, Appl. Catal., B, 2013, 129, 509–516 CrossRef CAS
.
- L. Wang, C. Wang, H. Xie, W. Zhan, Y. Guo and Y. Guo, Catal. Today, 2019, 327, 190–195 CrossRef CAS
.
- M. Viviani, M. T. Buscaglia, P. Nanni, R. Parodi, G. Gemme and A. Dacca, J. Eur. Ceram. Soc., 1999, 19, 1047–1051 CrossRef CAS
.
- F. He, T. Wu, R. Peng and C. Xia, J. Power Sources, 2009, 194, 263–268 CrossRef CAS
.
- R. Peng, T. Wu, W. Liu, X. Liu and G. Meng, J. Mater. Chem., 2010, 20, 6218 RSC
.
- K. Liu, M. Ostadhassan, L. Sun, J. Zou, Y. Yuan, T. Gentzis, Y. Zhang, H. Carvajal-Ortiz and R. Rezaee, Fuel, 2019, 245, 274–285 CrossRef CAS
.
- M. Liu, M. E. Lynch, K. Blinn, F. M. Alamgir and Y. Choi, Mater. Today, 2011, 14, 534–546 CrossRef CAS
.
- S. Yang, Y. Wen, J. Zhang, Y. Lu, X. Ye and Z. Wen, Electrochim. Acta, 2018, 267, 269–277 CrossRef CAS
.
- Z. Chen, J. Wang, D. Huan, S. Sun, G. Wang, Z. Fu, W. Zhang, X. Zheng, H. Pan, R. Peng and Y. Lu, J. Power Sources, 2017, 371, 41–47 CrossRef CAS
.
- D. Huan, N. Shi, L. Zhang, W. Tan, Y. Xie, W. Wang, C. Xia, R. Peng and Y. Lu, ACS Appl. Mater. Interfaces, 2018, 10, 1761–1770 CrossRef CAS PubMed
.
- J. F. Shin, W. Xu, M. Zanella, K. Dawson, S. N. Savvin, J. B. Claridge and M. J. Rosseinsky, Nat. Energy, 2017, 2, 16214 CrossRef CAS
.
- Y. Tian, D. Chen and X. Jiao, Chem. Mater., 2006, 18, 6088–6090 CrossRef CAS
.
- Z. Jiao, N. Shikazono and N. Kasagi, J. Power Sources, 2011, 196, 5490–5493 CrossRef CAS
.
- G. Taillades, J. Dailly, M. Taillades-Jacquin, F. Mauvy, A. Essouhmi, M. Marrony, C. Lalanne, S. Fourcade, D. J. Jones, J. C. Grenier and J. Rozière, Fuel Cells, 2010, 10, 166–173 CAS
.
- J. Hou, Z. Zhu, J. Qian and W. Liu, J. Power Sources, 2014, 264, 67–75 CrossRef CAS
.
- S. S. Hashim, F. Liang, W. Zhou and J. Sunarso, ChemElectroChem, 2019, 6, 3549–3569 CrossRef CAS
.
- L. Miao, J. Hou, Z. Gong, Z. Jin and W. Liu, Int. J. Hydrogen Energy, 2019, 44, 7531–7537 CrossRef CAS
.
Footnote |
| † Electronic supplementary information (ESI) available. See DOI: 10.1039/c9ta11212j |
| This journal is © The Royal Society of Chemistry 2020 |

