 Open Access Article
Creative Commons Attribution 3.0 Unported Licence
Rock ‘n’ use of CO2: carbon footprint of carbon capture and utilization by mineralization†
Hesam
Ostovari
 a,
André
Sternberg‡
 a and
André
Bardow
 *ab
*ab
aInstitute of Technical Thermodynamics, RWTH Aachen University, Aachen, Germany. E-mail: andre.bardow@ltt.rwth-aachen.de
bInstitute of Energy and Climate Research, Energy Systems Engineering (IEK-10), Forschungszentrum Jülich GmbH, Jülich, Germany
First published on 30th April 2020
Abstract
A recent approach to reduce the carbon footprint of industries with process-inherent CO2 emissions is CO2 mineralization. Mineralization stores CO2 by converting it into a thermodynamically stable solid. Beyond storing CO2, the products of CO2 mineralization can potentially substitute conventional products in several industries. Substituting conventional production increases both the economic and the environmental potential of carbon capture and utilization (CCU) by mineralization. The promising potential of CO2 mineralization is, however, challenged by the high energy demand required to overcome the slow reaction kinetics. To provide a sound assessment of the climate impacts of CCU by mineralization, we determine the carbon footprint of CCU by mineralization based on life cycle assessment. For this purpose, we analyze 7 pathways proposed in literature: 5 direct and 2 indirect mineralization pathways, considering serpentine, olivine, and steel slag as feedstock. The mineralization products are employed to partially substitute cement in blended cement. Our results show that all considered CCU technologies for mineralization could reduce climate impacts over the entire life cycle based on the current state-of-the-art and today's energy mix. Reductions range from 0.44 to 1.17 ton CO2e per ton CO2 stored. To estimate an upper bound on the potential of CCU by mineralization, we consider an ideal-mineralization scenario that neglects all process inefficiencies and utilizes the entire product. For this ideal mineralization, mineralization of 1 ton CO2 could even avoid up to 3.2 times more greenhouse gas emissions than only storing CO2. For all mineralization pathways, the carbon footprint is mainly reduced due to the permanent storage of CO2 and the credit for substituting conventional products. Thus, developing suitable products is critical to realize the potential benefits in practice. Then, carbon capture and utilization by mineralization could provide a promising route for climate change mitigation.
1. Introduction
Global anthropogenic greenhouse gas (GHG) emissions need to become zero and even negative in order to contain the negative impacts of climate change.1,2 A key technology to reduce greenhouse gas emissions is renewable energy. Renewable energy avoids GHG emissions by substituting fossil energy. However, energy substitution is not sufficient for industries with process-inherent CO2 emissions such as the cement and steel industry. The cement industry contributes 7% to the global GHG emissions with 2.2 Gt CO2e per year in 2014.3E.g., China's GHG emissions from cement production (approximately 1 Gt CO2e per year) are higher than the total GHG emissions from Germany (0.87 Gt CO2e per year in 2018).4,5 The IEA thus requires that the cement industry should cumulatively reduce GHG emissions by 7.7 Gt CO2e by 2060 to achieve the 2 °C goal, despite increase in global cement production.3 After the cement industry, the steel industry is the second largest industrial contributor to global GHG emissions with 5% and 2.1 Gt CO2e per year in 2017. For the steel industry, the IEA recommends 10 Gt CO2e cumulative emission reductions by 2060.6Currently, the only technology to reduce process-inherent CO2 emissions is carbon capture and storage (CCS).7 A variety of technologies are available for both CO2 capture and storage. To store the captured carbon dioxide, two approaches are currently discussed: geological storage and mineralization.8,9 For geological storage, the captured CO2 is compressed and pumped underground. Several storage projects are currently running to demonstrate and develop the required technologies for storage itself but also for the monitoring, safety, and social acceptance.10,11
In carbon capture and storage by mineralization, CO2 is stored by conversion into a thermodynamically stable solid. For this purpose, CO2 reacts with metal-oxide-bearing materials MO such as magnesium oxide or calcium oxide to produce carbonates MCO3, which are stable for geological timeframes (over millions of years):
| MO + CO2 → MCO3 + heat12 | (1) |
The mineralization reaction (1) is thermodynamically favorable (exergonic) and already occurs in nature. However, the mineralization reaction is challenging due to its slow reaction kinetics. To overcome the slow reaction kinetics, high reaction pressures and temperatures have been recommended13 as well as mechanical and thermal pretreatment of feedstock14–16 and a variety of reaction additives.17
While mineralization has already been intensively discussed for carbon capture and storage,9 more recently, the potential utilization of the mineralization products has been gaining attention.18 This shift leads to a new approach: carbon capture and utilization (CCU) by mineralization. CCU by mineralization retains the benefits of CCS by mineralization but additionally yields value-added products. Value-added products increase the economic potential of CCU by mineralization through additional revenues and increase the environmental benefits of CCU by mineralization through the substitution of conventional production.
The promising potential of mineralization is challenged by the energy required to overcome the slow reaction kinetics. Thus, most available mineralization studies discuss energy consumption.13,14,19–27 However, to confirm the environmental benefits of CCU by mineralization, a comprehensive and systematic assessment of environmental impacts is required. Life Cycle Assessment (LCA) is a systematic method to assess the environmental impacts of processes by taking into account the entire life cycle of the product from raw material extraction until the final waste disposal.28 Thereby, LCA avoids problem shifting between life-cycle stages or between environmental impacts.28
For carbon capture and storage, a number of LCA studies have already been performed for CO2 mineralization. Giannoulakis et al.29 performed a LCA study for a power plant and showed that the implementation of CCS by mineralization could reduce life cycle GHG emissions by 15–64% but would increase the levelized cost of electricity by 90–370% compared to a reference power plant without CCS. Xiao et al.30 studied the mineralization of steel slag via several pathways and showed that key factors effecting the overall process are the particle size of alkaline solid waste, the rotating speed of the rotary packed bed, the solid/liquid ratio, and the reaction temperature. In another LCA study, Julcour et al.31 investigated the effect of mechanical exfoliation on mineralization to reduce emissions from a power plant. A reduction of the overall GHG emissions was reached but the additional energy consumption required for the process increased other environmental impacts. Ncongwane et al.32 compared the potential of six mineralization processes with pyroxene minerals (platinum group metal tailings) as feedstock to reduce GHG emissions and showed that all processes cause more GHG emissions than they avoid. The study concluded that environmentally beneficial mineralization processes require higher reaction conversions and lower energy demand. Khoo et al.33 simulated a dry mineralization pathway and performed a preliminary life cycle assessment. The authors showed that the mineralization pathway can avoid GHG emission; however, confirmation of the results requires experimental studies that have been hindered “due to various engineering limitations”. In another study, Khoo et al.34 applied LCA to investigate mineralization for land reclamation in Singapore and demonstrate that mineralization has the potential to reduce GHG emissions. To further increase benefits from mineralization, process energy demand should be reduced. Nduagu et al.35 compared two mineralization pathways to reduce emissions from a power plant and showed that mineralization of 1 ton CO2 from coal power plant could avoid between 317–483 kg CO2e. Cuéllar-Franca et al.36 analyzed the results of Khoo et al.33,34 and Nduagu et al.35 in their review of LCA studies and concluded that the GHG emission reduction of mineralization is sensitive to CO2 capture, allocation methods and assumptions for heat recovery. Cuéllar-Franca et al.36 also point to the potential utilization of mineralization products but the impacts associated with utilization were not considered in the LCA yet.
As mentioned above, recently, the perspective is changing from mineralization for CO2 storage to CO2 utilization for value-added products. In a LCA study, Kelly et al.37 evaluated a brine mineralization plant including utilization of mineralization products such as sodium bicarbonate but concluded that this caustic pathway needs to overcome several challenges such as the energy demand of sodium hydroxide production and the generation of potentially hazardous wastes in form of chlorine or hydrogen chloride. Oh et al.38 investigated the combination of a caustic mineralization with brackish water desalination. The brackish water desalination rejects sodium ions that react with CO2 in caustic mineralization to produce sodium bicarbonate. The authors performed a ‘cradle-to-gate’ LCA and concluded that the suggested process is not competitive against carbon capture and geological storage when coal-based electricity is used. Kirchofer et al.39 investigated environmental impacts of alkalinity sources on the life cycle energy efficiency of mineralization pathways including the utilization of mineralization products as aggregate for concrete production. The results showed that reaction yield, heating, mixing, and grinding are environmental hot-spots, and for a better comparison, detailed simulation of processes is necessary. Pan et al.40 investigated the engineering, environmental, and economic performance of a rotary packed-bed reactor for mineralization of steel slag. The mineralization product is used in the cement industry. These authors showed that the environmental impacts can be substantially reduced by up to 1279 kg CO2e per ton steel slag. Ghasemi et al.41 performed a LCA study of slurry and wet mineralization pathways of basic oxygen furnace slag. The mineralization product is used as building material. These authors concluded that both pathways are capable of storing CO2 and reducing GHG emissions. In a recent LCA study, Di Maria et al.42 compared the environmental impacts of construction blocks from carbonated steel slag with block based on Portland cement. The study showed that the blocks from carbonated steel slag can potentially reduce GHG emission in comparison to blocks based on Portland cement. However, the market for steel slag is limited and other sources for production of carbonated construction blocks should be investigated.
The mentioned LCA studies yield important insights on the specific processes studied. However, the studies are difficult to compare and lead to inconsistent conclusions due to different assumptions, system boundaries, and life cycle stages in the LCA analysis.
In this work, we present a method for consistent life cycle assessment of carbon capture and utilization by mineralization (Section 2). The life cycle assessment method is then employed for the 7 main pathways for CCU by mineralization currently discussed in literature, described in Section 3, to calculate their carbon footprint (Section 4). In a state-of-the-art scenario, we illustrate the current status of CCU by mineralization to reduce carbon footprint (Section 4.2). An ideal-mineralization scenario is studied upper bound for the potential reductions by CCU by mineralization (Section 4.3). From this analysis, we identify hot-spots for further investigations (Section 4.4).
Our results show that state-of-the-art CCU by mineralization could reduce carbon footprint by up to 1.17 ton CO2e per ton CO2 stored based on current technologies. For an ideal-mineralization scenario, carbon footprint could even be reduced by up to 3.2 ton CO2e per ton CO2 stored. Thus, CCU by mineralization could reduce carbon footprint by more than 1 ton CO2e per ton CO2 stored and could thus reduce the carbon footprint more than CCS. The increased benefits are due to the fact that CCU by mineralization both stores CO2 and substitutes conventional products.
2. LCA method
Life cycle assessment is a well-established method to analyze the environmental impacts of products and processes.28 LCA is standardized in ISO 14040/14044.43,44 The ISO standard divides LCA into 4 phases: (1) goal & scope definition; (2) life cycle inventory (LCI) analysis; (3) life cycle impact assessment; (4) interpretation. In the following, we specify the 4 LCA phases and derive our LCA method for carbon capture and utilization by mineralization.2.1. Goal & scope definition
The first phase of LCA states the goal (reason) and the scope (conditions and assumptions) of the study.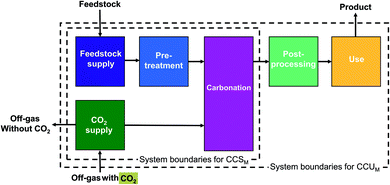 | ||
| Fig. 1 System boundaries of carbon capture and utilization by mineralization (CCUM) and carbon capture and storage by mineralization (CCSM). | ||
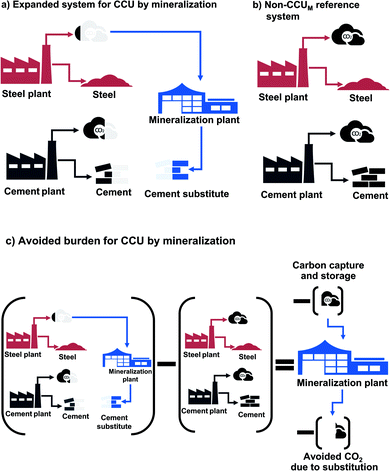
Our definition of the functional units makes any CCU technology inherently multi-functional: on the one hand, a CCU technology fulfills the function specified in the functional unit, i.e., storing CO2; on the other hand, the CCU technology has the function to produce a value-added product. Multi-functionality requires special treatment in LCA to distribute the environmental impacts to the different functions. General LCA guidelines such as the ISO norm,43 ILCD handbook,28 and CCU-specific guidelines46 recommend to include all functions in the functional unit (system expansion). However, system expansion does not allow to compute product-specific footprints. To be able to report technology-specific environmental impacts, we employ system expansion via substitution (avoided burden). For comparative LCAs, the avoided burden approach is mathematically equivalent to system expansion, since the same changes in environmental impacts are computed.47 In the avoided-burden approach, we subtract the avoided impacts from additional functions.28
For CCU by mineralization, the expanded system (Fig. 2a) includes of course the mineralization plant that captures CO2 and produces the cement substitute. In this work, the CO2 for the mineralization plant is provided by a steel plant. Therefore, the steel plant is also included in the expanded system. Furthermore, the mineralization products partially substitute cement. To capture this substitution effect, a cement plant is also included in the expanded system. Thus, the functions of the expanded system are: storage of CO2, as well as the production of both steel and cement. To determine the avoided impacts from the functions beyond CO2 storage, we define a reference system with the same additional functions but without CCU by mineralization (non-CCUM). In our case, the reference system is the steel plant without CO2 capture and the conventional cement plant (Fig. 2b). To calculate the avoided burden (Fig. 2c), we subtract the non-CCUM reference system from the expanded system. The resulting reductions in CO2e emissions are thus due to the capture and storage of CO2 from the steel plant and due to the substitution of conventional cement. The resulting carbon footprint represents a comparison between the CCU system and the reference system. A negative carbon footprint thus indicates that the CCU system has less CO2e emissions than the reference system.
2.2. Life cycle inventory (LCI)
The second phase of LCA is the life cycle inventory where we collect all mass and energy balances to compute the flows to and from the environment. A general description of the processes inside each life cycle stage is given in the ESI, Section S2.† The specific process data employed in this study is discussed together with the process descriptions in Section 3.An important stage in the life cycle for CCU is the use stage. As discussed in Section 2.1, we assume for the use stage that the value-added mineralization product from CCU substitutes a conventional product. Hereby, we need to account for the fact that the feedstock of mineralization is usually not 100% pure magnesium oxide or calcium oxide but rather a natural mineral or a waste with high percentage of silicon.48 As a result, products of mineralization are carbonates plus silicates. In our case study, mineralization products can be mixed with Ordinary Portland Cement (OPC) to produce blended cement. Thus, mineralization products partially substitute ordinary Portland cement.45 The blended cement with the mineralization products has been shown to fulfill cement standards (e.g., ASTM C150 standard).49
Still, the blended cement has also been shown to reduce performance for some applications:45 Benhelal et al.45 showed that blended cement with 10% silicon dioxide (SiO2) from mineralization has approximately 95% of the performance of pure ordinary Portland cement. The substitution credit considered in our study is thus 95% of the environmental impact due to production of ordinary Portland cement.
Apart from its own performance, the substitution credit could also be affected by other parameters such as alternative substitution materials or market size.46,50 Due to the uncertainty of these parameters for the considered novel products from CCU by mineralization, we analyze these parameters in Section 4.4.
2.3. Life cycle impact assessment (LCIA)
The third phase of LCA, the life cycle impact assessment, translates the flows from and to the environment determined in the life cycle inventory into environmental impacts such as climate change, fossil resource depletion, and toxicity. Since the main motivation of CO2 mineralization is the reduction of GHG emissions, we focus on impacts on climate change for our study. The climate change impact is determined according to IPCC following the recommendations for Life Cycle Assessment of the European Commission.28 To express the climate change impacts, we use the standardized methodology of carbon footprinting.51 The reason for limiting this first study to a single environmental impact is that reductions in climate change impacts are the most critical requirement for CO2 mineralization to be environmentally reasonable. However, other impact categories should be analyzed to assess all environmental impacts of CO2 mineralization.2.4. Interpretation
In the fourth phase of LCA, the life cycle inventory and/or life cycle impact assessment results are interpreted, and uncertainties are investigated.28 Interpretation of our results is provided in Section 4.4.3. Life cycle inventory of CO2 mineralization pathways
To specify the life cycle inventories of our study, first we describe the considered mineralization pathways in detail (Section 3.1). In Section 3.2, we describe the employed life cycle inventory data and our scenarios for the LCA calculation.3.1. Process description of pathways for carbon capture and utilization by mineralization
LCA requires data on the complete pathway from resource extraction to the final product and use stage. In literature, the focus is mostly on the mineralization reactions themselves and often the studies do not include the entire pathway. In this work, we extract 7 mineralization pathways from published studies and close the process and/or data gaps to perform a comparative LCA. In particular, we consider 2 direct mineralization concepts (with 5 pathways) and 2 indirect mineralization concepts (with 2 pathways). Simply put, direct mineralization concepts directly react CO2 with the feedstock in one step, whereas indirect mineralization breaks the process into multiple steps.Continuously stirred tank reactor pathways (CSTR pathways). This direct concept uses a continuously stirred tank reactor (CSTR) for mineralization.13 The pretreatment and the reaction conditions depend on the feedstock, which allows us to divide the CSTR pathways into two categories depending on their respective feedstock serpentine and olivine.
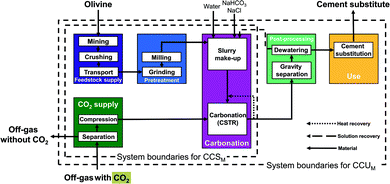
In the olivine pathways (Fig. 3), olivine is mined, crushed, and transported to the mineralization plant. In the pretreatment stage, olivine is prepared via grinding and milling. In the following carbonation stage, the powdered olivine is first mixed with water and additives, and subsequently reacted with CO2 from the CO2 supply. The products are transferred to the post-processing stage, where they are separated and dewatered. The solution of water and additives is recycled to the carbonation stage, and the products continue to the use stage. In the use stage, the products substitute ordinary Portland cement.
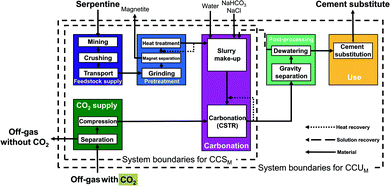
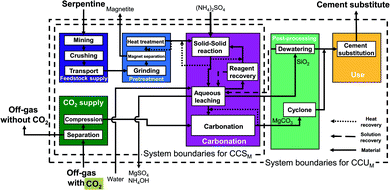
The serpentine pathways (Fig. 4) are identical to the olivine pathways except for the pretreatment stage. As pretreatment, serpentine is first grinded, then iron is separated via magnet separation. Afterwards, the grinded serpentine is activated via heat treatment.
The main benefit of the CSTR pathways is the simple flowsheet which makes scale-up easy. The CSTR pathways have been improved using various additives, pretreatments, and reactor conditions (pressure, temperature, reaction time, stirring speed).13,52–55 For CSTR pathways using serpentine as feedstock, we consider the pathway based on O'Connor et al.13 using pure CO2 at 115 bar (CSTR 115 bar serpentine) and the pathway based on Kemache et al.22 using directly off-gas that is compressed to 10 bar for the mineralization (CSTR 10 bar serpentine). For olivine as feedstock, we consider the pathway based on O'Connor et al.13 using pure CO2 at 150 bar (CSTR 150 bar olivine) and the pathway based on Eikeland et al.53 using pure CO2 at 100 bar (CSTR 100 bar olivine).
Rotary packed bed pathway (RPB pathway). This direct concept uses a rotary packed bed (RPB) for mineralization. The rotary packed bed pathway commonly employs steel slag as feedstock.56
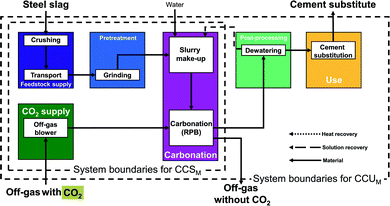
In the rotary packed bed pathway (Fig. 5), steel slag is first crushed and then transported to the mineralization plant. No mining is required since steel slag is a by-product of the steel industry.61 Next, the steel slag is grinded in the pretreatment stage and mixed with water (or wastewater) in the carbonation stage to produce a suspension. The suspension enters the reactor and reacts with the CO2 directly from the off-gas. In the following post-processing stage, the products are dewatered, and the recovered solution is recycled to the carbonation stage. Finally, the dewatered products substitute ordinary Portland cement in the use stage. The benefits of the rotary packed bed pathway are the atmospheric conditions of the reactor (pressure, temperature) and the possibility to directly employ off-gas with 15–20% CO2 instead of pure CO2, which can lower the energy demand. For our study, we consider the pathway based on Pan et al.57
Abo Academy pathway (AA pathway). This indirect concept has two main steps: first, solid/solid extraction and then carbonation in a fluidized bed. The feedstock of the Abo Academy pathway is serpentine. In the Abo Academy pathway (Fig. 6), the feedstock supply and pretreatment stage are identical to the CSTR pathways with serpentine (cf.Fig. 4), i.e., serpentine is mined, crushed, transported, grinded, magnetically separated, and treated by heat. In the carbonation stage, the activated serpentine is first reacted with ammonium sulfate ((NH4)2SO4) in a solid/solid extraction. The products are transferred to an aqueous leaching process where water is added and magnesium is leached. The aqueous leaching process splits the process streams: residues and silicon dioxide (SiO2) are dewatered in the post-processing stage. The solution is recycled to the carbonation stage, and the silicon dioxide (SiO2) is transferred to use stage. Ammonium sulfate ((NH4)2SO4) in aqueous solution is sent to reagent recovery, where the ammonium sulfate is crystallized and separated from the solution. The ammonium sulfate in solid phase is reused in the solid/solid extraction.
The leached magnesium is sent to the carbonation process. In the carbonation process, the leached magnesium reacts with the CO2 from the CO2 supply stage in a gas/solid reactor (fluidized bed) to produce carbonates. The carbonates are separated in the post-processing stage and transferred to the use stage. In the use stage, products are mixed (if required) and substitute ordinary Portland cement.
The advantage of the Abo Academy pathway is the production of separated and very pure products in each step, which avoids separation processes. For our study, we consider the pathway based on Fagerlund et al.58,59
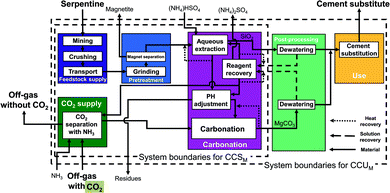
Nottingham pathway. This indirect concept also proceeds in two steps: first, aqueous extraction and then aqueous carbonation. The Nottingham pathway commonly employs serpentine as feedstock. In the Nottingham pathway (Fig. 7), the feedstock supply and the pretreatment stage are thus also identical to the CSTR pathways with serpentine (cf.Fig. 4) with the exception of the heat pretreatment: no heat pretreatment is required in the Nottingham pathway. Serpentine is mined, crushed, transported, grinded, and magnetically separated. In the carbonation stage, the grinded serpentine is first reacted with ammonium bisulfate (NH4HSO4) in the aqueous extraction step to produce a magnesium-rich solution and silicon dioxide (SiO2). The magnesium-rich solution and the silicon dioxide are then further processed separately:
Silicon dioxide (SiO2) is transferred to the post-processing stage, where it is dewatered. The solution is recycled to reagent recovery, and silicon dioxide (SiO2) is transferred to the use stage.
The magnesium-rich solution is transferred to the pH-adjustment process, where residues are separated. After the pH-adjustment process, the magnesium-rich solution reacts with ammonium bicarbonate (NH4HCO3) to produce carbonates in the aqueous carbonation step. Ammonium bicarbonate (NH4HCO3) comes from the CO2 supply stage, where CO2 is captured using ammonia (NH3) and water. After the aqueous carbonation step, the produced carbonates are dewatered in the post-processing stage. Solids are transferred to the use stage. The recovered solution is recycled to the reagent recovery process, where ammonium bisulfate (NH4HSO4) is regenerated and recycled to the different processes. The regeneration process is modelled following Sanna et al.60,61 However, to integrate the heat of the regeneration process, vapor recompression is employed here for the steam produced from regeneration step such that it can be reused to recover ammonium bisulfate. Thus, the resulting electricity demand is higher than in Sanna et al.60,61 while the thermal energy demand of the carbonation stage is much lower.
In the use stage, products are mixed (if required) and substitute ordinary Portland cement.
The pH of the solution in the Nottingham pathway changes from the aqueous extraction process to the carbonation process. Due to this fact, the Nottingham pathway is also known as “pH-swing pathway”.
The Nottingham pathway has three advantages: the production of separated and very pure products at each step, the moderate conditions of the reactor (temperature, pressure), and the ability to directly employ off-gas (15–20% CO2) instead of pure CO2. These features allow to avoid energy-intensive processes and lower the energy demand of the pathway. For our study, we consider the pathway based on Wang & Maroto-Valer et al.14,19
3.2. Background data and scenarios
In this section, we specify the data for the calculation of the life-cycle inventories. We divide our data into 3 groups: background data, the state-of-the-art scenario, and the ideal-mineralization scenario.![[thin space (1/6-em)]](https://www.rsc.org/images/entities/char_2009.gif) 000 ton per year and plant lifetime of 50 years (see the ESI, Section S5†).
000 ton per year and plant lifetime of 50 years (see the ESI, Section S5†).
For the feedstock supply stage, we consider open-pit mines for olivine and serpentine.23 Based on a study for the economic feasibility of bulk minerals, the mines are assumed to be within 260 km radius of the mineralization plant, and the method of transport is a truck for the first 60 km and a train for the next 200 km.48,64 Feedstock composition is taken from literature: olivine is 80 wt% forsterite and 20 wt% ferrian;65–67 serpentine is 90 wt% lizardit and 10 wt% magnetite,19and steel slag is 60 wt% calcium silicate.68 We assume steel slag of Basic Oxygen Furnace (BOF) as a waste stream of the steel industry. Hence, the carbon footprint of incoming steel slag is zero CO2e.40,69
For the feedstock pretreatment stage, we calculate the electricity demand of crushing and grinding (down to 75 μm) via Bond's equation.70 The electricity demand of milling (finer than 75 μm) is based on literature data.13 The thermal energy demand of heat pretreatment is based on literature data, and we assume the recovery of 80% of the sensible heat from the feedstock after the heat pretreatment.13,15 Based on literature,71 we assume that magnetite can be magnetically separated from serpentine and the recovered magnetite can substitute iron ore. Iron ore substitution avoids the environmental impacts of the conventional production of iron ore (data taken from literature72 and LCA database, see the ESI, Section S5†).62,63
For CO2 supply, we consider a steel plant as the CO2 point source. If the pathway requires pure CO2, the CO2 is captured from the off-gas. The energy demand of the CO2 capture is based on literature data.73–76 The electricity demand of CO2 compression is calculated individually for each pathway through process simulation. We consider a multi-stage compressor with a polytropic efficiency of 80%, a compression ratio of maximum 2 and an intercooler after each stage, in ASPEN Plus.77 If the pathway applies directly the off-gas as CO2 source, only the compression of the off-gas is considered.
In the carbonation stage, we consider a heat recovery system based on pinch analysis. We assume no credit for excess thermal energy. The life cycle inventory of additives and chemicals are based on a LCA database (see the ESI, Section S5†).62,63,78
For post-processing, separation of both the aqueous solution and the mineralization products are calculated based on literature data with an energy demand of ∼8 kWh per ton.13,18 The electricity demands of dewatering, classification, and gravity separation are also based on literature data.18 We assume that the mineralization plant is located at a cement plant, thus distance of product transport is zero.
For the use stage, we calculate the substitution of ordinary Portland cement via mineralization products based on performance (Section 2.2).45 The carbon footprint of conventional ordinary Portland cement is 819 kg CO2e per ton.79
Most importantly, we consider only the substitution of cement by silicon dioxide (SiO2). According to a recent study, silicon dioxide (SiO2) can have pozzolanic properties and can thus substitute ordinary Portland cement with a 5% decrease in performance.45 The other products of mineralization, magnesium carbonate or calcium carbonate (MgCO3 or CaCO3), are assumed to have no pozzolanic or cementitious properties. Thus, no substitution credit is given. However, we study the substitution credit in the sensitivity analysis (Section 4.4).
![[thin space (1/6-em)]](https://www.rsc.org/images/entities/char_2009.gif) :
:![[thin space (1/6-em)]](https://www.rsc.org/images/entities/char_2009.gif) 1 on mass basis (100% substitution).
1 on mass basis (100% substitution).
4. Carbon footprint of CCU by mineralization
To illustrate our LCA method, we first present the carbon footprint for the aqueous mineralization in CSTR at 115 bar using serpentine in detail. In Sections 4.2 and 4.3, we show the carbon footprints for all 7 CCU by mineralization pathways in a more condensed form.4.1. Carbon footprint of CSTR 115 bar pathway using serpentine
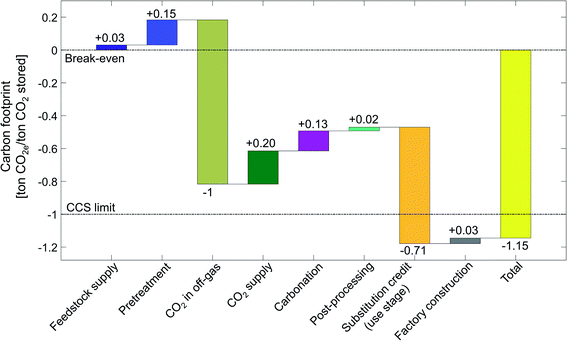
By applying the presented LCA method for CCU by mineralization (Section 2), we calculate the carbon footprint of the CSTR 115 bar pathway for the state-of-the-art scenario (Fig. 8).The total carbon footprint by mineralization and utilization of 1 ton CO2 is negative with a value of −1.15 ton of CO2e. The negative carbon footprint means that the CCU system (Fig. 2a) has less emissions than the reference system (Fig. 2b) since the CCU system avoids more CO2e emissions than it produces. CCU by mineralization avoids CO2e emissions by two mechanisms: (1) by removing and converting CO2 from the off-gas and (2) by substituting cement. The CO2 reacted by mineralization is permanently stored in stable magnesium carbonate (MgCO3). Furthermore, without the mineralization plant, the CO2 in the off-gas would be emitted from the steel plant into the atmosphere (cf. Section 2.1). Thus, the 1 ton of CO2 stored from off-gas reduces the carbon footprint by 1 ton CO2e. The uptake from CO2 is the largest contribution to the carbon footprint. The second largest contribution to the reduction in the carbon footprint is the product substitution with a value of −0.71 ton CO2e per ton CO2 stored.
All other life cycle stages increase the carbon footprint of CCU by mineralization. The largest contribution is due to the CO2 supply stage, which adds +0.20 ton CO2e per ton CO2 stored, as CO2 capture and compression is an energy-intensive process. The next large positive contributions to the carbon footprint come from the carbonation stage and the pretreatment with +0.13 ton CO2e per ton CO2 stored and +0.15 ton CO2e per ton CO2 stored, respectively. The carbonation stage emits CO2e despite being exergonic as a result of the carbon footprint of additives, heat losses, pumping, etc., which offset the effect of exergonic reaction. The carbon footprint of the pretreatment stage is due to the high energy demand of grinding and heat pretreatment. Smaller contributions to the carbon footprint of CCU by mineralization are due to post-processing (+0.02 ton CO2e per ton CO2 stored), feedstock supply (+0.03 ton CO2e per ton CO2 stored) and factory construction (+0.03 ton CO2e per ton CO2 stored). We present the life cycle inventory data in more detail in the ESI, Sections S8 and S9.†
To contextualize the carbon footprint of CCU by mineralization pathways, we define a break-even target and the CCS limit (Fig. 8). Break-even is achieved when the avoided CO2e emissions equal to CO2e emissions caused throughout the life-cycle such that the total carbon footprint is zero. Thus, a negative carbon footprint shows that the CCU pathway (Fig. 2a) has lower GHG emissions than the reference system (Fig. 2a). However, a negative carbon footprint does not mean that CCU by mineralization is carbon negative from cradle-to-grave.82
The CCS limit illustrates the maximum potential of carbon capture and storage (CCS) technologies without utilization. A CCS technology reaches its maximum potential for reductions of CO2e emissions if the CCS process does not cause any direct or indirect CO2e emissions while capturing and storing 1 ton CO2. The carbon footprint of such an ideal CCS process would be −1 ton CO2e. The carbon footprint of a CCU technologies can be theoretically better than the CCS limit. This advantage is due to the substitution credit in the “use stage”. With the substitution credit, CCU by mineralization can avoid more than 1 ton CO2e per ton CO2 captured.
4.2. Carbon footprint of CCU by mineralization pathways for the state-of-the-art scenario
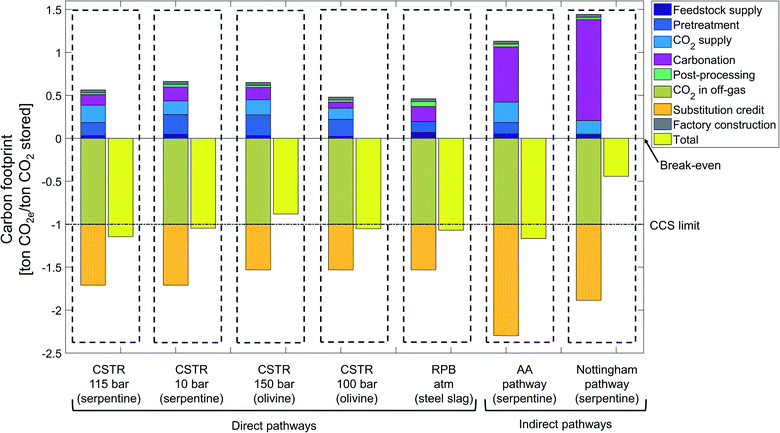
The state-of-the-art scenario illustrates the status of current research and is based on accomplished rates in laboratory for all considered CCU pathways (Fig. 9).CCU by mineralization avoids up to 1.17 ton CO2e per ton CO2 stored, which is the carbon footprint of the indirect Abo Academy pathway using serpentine. Overall, 5 pathways (CSTR 115 bar, CSTR 10 bar, CSTR 100 bar, rotary packed bed and Abo Academy pathway) avoid more emissions than just storing CO2.
All pathways avoid CO2e emissions by storing CO2 and by substituting cement. Since the stored CO2 is the functional unit of our study, all pathways reduce CO2e by 1 ton CO2e by CO2 from the off-gas. The credit for substituting cements ranges from 0.53 to 1.3 ton CO2e per ton CO2 stored. The variation in the substitution credits is due to variation of the product mass, which are in turn caused by the diverse feedstock and reaction routes of the pathways. The substitution credit of the indirect pathways is always higher than for the direct pathways. The reason is our functional unit of 1 ton CO2 stored which means that 1 ton of CO2 is reacted in the carbonation process. In indirect pathways, silicon dioxide (SiO2) is produced in the first carbonation step and CO2 is reacted in the second carbonation step. Silicon dioxide (SiO2) can substitute cement, thus more SiO2 increases the substitution credit. Due to the lower reaction yield of the second carbonation step, indirect pathways require more product from the first carbonation step, which increases the production of silicon dioxide (SiO2) thus the substitution credit.
Except for the substitution credit and storing CO2, all other life cycle stages increase the carbon footprint of the CCU by mineralization. For most pathways, the largest contribution to the carbon footprint is due to the carbonation stage, which vary from +72 to +1175 kg CO2e per ton CO2 stored. This variation shows the strong dependence of the carbon footprint on the employed carbonation process. Carbonation for CSTR 100 bar has a small contribution to the carbon footprint due to the exergonic nature of the reaction. In contrast, in the indirect pathways, the carbonation stage has a much higher contribution to the carbon footprint (e.g., +72 kg CO2e per ton CO2 stored for the direct CSTR100 pathway vs. 1175 kg CO2e per ton CO2 stored for the indirect Nottingham pathway). This difference can be traced back to energy-intensive processes, such as reagent recovery, that are specific to the indirect pathways. To avoid the reagent recovery but benefit from benefits of the indirect pathways, Park and Fan83 introduced a mineralization concept with CO2 as an extraction agent.
The second largest positive contribution to the carbon footprint is often the CO2 supply stage, which also varies substantially between the pathways. The pathways that require pure CO2 (CSTR 115 bar, CSTR 150 bar, CSTR 100 bar, and Abo Academy pathway) have higher CO2e emissions (range from 130 to 237 kg CO2e per ton CO2 stored) in the CO2 supply stage than pathways operating directly with off-gas (rotary packed bed, CSTR 10 bar and Nottingham range from 0.1 to 160 kg CO2e per ton CO2 stored). Note that for the pathways that require pure CO2 (CSTR 115 bar, CSTR 150 bar, CSTR 100, bar and Abo Academy pathway), the excess heat generated in the carbonation stage is integrated into the CO2 supply stage and reduces the need for external energy supply. We present the life cycle inventory data of the considered CCU by mineralization pathways in the ESI, Sections S8 and S9.†
In literature, the pretreatment stage is one of the most discussed subjects in mineralization.84 Indeed, the carbon footprint of the pretreatment stage varies strongly depending on:
• The particle size: decreasing the particle size from 75 μm to 10 μm adds 91 kg CO2e per ton feedstock to the carbon footprint (Nottingham pathway vs. CSTR 100 bar).
• The necessity of heat pretreatment, which adds 31 kg CO2e per ton feedstock to the carbon footprint (Nottingham vs. Abo Academy pathway).
In general, direct pathways require a more intensive pretreatment than indirect pathways because the indirect pathways benefit from chemical leaching, which accelerates carbonation. The pathways that require a heat pretreatment or a finer particle size have a higher carbon footprint for pretreatment. Heat pretreatment is an energy-intensive process and could offset the benefits of CCU by mineralization. Thus, some researchers have proposed to disregard pathways that required heat pretreatment.85 To assess this proposition, we can compare the carbon footprint of the pretreatment stage for the pathways CSTR 115 bar and CSTR 150 bar. In the CSTR 115 bar pathway using serpentine, heat pretreatment is applied to the feedstock, and the carbon footprint of the pretreatment stage is 153 kg CO2e per ton CO2 stored. On the other hand, the CSTR 150 bar pathway using olivine requires extra grinding and milling for feedstock pretreatment, which cause 243 kg CO2e per ton CO2 stored. Thus, the carbon footprint without heat pretreatment is 90 kg CO2e per ton CO2 stored higher. This analysis shows that heat pretreatment cannot be excluded in general for CCU by mineralization pathways.
The post-processing, factory construction and feedstock supply stage cause relatively few CO2e emissions in all pathways, ranging from 22 to 67 kg CO2e per ton CO2 stored, respectively.
4.3. Carbon footprint of CCU by mineralization pathways for the ideal-mineralization scenario
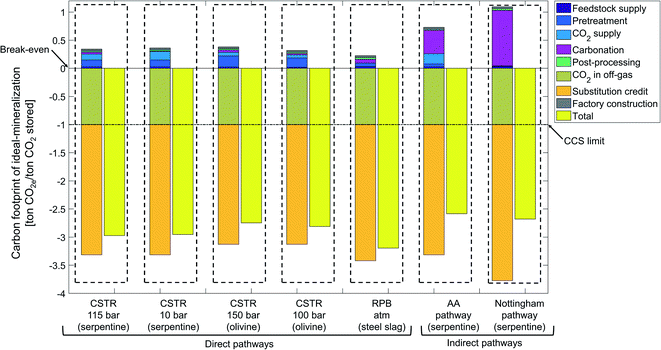
The ideal-mineralization scenario neglects all process inefficiencies and utilizes the entire product, so that an upper bound on the potential of CCU by mineralization can be determined (Fig. 10).For the ideal-mineralization scenario, the carbon footprint due to mineralization of 1 ton CO2 ranges from −2.6 to −3.2 ton CO2e. The carbon footprint reduction is thus much higher than in the state-of-the-art scenario. This increase is due to the increased amounts of CO2e avoided by substitution and the decreased carbon footprint of all processing stages.
From the two mechanisms to avoid CO2e emissions, the amount of stored CO2 is by definition the same as in the state-of-the-art scenario, but the substitution credit increases substantially to −2.1 to −2.7 ton CO2e per ton CO2 stored. The substitution credit increases since we assume that all products can be employed as cement substitutes: not only silicon dioxide, but also magnesium or calcium carbonate (SiO2 + MgCO3 or CaCO3). In this way, the substitution credit increases. However, it should be pointed out that this assumption would require a massive development in product properties. This analysis shows that this development would be highly desirable.
Fig. 10 shows also a massive reduction of CO2e emissions for all other stages. This reduction is due to the higher reaction yield, higher heat recovery, and higher solution recovery as well as the high efficiency CO2 capture technology, which all reduce the energy or material demand, and consequently decrease carbon footprint.
Overall, the upper bound on the CO2e emissions avoided by CCU by mineralization is 2.6 to 3.2 times higher than just storing CO2. Even though the ideal-mineralization scenario will not be achievable in practice, the calculation shows the large potential of CCU by mineralization and the significant opportunities to improve the process itself and the product properties.
4.4. Sensitivity analysis for the state-of-the-art scenario
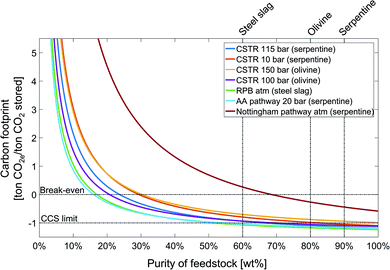
The preceding analysis fixed the feedstock, the carbon footprint of the electricity supply, and the location of the mineralization plant. To investigate the impact of these parameters, we perform a sensitivity analysis. The results also show the important role of the substitution credit for the carbon footprint. Thus, we also perform a sensitivity analysis on the substitution credit.Low feedstock purity increases the amounts of solid handling and treatment, which consequently increases the energy demand and thus the carbon footprint of CCU by mineralization pathways. For all pathways, the carbon footprint is inversely proportional to feedstock purity. The carbon footprint of the CCU by mineralization pathways increases moderately from 100% until approximately 50% feedstock purity, however, the carbon footprint increases rapidly for feedstock purities lower than 50%. The dependence on feedstock purity is mainly determined by the energy demand of the pathway. As a result, the Nottingham pathway shows a stronger dependence on feedstock purity than the other pathways and crosses the break-even line at the feedstock purity of approximately 68%. For a feedstock purity lower than 20%, just the Abo Academy and the rotary packed bed pathways still reduce GHG emissions as indicated by the negative carbon footprint.
The sensitivity analysis on the carbon footprint of the electricity supply (see the ESI, Section S3†) shows that decreasing the carbon footprint of electricity supply decreases the carbon footprint of all mineralization pathways. The minimum carbon footprint is reached for an electricity supply with zero emissions and ranges from −1.41 ton CO2e per ton CO2 stored for the CSTR 150 bar pathway to −2.20 ton CO2e per ton CO2 stored for the Abo Academy pathway. The order of the pathways stays practically the same with the exception of the Nottingham pathway which has the largest carbon footprint in the state-of-the-art scenario and the second smallest for zero-carbon electricity due to its higher energy demand. Still, for all mineralization pathways, the dependence on electricity supply is much smaller than observed for other CCU pathways depending on water electrolysis for hydrogen production.86
For the feedstock transport distance (see the ESI, Section S4†), the effect on the carbon footprint is moderate for all pathways for CCU by mineralization. Doubling the transport distance to 520 km increases the carbon footprint at most by 60 kg CO2e per ton CO2 stored for the rotary packed bed pathway. Beyond 1000 km transport distance, the effect of feedstock transport distance on the carbon footprint becomes negligible since long distance transports typically employs efficient cargo ships.
![[thin space (1/6-em)]](https://www.rsc.org/images/entities/char_2009.gif) :
:![[thin space (1/6-em)]](https://www.rsc.org/images/entities/char_2009.gif) 1 credit). However, the performance of new products can differ from the conventional product. Therefore, the 1
1 credit). However, the performance of new products can differ from the conventional product. Therefore, the 1![[thin space (1/6-em)]](https://www.rsc.org/images/entities/char_2009.gif) :
:![[thin space (1/6-em)]](https://www.rsc.org/images/entities/char_2009.gif) 1 substitution can be misleading. Here, we employed a substitution factor of 95% based on experimental findings on performance of blended cement.45
1 substitution can be misleading. Here, we employed a substitution factor of 95% based on experimental findings on performance of blended cement.45
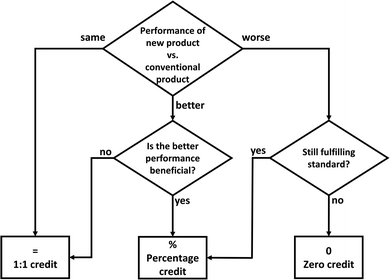
To determine the substitution credit for mineralization products in general, we present a workflow (Fig. 12): The central question is how the new product performs in comparison to the conventional product. The performance can be the same, better or worse. If the performance is the same, the substitution credit is indeed equal to the environmental impact of the conventional product (1![[thin space (1/6-em)]](https://www.rsc.org/images/entities/char_2009.gif) :
:![[thin space (1/6-em)]](https://www.rsc.org/images/entities/char_2009.gif) 1 credit). If the performance is better, the substitution credit is still 1
1 credit). If the performance is better, the substitution credit is still 1![[thin space (1/6-em)]](https://www.rsc.org/images/entities/char_2009.gif) :
:![[thin space (1/6-em)]](https://www.rsc.org/images/entities/char_2009.gif) 1 if the higher performance of the new product is not beneficial for its function. In contrast, if the higher performance of the new product is beneficial for its function (e.g., less mass required for the same material strength), the substitution credit should measure this increase in performance (percentage credit, e.g., for reduced reference flow to achieve the same function). If the performance is worse, we need to check if the new product still fulfills the required standards for the function, in particular for building materials: if yes, the performance loss should be accounted by the percentage credit; if not, the substitution credit is zero because the CCU product does not fulfill the function.
1 if the higher performance of the new product is not beneficial for its function. In contrast, if the higher performance of the new product is beneficial for its function (e.g., less mass required for the same material strength), the substitution credit should measure this increase in performance (percentage credit, e.g., for reduced reference flow to achieve the same function). If the performance is worse, we need to check if the new product still fulfills the required standards for the function, in particular for building materials: if yes, the performance loss should be accounted by the percentage credit; if not, the substitution credit is zero because the CCU product does not fulfill the function.
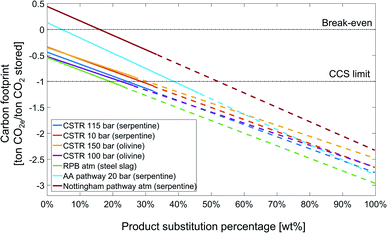
Fig. 13 shows the sensitivity analysis of the carbon footprint of the studied CCU by mineralization pathways on the substitution credit for the state-of-the-art scenario. Here, we define a product substitution percentage: the product substitution percentage is the mass of substituted product divided by the maximum possible product mass, which is the amount of silicon dioxide plus carbonate, i.e., SiO2 + MgCO3 or CaCO3.
For all pathways for CCU by mineralization, increasing the product substitution percentage increases the amount of products available for substitution and consequently the substitution credit. E.g., for the rotary packed bed pathway, the carbon footprint decreases from approximately −0.5 to −3 ton CO2e per ton CO2 stored from 0% to 100% product substitution percentage. All 7 pathways reduce the carbon footprint more than the maximum potential of CCS technology, if the product substitution percentage reaches 53%.
As the pathways for CCU by mineralization produce different amount of products, the slope of the lines and also switching to substitution by carbonates are different. For all pathways, the amount of MgCO3 or CaCO3 produced is higher than SiO2. Thus, if substitution by MgCO3 or CaCO3 would be possible, the carbon footprint of CCU by mineralization pathways could be even more strongly reduced. E.g., for the CSTR 100 bar pathway, the total carbon footprint reduces from −1.08 ton CO2e per ton CO2 stored at 26% product substitution percentage, corresponding to the total amount of SiO2, to −2.65 ton CO2e per ton CO2 stored for 100% product substitution percentage, where all SiO2 and MgCO3 are utilized.
The Nottingham and Abo Academy pathways cross the break-even line of zero carbon footprint at 16% and 5% product substitution percentage, respectively. For the state-of-the-art scenario, the Nottingham and Abo Academy pathway has positive carbon footprint without the substitution credit; hence, the Nottingham and Abo Academy pathways are currently not suitable for CCS by mineralization, and the substitution credit is here critical to achieve an overall negative carbon footprint.
To conclude, the carbon footprint of CCU by mineralization pathways is extremely sensitive to the substitution credit, and a sound analysis of the substitution credit is essential.
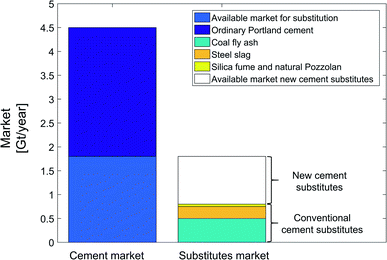
To investigate the effect of market size and alternative cement substitutes, we analyze the cement market (Fig. 14) and conventional cement substitutes, e.g., steel slag, coal fly ash, ground glass, silica fume, and natural Pozzolan.50 The global market of ordinary Portland cement is estimated to be 4.5 Gt per year.87 According to the standard for blended cement (ASTM C595), a maximum 40% of the global ordinary Portland cement market is available for substitution (approx. 1.8 Gt per year).88,89 The global production market of steel slag and coal fly ash are around 0.25 Gt per year and 0.5 Gt per year, respectively.50 Note that coal power plants are expected to shut down in future such that the amount of coal fly ash should be expected to reduce.7 The sum of the current global production markets for all conventional cement substitutes is about 0.8 Gt per year. As a result, there is still an available market of 1 Gt per year for new cement substitutes, which can be filled with mineralization products. To conclude, conventional cement substitutes have no effect on the substitution credit of CCU by mineralization pathways, as the available market is much larger than production market of the conventional cement substitutes.
5. Conclusions
Carbon capture and utilization by CO2 mineralization is a promising technology to reduce greenhouse gas emissions by storing CO2 and by substituting conventional products. However, energy demand for mineralization is high to overcome the slow reaction kinetics. Our assessment of the carbon footprint of carbon capture and utilization by mineralization shows that the studied 7 pathways proposed in literature could all reduce GHG emissions if the produced SiO2 substitutes cement.The largest reductions in GHG emissions stems from the conversion and permanent storage of CO2. The second largest reduction is due to product substitution. Via substitution of conventional production, capturing and mineralizing 1 ton CO2 could avoid more than 1 ton of CO2e emissions. However, the carbon footprint of CCU by mineralization pathways is extremely sensitive to the substitution credit and thus, a sound analysis of the substitution credit is essential. The development of markets for products from CO2 mineralization seems desirable.
All other life cycle stages increase the carbon footprint of CCU by mineralization. For indirect pathways, the largest contribution is due to the carbonation stage, as reagent recovery is an energy-intensive process. For direct pathways, if the pathway employs pure CO2, the largest contribution is due to the CO2 supply stage, otherwise due to pretreatment stage. The findings emphasize the need to further improve performance of CO2 mineralization processes.
Current data suggests that up to 1 Gt per year of the cement market could be substituted by mineralization products. Based on the present analysis, the resulting reduction of the carbon footprint would range from 0.4 Gt CO2e per year to 1.5 Gt CO2e per year; corresponding up to 3% of the global GHG emissions.1 While further environmental impacts should still be assessed, the present analysis suggests that future research should explore novel pathways and possible applications for products from CO2 mineralization.
Conflicts of interest
There are no conflicts to declare.Acknowledgements
This work has been carried out within the project “CO2MIN” (033RC014). The project is funded by the German Federal Ministry of Education and Research (BMBF). For the continuous support and cooperation, we would like to thank our project partners from RWTH Aachen, IASS Potsdam, and HeidelbergCement AG.References
-
IPCC, Contribution of Working Group III to the Fifth Assessment Report of the Intergovernmental Panel on Climate Change, Climate Change 2014: Mitigation of Climate Change, ed. O. Edenhofer, R. Pichs-Madruga, Y. Sokona, E. Farahani and S. Kadner, 2014 Search PubMed
.
-
IPCC, Summary for Policymakers, in Global warming of 1.5 °C. An IPCC Special Report on the impacts of global warming of 1.5 °C above pre-industrial levels and related global greenhouse gas emission pathways, in the context of strengthening the global response to the threat of climate change, sustainable development, and efforts to eradicate poverty, 2018 Search PubMed
.
-
IEA, Technology Roadmap Low-Carbon Transition in the Cement Industry, 2018 Search PubMed
.
-
Umweltbundesamt, Treibhausgas Emissionen seit 1990 nach Gasen, 2018 Search PubMed
.
- W. Shen, L. Cao, Q. Li, W. Zhang, G. Wang and C. Li, Renew. Sustain. Energy Rev., 2015, 50, 1004 CrossRef CAS
.
-
C. T. Michael Taylor and D. Gielen, Energy Efficiency and CO2 Emissions from the Global Cement Industry, IEA-WBCSD workshop, 2006 Search PubMed
.
-
IEA, Energy Climate and Change-World Energy Outlook Special Report, 2015 Search PubMed
.
- M. Bui, C. S. Adjiman, A. Bardow, E. J. Anthony, A. Boston, S. Brown, P. S. Fennell, S. Fuss, A. Galindo, L. A. Hackett, J. P. Hallett, H. J. Herzog, G. Jackson, J. Kemper, S. Krevor, G. C. Maitland, M. Matuszewski, I. S. Metcalfe, C. Petit, G. Puxty, J. Reimer, D. M. Reiner, E. S. Rubin, S. A. Scott, N. Shah, B. Smit, J. P. M. Trusler, P. Webley, J. Wilcox and N. Mac Dowell, Energy Environ. Sci., 2018, 11(5), 1062 RSC
.
- V. Romanov, Y. Soong, C. Carney, G. E. Rush, B. Nielsen and W. O'Connor, ChemBioEng Rev., 2015, 2(4), 231 CrossRef CAS
.
-
A. Zapantis, Policy Priorities To Incentivise Large Scale Deployment Of Ccs, 2019 Search PubMed
.
- H. J. Herzog, Energy Econ., 2011, 33(4), 597 CrossRef
.
-
M. Mazzotti, IPCC Special Report on Carbon dioxide Capture and Storage, 2005 Search PubMed
.
-
W. O'Connor, D. C. Dahlin, G. E. Rush, S. J. Gerdemann, L. R. Penner and D. N. Nilsen, Aqueous Mineral Carbonation: Mineral Availability, Pretreatment, Reaction Parametrics, and Process Studies, 2005 Search PubMed
.
- X. Wang and M. M. Maroto-Valer, ChemSusChem, 2011, 4(9), 1291 CrossRef CAS PubMed
.
- R. D. Balucan, B. Z. Dlugogorski, E. M. Kennedy, I. V. Belova and G. E. Murch, Int. J. Greenhouse Gas Control, 2013, 17, 225 CrossRef CAS
.
- J. Li and M. Hitch, Miner. Eng., 2018, 128, 69 CrossRef CAS
.
- M. Ghoorah, B. Z. Dlugogorski, R. D. Balucan and E. M. Kennedy, Fuel, 2014, 122, 277 CrossRef CAS
.
- A. Sanna, R. H. Matthew and M.-V. Mercedes, Energy Environ. Sci., 2012, 5, 7781 RSC
.
- X. Wang and M. M. Maroto-Valer, Fuel, 2011, 90(3), 1229 CrossRef CAS
.
- P. K. Naraharisetti, T. Y. Yeo and J. Bu, ChemPhysChem, 2017, 18(22), 3189 CrossRef CAS PubMed
.
- G. Costa, A. Polettini, R. Pomi, A. Stramazzo and D. Zingaretti, Greenhouse Gases: Sci. Technol., 2017, 7(3), 530 CrossRef CAS
.
- N. Kemache, L.-C. Pasquier, E. Cecchi, I. Mouedhen, J.-F. Blais and G. Mercier, Fuel Process. Technol., 2017, 166, 209 CrossRef CAS
.
- S. J. T. Hangx and C. J. Spiers, Int. J. Greenhouse Gas Control, 2009, 3(6), 757 CrossRef CAS
.
- A. Sanna, M. Uibu, G. Caramanna, R. Kuusik and M. M. Maroto-Valer, Chem. Soc. Rev., 2014, 43(23), 8049 RSC
.
- G. F. Brent, D. J. Allen, B. R. Eichler, J. G. Petrie, J. P. Mann and B. S. Haynes, J. Ind. Ecol., 2012, 16(1), 94 CrossRef CAS
.
- D. Zingaretti, G. Costa and R. Baciocchi, Ind. Eng. Chem. Res., 2013, 53(22), 9311 CrossRef
.
- W. J. J. Huijgen, G. J. Ruijg, R. N. J. Comans and G.-J. Witkamp, Ind. Eng. Chem. Res., 2006, 45(26), 9184 CrossRef CAS
.
-
ILCD Handbook, International Reference Life Cycle Data System (ILCD) Handbook - General guide for Life Cycle Assessment, European Commission - Joint Research Centre - Institute for Environment and Sustainability, 2010 Search PubMed
.
- S. Giannoulakis, V. Kathrin and B. Christian, Int. J. Greenhouse Gas Control, 2014, 21, 140 CrossRef CAS
.
- L.-S. Xiao, R. Wang, P.-C. Chiang, S.-Y. Pan, Q.-H. Guo and E. E. Chang, Aerosol Air Qual. Res., 2014, 14(3), 892 CrossRef CAS
.
- C. Julcour, F. Bourgeois, B. Bonfils, I. Benhamed, F. Guyot, F. Bodénan, C. Petiot and É. C. Gaucher, Chem. Eng. J., 2015, 262, 716 CrossRef CAS
.
- M. S. Ncongwane, J. L. Broadhurst and J. Petersen, Int. J. Greenhouse Gas Control, 2018, 77, 70 CrossRef CAS
.
- H. H. Khoo, J. Bu, R. L. Wong, S. Y. Kuan and P. N. Sharratt, Energy Procedia, 2011, 4, 2494 CrossRef CAS
.
- H. H. Khoo, P. N. Sharratt, J. Bu, T. Y. Yeo, A. Borgna, J. G. Highfield, T. G. Björklöf and R. Zevenhoven, Ind. Eng. Chem. Res., 2011, 50(19), 11350 CrossRef CAS
.
- E. Nduagu, J. Bergerson and R. Zevenhoven, Energy Convers. Manage., 2012, 55, 116 CrossRef CAS
.
- R. M. Cuéllar-Franca and A. Azapagic, J. CO2 Util., 2015, 9, 82 CrossRef
.
- K. E. Kelly, G. D. Silcox, A. F. Sarofim and D. W. Pershing, Int. J. Greenhouse Gas Control, 2011, 5(6), 1587 CrossRef CAS
.
- J. Oh, D. Jung, S. H. Oh, K. Roh, S. Ga and J. H. Lee, J. CO2 Util., 2019, 34, 446 CrossRef CAS
.
- A. Kirchofer, A. Brandt, S. Krevor, V. Prigiobbe and J. Wilcox, Energy Environ. Sci., 2012, 5(9), 8631 RSC
.
- S.-Y. Pan, L. L. Ana Maria and C. Pen-Chi, Appl. Energy, 2016, 170, 269 CrossRef CAS
.
- S. Ghasemi, G. Costa, D. Zingaretti, M. U. Bäbler and R. Baciocchi, Energy Procedia, 2017, 114, 5393 CrossRef CAS
.
- A. Di Maria, R. Snellings, L. Alaerts, M. Quaghebeur and K. van Acker, Int. J. Greenhouse Gas Control, 2020, 93, 102882 CrossRef
.
- ISO 14040:2006, Environmental management — Life cycle assessment — Principles and framework, 2006 Search PubMed.
- ISO 14044:2006, Environmental management — Life cycle assessment — Requirements and guidelines, 2006 Search PubMed.
- E. Benhelal, M. I. Rashid, C. Holt, M. S. Rayson, G. Brent, J. M. Hook, M. Stockenhuber and E. M. Kennedy, J. Clean. Prod., 2018, 186, 499 CrossRef CAS
.
- N. von der Assen, J. Jung and A. Bardow, Energy Environ. Sci., 2013, 6(9), 2721 RSC
.
-
A. Zimmerman, J. Wunderlich, G. Buchner, L. Müller, K. Armstrong, S. Michailos, A. Marxen, H. Naims, F. Mason, G. Stokes and E. Williams, Techno-Economic Assessment & Life-Cycle Assessment Guidelines for CO2 Utilization, Global CO2 Initiative, University of Michigan, 2018 Search PubMed
.
- T. P. Bide, M. T. Styles and J. Naden, Appl. Earth Sci., 2014, 123(3), 179 CrossRef CAS
.
- ASTM C150, Standard Specification for Portland Cement C150/C150M, 2017 Search PubMed.
- J. M. Paris, J. G. Roessler, C. C. Ferraro, H. D. DeFord and T. G. Townsend, J. Clean. Prod., 2016, 121, 1 CrossRef CAS
.
- ISO 14067:2018, Greenhouse gases - Carbon footprint of products - Requirements and guidelines for quantification, 2018 Search PubMed.
- S. J. Gerdemann, W. K. O'Connor, D. C. Dahlin, L. R. Penner and H. Rush, Environ. Sci. Technol., 2007, 41(7), 2587 CrossRef CAS PubMed
.
- E. Eikeland, A. B. Blichfeld, C. Tyrsted, A. Jensen and B. B. Iversen, ACS Appl. Mater. Interfaces, 2015, 7(9), 5258 CrossRef CAS PubMed
.
- I. Mouedhen, N. Kemache, L.-C. Pasquier, E. Cecchi, J.-F. Blais and G. Mercier, J. Environ. Manage., 2017, 198(Part 1), 1 CAS
.
- N. Kemache, L.-C. Pasquier, E. Cecchi, I. Mouedhen, J.-F. Blais and G. Mercier, Fuel Process. Technol., 2017, 166, 209 CrossRef CAS
.
- S.-Y. Pan, P.-C. Chiang, Y.-H. Chen, C.-D. Chen, H.-Y. Lin and E.-E. Chang, Environ. Sci. Technol., 2013, 47(23), 13677 CrossRef CAS PubMed
.
- S.-Y. Pan, Y.-H. Chen, C.-D. Chen, A.-L. Shen, M. Lin and P.-C. Chiang, Environ. Sci. Technol., 2015, 49(20), 12380 CrossRef CAS PubMed
.
- I. Romão, E. Nduagu, J. Fagerlund, L. M. Gando-Ferreira and R. Zevenhoven, Energy, 2012, 41(1), 203 CrossRef
.
- J. Fagerlund, E. Nduagu, I. Romão and R. Zevenhoven, Energy, 2012, 41(1), 184 CrossRef CAS
.
- A. Sanna, M. Dri and M. Maroto-Valer, Fuel, 2013, 114, 153 CrossRef CAS
.
- A. Sanna, J. Gaubert and M. M. Maroto-Valer, Chem. Eng. J., 2016, 306, 1049 CrossRef CAS
.
-
GaBi 9.2, Software-System and Database for Life CycleEngineering, Thinkstep AG, Leinfelden-Echterdingen, Germany, 2019 Search PubMed
.
-
Swiss Centre for Life Cycle Inventories, ecoinvent Data V 3.3, 2016 Search PubMed
.
-
D. E. Highley, G. R. Chapman and K. A. Bonel, The economic importance of minerals to the UK, British Geological Survey, 2004 Search PubMed
.
- L. Turri, M. Hervé, R. Keesjan, K. Pol and L. Francois, Chem. Eng. Sci., 2017, 171, 27 CrossRef CAS
.
- R. M. Santos, P. C. M. Knops, K. L. Rijnsburger and Y. W. Chiang, Frontiers in Energy Research, 2016, 4, 5 CrossRef
.
- D. Kremer, S. Etzold, J. Boldt, P. Blaum, K. M. Hahn, H. Wotruba and R. Telle, Minerals, 2019, 9(8), 485 CrossRef CAS
.
- S.-Y. Pan, P.-C. Chiang, Y.-H. Chen, C.-S. Tan and E.-E. Chang, Environ. Sci. Technol., 2013, 47(7), 3308 CrossRef CAS PubMed
.
-
World Steel Association, Life Cycle Inventory Study, 2018 Search PubMed
.
-
R. H. Perry and D. W. Green, Perry's Chemical Engineers' Handbook, McGraw-Hill, New York, 1997 Search PubMed
.
- S. P. Veetil, G. Mercier, J.-F. Blais, E. Cecchi and S. Kentish, Int. J. Miner. Process., 2015, 140, 19 CrossRef CAS
.
- T. Norgate and N. Haque, J. Clean. Prod., 2010, 18(3), 266 CrossRef CAS
.
- K. Li, L. Wardhaugh, F. Paul, Y. Hai and T. Moses, Appl. Energy, 2016, 165, 648 CrossRef CAS
.
- M. Pehnt and J. Henkel, Int. J. Greenhouse Gas Control, 2009, 3(1), 49 CrossRef CAS
.
- F. A. Tobiesen, H. F. Svendsen and T. Mejdell, Ind. Eng. Chem. Res., 2007, 46(23), 7811 CrossRef CAS
.
- N. von der Assen, L. J. Müller, A. Steingrube, P. Voll and A. Bardow, Environ. Sci. Technol., 2016, 50(3), 1093 CrossRef CAS PubMed
.
- S. Martin, R. Inês and Z. Ron, Energy, 2013, 62, 142 CrossRef
.
- A. Gamble, Charlest. Advis., 2019, 20(4), 46 CrossRef
.
- T. García-Segura, V. Yepes and J. Alcalá, Int. J. Life Cycle Assess., 2014, 19(1), 3 CrossRef
.
- N. Kemache, L.-C. Pasquier, E. Cecchi, I. Mouedhen, J.-F. Blais and G. Mercier, Fuel Process. Technol., 2017, 209–216 CrossRef CAS
.
-
S. Reddy, J. Scherffius and S. Freguia, Fluor's Econamine FG PlusSM Technology: An Enhanced Amine-Based CO2 Capture Process, Second National Conference on Carbon Sequestration, National Energy Technology Laboratory/Department of Energy, Alexandria, VA, May 2003, pp. 5–8 Search PubMed
.
- S. E. Tanzer and A. Ramírez, Energy Environ. Sci., 2019, 12(4), 1210 RSC
.
- A.-H. A. Park and L.-S. Fan, Chem. Eng. Sci., 2004, 59(22), 5241 CrossRef CAS
.
- J. Li and M. Hitch, Miner. Eng., 2018, 128, 69 CrossRef CAS
.
- H. H. Khoo and R. B. H. Tan, Environ. Prog., 2006, 25(3), 208 CrossRef CAS
.
- J. Artz, T. E. Müller, K. Thenert, J. Kleinekorte, R. Meys, A. Sternberg, A. Bardow and W. Leitner, Chem. Rev., 2018, 118(2), 434 CrossRef CAS PubMed
.
- S. A. Miller, V. M. John, S. A. Pacca and A. Horvath, Cem. Concr. Res., 2018, 114, 115 CrossRef CAS
.
- ASTM C595, Standard Specification for Blended Hydraulic Cements C595/C595M, 2017 Search PubMed.
- Z. Cao, L. Shen, A. N. Løvik, D. B. Müller and G. Liu, Environ. Sci. Technol., 2017, 51(19), 11468 CrossRef CAS PubMed
.
Footnotes |
| † Electronic supplementary information (ESI) available. See DOI: 10.1039/d0se00190b |
| ‡ Present address: Fraunhofer Institute for Solar System, Freiburg, Germany. |
| This journal is © The Royal Society of Chemistry 2020 |

