
 Open Access Article
 This Open Access Article is licensed under a
 Creative Commons Attribution 3.0 Unported Licence
3D to 2D reorganization of silver–thiol nanostructures, triggered by solvent vapor annealing†
Simone
Dell'Elce
a,
Fabiola
Liscio
 b,
Alessandro
Kovtun
a,
Stefano
Allegri
c,
Otello M.
Roscioni
d,
Cristiano
Albonetti
e,
Giovanna
De Luca
fg,
Heinz W.
Amenitsch
h,
Nicola
Demitri
i,
Loris
Giorgini
d,
Vittorio
Morandi
b,
Francesco
Stellacci
c,
Andrea
Liscio
*aj and
Vincenzo
Palermo
ak
b,
Alessandro
Kovtun
a,
Stefano
Allegri
c,
Otello M.
Roscioni
d,
Cristiano
Albonetti
e,
Giovanna
De Luca
fg,
Heinz W.
Amenitsch
h,
Nicola
Demitri
i,
Loris
Giorgini
d,
Vittorio
Morandi
b,
Francesco
Stellacci
c,
Andrea
Liscio
*aj and
Vincenzo
Palermo
ak
aCNR–ISOF, via Gobetti 101, 40129 Bologna, Italy. E-mail: andrea.liscio@artov.imm.cnr.it
bCNR–IMM Sezione di Bologna, via Gobetti 101, 40129 Bologna, Italy
cInstitute of Materials EPFL, 1015 Lausanne, Switzerland
dDipartimento di Chimica Industriale “Toso Montanari”, Università di Bologna, viale Risorgimento 4, 40136 Bologna, Italy
eCNR–ISMN Sezione di Bologna, via Gobetti 101, 40129 Bologna, Italy
fDipartimento di Scienze Chimiche, Biologiche, Farmaceutiche e Ambientali, Università di Messina, viale Stagno d'Alcontres 31, 98166 Messina, Italy
gCNR–IPCB Sezione di Portici, p.le Fermi 1, 80055 Portici (NA), Italy
hInstitute of Inorganic Chemistry, Institut für Anorganische Chemie, 8010 Graz, Stremayrgasse 9/IV, Austria
iBeamline XRD1, Elettra-Sincrotrone Trieste S.C.p.A., Strada Statale 14 - km 163.5, AREA Science Park, 34149 Basovizza (TS), Italy
jCNR–IMM Sezione di Roma, via del Fosso del Cavaliere 100, 00133 Roma, Italy
kChalmers University of Technology, Maskingränd 2, 412 58 Göteborg, Sweden
First published on 3rd December 2018
Abstract
Metal–organic composites are of great interest for a wide range of applications. The control of their structure remains a challenge, one of the problems being a complex interplay of covalent and supramolecular interactions. This paper describes the self-assembly, thermal stability and phase transitions of ordered structures of silver atoms and thiol molecules spanning from the molecular to the mesoscopic scale. Building blocks of molecularly defined clusters formed from 44 silver atoms, each particle coated by a monolayer of 30 thiol ligands, are used as ideal building blocks. By changing solvent and temperature it is possible to tune the self-assembled 3D crystals of pristine nanoparticles or, conversely, 2D layered structures, with alternated stacks of Ag atoms and thiol monolayers. The study investigates morphological, chemical and structural stability of these materials between 25 and 300 °C in situ and ex situ at the nanoscale by combining optical and electronic spectroscopic and scattering techniques, scanning probe microscopies and density-functional theory (DFT) calculations. The proposed wet-chemistry approach is relatively cheap, easy to implement, and scalable, allowing the fabricated materials with tuned properties using the same building blocks.
Introduction
The possibility of combining metals and organic molecules at the nanoscale allows us to produce innovative (nano)composites. Such materials could be obtained, ideally, by merging together the excellent electrical, optical and catalytic properties of the metals with the tunable properties of the organic materials. In particular, the optical and electrical properties of the metal nanoparticles are of interest for many applications in different fields: catalysis, bioscience, nanophotonics and nanoelectronics.1–7Silver nanoparticles have attracted strong interest owing to their properties, which can be easily tuned by controlling particle size, shape, surrounding medium and aggregation state. Silver nanoparticles are more susceptible to oxidation and in general less stable than gold ones, and thus need to be protected by suitable organic ligands. The advancement came with the production of highly stable core–shell silver clusters coated with organic moieties through an S–R thiol ligand (see schematic representation inFig. 1a), where R represents a wide variety of organic functions, tuning the electronic and the optical properties of the nanoparticle.8,9 In particular, the system formed from 44 silver atoms and 30 external S–R ligands was demonstrated to be more stable than that formed from smaller or larger Ag nanoparticles, and even more stable than that formed from analogous Au nanoparticles.8–11
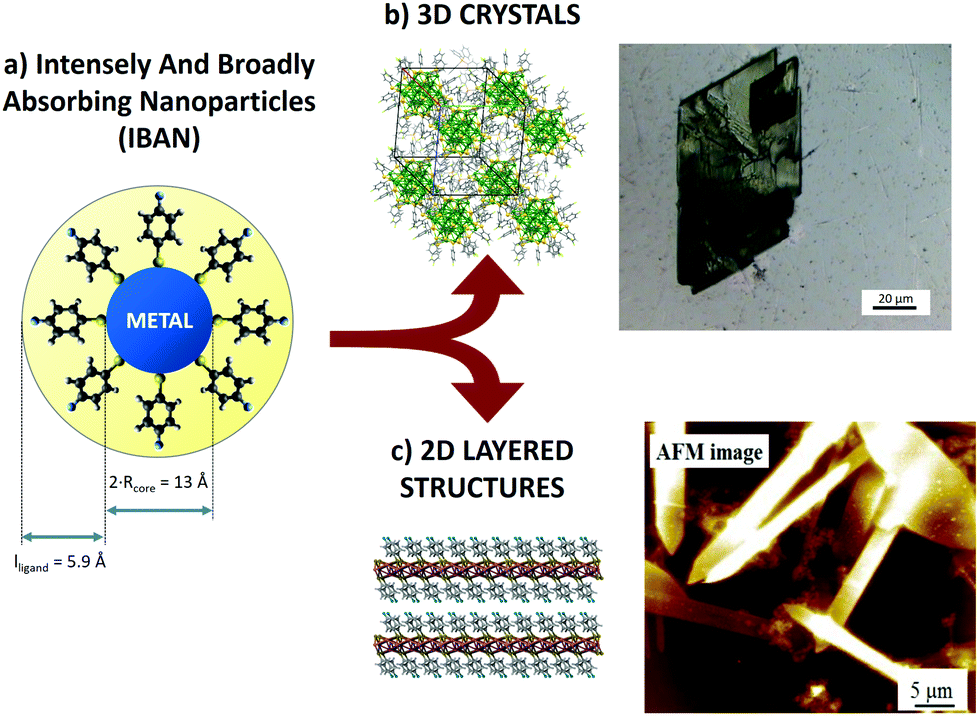 | ||
| Fig. 1 (a) Schematic representation of an IBAN. (b) Optical microscopy image of 3D crystals of IBAN. (c) AFM image of layered structures obtained by IBAN structural rearrangement. | ||
The great chemical and structural stability of the [Ag44(S–R)30]4− system is attributed to their special electronic configuration featuring a closed shell with 18 electrons; this gives a large energy band gap between the highest occupied molecular orbital (HOMO) and the lowest unoccupied molecular orbital (LUMO). The geometrical structure is composed of 12 Ag atoms forming an icosahedral structure, encapsulated in 20 Ag atoms forming an excavated dodecahedron, all protected by six Ag2(S–R)5 units in an octahedral geometry. Each of these silver nanoparticles has 4 negative charges balanced by different counterions (PPh4+, Na+), depending on the synthetic procedure. The nanoparticles feature exceptional optical properties, with strong and complex molecule-like absorption peaks markedly different from those of similarly sized, non-capped Ag clusters. For this reason, they are also called intensely and broadly absorbing nanoparticles (IBAN).9,11
The use of metal–organic nanostructures in concrete applications requires organizing them into robust two- and three-dimensional (2D and 3D) materials, having uniform structures with controlled shape and lateral dimension. To this aim, the supramolecular self-assembly of nano-objects is a common approach to realize ordered structures, for example photonic crystals from colloids.12,13
IBAN are stable in solution and usually self-assemble into large 3D crystals.8 It is well known that supramolecular assemblies undergo substantial changes in their structures with seemingly minor changes in the structures of their molecular/atomic constituents.14 Interestingly, upon chemical or thermal stimuli the IBAN structure can transform from a spherical shape into a layered compound. The latter structure has been sometimes considered as an impurity and removed by filtering;9 however, it is interesting per se, because it features air-stable monolayers of silver atoms alternated with layers of S–R ligands,15–18 a structure similar to that of better known layered materials such as graphite or mica. In recent years, a large amount of work done on graphene and 2D materials has created an appetite for studying the properties and processing of analogously layered structures. Recent work has demonstrated for example that layered Pd thiolates can be produced, and even exfoliated, in solution at the single sheet level.19
Here, we study in detail the formation, structure and stability of these Ag–thiol crystalline nanostructures, exploiting their chemical interaction with solvents to produce mesoscopic amounts of them.
There are several techniques commonly used to arrange organic molecules, nanoparticles or other small objects in ordered structures e.g. thermal evaporation, drop casting or spin coating from solution.20 Beyond these standard approaches typical of crystal growth, we developed in recent years an alternative technique based on solvent vapor annealing (SVA) that we used extensively to self-assemble small molecules, e.g. organic semiconductors and dyes.21–24 In this technique, the material is first deposited in amorphous or nanocrystalline state on a substrate. Then, exposure of the sample to a well-controlled, solvent-rich atmosphere creates a thin layer of liquid on the surface, which shall be considered as a nanometric 2-dimensional solution. Molecules or nanoparticles shall thus diffuse in this thin liquid layer with diffusivity D = 10−9–10−10 cm2 s−1, a value in between the diffusivity of molecules on surfaces under vacuum (≈10−15 cm2 s−1) and diffusivity in bulk liquids (≈1013 cm2 s−1).22 This growth corresponds to a quasi-static system with low evaporation rate, mainly driven by thermodynamic effects, which minimizes meniscus pinning and coffee-stain effects leading to the formation of highly ordered, mesoscopic superlattices. Moreover, SVA allows a more systematic comparison of the effects exerted using different solvents, exposing the samples with similar starting morphology to different vapor-saturated environments, e.g. ruling out any effect due to early aggregation in solution.
In this work, we used the SVA to self-assemble IBANs instead of molecules, exploiting their uniform dispersity (i.e. 44 silver atoms each plus 30 ligands) to produce macroscopic self-assembled aggregates at the solid–liquid interface. The solvent did not only mobilize the IBAN, but also could cause an internal rearrangement of the core structure, allowing obtaining different structures: (i) crystalline 3D superlattice of IBANs (Fig. 1b) and (ii) stacked assemblies of 2D layers (Fig. 1c).
Both the superstructures were systematically studied in situ and ex situ by monitoring their chemical stability, as well as their structural and optical properties, during heating in the range between RT and 300 °C under a N2 atmosphere. X-ray diffraction (XRD) and small-angle/wide-angle X-ray scattering (SAXS/WAXS) measurements were used to compare the different packing of the in-plane and out-of-plane superstructures. Fine details of the morphology of the materials were also studied using atomic force microscopy (AFM) analysis. Furthermore, the changes in the chemical state of Ag were studied in situ using Residual Gas Analysis (RGA), X-ray Photoelectron Spectroscopy (XPS) and Auger Spectroscopy under ultra-high vacuum (p = 10−9 mbar).
Experimental
Synthesis: IBANs were synthesized as described by Bakr and coworkers.9 The NPs were prepared with a reduction of silver trifluoroacetate solution in the presence of the capping ligand and PPh4+ counterions. We used as organic ligand 4-fluorothiophenol (4FTP), which gives highly uniformly dispersed NPs, which are stable in solution for years. 4FTP was stirred with a molar ratio 2![[thin space (1/6-em)]](https://www.rsc.org/images/entities/char_2009.gif) :1 with respect to silver trifluoroacetate in N,N-dimethylformamide (DMF) for 15 min. Then a solution of NaBH4 in DMF was added with molar ratio 4:1 with respect to the silver, the solution was stirred for 4 h after a few amount of water was added to increase the reduction power of NaBH4 and left in the fridge at −4 °C for some days.
:1 with respect to silver trifluoroacetate in N,N-dimethylformamide (DMF) for 15 min. Then a solution of NaBH4 in DMF was added with molar ratio 4:1 with respect to the silver, the solution was stirred for 4 h after a few amount of water was added to increase the reduction power of NaBH4 and left in the fridge at −4 °C for some days.
Self-assembly of crystal structures: Solvent vapour annealing (SVA) was used to assemble the crystals, as described in ref. 21–23. 5 mg of IBAN were added in 2 ml of solvent, either acetone or dichloromethane, and placed in a sonicator bath for 30 s. The SVA procedure was performed using a closed glass crystallizer. A drop of the previously prepared solution was placed on a silicon wafer and deposited on a platform in a crystallizer; then, the crystallizer was filled with 30 ml of solvent (either acetone or DCM). After 7 h, all the samples were allowed to dry for one day under atmosphere, to remove the solvent.
UV-vis spectroscopy measurements were performed using a PerkinElmer LAMBDA 650 spectrophotometer (with deuterium and tungsten light sources) and a high-performance double-beam dual monochromator spectrometer with microcomputer electronics. Its wavelength ranges from 900 to 190 nm. Spectral bandwidth in the UV-vis range is from 0.17 to 5.00 nm. The wavelength range tested was 300–900 nm. 24 h solution monitoring was performed with an Agilent CARY 100, double beam, dual chopper, ratio recording, Czerny-Turner 0.278 m monochromator UV-vis spectrophotometer, controlled using a computer.
Resonance light scattering spectroscopy (RLS) was performed using an FLS920 Edinburgh Instruments spectrofluorimeter with a 450 W xenon lamp probe used for steady state experiments. Signal was detected by a photo-multiplier tube and a Time Correlated Single Photon Counting (TCSPC) with a MicroChannel plate.
Atomic force microscopy measurements were performed with a Digital Instruments AFM (Aura NT-MDT), using cantilevers in semi-contact mode (Bruker RTESP tips, material: 1–10 Ω cm phosphorus (n)-doped Si, f0 = 27–309 kHz, k = 20–80 N m−1). Raw AFM data were treated using histogram flattening procedures25 to remove the experimental artifacts due to the piezo-scanners.
Imaging: Data analysis was typically performed with SPIP (Image Metrology) software.
X-ray photoemission spectroscopy measurements were performed using a Phoibos 100 hemispherical energy analyser (Specs), using a Mg Kα excitation source (XR-50, Specs) (photon energy = 1253.6 eV). The X-ray power was 250 W. The base pressure in the analysis chamber during analysis was 2 × 10⁻¹⁰ mbar.
Residual gas analysis (RGA) was conducted in the preparation UHV chamber of the XPS spectrometer (10−9 mBar) while heating the crystals from 25 °C to 350 °C (5 °C min−1). A quadrupole mass spectrometer was used (RGA 200, Stanford Research Systems), with an operative range of 0–200 amu.
X-ray diffraction (XRD) measurements (out-of-plane geometry) were performed using a SmartLab-Rigaku diffractometer equipped with a rotating anode (Cu λα = 1.5405 Å), followed by a parabolic mirror to collimate the incident beam, and a series of variable slits (placed before and after the sample position).
Single crystal X-ray diffraction measurements were performed at the X-ray diffraction beamline (XRD1) of the Elettra Synchrotron, Trieste (Italy),26 with a Pilatus 2 M hybrid-pixel area detector. Complete datasets were collected on the same crystal at 298 K and 400 K (a nitrogen stream supplied through an Oxford Cryostream 700) with a monochromatic wavelength of 0.700 Å, through the rotating crystal method. The crystal of Ag44(4FTP)30 was dipped in N-paratone and mounted on the goniometer head with a Nylon loop. The diffraction data were indexed, integrated and scaled using X-ray Detector Software (XDS),27 merging two datasets collected with different crystal orientations, at each temperature. The structures were solved using the dual space algorithm implemented in the SHELXT code.28
In situ real time GISAXS measurements were performed at the beamline SAXS of ELETTRA Synchrotron facility (Trieste, Italy) using a wavelength of 1.54 Å and an incident angle, αi, of 0.4°. GISAXS images were obtained for 30 seconds every minute during the thermal annealing under a nitrogen atmosphere and after cooling. Different thermal ramps were carried out from room temperature up to 128 °C, 180 °C and 300 °C. A 2D camera (Pilatus detector) was placed normal to the incident beam direction at 600 mm from the sample.
Ex situ XRD measurements. 2D-GIWAXS images were collected on the pristine and annealed samples at the beamline XRD1 of ELETTRA Synchrotron facility using a wavelength of 1.542 Å. αi was chosen slightly larger than the critical angle for total reflection of the crystals (0.3°), in order to penetrate through the full crystal depth. The diffraction patterns were recorded using a 2D camera (Pilatus detector) placed normal to the incident beam direction at a 200 mm distance from the sample. XRD measurements, both in specular and grazing incidence geometries, were performed using a SmartLab Rigaku diffractometer in a parallel beam geometry equipped with a CuKα (λ = 1.5418 Å) rotating anode followed by a parabolic mirror to collimate the incident beam and a series of variable slits (placed before and after the sample position) to obtain an acceptance of 0.02° and 0.114°, respectively.
DFT simulations were carried out with the program CASTEP version 16.11.29 Ultrasoft pseudopotentials were used in combination with a plane wave cutoff energy of 280 eV and the Perdew–Burke–Ernzerhof generalised gradient-corrected functional30 to compute the ground-state wavefunction. In order to compensate for the known underestimation of Van der Waals interactions, a semi-empirical dispersion–interaction correction31 was used in DFT calculations. A Monkhorst–Pack grid32 with a density of 0.05 Å−1 was used for the sampling of k-points.
Results and discussion
We used uniformly dispersed IBAN as starting building blocks prepared through the reduction of a silver salt solution in the presence of a 4-fluorothiophenol (4FTP) capping ligand and PPh4+ counterion, as described in ref. 9. AFM analysis of the single IBAN freshly prepared and deposited on a silicon substrate (ESI, Fig. S1†) was allowed to neglect the formation of aggregates of IBAN in solution, in agreement with previous results.9,10 After confirming the nanometric size of the particles and their good dispersion, we studied their stability, first in solution, and then on a substrate.Characterization of single IBAN dissolved in solution
Fig. 2 in the main text shows the changes in the UV-vis absorption spectra of IBAN solutions in different solvents. This is the simplest system to study, where each particle is well-dispersed in solution, with no perturbations due to the substrate or to other IBAN. A highly structured spectrum was observed in all the cases, with strong molecule-like absorption displaying several well-defined peaks, corresponding to the typical features of IBAN.33 Significant changes in absorption were observed at room temperature if the IBANs were dissolved in (a) acetone and (b) dichloromethane (DCM).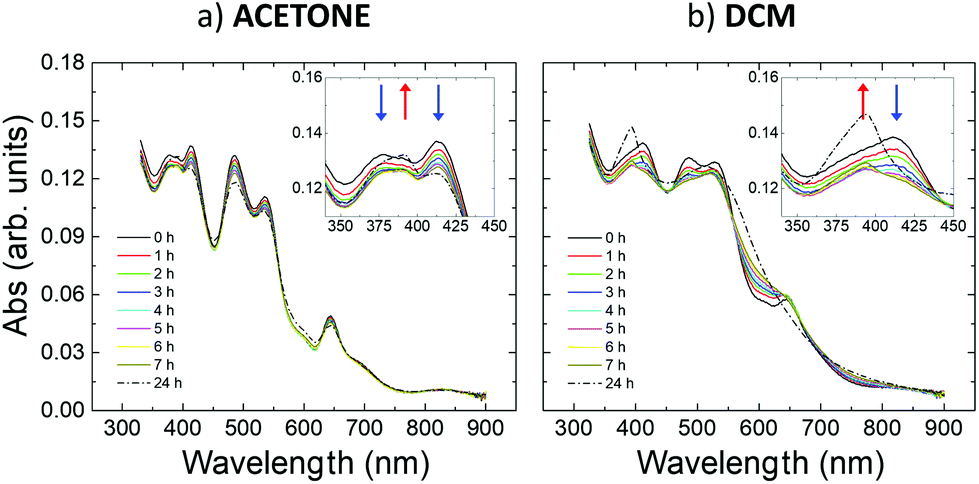 | ||
| Fig. 2 Time evolution of UV-vis absorption spectra of IBAN stored in (a) acetone and (b) DCM solutions for 24 hours. All spectra are acquired at RT. | ||
As discussed by Conn et al.,34 the solution stability was related to the ability of the solvent to coordinate with the nanoparticles.
Acetone is a reasonable coordinating solvent which stabilizes the IBAN fairly well, and the corresponding UV-vis absorption spectrum was similar to what is already reported in ref. 9 (Fig. 2a). Though, small spectral changes showed a hypochromic effect for the peaks centered around 377 nm, 390 nm, 414 nm, 485 nm, 537 nm and 644 nm, a slight hyperchromicity of the 390 nm peak, as well as a small rise of the baseline and the possible appearance of weak new features at ca. 450 and 600 nm. The relative differences between the spectra acquired over 7 h were relatively small (<7%, see details in the ESI) (Fig. S3a†). The most significant changes were mainly localized at wavelengths around 400 nm, corresponding to the contribution of the electron-rich ligands in the collective excitations of the silver core.8,9
In contrast, DCM was not a good coordinating solvent and the IBAN were not stable, as depicted in Fig. 2b, in which the spectral changes were more substantial and appeared faster than in acetone, leading in about 7 h to the disappearance of most of the bands typical of IBAN. A significant hypochromicity was observed in the 350–550 nm range. The final absorption profile was characterized by the presence of a peak at 390 nm and by a very broad band at 520 nm, which could be explained by the transformation of the isolated IBAN into larger structures with a single plasmon-like resonance.9 These changes are triggered by the solvent used; as a comparison, IBAN stored in DMF (Fig. S2†) did not show any spectral changes when stored at room temperature. Fig. S3† shows a comparison of the spectral changes observed in acetone, DCM and DMF. IBAN modification could also be obtained in DMF but only by heating at 90 °C and illuminating with light.
The spectral changes observed in DCM and, to a minor extent, in acetone were ascribable to the oxidation mechanism leading to the decomposition of the IBAN and the formation of aggregates.35 The formation of larger structures in DCM was confirmed by resonance light scattering (RLS)36,37 measurements (Fig. S5a and b†), a technique sensitive to the formation of aggregates in solution, particularly in the case of electronically coupled chromophores.
All spectroscopic evidence indicated slight solvent-dependent instability of the IBAN in acetone, and a greater instability in DCM. The changes in the absorption spectra suggested the presence of at least two structures whose relative abundance varied with solvent and time.
Supramolecular self-assembly of IBAN on a solid substrate
In general, (meta)stable suspensions of nanoparticles (or clusters) become unstable when deposited on a substrate and the solvent slowly evaporates (drop casting). The structure of the aggregates depends on the supramolecular interactions between the nanoparticles, with solvent and substrate, yielding structures ranging from low-density fractal aggregates to close-packed but amorphous aggregates or even highly ordered crystals.38–41In previous studies, large crystals of IBAN were grown in about 3 days by slow evaporation of the solvent.10 We attained a much faster growth rate using solvent vapor annealing (SVA), improving in this way the control of the self-assembling process. The key of the SVA approach is that the target molecules or particles are pre-deposited on the substrate in an amorphous layer, trying to achieve maximal disorder, and thus high thermodynamic energy. In this way, the presence of solvents can allow the system to evolve quickly from such high-energy morphology to a most favorable uniform, crystalline layer.
Thus, we first deposited a drop of IBAN in acetone on a silicon substrate, yielding an amorphous layer due to fast evaporation of the solvent; then, we promoted the IBAN self-assembly using a SVA treatment in acetone or DCM.21,22,42–44 Using this approach, large ordered structures of IBAN could self-assemble in a few hours rather than few days, allowing having a much larger density of crystals with respect to the previous studies to perform statistical analysis.
Large ordered structures could be observed already after 7 h of SVA at room temperature using either acetone or DCM as solvent (in contrast, DMF solvent could not be used for SVA due to its low vapor pressure). The assembled structures had mesoscopic size and covered a significant part of the surface, allowing their analysis using optical microscopy (Fig. 3a and c) and XRD (Fig. 3b and d). We observed the formation of two different structures: polygonal crystals with size of hundreds of microns (called C1) and needle-like crystals (called C2). SVA in acetone yielded the formation of both structures, C1 with lateral sizes spanning between 300 nm and 100 μm surrounded by C2 with a typical length of 1–10 μm. In contrast, SVA in DCM yielded only C2 with a length of up to 100 μm. XRD measurements showed that the two structures had a different out-of-plane periodicity (19.01 ± 0.01 Å for C1 and 14.67 ± 0.01 Å for C2, respectively), suggesting a different packing of the silver atoms and thiol groups in the crystals.
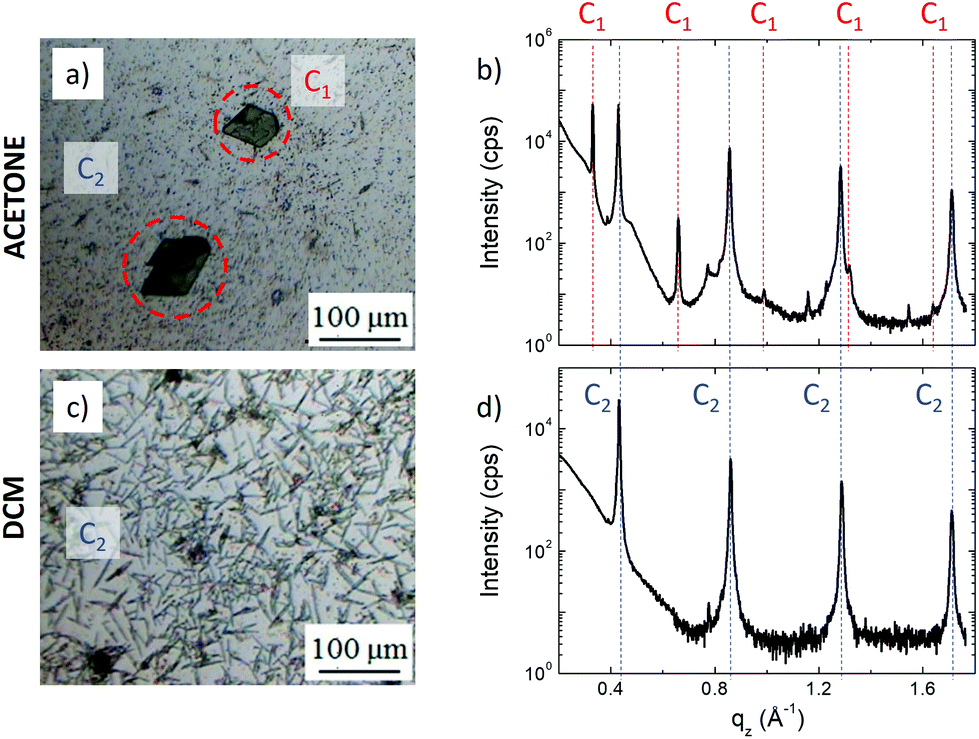 | ||
| Fig. 3 Optical images of self-assembled structures obtained by SVA in (a) acetone and (c) DCM, and corresponding (b, d) XRD patterns. SVA in acetone yielded two crystalline structures: large triclinic (C1) and layered (C2) crystals. SVA in DCM yielded only large C2 crystals. | ||
The structure of both crystals was studied with different types of X-ray scattering techniques: single crystal diffraction, specular scans, grazing-incidence wide-angle X-ray scattering (GIWAXS) and grazing-incidence small-angle scattering (GISAX). This allowed monitoring the stability of 2D and 3D structures at different annealing temperatures within the range of 25–300 °C. The upper limit corresponds to the melting temperature of the crystals, as calculated using the “melting point depression” model.45 The two structures are discussed separately here below.
XRD of the C1 single crystals showed that they composed of undamaged IBAN, arranged in a triclinic structure. The C1 single crystal was then re-dissolved in acetone and observed using optical spectroscopy, confirming that the IBAN did not undergo chemical rearrangement. The UV-vis absorption spectrum of these solutions was comparable to one of the pristine IBAN solution in acetone, even if less intense due to the tiny amount of material contained in the single crystal dissolved (Fig. S4†). XPS analysis (Fig. S6†) also revealed that the value of the Ag/S ratio measured on the single crystals (1.7 ± 0.2) was comparable to that expected from the stoichiometry of IBAN (44/30 ≈ 1.47).
C1 crystals had a solvent-free triclinic structure as shown in Fig. 4. According to this model, thiol ligands from adjacent nanoparticles are in close contact only within a narrow volume along the plane between the nearest neighbors (i.e. optimal packing model,46 see the ESI†). Similar triclinic structures were previously reported in the literature, with IBAN having different S–R ligands or with intermetallic Ag/Au nanoclusters having a total “magic number” of 44 metal atoms.8
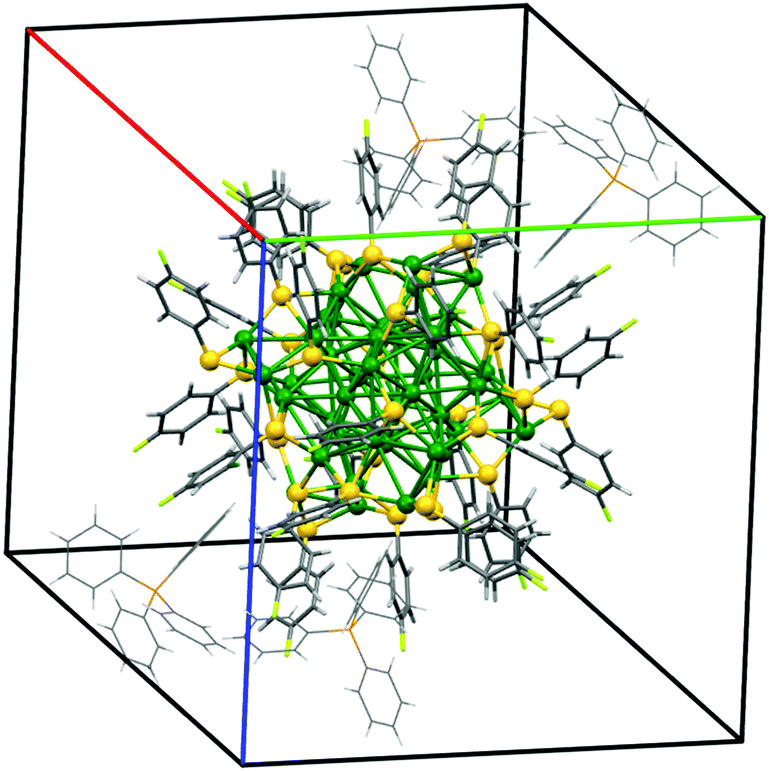 | ||
Fig. 4 C1 unit cell reconstructed using XRD of single crystals at RT. Lattice parameters: (red line) a = 20.746(4) Å, (green line) b = 21.188(4) Å, (blue line) c = 22.462(4) Å, α = 94.71(3)°, β = 115.14(3)° and γ = 117.54(3)° (space group ![[1 with combining macron]](https://www.rsc.org/images/entities/char_0031_0304.gif) , volume 7433(4) Å3). The total volume of solvent accessible voids amounts to 289 Å3. , volume 7433(4) Å3). The total volume of solvent accessible voids amounts to 289 Å3. | ||
In general, these triclinic crystals can be modelled as hard metallic cores separated by relatively soft ligands. In such a structure, the van der Waals interactions between the outer layer of thiols play a crucial role in the formation and stabilization of the crystal structure.46–48
The structure of these crystals was studied combining XRD, GIWAXS and AFM analysis (Table 1).
| Interlayer spacing (Å) | Unit cell (a) (Å) | Unit cell (b) (Å) | Interfacial angle (°) | |
|---|---|---|---|---|
| a The interlayer spacing measured with AFM showed a larger value, even if statistically comparable, due to the presence of adsorbed molecules or contaminants giving a partial overestimation in thickness measurement.49 | ||||
| XRD | 14.67 ± 0.01 | |||
| 2D-GIWAXS | 14.6 ± 0.5 | 5.588 | 3.632 | 55.58 |
| AFMa | 18 ± 4 | 55 ± 2 | ||
XRD measurements of the samples obtained by SVA in DCM (Fig. 3d) showed a clear periodicity of 14.67 ± 0.01 Å. Then, 2D-GIWAXS (Fig. 5a and Fig. S12†) provided more detailed information, showing the typical features of a decoupled periodicity along different directions, as expected in a layered structure. Out-of-plane scans (Fig. 5b) showed a z periodicity of 14.6 ± 0.5 Å, in excellent agreement with the specular XRD plots (Fig. 3b and d). It is noteworthy that in-plane scans also indicated the presence of lateral order in the stack giving a possible unit cell a = 5.588 Å, b = 3.632 Å, and γ = 55.58°, significantly different from the one observed for C1 and also not observed in previous works.15 Instead, a small signal from residual, pristine IBAN, was observed as a ring at q ≈ 0.4 Å−1, corresponding to the nearest neighbor distance for IBAN (Fig. 6a).
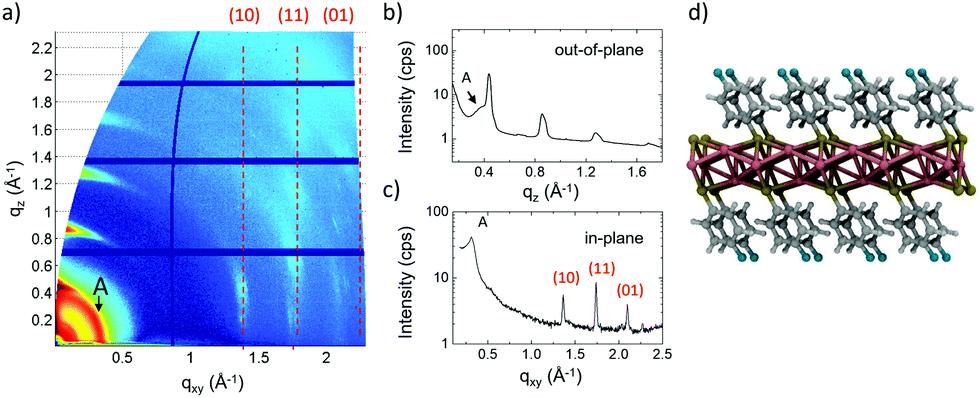 | ||
| Fig. 5 (a) 2D-GIWAXS image of C2 crystals and corresponding (b) out-of-plane and (c) in-plane scans. The presence of clusters formed by a small amount of residual IBANs is indicated by a diffraction ring at small q (labeled A). (d) The proposed C2 structure, as calculated by DFT using X-ray scattering measurements. | ||
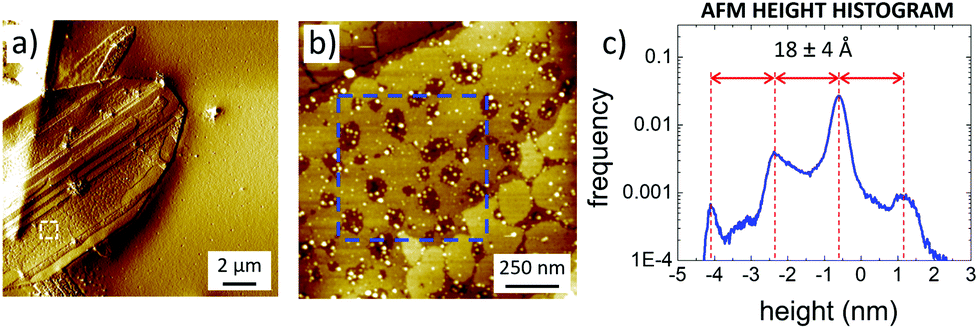 | ||
| Fig. 6 (a) Large scale AFM image of C2 crystals, gradient-filtered to better show the surface structure of the crystal. (b) Zoomed-in topographical image of the white box in (a). (c) Histogram analysis calculated from the blue box in (b), showing that different steps have a constant thickness of 18 Å. | ||
AFM (Fig. 6) showed that C2 crystals had a wide range in thickness (50–500 nm) and length (0.5–100 μm), as well as a constant angle between crystal facets of 55 ± 2° corresponding to the γ angle found using GIWAXS. AFM also confirmed the layered structure of the surface of such C2 crystals showing defects such as steps, holes and terraces, indicating a heterogeneous nucleation growth similar to that of the Terrace-Ledge-Kink model50 suggesting that the kinetics of C2 crystal self-assembly is given by the interplay of nucleation events occurred both in the bulk solution and under 2D confinement. The spacing between different terraces was 18 ± 4 Å, as measured by statistical histogram analysis (Fig. 5c), in agreement with the distance measured with XRD and GIWAXS; all the structural values obtained by the different techniques showed excellent agreement.
Such a layered structure is similar to what was observed by Dance et al.,15 who modelled it as a periodic stack of 2D layers, where the thiol substituents extend perpendicular to both sides of a central slab of Ag and S atoms. Evaporating Ag clusters on the substrate surface, also Hu et al.18 produced and characterized similar organic single-layers of Ag lamellae functionalized with alkyl thiols, with uniform thickness (≈3 nm) and in-plane ordering (i.e. 2D crystals). Because of their peculiar organization, these layered materials have also been defined as “covalent soaps”.17
XPS measurements gave a relative abundance ratio of silver sulfur atoms Ag/S = 1.6 ± 0.2, comparable to the stoichiometric one (Ag/S = 1.47) and indicated that the silver layer is mainly formed by oxidized Ag atoms, covalently bound to sulfur ones (Fig. S6c†).
The stability of IBAN and the role of ligands were investigated combining Auger spectroscopy analysis and residual gas analysis (RGA) at increasing temperature under a vacuum environment. RGA (Fig. S8†) showed that the system changed at T > 200 °C. This evidence can be ascribed to the desorption of 4-FTP ligands and/or counterions (a similar behavior was also reported for gold NPs51).
Since the RGA technique was unable to distinguish between the two chemical systems, Auger analysis was used to monitor the chemical state of silver atoms (Fig. S6†). The IBANs were stable up to T = 200 °C, and Auger data showed only the Ag+ chemical state, due to the atomic confinement in the nanometric NP core and the Ag–S bond.52 At T = 250 °C, a different state was observed in the degradation product of C1 crystals due to the transition to metallic silver (Ag0).
In summary, the data observed show that stable IBAN assembles in triclinic crystals to form C1 structures; at T > 200 °C, they undergo a melting transition, with no chemical modification of the IBAN. At T ≥ 250 °C chemical degradation of the IBAN takes place, due to the desorption of ligands.
Given by decomposition of the IBAN and the formation of aggregates in solution, C2 layered structures displayed a better thermal stability than the C1 crystals (Fig. S6 and S9†) under high vacuum (10−7 mbar) as well as in air, as also confirmed by RGA measurements (Fig. S8†). The main chemical difference between the two crystals was the chemical state of silver, as observed by Auger (Fig. S6†). Samples obtained by SVA in DCM, featuring only C2 crystals, showed a significant fraction of oxidized Ag+ up to 250 °C, well above the melting point of the crystal which can be ascribed to the pristine IBAN. Conversely, samples obtained in acetone showed only the presence of metallic silver Ag0, due to complete degradation and melting of the IBAN, already at 250 °C, as discussed before.
In situ GISAXS measurements performed during the thermal treatment (27–238 °C) under a nitrogen atmosphere showed the evolution of the C2 crystal structure obtained by DCM (Fig. S10†). Unfortunately, the presence of small aggregated pristine IBAN, discussed before, could not be avoided, giving an additional signal in the GISAXS measurements; the lack of a corresponding peak in the XRD patterns suggests that such aggregates were very small, composed of a few IBAN particles. Fig. 7a shows the evolution of the GISAXS intensity along the out-of-plane direction; Fig. 7b and c shows the variation in the normalized intensity and position of the main features, respectively. The main peak (P1) corresponded to the interlayer spacing of the C2 structure, i.e. the distance between the Ag-rich planes = 14.6 Å (Table 1). P1 intensity increased between 80 °C and 160 °C due to the combination of the crystal ordering and the Debye–Waller effect. P1 disappeared at T ≈ 210 °C. In the whole temperature range tested, the peak position did not change indicating the strong stability of the interlayer distance and, similarly, of the ligands packing. Peak P2 is attributed to the aggregates of residual IBAN, which are arranged in more ordered structure at T > 100 °C, then degraded at around 170 °C, as also suggested by the disappearance of the ring A in 2D-GIWAXS measurements (Fig. 6 and S10†). Above this temperature, the IBAN structure changed, giving peaks P3 and P4 at T > 160 °C. Given that, in this temperature range, the chemical state of silver did not change and the Ag/S ratio remained constant (Fig. S6†), these changes in GIWAXS signal are ascribed to a re-arrangement of the packing of ligands, which tended to be perpendicular to the plane (i.e. increasing of the interlayer distance). At T > 200 °C, the structures melted completely, and no periodicity was observed anymore. All the transitions observed were irreversible.
 | ||
| Fig. 7 Evolution of the different peaks observed using GISAXS at different temperatures. (a) Intensity integrated along the out-of-plane direction of GISAXS images collected in situ and real time during thermal ramp. Integrated intensity (b) of peaks 1–4 and (c) related d-spacing. | ||
The computed crystal structure showed a complete atomic reorganization of the IBAN, which implies an oxidative mechanism in which one Ag atom is added to each IBAN, with the loss of four electrons. The resulting neutral structure is optimized by constraining the lattice vectors to the best experimental estimate of the unitary cell, as obtained by GIWAXS. A P symmetry was imposed to the crystal structure, which constrains one Ag atom to the (0 1/2 0) position, where it is fully coordinated to the surrounding S and Ag atoms. The other two Ag atoms form a bridge between the sulfur sub-lattices, defining the upper and lower surfaces of a 2D layer. Each S atom is capped with a ligand, which is tilted at about 60° with respect to the plane of Ag3S2. A pictorial view of the theoretical structure is shown in Fig. 6d and S20.†
Thus, the calculated structures indicated that DCM molecules trigger the silver atoms to undergo an oxidative transformation, losing the stability given by the “magic number” 18 electron closed shell and – transforming into a more stable layered structure in which two Ag atoms maintain their formal oxidation state, while one atom of Ag is in a formal neutral state. It is noteworthy that the electron count of the resulting crystal structure leaves an unpaired electron per unit cell, suggesting the C2 crystal to be a paramagnetic and electric conductor. Qualitative magnetic force microscopy (MFM) measurements performed at room temperature (Fig. S15†) confirmed a paramagnetic behavior of C2 structures, not observed in C1 crystals. Preliminary measurements performed using C-AFM in vertical configuration provided a resistivity value of ca. 10 Ω m. Such a value can be ascribed to the presence of ligands increasing the contact resistance between the tip and the sample. Further measurements are already planned.
Conclusions
In summary, we reported a scalable chemical approach to the preparation of robust, macroscopic and ordered self-assembled structures of core–shell nanoparticles using solvent vapor annealing. We used IBAN having 44 silver atoms and 30 external S–R ligands as an ideal building block, due to their uniform dispersity and high processability. Such nanoparticles are chemically stable in the right solvent and can be stored for months or processed easily from solution, forming large crystals of pristine IBAN, similarly to normal molecules. Such crystals are held together by weak, reversible supramolecular forces, allowing them to be re-dispersed in solution to give single IBAN again. However, when exposed to suitable solvents (in particular DCM) the IBAN undergo a structural and chemical change, forming layered structures of oxidized silver atoms, bound together to form a continuous covalent structure protected on the upper and lower sides by the thiol molecules. Such covalent 2D structures show a better order and thermal stability than the 3D supramolecular crystals and have been characterized using microscopic, spectroscopic and diffraction techniques. High-quality and large-scale production are fundamental requirements in order to study the chemico-physical properties of new materials. The use of synthesized nanoparticles with uniform dispersity allowed a detailed understanding of the self-assembly processes and the properties of the produced macroscopic materials because of their reproducibility and high-crystallinity. This should be the first step paving the way for the use of other building blocks, with different structural complexities (i.e. polydispersity, ligand engineering, etc.), to produce novel structures at the macroscale.Conflicts of interest
There are no conflicts to declare.Acknowledgements
The research leading to these results has received funding from the European Union's Horizon 2020 research and innovation programme (GA no. 696656 Graphene Flagship) and the EC Marie-Curie ITN – iSwitch (GA no. 642196). The authors thank Barbara Ruzicka, Roberta Angelini, Francesca Bomboi, Daniele Catone, Patrick O'Keeffe, Stefano Turchini, Filippo Monti and Vanesa Maria Quintano Ramos for enlightening discussions and for their support.References
- G. Li and R. Jin, Acc. Chem. Res., 2013, 46, 1749–1758 CrossRef CAS PubMed.
- K. L. Kelly, E. Coronado, L. L. Zhao and G. C. Schatz, J. Phys. Chem. B, 2003, 107, 668–677 CrossRef CAS.
- A. M. Gobin, M. H. Lee, N. J. Halas, W. D. James, R. A. Drezek and J. L. West, Nano Lett., 2007, 7, 1929–1934 CrossRef CAS.
- P. K. Jain, K. S. Lee, I. H. El-Sayed and M. A. El-Sayed, J. Phys. Chem. B, 2006, 110, 7238–7248 CrossRef CAS PubMed.
- A. Verma, O. Uzun, Y. Hu, Y. Hu, H.-S. Han, N. Watson, S. Chen, D. J. Irvine and F. Stellacci, Nat. Mater., 2008, 7, 588–595 CrossRef CAS PubMed.
- I. Park, S. H. Ko, H. Pan, C. P. Grigoropoulos, A. P. Pisano, J. M. J. Fréchet, E. S. Lee and J. H. Jeong, Adv. Mater., 2008, 20, 489–496 CrossRef CAS.
- S. Sivaramakrishnan, P.-J. Chia, Y.-C. Yeo, L.-L. Chua and P. K.-H. Ho, Nat. Mater., 2007, 6, 149 CrossRef CAS PubMed.
- H. Y. Yang, Y. Wang, H. Q. Huang, L. Gell, L. Lehtovaara, S. Malola, H. Hakkinen and N. F. Zheng, Nat. Commun., 2013, 4, 8 Search PubMed.
- O. M. Bakr, V. Amendola, C. M. Aikens, W. Wenseleers, R. Li, L. Dal Negro, G. C. Schatz and F. Stellacci, Angew. Chem., Int. Ed., 2009, 48, 5921–5926 CrossRef CAS PubMed.
- A. Desireddy, B. E. Conn, J. Guo, B. Yoon, R. N. Barnett, B. M. Monahan, K. Kirschbaum, W. P. Griffith, R. L. Whetten, U. Landman and T. P. Bigioni, Nature, 2013, 501, 399–402 CrossRef CAS.
- K. M. Harkness, Y. Tang, A. Dass, J. Pan, N. Kothalawala, V. J. Reddy, D. E. Cliffel, B. Demeler, F. Stellacci, O. M. Bakr and J. A. McLean, Nanoscale, 2012, 4, 4269–4274 RSC.
- J. Zhang, Z. Sun and B. Yang, Curr. Opin. Colloid Interface Sci., 2009, 14, 103–114 CrossRef CAS.
- Y. Zhao, L. Shang, Y. Cheng and Z. Gu, Acc. Chem. Res., 2014, 47, 3632–3642 CrossRef CAS PubMed.
- G. M. Whitesides and M. Boncheva, Proc. Natl. Acad. Sci. U. S. A., 2002, 99, 4769–4774 CrossRef CAS PubMed.
- I. G. Dance, K. J. Fisher, R. M. H. Banda and M. L. Scudder, Inorg. Chem., 1991, 30, 183–187 CrossRef CAS.
- J. Duan, J. Ma, B. Wu, Q. Li, J. Fang and D. Chen, J. Mater. Chem. C, 2014, 2, 2375–2386 RSC.
- M. J. Baena, P. Espinet, M. C. Lequerica and A. M. Levelut, J. Am. Chem. Soc., 1992, 114, 4182–4185 CrossRef CAS.
- L. Hu, L. P. de la Rama, M. Y. Efremov, Y. Anahory, F. Schiettekatte and L. H. Allen, J. Am. Chem. Soc., 2011, 133, 4367–4376 CrossRef CAS PubMed.
- B. Busupalli, S. Kummara, G. Kumaraswamy and B. L. V. Prasad, Chem. Mater., 2014, 26, 3436–3442 CrossRef CAS.
- M. A. Boles, D. Ling, T. Hyeon and D. V. Talapin, Nat. Mater., 2016, 15, 141 CrossRef CAS.
- G. De Luca, W. Pisula, D. Credgington, E. Treossi, O. Fenwick, G. M. Lazzerini, R. Dabirian, E. Orgiu, A. Liscio, V. Palermo, K. Müllen, F. Cacialli and P. Samorì, Adv. Funct. Mater., 2011, 21, 1279–1295 CrossRef CAS.
- G. De Luca, E. Treossi, A. Liscio, J. M. Mativetsky, L. M. Scolaro, V. Palermo and P. Samori, J. Mater. Chem., 2010, 20, 2493–2498 RSC.
- E. Treossi, A. Liscio, X. Feng, V. Palermo, K. Müllen and P. Samorì, Small, 2009, 5, 112–119 CrossRef CAS.
- E. Treossi, A. Liscio, X. Feng, V. Palermo, K. Müllen and P. Samorì, Appl. Phys. A: Mater. Sci. Process., 2009, 95, 15–20 CrossRef CAS.
- A. Liscio, ChemPhysChem, 2013, 14, 1283–1292 CrossRef CAS PubMed.
- A. Lausi, M. Polentarutti, S. Onesti, J. R. Plaisier, E. Busetto, G. Bais, L. Barba, A. Cassetta, G. Campi, D. Lamba, A. Pifferi, S. C. Mande, D. D. Sarma, S. M. Sharma and G. Paolucci, Eur. Phys. J. Plus, 2015, 130, 1–8 CrossRef.
- W. Kabsch, Acta Crystallogr., Sect. D: Biol. Crystallogr., 2010, 66, 133–144 CrossRef CAS PubMed.
- G. M. Sheldrick, Acta Crystallogr., Sect. A: Found. Crystallogr., 2015, 71, 3–8 CrossRef PubMed.
- J. Clark Stewart, D. Segall Matthew, J. Pickard Chris, J. Hasnip Phil, I. J. Probert Matt, K. Refson and C. Payne Mike, Zeitschrift für Kristallographie – Crystalline Materials, 2005, 220, 567–570 Search PubMed.
- J. P. Perdew, K. Burke and M. Ernzerhof, Phys. Rev. Lett., 1996, 77, 3865–3868 CrossRef CAS.
- E. R. McNellis, J. Meyer and K. Reuter, Phys. Rev. B: Condens. Matter, 2009, 80, 205414 CrossRef.
- H. J. Monkhorst and J. D. Pack, Phys. Rev. B: Solid State, 1976, 13, 5188–5192 CrossRef.
- L. G. AbdulHalim, S. Ashraf, K. Katsiev, A. R. Kirmani, N. Kothalawala, D. H. Anjum, S. Abbas, A. Amassian, F. Stellacci, A. Dass, I. Hussain and O. M. Bakr, J. Mater. Chem. A, 2013, 1, 10148–10154 RSC.
- B. E. Conn, A. Desireddy, A. Atnagulov, S. Wickramasinghe, B. Bhattarai, B. Yoon, R. N. Barnett, Y. Abdollahian, Y. W. Kim, W. P. Griffith, S. R. J. Oliver, U. Landman and T. P. Bigioni, J. Phys. Chem. C, 2015, 119, 11238–11249 CrossRef CAS.
- B. E. Conn, A. Atnagulov, B. Bhattarai, B. Yoon, U. Landman and T. P. Bigioni, J. Phys. Chem. C, 2018, 122, 13166–13174 CrossRef CAS.
- R. Pasternack and P. Collings, Science, 1995, 269, 935–939 CrossRef CAS PubMed.
- P. J. Collings, E. J. Gibbs, T. E. Starr, O. Vafek, C. Yee, L. A. Pomerance and R. F. Pasternack, J. Phys. Chem. B, 1999, 103, 8474–8481 CrossRef CAS.
- G. A. Waychunas, Rev. Mineral. Geochem., 2001, 44, 105–166 CrossRef CAS.
- V. Palermo and P. Samori, Angew. Chem., Int. Ed., 2007, 46, 4428–4432 CrossRef CAS PubMed.
- E. Rabani, D. R. Reichman, P. L. Geissler and L. E. Brus, Nature, 2003, 426, 271 CrossRef CAS PubMed.
- T. A. Witten and L. M. Sander, Phys. Rev. Lett., 1981, 47, 1400–1403 CrossRef CAS.
- G. De Luca, A. Liscio, G. Battagliarin, L. Chen, L. M. Scolaro, K. Mullen, P. Samori and V. Palermo, Chem. Commun., 2013, 49, 4322–4324 RSC.
- G. De Luca, A. Liscio, F. Nolde, L. M. Scolaro, V. Palermo, K. Mullen and P. Samori, Soft Matter, 2008, 4, 2064–2070 RSC.
- G. De Luca, A. Liscio, P. Maccagnani, F. Nolde, V. Palermo, K. Müllen and P. Samorì, Adv. Funct. Mater., 2007, 17, 3791–3798 CrossRef CAS.
- S. L. Lai, J. Y. Guo, V. Petrova, G. Ramanath and L. H. Allen, Phys. Rev. Lett., 1996, 77, 99–102 CrossRef CAS.
- U. Landman and W. D. Luedtke, Faraday Discuss., 2004, 125, 1–22 RSC.
- W. D. Luedtke and U. Landman, J. Phys. Chem., 1996, 100, 13323–13329 CrossRef CAS.
- B. Yoon, W. D. Luedtke, R. N. Barnett, J. Gao, A. Desireddy, B. E. Conn, T. Bigioni and U. Landman, Nat. Mater., 2014, 13, 807 CrossRef CAS.
- A. Kühle, A. H. Sorensen, J. B. Zandbergen and J. Bohr, Appl. Phys. A, 1998, 66, S329–S332 CrossRef.
- M. A. Boles, M. Engel and D. V. Talapin, Chem. Rev., 2016, 116, 11220–11289 CrossRef CAS PubMed.
- H. Kang, E. Ito, M. Hara and J. Noh, J. Nanosci. Nanotechnol., 2016, 16, 2800–2803 CrossRef CAS.
- M. Ramstedt and P. Franklyn, Surf. Interface Anal., 2010, 42, 855–858 CrossRef CAS.
Footnote |
| † Electronic supplementary information (ESI) available. See DOI: 10.1039/c8nr07109h |
| This journal is © The Royal Society of Chemistry 2018 |