
 Open Access Article
 This Open Access Article is licensed under a Creative Commons Attribution-Non Commercial 3.0 Unported Licence
3D microfluidic ex vivo culture of organotypic tumor spheroids to model immune checkpoint blockade
Amir R.
Aref
a,
Marco
Campisi
 acde,
Elena
Ivanova
ab,
Andrew
Portell
ab,
Dalia
Larios
ab,
Brandon P.
Piel
a,
Natasha
Mathur
ab,
Chensheng
Zhou
a,
Raven Vlahos
Coakley
a,
Alan
Bartels
a,
Michaela
Bowden
a,
Zach
Herbert
a,
Sarah
Hill
a,
Sean
Gilhooley
a,
Jacob
Carter
a,
Israel
Cañadas
a,
Tran C.
Thai
a,
Shunsuke
Kitajima
a,
Valeria
Chiono
e,
Cloud P.
Paweletz
ab,
David A.
Barbie
ab,
Roger D.
Kamm
cd and
Russell W.
Jenkins
*af
acde,
Elena
Ivanova
ab,
Andrew
Portell
ab,
Dalia
Larios
ab,
Brandon P.
Piel
a,
Natasha
Mathur
ab,
Chensheng
Zhou
a,
Raven Vlahos
Coakley
a,
Alan
Bartels
a,
Michaela
Bowden
a,
Zach
Herbert
a,
Sarah
Hill
a,
Sean
Gilhooley
a,
Jacob
Carter
a,
Israel
Cañadas
a,
Tran C.
Thai
a,
Shunsuke
Kitajima
a,
Valeria
Chiono
e,
Cloud P.
Paweletz
ab,
David A.
Barbie
ab,
Roger D.
Kamm
cd and
Russell W.
Jenkins
*af
aDepartment of Medical Oncology, Dana-Farber Cancer Institute, Boston, MA 02215, USA. E-mail: rwjenkins@partners.org
bBelfer Center for Applied Cancer Science, Dana Farber Cancer Institute, Boston, Massachusetts 02215, USA
cDepartment of Mechanical Engineering, Massachusetts Institute of Technology, Cambridge, MA 02139, USA
dDepartment of Biological Engineering, Massachusetts Institute of Technology, Cambridge, MA 02139, USA
eDepartment of Mechanical and Aerospace Engineering, Politecnico di Torino, Corso Duca degli Abruzzi 24, 10129 Turin, Italy
fDivision of Medical Oncology, Massachusetts General Hospital Cancer Center, Harvard Medical School, Boston, MA 02114, USA
First published on 5th September 2018
Abstract
Microfluidic culture has the potential to revolutionize cancer diagnosis and therapy. Indeed, several microdevices are being developed specifically for clinical use to test novel cancer therapeutics. To be effective, these platforms need to replicate the continuous interactions that exist between tumor cells and non-tumor cell elements of the tumor microenvironment through direct cell–cell or cell–matrix contact or by the secretion of signaling factors such as cytokines, chemokines and growth factors. Given the challenges of personalized or precision cancer therapy, especially with the advent of novel immunotherapies, a critical need exists for more sophisticated ex vivo diagnostic systems that recapitulate patient-specific tumor biology with the potential to predict response to immune-based therapies in real-time. Here, we present details of a method to screen for the response of patient tumors to immune checkpoint blockade therapy, first reported in Jenkins et al. Cancer Discovery, 2018, 8, 196–215, with updated evaluation of murine- and patient-derived organotypic tumor spheroids (MDOTS/PDOTS), including evaluation of the requirement for 3D microfluidic culture in MDOTS, demonstration of immune-checkpoint sensitivity of PDOTS, and expanded evaluation of tumor–immune interactions using RNA-sequencing to infer changes in the tumor–immune microenvironment. We also examine some potential improvements to current systems and discuss the challenges in translating such diagnostic assays to the clinic.
Introduction
Monoclonal antibodies targeting immune checkpoints (e.g. PD-1/PD-L1 axis, CTLA-4) have demonstrated clinical activity in several malignances (Fig. 1).1,2 Unlike molecular targeted therapies (e.g. BRAF and EGFR inhibitors), which can be employed in patients whose tumors harbor select oncogenic driver mutations (e.g. BRAF V600E, EGFR exon19del or L858R), to date there are no reliable predictors of response for immune checkpoint inhibitors. PD-L1 expression predicts response to anti-PD-1/PD-L1 antibodies in some, but not all patients, and is increasingly recognized as an imperfect marker of activity.3 Intense research efforts are now underway to identify predictive biomarkers of response, toxicity and resistance to immunotherapeutic agents.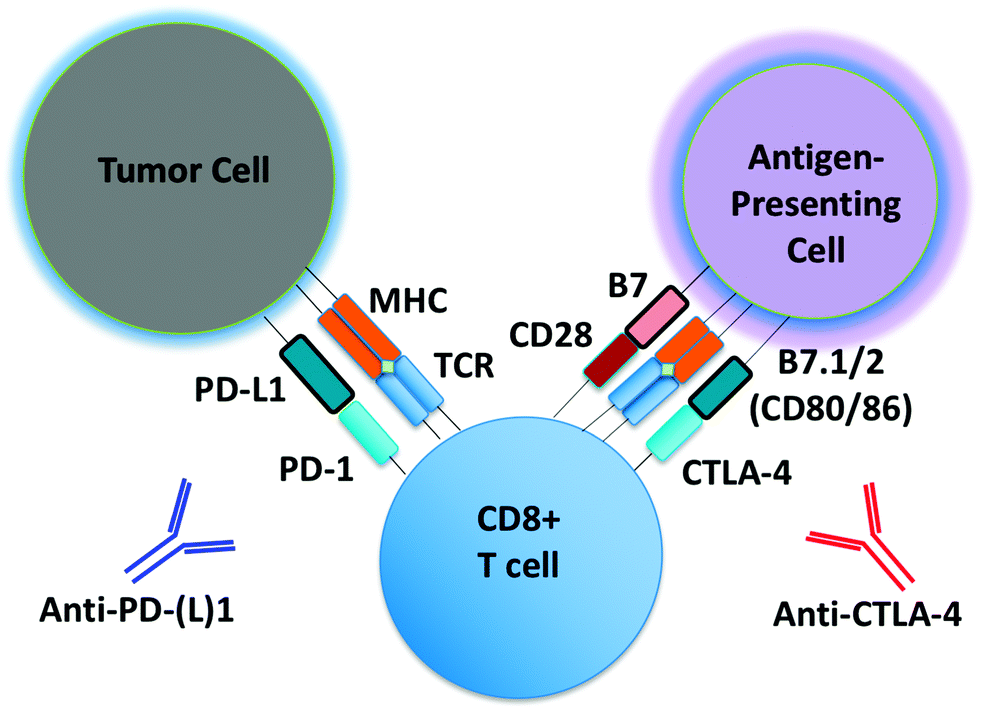 | ||
| Fig. 1 Schematic of PD-1/CTLA-4 blockade. Schematic detailing basic steps involved in generation of tumor-specific T cells. Shown is a schematic of a tumor cell, CD8 effector T cell, and an antigen-presenting cell (APC), with associated cell–cell interactions via PD-1/PD-L1 and CTLA-4/B7. Tumor-associated antigens or neo-antigens are presented by major histocompatibility complex (MHC) on APCs or tumor cells to T cells with appropriate T-cell receptor (TCR). CD28 co-activating receptor on T cells binds B7 on APCs. Anti-PD-(L)1 and anti-CTLA-4 antibodies are shown. | ||
There is great interest in studying other immune checkpoints and novel combinations of immune modulatory agents to overcome both innate and acquired resistance to immune checkpoint blockade (ICB).4,5 Dual ICB with combination PD-1 and CTLA-4 antibody treatment has recently shown dramatic response rates in patients with metastatic melanoma, however roughly half of patients experienced significant toxicity from the treatment regimen.6,7 Several clinical trials of combinations of immunotherapeutic agents with molecular targeted therapies (e.g. kinase inhibitors), cytotoxic chemotherapy, and/or radiation are underway, all in the effort to provide long-lasting disease control to more patients.5 While the number of these ‘rational’ combination trials continues to increase, our understanding of the ‘backbone’ therapy of PD-1 or CTLA-4 blockade remains far from complete.
Mechanisms of immune escape and resistance to ICB are diverse, owing to insufficient numbers of anti-tumor T cells present, or ineffective immune response due to local (e.g. tumor or stromal derived) factors that impair the cytotoxic immune response.8–11 Approaches to identify cellular, pathologic, immunologic, or molecular features that distinguish responding from non-responding patients have evaluated local features in the tumor microenvironment using immunohistochemical or transcriptomic evaluation of frozen or fixed tissue from biopsies, and circulating levels of select immune cells or cytokines.12,13 As biopsies from patients who have responded to ICB often demonstrate the presence of an inflammatory infiltrate within the tumor, and gene expression profiling studies have confirmed upregulation of pro-inflammatory cytokines and chemokines within tumors following PD-1 blockade, there is increasing interest in understanding the role of the tumor microenvironment in the response to ICB.12,13 Development of more sophisticated pre-clinical and ex vivo cancer models that recapitulate human tumor biology may facilitate efforts to predict response to targeted and immune-based therapies.
There is growing interest in capitalizing on the increasing availability of 3D culture systems to tackle important questions in cancer biology, especially with the recent integration of microfluidic systems. 3D-microfluidic culture systems now offer a greater level of precision for evaluating a host of complex biological phenomena in relevant model systems.14 With the advent of ICB and the expanding number of novel immunotherapies and combination therapies, there is increasing interest in the use of 3D culture systems to interrogate the tumor immune microenvironment.15
Recently, we described a novel method of profiling response to PD-1 blockade using organotypic tumor spheroids cultured in collagen hydrogels suspended in a 3D microfluidic device.5 Patient- or murine-derived organotypic tumor spheroids (MDOTS/PDOTS) retain autologous immune cells and respond to PD-1 blockade ex vivo.16,17 Using murine tumors from established PD-1 responsive or resistant tumors, we were able to recapitulate sensitivity and resistance to ICB ex vivo. MDOTS/PDOTS also served as a platform to test novel combination therapies in combination with PD-1 blockade, including inhibitors or TBK1 (ref. 17) and CDK4/6,17 both of which enhanced response to PD-1 blockade ex vivo and subsequently in vivo efficacy was confirmed. In this paper, we will describe in detail the methods of MDOTS/PDOTS platform (“version 1.0”), and propose some novel applications and future directions.
Materials and methods
Patient samples
Tumor samples were collected and analyzed according to Dana-Farber/Harvard Cancer Center IRB-approved protocols. Informed consent was obtained from all patients. These studies were conducted according to the Declaration of Helsinki and approved by the MGH and DFCI IRBs.Syngeneic murine models
All animal experiments were performed in compliance with established ethical regulations and were approved by the Dana-Farber Animal Care and Use Committee. MC38 murine colon adenocarcinoma cells were generously provided by Dr. Gordon Freeman (DFCI) received under an MTA from Dr. Jeffrey Schlom of NCI (Bethesda, MD). CT26 colon carcinoma cells were purchased from ATCC (2015). Mouse tumor implantations were performed as previously described.17Device design and fabrication
MDOTS and PDOTS were evaluated using ‘3-D cell culture chip’ (DAX-1, AIM BIOTECH, https://www.aimbiotech.com/), as previously described.16,18 Microfluidic device design and fabrication using cyclic olefin polymer (COP) conducted at AIM BIOTECH. Briefly, the single layer slide format (75 mm × 25 mm) device or ‘chip’, consists of 3 microfluidic chambers each with a central gel channel (width 1.3 mm) flanked by two media channels (width 0.5 mm). The height of the microfluidic chambers is 0.25 mm. Media channels were designed including larger reservoirs to prevent over-aspiration (Fig. 3A–C).Preparation of MDOTS/PDOTS and ex vivo microfluidic 3D culture
MDOTS/PDOTS (S2 fraction; 40–100 μm) containing tumor, immune, and stromal cells were prepared as described previously.17 Briefly, fresh tumor specimens (murine and human patients) were received in media (DMEM or RPMI) on ice and minced in a standard 10 cm dish using sterile forceps and scalpel. Minced tumor was resuspended in high-glucose DMEM (or RPMI, for CT26) with 100 U mL−1 type IV collagenase, and 15 mM HEPES (Life Technologies, Carlsbad, CA). Samples were incubated at 37 °C and evaluated every 15 minutes to monitor for adequate formation of spheroids with modest release of single cells. Following digestion (range: 15–60 min), equal volumes of media were added to minced tumor specimens and samples were pelleted and resuspended in fresh media and passed over 100 μm and 40 μm filters sequentially to obtain S1 (>100 μm), S2 (40–100 μm), and S3 (<40 μm) spheroid fractions, which were subsequently transferred to ultra low-attachment tissue culture plates. An aliquot of the S2 fraction was pelleted and resuspended in type I rat tail collagen and the spheroid–collagen mixture was injected into the center gel region of the 3D microfluidic chamber (10 μL per each microfluidic chamber). After incubation for 30 minutes at 37 °C in sterile humidity chambers, collagen hydrogels containing PDOTS/MDOTS were hydrated with media with or without indicated therapeutic monoclonal antibodies – MDOTS: isotype control IgG (10 μg mL−1, clone 2A3) or anti-PD-1 (10 μg mL−1, clone RMP1-14); PDOTS: anti-PD-1 (pembrolizumab, 250 μg mL−1), anti-CTLA-4 (ipilimumab, 50 μg mL−1), or combination (250 μg mL−1 pembrolizumab + 50 μg mL−1 ipilimumab), as previously shown.17Live/Dead and immunofluorescence staining of MDOTS/PDOTS
Live/Dead fluorescence staining was performed using AO/PI staining solution, as previously described.17 Following incubation with AO/PI or Hoechst/PI (20 min, room temp, protected from light) or Hoechst/PI (45 min, 37 °C, 5% CO2), images were obtained. Image capture and analysis were performed using a Nikon Eclipse 80i fluorescence microscope equipped with Z-stack (Prior), motorized stage (ProScan) and ZYLA5.5 sCMOS camera (Andor) and NIS-Elements AR software package. Live and dead cell quantitation was performed by measuring total cell area of each dye. For direct immunofluorescence staining coupled with Live/Dead analysis, unfixed live MDOTS or PDOTS were washed with PBS and blocked with Fc receptor (FcR) blocking reagent (PDOTS, Miltenyi; MDOTS, BioLegend) for 30 minutes at room temperature. Directly conjugated antibodies for PDOTS were CD326 EpCAM-PE (clone 9C4), CD45-AlexaFluor-488 (HI30), CD8a-AlexaFluor488 (RPA-T8); for MDOTS, CD45-AlexaFluor488 or 647 (30-F11), CD8α-PE (53-6.7; BioLegend). Antibodies were diluted 1![[thin space (1/6-em)]](https://www.rsc.org/images/entities/char_2009.gif) :50 in 10 μg mL−1 solution of Hoechst 33342 (in PBS) and loaded into microfluidic chambers for 1 hour incubation at room temperature in the dark. Spheroids were washed twice with PBS with 0.1% Tween20 followed by PBS. For viability assessment, microfluidic chambers were loaded with 1:1000 solution of calcein AM in PBS.
:50 in 10 μg mL−1 solution of Hoechst 33342 (in PBS) and loaded into microfluidic chambers for 1 hour incubation at room temperature in the dark. Spheroids were washed twice with PBS with 0.1% Tween20 followed by PBS. For viability assessment, microfluidic chambers were loaded with 1:1000 solution of calcein AM in PBS.
Live/Dead analysis in 2D conditions
S2 fraction of CT26 tumors was split and seeded in 3-D cell culture chips parallel with flat bottom CellBind surface 384-well plate (Corning, #3683). 2D experiment was performed as following: spheroids were loaded in wells of 384-well plate in triplicates in 2 densities of ∼15 and ∼30 spheroids/well in cultural media containing either IgG or αPD-1 at 10 μg mL−1. Plate was incubated in humidity chamber at 37 °C, 5% CO2 for 5 days. At the end media was gently removed and 20 μL of AOPI (Nexcelom) was loaded into each well. After 20 minute incubation in the dark at RT cells were imaged on inverted Nikon Eclipse Ti microscope equipped with Nikon DS-Qi1Mc camera using NIS-Elements software. Total area of AO-stained live cells versus propidium iodide-stained dead cells was quantified. CT26 tumor spheroids seeded in both high and low densities produced similar results, graph for the high density is shown.Cytokine profiling
Media collected from MDOTS/PDOTS culture at the indicated time point were removed (by micropipette) and transferred to 1.5 mL Eppendorf tubes. After collection, tubes containing conditioned media were placed on dry ice before storage at −80 °C. For bead-based cytokine profiling, conditioned media were thawed on ice. Four panels of multiplex ELISA assays were performed utilizing a bead-based immunoassay approach, the Thermo Fisher Immuno-Oncology Checkpoint 14-plex Human ProcartaPlex™ panel 1 (Cat No. EPX14A-15803-901), Bio-Rad Bio-Plex Pro Human Cytokine 27-plex panel (Cat No. m500kcaf0y), and Human Inflammation 37-plex panel (Cat No. 171AL001M), and Human Cytokine 40-plex panel (Cat No. 171AK99MR2). MDOTS/PDOTS conditioned media concentration levels (pg mL−1) of each protein were derived from 5-parameter curve fitting models, and fold changes (relative to untreated or IgG control) were calculated and plotted as log2FC. Lower and upper limits of quantitation (LLOQ/ULOQ) were imputed from standard curves for cytokines above or below detection. Conditioned media from PDOTS were assayed neat. Only detectable cytokines were included in the analysis.RNA-sequencing (RNA-seq) and CIBERSORT
RNA-seq was performed as previously described.1 For RNA-seq studies, SI-NET PDOTS were cultured in 3D cell culture chips (AIM BIOTECH). In brief, RNA lysates were prepared from SI-NET PDOTS on day 9 using the lysis buffer from Agencourt RNAdvance kit (using 1:20 proteinase K). Conditioned media was removed (as described above), before 200 mL of lysis buffer (with proteinase K) was added to each microfluidic chamber. Devices were incubated for 25 min at 37 °C, lysates were collected from each microfluidic chamber, and were transferred to RNase-free microcentrifuge tubes, and then stored at −80 °C. RNA were extracted using RNAdvance Tissue kit (Beckman Coulter, Cat. No. A32649). RNA quantity and quality were assessed using Quant-iT™ RiboGreen™ RNA Assay Kit (Thermo Fisher, Cat. No. R11490) and Agilent Bioanalyzer RNA 6000 pico kit (Agilent, Cat. No. 5067-1513). RNA libraries were prepared from 10 ng RNA per sample using Illumina Truseq RNA Access protocol (Illumina, Cat No. RS-301-2001). RNA-seq was performed at the DFCI Molecular Biology Core Facilities (Illumina NextSeq 500). RNA-seq data were aligned and differential expression analysis were performed using VIPER pipeline, as described.19 CIBERSORT was performed as described20 (https://cibersort.stanford.edu/).
Results & discussion
Sample preparation: basic principles and practical experience
To recapitulate the biology of the tumor immune microenvironment to model PD-1 blockade, one needs viable tumor tissue, autologous tumor-infiltrating immune cells, and an appropriate device and model extracellular matrix to permit 3-dimensional culture. When devising the workflow for PDOTS/MDOTS processing, we aimed for simplicity. As some immune cells lose viability within hours of collection, we felt it was essential to minimize the time required for tumor specimen processing. At the same time, we avoided added growth factors or cytokines to selectively support the viability or growth of lymphoid or myeloid cells as this might artificially alter biological response to ICB. Therefore, we used traditional cell culture media (DMEM or RPMI) supplemented with 10% FBS. In our initial pilot studies, this standard culture medium supported the growth of both MDOTS and PDOTS so further modification was not necessary.Generation of MDOTS/PDOTS requires fresh tumor specimens from immune competent mouse models or patients. Several syngeneic murine cancer models have been profiled, including MC38 colon, CT26 colon, B16 melanoma, Lewis lung carcinoma, and GL261 glioblastoma. Diverse solid tumor types have been profiled to date, including primary lesions, lymphadenectomy specimens, pleural effusions, ascites fluid, and resected metastases. Baseline viability and sample size is essential for immune cell profiling and ex vivo culture. Surgical (excisional) specimens are ideal for PDOTS preparation, and are similar to the explanted murine tumors used for MDOTS preparation (Fig. 2A).
 | ||
| Fig. 2 MDOTS/PDOTS workflow. (A and B), A tumor specimen is received and subjected to physical and enzymatic dissociation (A), yielding dissociated tumor tissue (B) containing spheroids, single cells, and macroscopic tumor. (C and D), This heterogeneous mixture is then sequentially applied to 100 μm and 40 μm filters (C) to obtain three separate fractions (D), S1 (>100 μm), S2 (40–100 μm), and S3 (<40 μm). E, The S2 fraction is pelleted and resuspended in collagen to be injected into the microfluidic culture device for subsequent ex vivo culture with indicated terminal readouts. Scale bars indicate 100 μm (D and E). | ||
While bacterial contamination was rare, all experiments were performed with antibiotics (1% penicillin–streptomycin). For primary colorectal cancer specimens (exposed to the gastrointestinal lumen and commensal bacteria), addition of metronidazole and gentamicin was required for Gram negative and anaerobic bacteria. For oropharyngeal head and neck squamous cell carcinomas, anti-fungal coverage (e.g. amphotericin B) was required to prevent contamination with Candida. Bacterial or fungal contamination was not encountered for cutaneous metastases, as the skin was sterilized prior to obtaining the excisional biopsy.
There is no minimum size cutoff, but rather sample quality, cellular viability, and immune cell composition are more important characteristics. For example, fine needle aspirates (FNAs) and core needle biopsies often yield far fewer cells than surgical (excisional) biopsies, and in our hands viability is frequently poorer from needle biopsies. On the rare occasion in which core needle biopsy yields viable cells and spheroids, there is often an insufficient number of PDOTS for extensive ex vivo profiling, thereby limiting the number of experimental conditions and replicates that are possible. On the other hand, pleural effusions and ascitic (peritoneal) fluid usually in cancer patients often generate at least 0.5–1 liter of fluid, and for most adenocarcinomas (e.g. lung, thyroid, breast) tumor cells are already aggregated with immune cells in multicellular spheroids.
With the exception of pleural effusions and peritoneal fluid (ascites) specimens, the initial step in processing involves physical and enzymatic dissociation using a limited collagenase digestion (see Materials and methods). Type IV collagenase is used in this step as it has low tryptic activity, and it was used at a dilute concentration to avoid complete dissociation of MDOTS or PDOTS to single cells. The amount of time required to digest minced tumor tissue with type IV collagenase (in media) varies from sample to sample, and tumor to tumor. In general more fibrous tumors (e.g. mesothelioma) require longer incubation times (up to 30–60 min), compared to most samples (20–30 min). Some murine tumor explants require only very brief collagenase treatment, as longer incubations have yielded an excess of single cells relative to spheroids.
Following physical and enzymatic dissociation, the minced and digested tumor specimen contains a mixture of macroscopic undigested tissue, spheroids, and single cells (Fig. 2B). Spheroids are isolated following passage of the dissociated specimen over a series of filters (100 μm and 40 μm) (Fig. 2C and D).
The second fraction (S2; 40–100 μm) is subsequently used for MDOTS/PDOTS profiling and ex vivo culture (Fig. 2E). S1 and S3 fractions can be frozen or banked, or used for immune cell profiling.
3D microfluidic culture
The majority of our studies to date utilized the commercially available DAX-1 3-D cell culture chip (AIM Biotech). Three self-contained microfluidic chambers are present on a single ‘3D cell culture chip’ (Fig. 3A). Following preparation of the S2 fraction, MDOTS/PDOTS are pelleted briefly and resuspended in a neutral pH collagen solution (see Materials and methods). The collagen solution is prepared fresh for each experiment and is always prepared in excess. Pelleted MDOTS or PDOTS are initially re-suspended in a smaller volume of collagen (e.g. 100–200 μL) based on the size of the pellet, and then 10 μL is loaded into a single microfluidic chamber to confirm spheroid density and/or used for automated cell counting. Methods to accurately quantify the number of cells per spheroid (or cells per microfluidic chamber) are limited, but we will adjust the volume of collagen with a given number of spheroids to obtain approximately 10–20000 cells per microfluidic chamber (based on automated cell counting technologies).
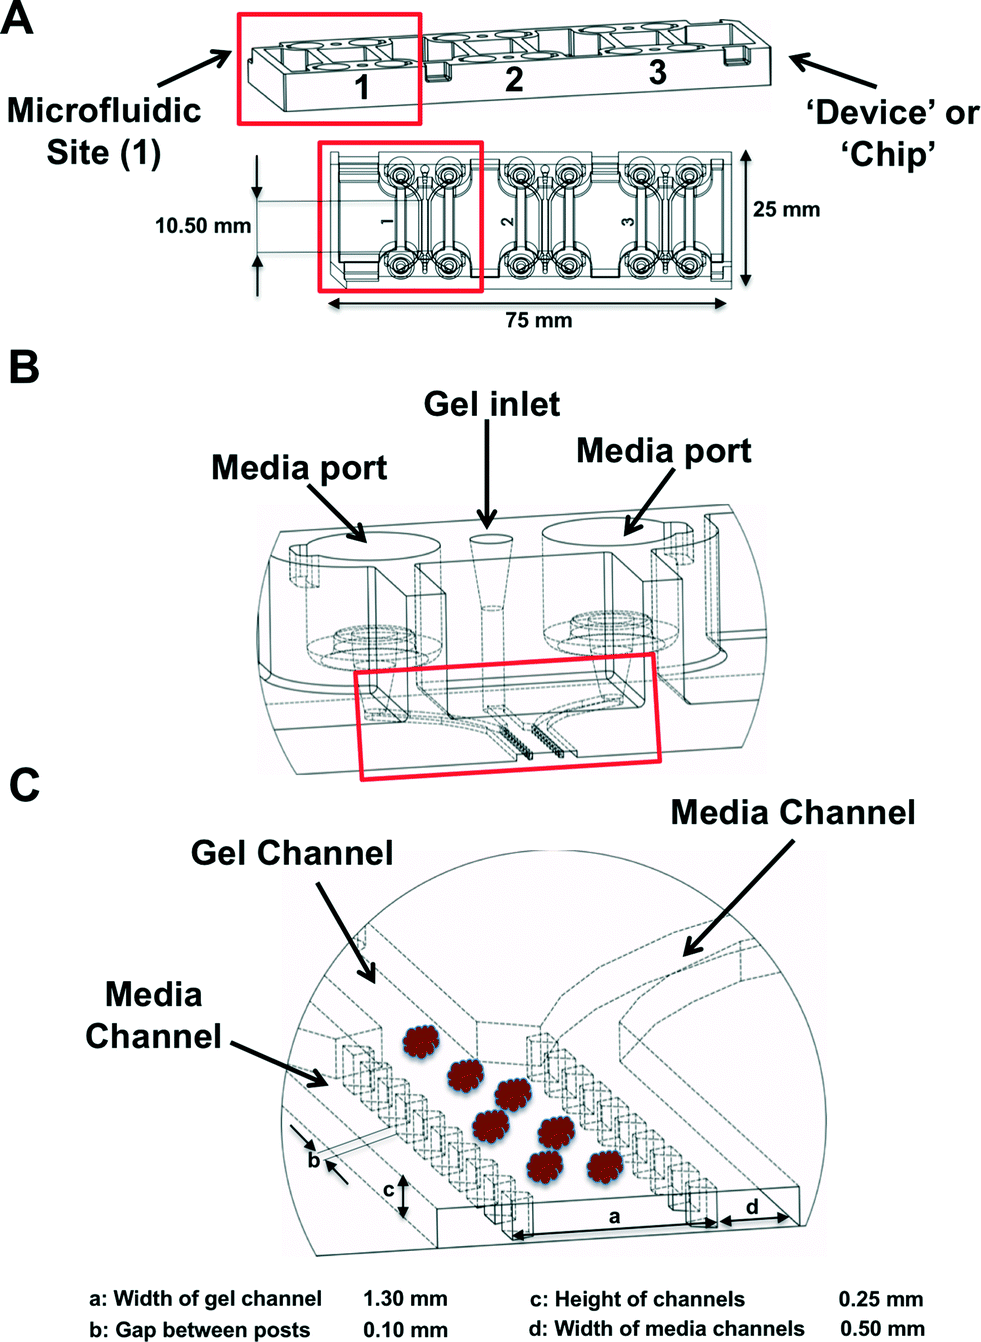 | ||
| Fig. 3 Microfluidic device. (A), The 3D cell culture chip (AIM Biotech) is shown with three independent microfluidic chambers per chip. Red rectangle identifies a single microfluidic chamber in the 3D cell culture chip. (B and C), Each device contains a center gel region with posts separating the gel region from the anti-parallel side channels. Gel loading port and media ports labeled (B), along with center and side channels (C). | ||
The collagen–spheroid mixture is kept on ice and injected into the upper and lower gel loading ports, such that the collagen–spheroid mixture extends almost half way to the opposite gel loading port, before the pipet tip is transferred to the opposite (lower) gel loading port to inject the remaining spheroids, such that the two pools of spheroids ‘meet’ in the middle of the gel region (Fig. 3A–C). After all microfluidic chambers are loaded in a similar fashion, they are transferred from the tissue culture hood into sterile humidity chambers and placed in a sterile incubator (37 °C) for 30 min. During this incubation, the culture media is prepared with the various antibody or drug treatments. After the 30 min incubation is complete, each microfluidic chamber is hydrated with 250–300 μL of media (depending on the downstream application and frequency of media changes) containing the desired final concentration of the drug or antibody of interest. The chambers are then returned to the incubator in the aforementioned humidity chamber and can be cultured from 5–9 days (5–6 days routinely, especially for MDOTS which grow quickly).
MDOTS/PDOTS readouts
In the initial publication describing MDOTS/PDOTS methodology (Jenkins et al.),17 we featured five different methods of analysis of MDOTS/PDOTS: light/phase contrast microscopy, time-lapse (live) imaging, immunofluorescence microscopy, Live/Dead imaging, and secreted cytokine profiling. Much of the routine analysis of ex vivo response to PD-1 blockade focused on dynamic secreted cytokine changes using bead-based cytokine profiling and fluorescence imaging using viability dyes for quantitative live/dead assessment.Evaluation of immune-mediated tumor cell killing by effector CD8 T cells is central to the evaluation of ex vivo profiling of PD-1 blockade. In our initial publication,16 and companion study featuring PDOTS/MDOTS,17 dual labeling fluorescence dyes for both qualitative and quantitative Live/Dead imaging was performed with acridine orange (AO) and propidium iodide (PI). AO/PI labeling for Live/Stain fluorescence Live/Dead staining has been in use for several decades, and are commercially available, inexpensive, and easy-to-use. PI is a cell impermeable DNA dye that only stains cells following membrane damage (e.g. necrosis or late apoptosis) after which it binds nuclear DNA. AO is a membrane-permeable nucleic acid-binding dye. Therefore, live nucleated cells emit green fluorescent signal (AO permeable, PI excluded), whereas dead cells become permeable to PI, and pure red fluorescence is evident in dead cells due to quenching of green fluorescence by PI due to Forster (fluorescence) resonance energy transfer (FRET). Shown are MC38 MDOTS treated with isotype control IgG antibody or anti-PD-1 antibody (Fig. 4A) where treatment with the anti-PD-1 antibody results in CD8 T-cell-mediated tumor cell killing, as previously demonstrated.17 Modifications to this protocol have been used with Hoechst 33342 (Ho) as a viability dye, instead of AO (Fig. 4B). Ho/PI staining can be a useful alternative for viability staining of cells with large cell size, high cytoplasm:nucleus ratio, and/or multiple cellular projections (e.g. CT26 murine colon carcinoma cells), to make threshold-setting more feasible. Quantification of Ho/PI and AO/PI fluorescence, as shown for CT26 MDOTS, demonstrates that sensitivity to PD-1 blockade is maintained in 3D microfluidic culture, but cannot be detected using MDOTS in 2D culture using 384-well plates (Fig. 4C and D).
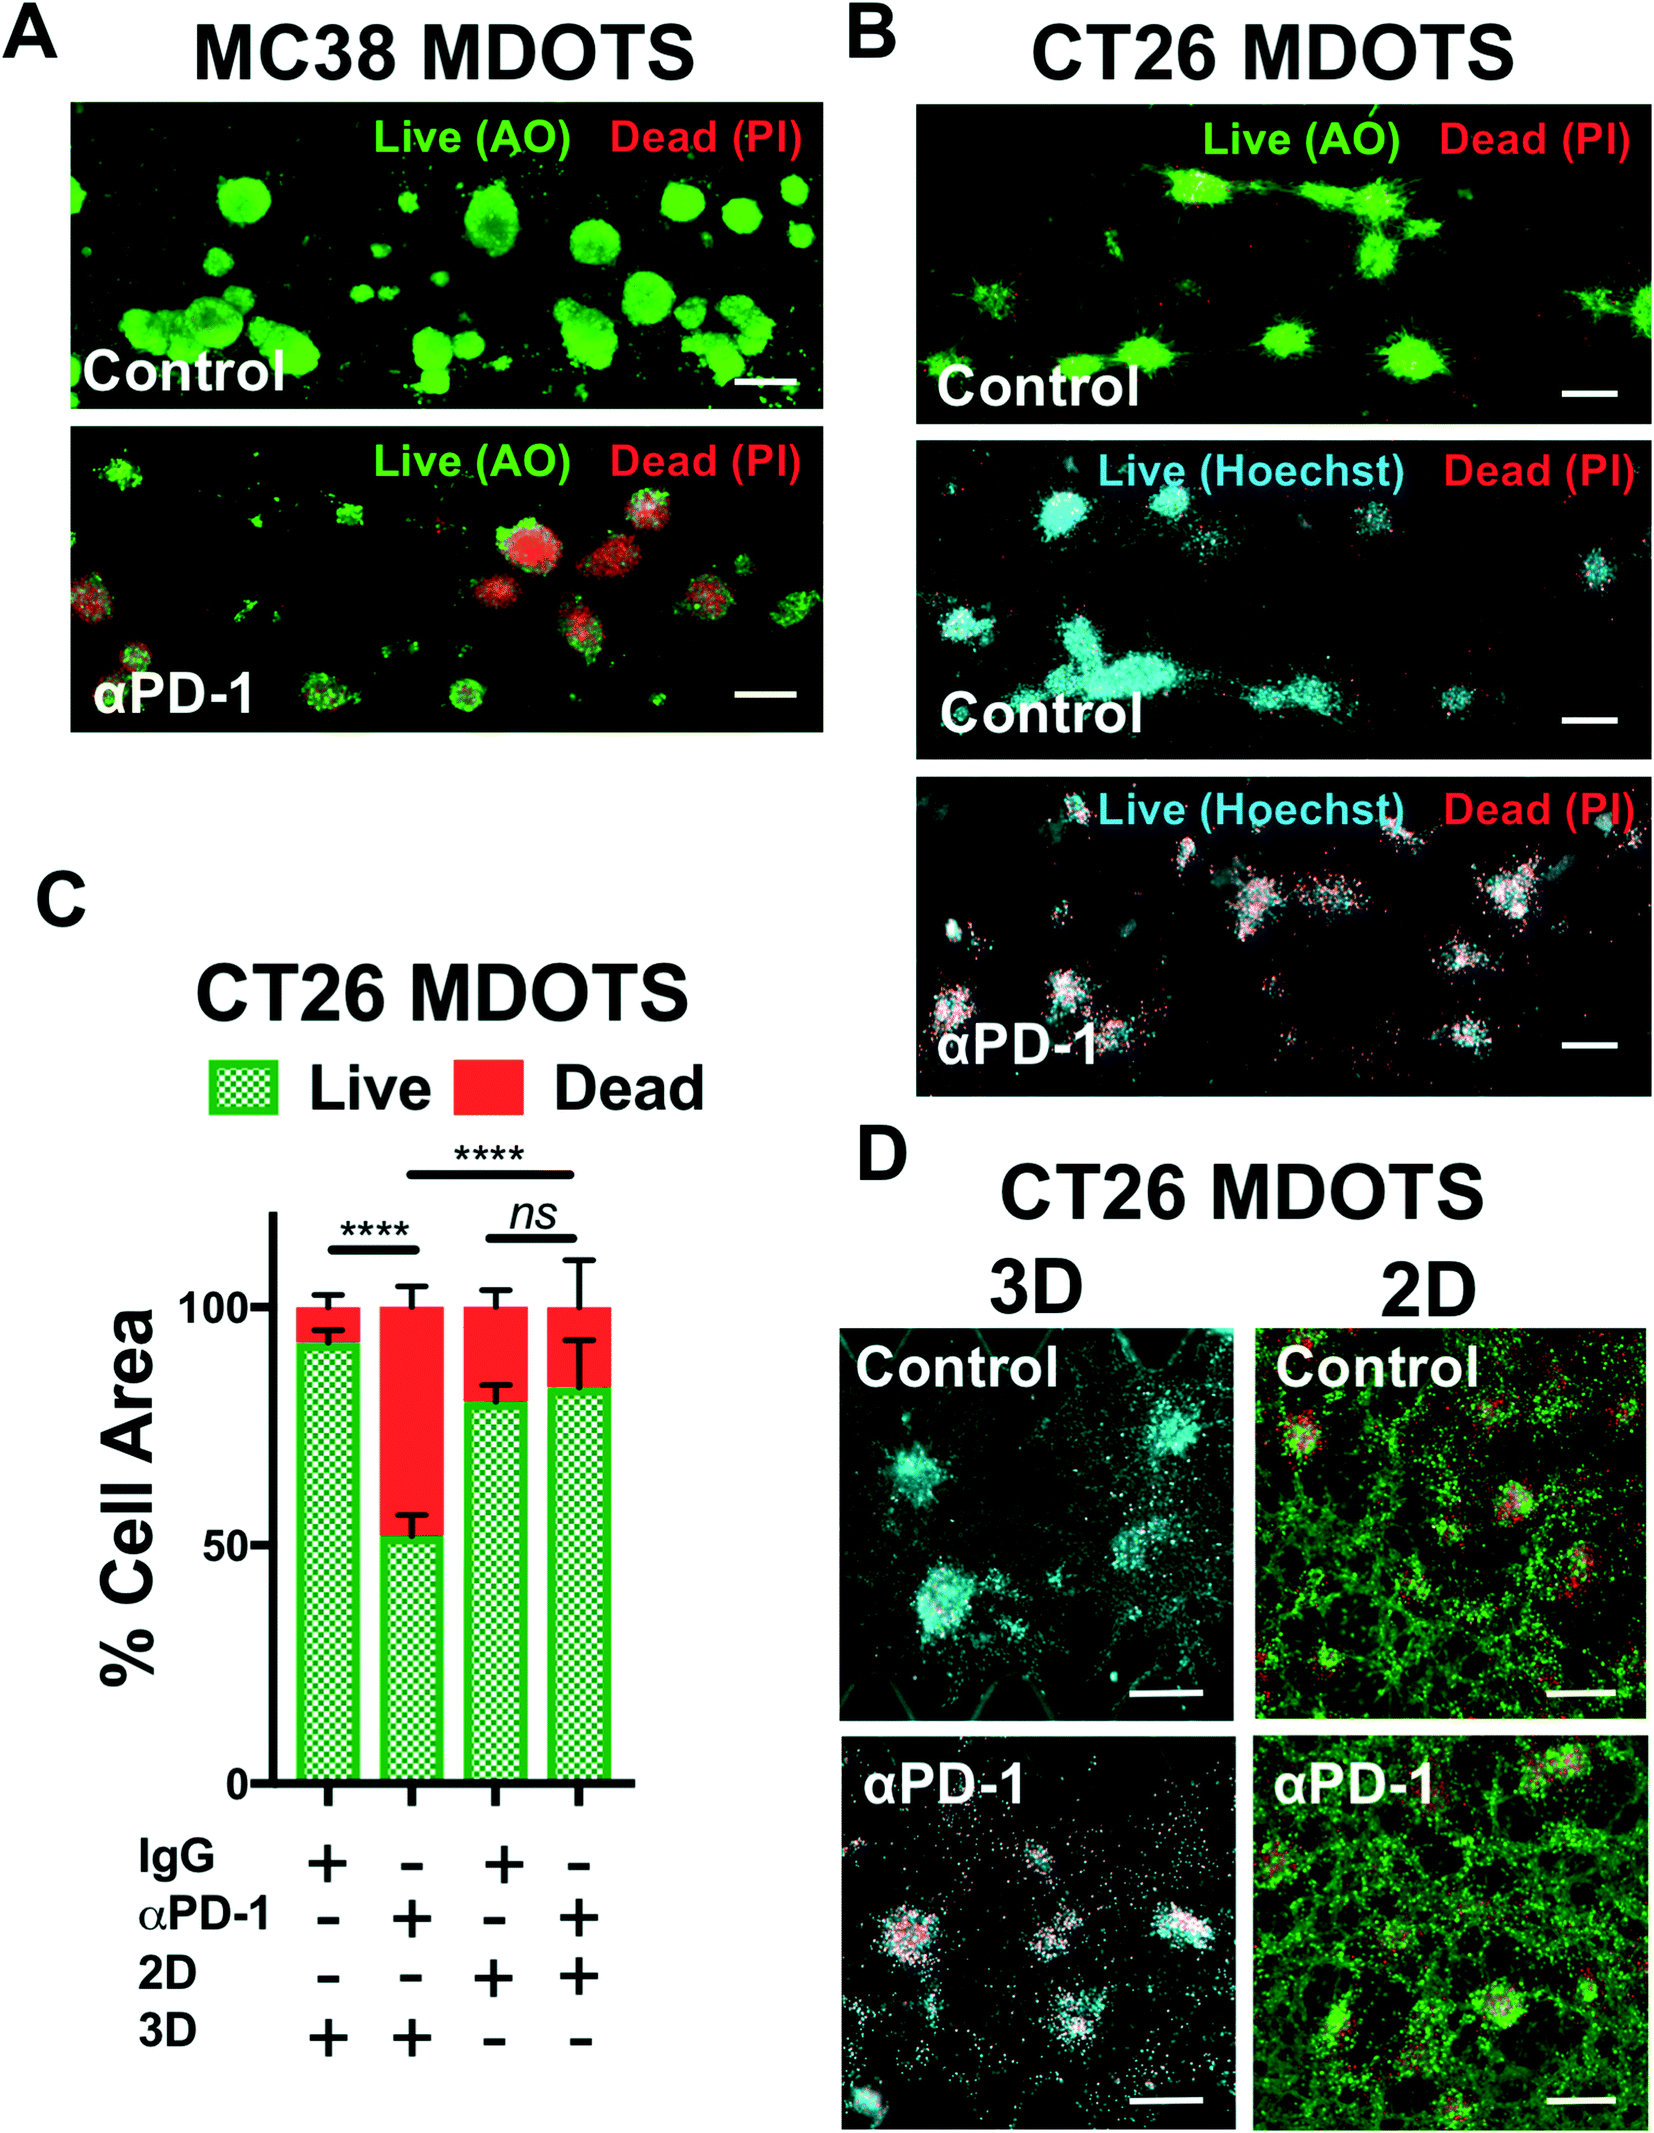 | ||
| Fig. 4 Live/Dead imaging and analysis of murine-derived organotypic tumor spheroids. (A), Acridine orange (AO) and propidium iodide (PI) staining of MC38 MDOTS on day 6 of ex vivo culture, comparing control (isotype control IgG, 10 μg mL−1) with anti-PD-1 (10 μg mL−1). B, AO/PI and Hoechst/PI staining of CT26 MDOTS on day 5 of ex vivo culture, comparing control (isotype control IgG, 10 μg mL−1) with anti-PD-1 (10 μg mL−1). C and D, Live/Dead analysis (C) and fluorescence images (D) of CT26 MDOTS treated with IgG or anti-PD-1 (10 μg mL−1) for 5 days in 3D microfluidic culture (“3D”) compared to 384-well plates (“2D”) (3D – Ho/PI; 2D – AO/PI) (****p < 0.0001, ns = not significant; Kruskal–Wallis with multiple comparisons; n ≥ 3). Scale bars indicate 200 μm (A, B and D). | ||
In addition to use of fluorescent dyes, direct immunofluorescence labeling can also readily be performed using MDOTS and PDOTS.16,17 Standard immunofluorescence labeling protocols, coupled with viability dye evaluation using calcein AM (Fig. 5A–C), can also be employed to evaluate viability of different cell types. Calcein AM is cleaved to its fluorescent form by intracellular non-specific esterases, and in combination with Hoechst can be used to quantify cellular viability. Direct immunofluorescence using cell surface proteins to delineate tumor cells and immune cells is of great utility, especially in PDOTS specimens that demonstrate great inter-sample variability (Fig. 5A–C). Shown here are PDOTS from high-grade serous carcinoma (HGSC) of the ovary and non-small cell lung carcinoma (NSCLC), where tumor cells are readily detected using EpCAM antibodies. Staining for CD8 readily identifies effector CD8 + T cells present in PDOTS, which are necessary effectors following treatment with anti-PD-(L)1 antibodies.12 To date, we have focused on using direct immunofluorescence (IF) coupled with viability dyes in live, intact cells although multiplexed IF is under investigation. For example, PDOTS from patients with melanoma do not express EpCAM, and most reliable melanoma markers are intracellular proteins, which cannot be readily visualized in live, unpermeabilized cells. More sophisticated imaging, including evaluation of intracellular markers requires fixation and permeabilization, which precludes use of non-fixable viability dyes. Ideal panels would permit detection of tumor cells and immune cells (lymphoid and myeloid), expression of PD-1 and PD-L1, as well as viability in distinct cellular subsets.
 | ||
| Fig. 5 Fluorescence imaging of patient-derived organotypic tumor spheroids. (A and B), Baseline IF staining of HGSC PDOTS demonstrating viable cells (calcein AM; green), CD8 T cells (red), tumor cells (EpCAM; purple), and all nucleated cells (Hoechst; blue). C, Overlay IF image of NSCLC PDOTS demonstrating EpCAM positive tumor cells (green), all nucleated cells (Hoechst; blue), and dead cells (PI; red). Scale bars indicate 20 μm (A–C). | ||
Secreted cytokine profiling using multiplexed bead-based kits permits analysis of a large number of inflammatory cytokines and chemokines from a small volume of conditioned media, serum, or plasma. In profiling PDOTS or MDOTS, conditioned media is collected at indicated time points, or upon termination of ex vivo culture, and frozen (at −80 °C), banked, and later batched for pooled analysis using either murine or human commercially available cytokine kits. For a given sample, routine Live/Dead analysis (Fig. 6A) can be formed after media collection and banking for bead-based cytokine profiling (Fig. 6B). In the PDOTS sample shown from a patient with a small intestinal neuroendocrine tumor (SI-NET), dual immune checkpoint blockade with αPD-1 + αCTLA-4 enhanced immune-mediated killing compared to single-agent PD-1 blockade and CTLA-4 blockade (Fig. 6A). For the PDOTS specimen featured (Fig. 6B), the evolution of cytokine and growth factor secretion is evident over time (days 1, 3, 6, and 9), with the clearest differences between the treatment groups evident by day 9 (e.g. IL-8, VEGF, Il-12 (p70), CCL4). A single PDOTS (or MDOTS) sample yields >200 μL of media, enough for four separate bead-based profiling runs (each requiring 50 μL of conditioned media).
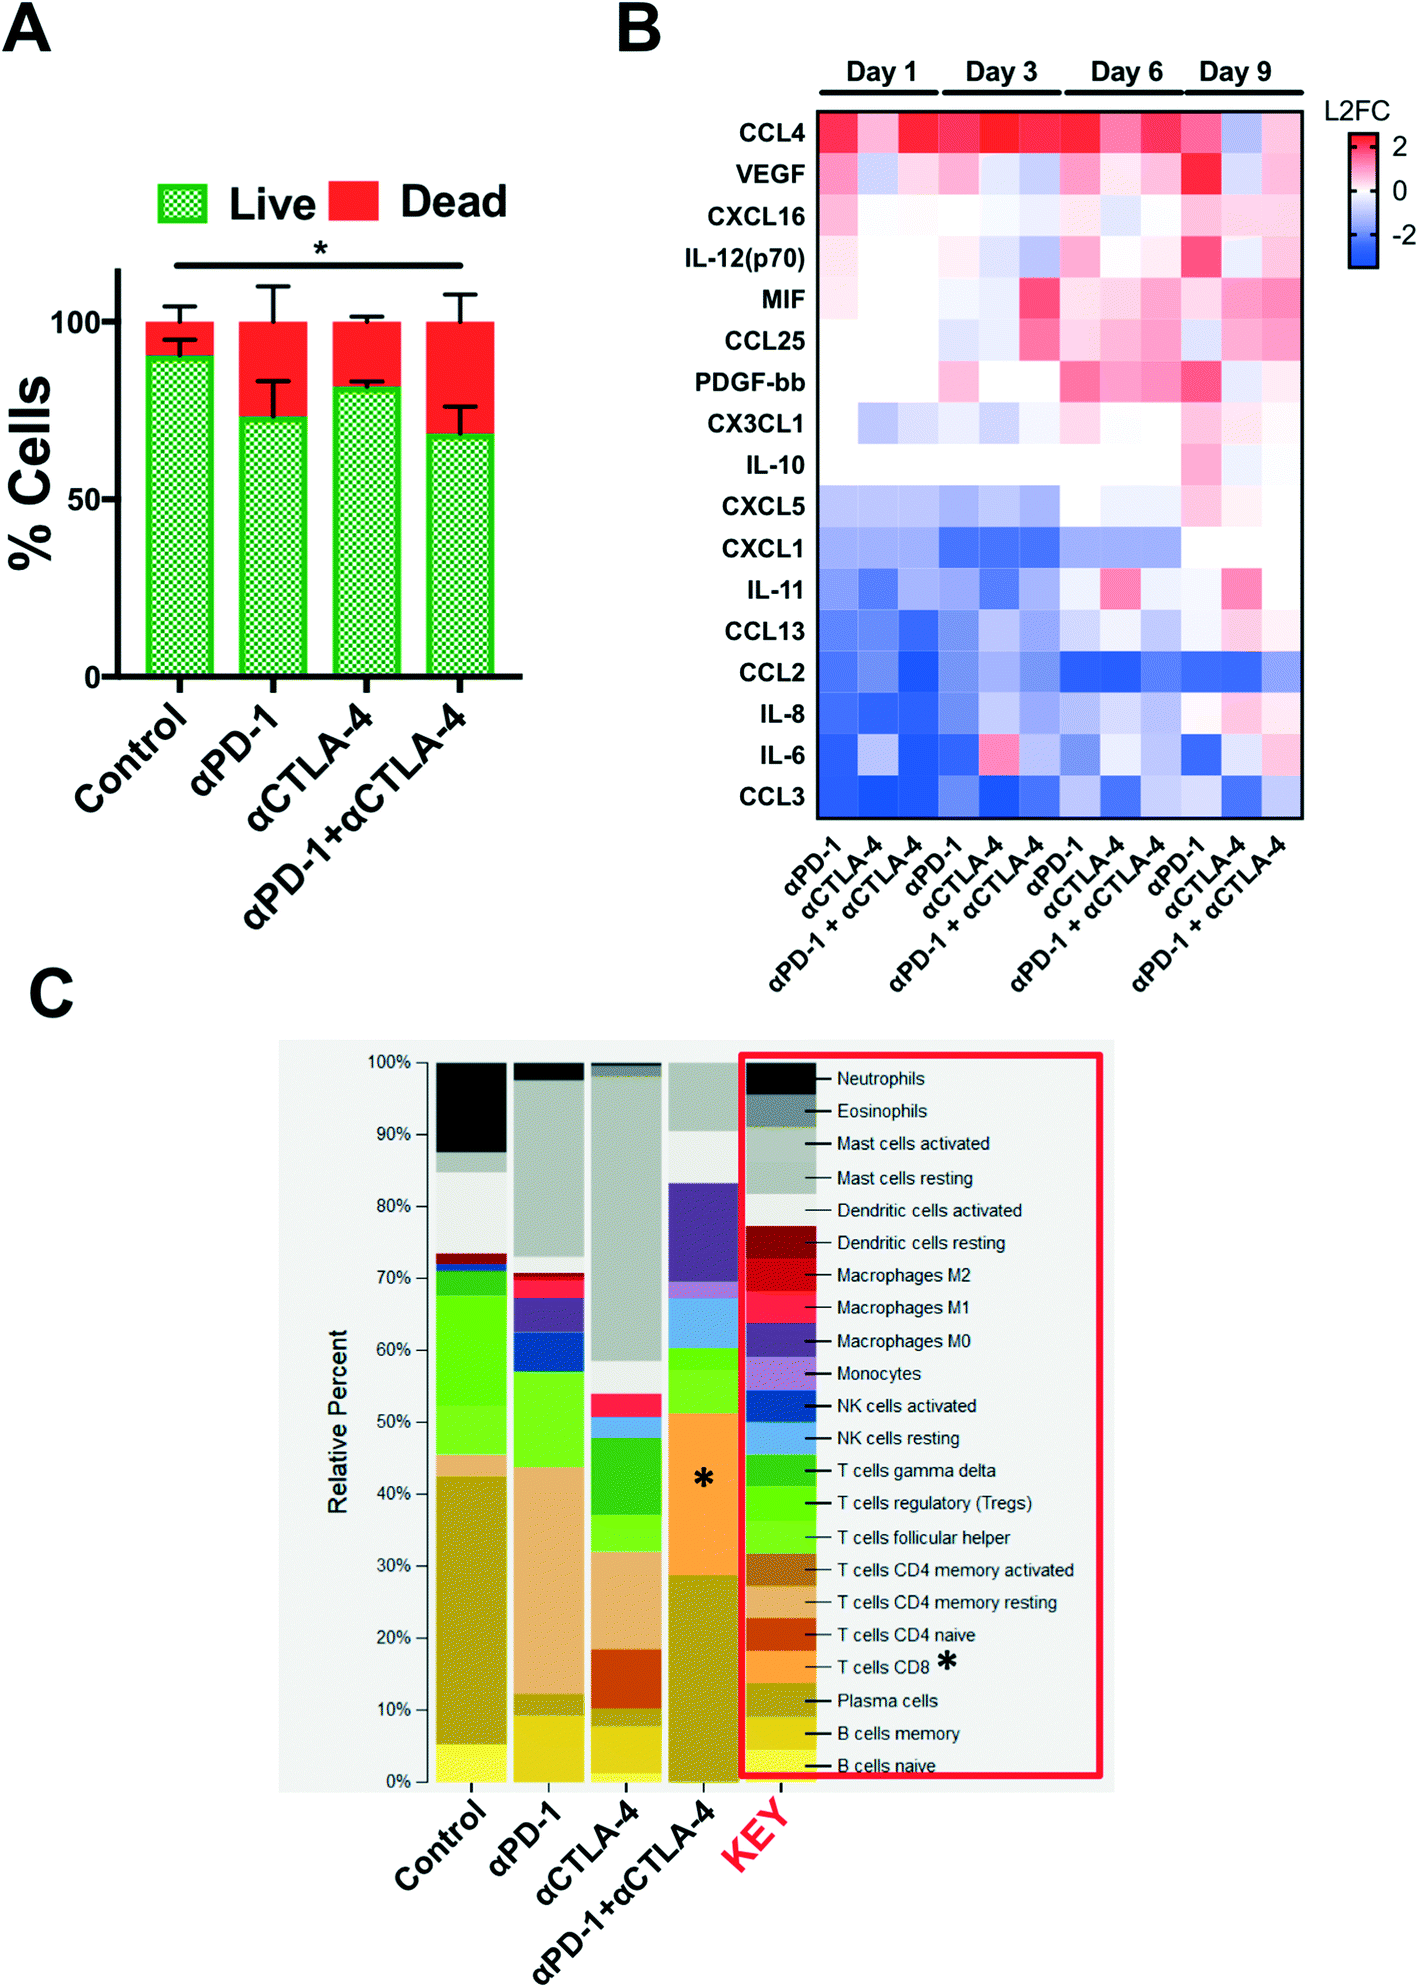 | ||
| Fig. 6 Ex vivo profiling of ICB using PDOTS. (A), AO/PI staining of SI-NET PDOTS (day 9) treated with αPD-1, αCTLA-4, and αPD-1 + αCTLA-4 compared to untreated control PDOTS. (B), Heatmap of changes in secreted cytokines from PDOTS (SI-NET); represented as L2FC relative to untreated control at each time point. (C), Inferred changes in PDOTS immune cell populations using CIBERSORT from SI-NET PDOTS RNA-seq. | ||
Despite the ease of using bead-based profiling to evaluate secreted cytokines and growth factors from conditioned media, most panels are not exhaustive and running multiple panels on individual samples is impractical and costly. Furthermore, for discovery efforts and pathway analysis, secretion profiling is unlikely to evaluate a sufficient number of effectors, growth factors, and chemoattractants. Lastly, molecular analysis (e.g. RNA-seq) provides a large data set that can be interrogated to infer changes in immune cell populations (e.g. CIBERSORT20). We performed a pilot study to determine if bulk RNA-sequencing (RNA-seq) could be performed on PDOTS and conducted CIBERSORT analysis to determine if ex vivo treatment with αPD-1 +/− αCTLA-4 influenced relative number of immune cells (inferred by RNA-seq). RNA was purified using a modified lysis protocol utilizing proteinase K to digest collagen gels and cellular membranes, total RNA from the mixed cell population was isolated (see Materials and methods), and was used as input for library prep for RNA-seq. CIBERSORT was performed (as described20), and demonstrated relative expansion of CD8 T cells and M0 macrophages in PDOTS treated with dual ICB (αPD-1 + αCTLA-4) relative to control or single agent ICB-treated PDOTS. While this is an initial proof of concept experiment, it suggests that RNA-seq from PDOTS in 3D microfluidic culture is feasible, and that CIBERSORT or similar computational methods can be used to infer immune cell changes in response to ex vivo ICB.
Discussion
We have previously demonstrated that patient- and murine-derived organotypic tumor spheroids retain relevant lymphoid and myeloid subsets of immune cells, grow readily in 3D microfluidic culture in collagen hydrogels, recapitulate sensitivity and resistance to PD-1 blockade ex vivo using established immune competent murine tumor models, to test novel combination therapies using a PD-(L)1 backbone, and demonstrated the utility of PDOTS profiling to identify and nominate candidate biomarkers.17 Here, we review this previously published method in greater detail with emphasis on the methods of MDOTS/PDOTS preparation and readouts, and discuss future directions with this novel technology (e.g. RNA-seq), and provide further evidence 3D microfluidic culture of MDOTS recapitulates response to PD-1 blockade which is lacking using traditional 2D culture methods.The PDOTS/MDOTS platform offers several advantages over existing methods to evaluate tumor–immune responses to ICB (see Table 1), providing a window into the tumor immune microenvironment and enabling evaluation of acute and dynamic responses to ICB to using relevant murine models and patient samples. Unlike organoids,21,22 patient-derived xenografts (PDXs),23 and circulating-tumor cells (CTCs),24 MDOTS and PDOTS do not require days or weeks of tissue manipulation or propagation, and contain autologous, tumor-infiltrating immune cells. Importantly, MDOTS/PDOTS are not to be confused with organoids, a distinct 3D culture method developed by Hans Clevers and Toshiro Sato, which leverages native tissue stem cells to propagate normal or transformed tissue.25 Organoids, like PDXs and CTCs, can be used as part of personalized medicine efforts, but lack native stromal and immune cells, thus precluding study of tumor–immune interactions. Furthermore, generation of sufficient quantity of organoids takes time, thus limiting rapid drug screening capabilities.
| Type culture | Cancer models | Characteristics/advantages | Limitations | ||
|---|---|---|---|---|---|
| In vitro ex vivo | 3D microfluidic culture of:26–32 | Culture conditions | • Ideal to study immune–tumor interaction in 3D microenvironment | Culture limitations | • Inability to recapitulate biological in vivo interactions within the entire animal (except for body on a chip platforms) |
| • Capable of modeling complex tumor microenvironment (TME) and extra-cellular matrix (ECM) | • Variability in number of spheroids within the device | ||||
| • Use of patient-derived and mouse specimens (PDOTS, MDOTS) or cell lines (cell line spheroids) | • Difficult to maintain long-term culture (months) | ||||
| • Dynamic multicellular co-culture | • Difficult to provide correct cell culture medium | ||||
| • Reproduces paracrine and contact interactions | • Risk of contamination during handling | ||||
| • Accounts for 3-dimensional cancer cell growth | |||||
| • Mimics local in vivo organization | |||||
| • Medium-term culture (1–2 weeks) | |||||
| Cell line spheroids18,29,30,32 | Material & methods | • Requires low number of cells | Technical issues | • Low reproducibility and variability in data (PDOTS) | |
| • Ability to modulate cytokine/gradients | |||||
| • Reduces reagents | |||||
| MDOTS16,17 | • Possibility to include fluid flow stimuli with pumps | • Inability to reproduce same experiments (PDOTS) unless after “Bio-banking” of sample and create cell lines from patient | |||
| • Microfluidic devices are scalable (size, number of cells) | • Difficult to evaluate/extract results | ||||
| PDOTS16,17 | Results & potentiality | • Reproducible experiments (cell line, MDOTS) | • Requires cell sorting to collect protein lysate and RNA from each cell populations | ||
| • Imaging in real-time | • Requires experienced operator(s) and training | ||||
| • Capable of evaluating drug toxicity and drug metabolism | • Low throughput screening (potential medium to high throughput screening) | ||||
| • Live/Dead assays | • High cost (MDOTS, PDOTS) | ||||
| • Cytokine profiling | |||||
| • High reproducibility with same mouse background (MDOTS) | |||||
| • Can be applied for migration studies (immune cells) | |||||
| • Ease of bulk protein RNA collections | |||||
| • Low cost (cell line spheroids) | |||||
| • Potential for personalized medicine | |||||
| In vitro ex vivo | 2D standard cell culture31–35 | Culture conditions | • Ideal to study single cancer cell autonomous processes | Culture limitations | • Inability to recapitulate biological in vivo interaction within entire human body |
| • Use of patient-derived and commercial cell line | • Static 2-dimensional culture | ||||
| • Simple technical culture | • Lack of the TME | ||||
| • Reproducible experiments | • Fails to account for 3-dimensional cancer cell growth | ||||
| • Low-, medium- to long-term culture | • Lack ECM | ||||
| Material & methods | • Require cells, cell culture medium and culture dishes | • Lack immune cells | |||
| • Potential genetic changes of cancer cells over time | |||||
| • No multicellular co-culture | |||||
| • No possibility to include fluid flow stimuli with pumps | |||||
| • Low-throughput screening | |||||
| Results & potentiality | • Potential change of the genetic background of original cancer cells | Technical issues | |||
| • Live/Dead assay | |||||
| • Cytokine profiling | |||||
| • Imaging in real-time | |||||
| • Easy methods to collect protein lysates and RNAs | |||||
| • Easy evaluate/extract results capable of evaluating drug toxicity and drug metabolism | |||||
| • Low costs | |||||
| • High-throughput screening (up to 96- or 384 well plates) | |||||
| In vitro ex vivo | Standard transwell culture36–40 | Culture conditions | • Ideal to study paracrine signaling, chemotaxis (immune cells) and vascular permeability (drugs) | Culture limitations | • Inability to recapitulate biological in vivo interaction |
| • Modulate cytokine/gradients | • Do not mimic contact interactions in the TME | ||||
| • Simple technical culture | • Low mimic of in vivo organization | ||||
| • Dynamic multicellular co-culture | |||||
| • 2D coating with ECM | |||||
| • Medium- to long-term culture | |||||
| Material & methods | • Require cells, cell culture medium, transwell insert (membrane) and culture wells | Technical issues | • Gravity force (g) may affect results | ||
| • Possible apply trans-endothelial flow with custom made/commercial platforms | • Difficult imaging (depends on membrane transparency) | ||||
| Results & potentiality | • Capable of evaluating drug toxicity and drug metabolism | ||||
| • Cytokine profiling | |||||
| • Easy collect protein lysate and RNA from each cell population without sorting | |||||
| • Easy/reproducible results | |||||
| • Low costs | |||||
| • High-throughput screening (up to 96- or 384 well plates) | |||||
| In vitro in vivo ex vivo | Circulating tumor cells (CTCs)24,41–46 | Culture conditions | • Not invasive methods of isolation from blood | Culture limitations | • Difficult to provide protocols/medium for culture |
| • Multicellular co-culture | • Lacks native immune and stromal cells | ||||
| • Medium-term culture (1–2 weeks) | • Possible different biology between circulating tumor cells and tumor within native microenvironment | ||||
| • Versatile and compatible with multiple platforms and type of culture (3D culture, organoids, in vivo mouse models) | |||||
| Material & methods | • Use of patient-derived specimens | Technical issues | • Often present only in patients with large disease burden | ||
| • Takes time to propagate sufficient material for drug screening/testing | |||||
| Results & potentiality | • Potential for personalized medicine | • Difficult evaluate/extract results | |||
| • Imaging in real-time | • Medium- to high costs | ||||
| • Following propagation, CTCs can be used for anti-neoplastic drug testing | • Low to medium throughput screening | ||||
| In vitro ex vivo | Organoids21,22,47–49 | Culture conditions | • Ideal to recapitulate the pathophysiology of the original tumor | Culture limitations | • Lacks native immune and stromal elements |
| • Model complex tumor microenvironment TME | • Takes time to propagate sufficient material for drug screening/testing | ||||
| • Single/multicellular co-culture | • Difficult to provide correct protocols/cell culture medium | ||||
| • Account for 3-dimensional cancer cell growth | • Risk of contamination for high handling level | ||||
| • Mimic in vivo organization | |||||
| • Multiple methods of isolation from peripheral blood | |||||
| • Amenable to repeat evaluation (“living biobank”) | |||||
| • Medium- to long-term culture (up to months) | |||||
| Material & methods | • Use of patient-derived specimens or cell lines | Technical issues | • Difficult to evaluate/extract results | ||
| • Require cell sorting to collect protein lysate and RNA from each cell populations (multi-cellular organoids) | |||||
| Results & potentiality | • Imaging in real-time | • Low to medium throughput screening | |||
| • Capable of evaluating drug toxicity and drug metabolism | |||||
| • Easy – bulk protein lysates and RNA extractions | |||||
| • Low to medium costs | |||||
| • Potential for personalized medicine | |||||
| In vivo | Xenografts mouse models23,31,33,50–54 | Culture conditions | • Ideal to study biological in vivo interaction within the entire animal body in vivo culture system using patient-derived specimens | Culture limitations | • Time and labor-intensive |
| • Account for 3-dimensional cancer cell growth | • Challenging imaging in real-time | ||||
| • Mimic in vivo organization and TME | • Requires experienced operator(s) and training | ||||
| • Multicellular co-culture | • Genetic differences between species | ||||
| • Long-term culture (over months) | • Complex infrastructure and specific technical skills required | ||||
| • Incompatible with high-throughput screening | • Lack of immune cells | ||||
| • Fluid flow stimuli by in vivo circulation | |||||
| Material & methods | • Require mouse and animal facility | Technical issues | • Require long culture to quantify results | ||
| • Challenging variability in data | |||||
| Results & potentiality | • Patient derived xenograft (PDXs) derived from mouse models can be cultured in 3D microfluidic device or grown as organoids | • Collect protein lysate and RNA after sacrifice mouse | |||
| • High costs | |||||
| • Low throughput screening | |||||
| In vivo | Immune-competent mouse models31,33,54–56 | Culture conditions | • In vivo culture system using patient-derived specimens | Culture limitations | • Time and labor-intensive |
| • Biological in vivo interaction within the entire animal body | • Challenging imaging in real-time | ||||
| • Include immune interactions | • Requires experienced operator(s) and training | ||||
| • Account for 3-dimensional cancer cell growth | • Complex infrastructure and specific technical skills required | ||||
| • Mimic in vivo organization and TME | • Limited number of potential drug combinations | ||||
| • Long-term culture (over months) | • Drugs and therapeutic antibodies against mouse targets may differ from human targets | ||||
| • Only mouse cells study | |||||
| Material & methods | • Require mouse and animal facility | Technical issues | • Require long culture to quantify results | ||
| Results & potentiality | • Capable of modeling heterogeneity of in vivo response and resistance | ||||
| • Capable of evaluating drug toxicity and drug metabolism | • Challenging variability in data | ||||
| • Fluid flow stimuli by in vivo circulation | • Collect protein lysate and RNA after sacrifice mouse | ||||
| • Useful for evaluating drugs whose mechanism of action takes time (e.g. epigenetic modifying agents) | • High costs | ||||
| • MDOTS derived from immune-competent mouse models can be cultured in 3D microfluidic device or grown as organoids | • Low throughput screening | ||||
MDOTS/PDOTS offer significant advantages over organoids, PDXs, and CTCs for ex vivo profiling tumor–immune responses to ICB, however there are several important limitations inherent in the current version of the platform. First, the current version of the MDOTS/PDOTS platform is currently only capable of evaluating tumor–immune interactions of immune cells that have already infiltrated the tumor. In other words, PDOTS/MDOTS “v1.0” cannot recapitulate T-cell priming (which occurs primarily in lymph nodes) or recruitment of naïve immune cells to the tumor microenvironment. Second, we have yet to perform comprehensive evaluation of tumor, stromal, and immune changes through the course of ex vivo culture, both in control conditions and in response to ICB. Thirdly, use of core needle biopsies and FNAs is challenging, and excisional specimens are preferred to yield sufficient number & quality of MDOTS/PDOTS for ex vivo profiling at present, lastly, the influence of device dimensions, biophysical parameters, interstitial flow, hypoxia, and metabolic on tumor–immune interactions, especially cytokine production remains poorly understood and will require further investigation.
It should be noted that the size of the gel region and the size of the media channels are among the variables that may differ among different versions and types of microfluidic devices that could conceivably influence absolute and relative cytokine changes. The impact of different device parameters (e.g. device height, gel region width) on cytokine elaboration is under investigation, but remains far from complete. Identifying the physical components & dimensions of the microfluidic device that enables studying ICB will be important, especially when considering building more advanced medium- and high-throughput systems to test multiple drugs and/or antibodies in combination. An important co-variate in this analysis is the composition of the device itself. For example, the AIM microdevice is plastic, whereas other materials (e.g. polydimethylsiloxane, PDMS) used for ‘home grown’ device fabrication exhibit different properties and characteristics. This is a particularly important consideration when testing ICB in combination with small molecules (commonly prepared in DMSO), as PDMS is known to adsorb small hydrophobic molecules,26 likely influencing drug delivery to MDOTS/PDOTS and ultimately drug efficacy.
While the long-term potential of MDOTS/PDOTS technology as a predictive tool is not yet clear, MDOTS/PDOTS are showing great promise in the evaluation of novel combination therapies and in the discovery of novel biomarkers. Important future directions include extending the lifetime of ex vivo cultures (e.g. tumor vascular networks), performing clinical validation studies (e.g. co-clinical trials or adaptive clinical trials using ex vivo responses to guide clinical treatment), and developing medium- and high-throughput versions of the system. With further technology development along with improved data analytics and bioinformatics, we anticipate the MDOTS/PDOTS platform will form the foundation of functional precision immune-oncology efforts.
Conflicts of interest
A. Aref, D. A. Barbie, and R. W. Jenkins have ownership interest in pending U.S. Patent Application No. 15/540346. R. D. Kamm has ownership interest (including patents) in AIM Biotech, D. A. Barbie is a consultant/advisory board member for N of One.Acknowledgements
Financial support was provided by the Robert A. and Renée E. Belfer Foundation, NCI Training Grant T32CA009172-41 (R. W. J.), John R. Svenson Fellowship (R. W. J.), NCI-R01 CA190394-01 (D. A. B.), Ermenegildo Zegna Founder's scholarship (M. C.), MIT-POLITO grant BIOMODE – Compagnia di San Paolo (M. C., V. C., R. D. K), NCI-U01 CA214381-01 (R. D. K., D. A. B.) the Gloria T. Maheu and Heerwagen Family Funds for Lung Cancer Research, (D. A. B.), Expect Miracles Foundation (C. P. P.). Additional support from a Stand Up To Cancer-American Cancer Society Lung Cancer Dream Team Translational Research Grant (SU2C-AACR-DT17-15). Stand Up to Cancer is a program of the Entertainment Industry Foundation. Research grants are administered by the American Association for Cancer Research, the scientific partner of SU2C.References
- D. M. Pardoll, Nat. Rev. Cancer, 2012, 12, 252–264 CrossRef PubMed.
- S. L. Topalian, C. G. Drake and D. M. Pardoll, Cancer Cell, 2015, 27, 450–461 CrossRef PubMed.
- L. Carbognin, S. Pilotto, M. Milella, V. Vaccaro, M. Brunelli, A. Calio, F. Cuppone, I. Sperduti, D. Giannarelli, M. Chilosi, V. Bronte, A. Scarpa, E. Bria and G. Tortora, PLoS One, 2015, 10, e0130142 CrossRef PubMed.
- K. M. Mahoney, P. D. Rennert and G. J. Freeman, Nat. Rev. Drug Discovery, 2015, 14, 561–584 CrossRef PubMed.
- R. W. Jenkins, D. A. Barbie and K. T. Flaherty, Br. J. Cancer, 2018, 118, 9–16 CrossRef PubMed.
- J. Larkin, F. S. Hodi and J. D. Wolchok, N. Engl. J. Med., 2015, 373, 1270–1271 CrossRef PubMed.
- M. A. Postow, J. Chesney, A. C. Pavlick, C. Robert, K. Grossmann, D. McDermott, G. P. Linette, N. Meyer, J. K. Giguere, S. S. Agarwala, M. Shaheen, M. S. Ernstoff, D. Minor, A. K. Salama, M. Taylor, P. A. Ott, L. M. Rollin, C. Horak, P. Gagnier, J. D. Wolchok and F. S. Hodi, N. Engl. J. Med., 2015, 372, 2006–2017 CrossRef PubMed.
- F. M. Marincola, E. M. Jaffee, D. J. Hicklin and S. Ferrone, Adv. Immunol., 2000, 74, 181–273 Search PubMed.
- V. Bronte, T. Kasic, G. Gri, K. Gallana, G. Borsellino, I. Marigo, L. Battistini, M. Iafrate, T. Prayer-Galetti, F. Pagano and A. Viola, J. Exp. Med., 2005, 201, 1257–1268 CrossRef PubMed.
- J. M. Pitt, M. Vetizou, R. Daillere, M. P. Roberti, T. Yamazaki, B. Routy, P. Lepage, I. G. Boneca, M. Chamaillard, G. Kroemer and L. Zitvogel, Immunity, 2016, 44, 1255–1269 CrossRef PubMed.
- J. S. O'Donnell, G. V. Long, R. A. Scolyer, M. W. Teng and M. J. Smyth, Cancer Treat. Rev., 2017, 52, 71–81 CrossRef PubMed.
- P. C. Tumeh, C. L. Harview, J. H. Yearley, I. P. Shintaku, E. J. Taylor, L. Robert, B. Chmielowski, M. Spasic, G. Henry, V. Ciobanu, A. N. West, M. Carmona, C. Kivork, E. Seja, G. Cherry, A. J. Gutierrez, T. R. Grogan, C. Mateus, G. Tomasic, J. A. Glaspy, R. O. Emerson, H. Robins, R. H. Pierce, D. A. Elashoff, C. Robert and A. Ribas, Nature, 2014, 515, 568–571 CrossRef PubMed.
- J. M. Taube, G. D. Young, T. L. McMiller, S. Chen, J. T. Salas, T. S. Pritchard, H. Xu, A. K. Meeker, J. Fan, C. Cheadle, A. E. Berger, D. M. Pardoll and S. L. Topalian, Clin. Cancer Res., 2015, 21, 3969–3976 CrossRef PubMed.
- M. R. Carvalho, D. Lima, R. L. Reis, V. M. Correlo and J. M. Oliveira, Trends Biotechnol., 2015, 33(11), 667–678 CrossRef PubMed.
- C. Feder-Mengus, S. Ghosh, A. Reschner, I. Martin and G. C. Spagnoli, Trends Mol. Med., 2008, 14, 333–340 CrossRef PubMed.
- R. W. Jenkins, A. R. Aref, P. H. Lizotte, E. Ivanova, S. Stinson, C. W. Zhou, M. Bowden, J. Deng, H. Liu, D. Miao, M. X. He, W. Walker, G. Zhang, T. Tian, C. Cheng, Z. Wei, S. Palakurthi, M. Bittinger, H. Vitzthum, J. W. Kim, A. Merlino, M. Quinn, C. Venkataramani, J. A. Kaplan, A. Portell, P. C. Gokhale, B. Phillips, A. Smart, A. Rotem, R. E. Jones, L. Keogh, M. Anguiano, L. Stapleton, Z. Jia, M. Barzily-Rokni, I. Canadas, T. C. Thai, M. R. Hammond, R. Vlahos, E. S. Wang, H. Zhang, S. Li, G. J. Hanna, W. Huang, M. P. Hoang, A. Piris, J. P. Eliane, A. O. Stemmer-Rachamimov, L. Cameron, M. J. Su, P. Shah, B. Izar, M. Thakuria, N. R. LeBoeuf, G. Rabinowits, V. Gunda, S. Parangi, J. M. Cleary, B. C. Miller, S. Kitajima, R. Thummalapalli, B. Miao, T. U. Barbie, V. Sivathanu, J. Wong, W. G. Richards, R. Bueno, C. H. Yoon, J. Miret, M. Herlyn, L. A. Garraway, E. M. Van Allen, G. J. Freeman, P. T. Kirschmeier, J. H. Lorch, P. A. Ott, F. S. Hodi, K. T. Flaherty, R. D. Kamm, G. M. Boland, K. K. Wong, D. Dornan, C. P. Paweletz and D. A. Barbie, Cancer Discovery, 2018, 8, 196–215 CrossRef PubMed.
- J. Deng, E. S. Wang, R. W. Jenkins, S. Li, R. Dries, K. Yates, S. Chhabra, W. Huang, H. Liu, A. R. Aref, E. Ivanova, C. P. Paweletz, M. Bowden, C. W. Zhou, G. S. Herter-Sprie, J. A. Sorrentino, J. E. Bisi, P. H. Lizotte, A. A. Merlino, M. M. Quinn, L. E. Bufe, A. Yang, Y. Zhang, H. Zhang, P. Gao, T. Chen, M. E. Cavanaugh, A. J. Rode, E. Haines, P. J. Roberts, J. C. Strum, W. G. Richards, J. H. Lorch, S. Parangi, V. Gunda, G. M. Boland, R. Bueno, S. Palakurthi, G. J. Freeman, J. Ritz, W. N. Haining, N. E. Sharpless, H. Arthanari, G. I. Shapiro, D. A. Barbie, N. S. Gray and K. K. Wong, Cancer Discovery, 2018, 8, 216–233 CrossRef PubMed.
- A. R. Aref, R. Y. Huang, W. Yu, K. N. Chua, W. Sun, T. Y. Tu, J. Bai, W. J. Sim, I. K. Zervantonakis, J. P. Thiery and R. D. Kamm, Integr. Biol., 2013, 5, 381–389 RSC.
- P. Cejas, L. Li, N. K. O'Neill, M. Duarte, P. Rao, M. Bowden, C. W. Zhou, M. Mendiola, E. Burgos, J. Feliu, J. Moreno-Rubio, H. Guadalajara, V. Moreno, D. Garcia-Olmo, J. Bellmunt, S. Mullane, M. Hirsch, C. J. Sweeney, A. Richardson, X. S. Liu, M. Brown, R. A. Shivdasani and H. W. Long, Nat. Med., 2016, 22, 685–691 CrossRef PubMed.
- A. M. Newman, C. L. Liu, M. R. Green, A. J. Gentles, W. Feng, Y. Xu, C. D. Hoang, M. Diehn and A. A. Alizadeh, Nat. Methods, 2015, 12, 453–457 CrossRef PubMed.
- H. Clevers, Cell, 2016, 165, 1586–1597 CrossRef PubMed.
- D. Dutta, I. Heo and H. Clevers, Trends Mol. Med., 2017, 23, 393–410 CrossRef PubMed.
- A. T. Byrne, D. G. Alferez, F. Amant, D. Annibali, J. Arribas, A. V. Biankin, A. Bruna, E. Budinska, C. Caldas, D. K. Chang, R. B. Clarke, H. Clevers, G. Coukos, V. Dangles-Marie, S. G. Eckhardt, E. Gonzalez-Suarez, E. Hermans, M. Hidalgo, M. A. Jarzabek, S. de Jong, J. Jonkers, K. Kemper, L. Lanfrancone, G. M. Maelandsmo, E. Marangoni, J. C. Marine, E. Medico, J. H. Norum, H. G. Palmer, D. S. Peeper, P. G. Pelicci, A. Piris-Gimenez, S. Roman-Roman, O. M. Rueda, J. Seoane, V. Serra, L. Soucek, D. Vanhecke, A. Villanueva, E. Vinolo, A. Bertotti and L. Trusolino, Nat. Rev. Cancer, 2017, 17, 254–268 CrossRef PubMed.
- D. S. Micalizzi, S. Maheswaran and D. A. Haber, Genes Dev., 2017, 31, 1827–1840 CrossRef PubMed.
- T. Sato, R. G. Vries, H. J. Snippert, M. van de Wetering, N. Barker, D. E. Stange, J. H. van Es, A. Abo, P. Kujala, P. J. Peters and H. Clevers, Nature, 2009, 459, 262–265 CrossRef PubMed.
- S. Halldorsson, E. Lucumi, R. Gomez-Sjoberg and R. M. Fleming, Biosens. Bioelectron., 2015, 63, 218–231 CrossRef PubMed.
- X. Xu, M. C. Farach-Carson and X. Jia, Biotechnol. Adv., 2014, 32, 1256–1268 CrossRef PubMed.
- D. Caballero, S. Kaushik, V. M. Correlo, J. M. Oliveira, R. L. Reis and S. C. Kundu, Biomaterials, 2017, 149, 98–115 CrossRef PubMed.
- S. Y. Jeong, J. H. Lee, Y. Shin, S. Chung and H. J. Kuh, PLoS One, 2016, 11, e0159013 CrossRef PubMed.
- A. Pavesi, A. T. Tan, S. Koh, A. Chia, M. Colombo, E. Antonecchia, C. Miccolis, E. Ceccarello, G. Adriani, M. T. Raimondi, R. D. Kamm and A. Bertoletti, JCI Insight, 2017, 2(12), 89762 CrossRef PubMed.
- A. R. Aref and D. A. Barbie, Ex Vivo Engineering of the Tumor Microenvironment, Humana Press, Cham, 2017 Search PubMed.
- I. Canadas, R. Thummalapalli, J. W. Kim, S. Kitajima, R. W. Jenkins, C. L. Christensen, M. Campisi, Y. Kuang, Y. Zhang, E. Gjini, G. Zhang, T. Tian, D. R. Sen, D. Miao, Y. Imamura, T. Thai, B. Piel, H. Terai, A. R. Aref, T. Hagan, S. Koyama, M. Watanabe, H. Baba, A. E. Adeni, C. A. Lydon, P. Tamayo, Z. Wei, M. Herlyn, T. U. Barbie, R. Uppaluri, L. M. Sholl, E. Sicinska, J. Sands, S. Rodig, K. K. Wong, C. P. Paweletz, H. Watanabe and D. A. Barbie, Nat. Med., 2018, 24(8), 1143–1150 CrossRef PubMed.
- S. Kitajima, A. Yoshida, S. Kohno, F. Li, S. Suzuki, N. Nagatani, Y. Nishimoto, N. Sasaki, H. Muranaka, Y. Wan, T. C. Thai, N. Okahashi, F. Matsuda, H. Shimizu, T. Nishiuchi, Y. Suzuki, K. Tominaga, N. Gotoh, M. Suzuki, M. E. Ewen, D. A. Barbie, O. Hirose, T. Tanaka and C. Takahashi, Oncogene, 2017, 36, 5145–5157 CrossRef PubMed.
- H. Terai, S. Kitajima, D. S. Potter, Y. Matsui, L. G. Quiceno, T. Chen, T. J. Kim, M. Rusan, T. C. Thai, F. Piccioni, K. A. Donovan, N. Kwiatkowski, K. Hinohara, G. Wei, N. S. Gray, E. S. Fischer, K. K. Wong, T. Shimamura, A. Letai, P. S. Hammerman and D. A. Barbie, Cancer Res., 2018, 78, 1044–1057 CrossRef PubMed.
- S. Domcke, R. Sinha, D. A. Levine, C. Sander and N. Schultz, Nat. Commun., 2013, 4, 2126 CrossRef PubMed.
- M. E. Katt, A. L. Placone, A. D. Wong, Z. S. Xu and P. C. Searson, Front. Bioeng. Biotechnol., 2016, 4, 12 Search PubMed.
- C. Arrigoni, S. Bersini, M. Gilardi and M. Moretti, Int. J. Mol. Sci., 2016, 17(9), 1405 CrossRef PubMed.
- M. K. Herroon, J. D. Diedrich and I. Podgorski, Front. Endocrinol., 2016, 7, 84 Search PubMed.
- F. Roudnicky and M. Hollmen, Genomics Data, 2016, 8, 1–3 CrossRef PubMed.
- R. Guiet, E. Van Goethem, C. Cougoule, S. Balor, A. Valette, T. Al Saati, C. A. Lowell, V. Le Cabec and I. Maridonneau-Parini, J. Immunol., 2011, 187, 3806–3814 CrossRef PubMed.
- A. Lallo, M. W. Schenk, K. K. Frese, F. Blackhall and C. Dive, Transl. Lung Cancer Res., 2017, 6, 397–408 CrossRef PubMed.
- M. G. Krebs, R. L. Metcalf, L. Carter, G. Brady, F. H. Blackhall and C. Dive, Nat. Rev. Clin. Oncol., 2014, 11, 129–144 CrossRef PubMed.
- K. Pantel and C. Alix-Panabieres, Clin. Chem., 2016, 62, 328–334 CrossRef PubMed.
- E. Pailler, J. Adam, A. Barthelemy, M. Oulhen, N. Auger, A. Valent, I. Borget, D. Planchard, M. Taylor, F. Andre, J. C. Soria, P. Vielh, B. Besse and F. Farace, J. Clin. Oncol., 2013, 31, 2273–2281 CrossRef PubMed.
- K. Ross, E. Pailler, V. Faugeroux, M. Taylor, M. Oulhen, N. Auger, D. Planchard, J. C. Soria, C. R. Lindsay, B. Besse, P. Vielh and F. Farace, Expert Rev. Mol. Diagn., 2015, 15, 1605–1629 CrossRef PubMed.
- E. Pailler, V. Faugeroux, M. Oulhen, C. Catelain and F. Farace, Transl. Lung Cancer Res., 2017, 6, 444–453 CrossRef PubMed.
- J. Drost and H. Clevers, Nat. Rev. Cancer, 2018, 18, 407–418 CrossRef PubMed.
- L. Broutier, G. Mastrogiovanni, M. M. Verstegen, H. E. Francies, L. M. Gavarro, C. R. Bradshaw, G. E. Allen, R. Arnes-Benito, O. Sidorova, M. P. Gaspersz, N. Georgakopoulos, B. K. Koo, S. Dietmann, S. E. Davies, R. K. Praseedom, R. Lieshout, I. J. JNM, S. J. Wigmore, K. Saeb-Parsy, M. J. Garnett, L. J. van der Laan and M. Huch, Nat. Med., 2017, 23, 1424–1435 CrossRef PubMed.
- N. Sachs, J. de Ligt, O. Kopper, E. Gogola, G. Bounova, F. Weeber, A. V. Balgobind, K. Wind, A. Gracanin, H. Begthel, J. Korving, R. van Boxtel, A. A. Duarte, D. Lelieveld, A. van Hoeck, R. F. Ernst, F. Blokzijl, I. J. Nijman, M. Hoogstraat, M. van de Ven, D. A. Egan, V. Zinzalla, J. Moll, S. F. Boj, E. E. Voest, L. Wessels, P. J. van Diest, S. Rottenberg, R. G. J. Vries, E. Cuppen and H. Clevers, Cell, 2018, 172, 373–386 CrossRef PubMed e310.
- V. C. Daniel, L. Marchionni, J. S. Hierman, J. T. Rhodes, W. L. Devereux, C. M. Rudin, R. Yung, G. Parmigiani, M. Dorsch, C. D. Peacock and D. N. Watkins, Cancer Res., 2009, 69, 3364–3373 CrossRef PubMed.
- C. L. Morton and P. J. Houghton, Nat. Protoc., 2007, 2, 247–250 CrossRef PubMed.
- T. Voskoglou-Nomikos, J. L. Pater and L. Seymour, Clin. Cancer Res., 2003, 9, 4227–4239 Search PubMed.
- M. R. Girotti, G. Gremel, R. Lee, E. Galvani, D. Rothwell, A. Viros, A. K. Mandal, K. H. Lim, G. Saturno, S. J. Furney, F. Baenke, M. Pedersen, J. Rogan, J. Swan, M. Smith, A. Fusi, D. Oudit, N. Dhomen, G. Brady, P. Lorigan, C. Dive and R. Marais, Cancer Discovery, 2016, 6, 286–299 CrossRef PubMed.
- N. Gengenbacher, M. Singhal and H. G. Augustin, Nat. Rev. Cancer, 2017, 17, 751–765 CrossRef PubMed.
- S. E. Gould, M. R. Junttila and F. J. de Sauvage, Nat. Med., 2015, 21, 431–439 CrossRef PubMed.
- K. K. Frese and D. A. Tuveson, Nat. Rev. Cancer, 2007, 7, 645–658 CrossRef PubMed.
| This journal is © The Royal Society of Chemistry 2018 |