
 Open Access Article
 This Open Access Article is licensed under a Creative Commons Attribution-Non Commercial 3.0 Unported Licence
Tunable optical properties of OH-functionalised graphene quantum dots†
K. R.
Geethalakshmi
*a,
Teng Yong
Ng
a and
Rachel
Crespo-Otero
*b
aSchool of Mechanical and Aerospace Engineering, Nanyang Technological University Singapore, 50 Nanyang Avenue, Singapore-639798. E-mail: geethalakshmikr@gmail.com
bSchool of Biological and Chemical Sciences, Materials Research Institute, Queen Mary University of London, Mile End Road, London E1 4NS, UK. E-mail: r.crespo-otero@qmul.ac.uk
First published on 16th August 2016
Abstract
Graphene oxide quantum dots (GO-QDs) have distinct optoelectronic properties for their application in bio-imaging, drug delivery and photovoltaics. Herein, the effect of OH functionalisation on the optical properties of GO-QDs is studied based on state-of-the-art theoretical simulations. Our calculations predict the effect of OH groups on ionisation potentials, light absorption and emission properties. The mechanism of fluorescence is analysed considering the role of geometry distortion and charge transfer. Moreover, selective functionalisation of positions with large electron–hole separation offers a strategy to tune the optical gap and photoluminescence properties. These results open up new opportunities for the design of GO-QDs for a wide range of applications.
A. Introduction
Graphene oxide (GO) is evolving as a multifaceted candidate material for optoelectronics,1 next-generation ultrathin electronics,2,3 energy conversion and storage technologies.4–6 However, the underlying issue currently limiting the direct attachment of GO to devices is the poor understanding of how to enforce spatial control over oxygen groups in the experimental processes.7–9 These restrictions result in large optical gaps and drive poor electronic conductivity.1,10,11GO has strong absorption in the ultraviolet region showing energy shifts towards the visible with increasing level of oxidation.12,13 GO contains oxygen mainly in the form of epoxy, hydroxyl and carboxyl functional groups on the basal plane and at the sheet edges.7,14 Hydroxyl groups stabilise the surface, help radiative recombination and consequently enhance the fluorescence yield.15–17 Selective chemical reduction of carboxyl and epoxy groups with NaBH4 increases the fraction of hydroxyl groups.17
The photoluminescence properties of GO can be tuned from deep ultraviolet to near infrared by reducing the size to the nanoscale regime and by controlling edge configuration effects, functional groups and defects.18 These so-called graphene oxide quantum dots (GO-QDs) have received considerable attention because of their distinct structural and optoelectronic properties and for their potential application in fields such as bio-imaging, drug delivery and photovoltaics.19,20
Synthesis methods have not been very successful in producing GO-QDs with controllable size or functionalities and reaction conditions strongly affect the absorption and emission spectra.19,21GO-QDs, in the size range of 1–4 nm, were synthesised by Peng et al. and were demonstrated to show photoluminescence tunability.22 The first absorption peak shifted from 330 to 270 nm when the temperature changed from 80 to 120 °C. Jang et al. synthesised GO-QDs with different amounts of oxygen using direct oxidation of graphite nanoparticles and by conventional chemical reduction.19GO-QDs of similar sizes obtained by different methods showed different carrier dynamics, but similar tendencies with regard to the oxygen composition.
In this context, the combined effects of oxygen content and size on the mechanisms of light absorption and luminescence are not well understood and inconsistent experimental outcomes have led to contradictory hypotheses due to large heterogeneity in the synthesised GO-QDs. There are two interpretations of the mechanism of fluorescence: localization of sp2 clusters and involvement of oxygen functional groups. Herein, we analyse both mechanisms based on state-of-the-art theoretical simulations.21
Theoretical calculations are particularly useful to isolate the effect of different factors contributing to a particular mechanism. Several groups have explored the properties of graphene quantum dots (G-QDs) using different levels of theoretical approximations.18,23–31 Recently, Yamijala et al. studied the nonlinear optical properties of G-QDs and found that QDs with zigzag edges show interesting optical properties.32 The tunability of the emission of QDs has been recently analysed considering the effect of different functional groups.18
Herein, we evaluate the effect of the OH functionalisation on the ionisation potentials, absorption and emission properties of GO-QD zigzag edge models. Our results show a clear strategy to tune the properties of GO-QDs based on size and distribution of OH functional groups. These results contribute to a better understanding of their properties with implications for the design of more efficient GO-QD based devices.
B. Models and methods
We considered different functionalisation patterns and number of OH groups on small sized zigzag GO-QDs. The models were built by modifying the pristine QDs: coronene C24H12 (G2), ovalene, C32H14 (G3) and cir-coronene C54H18 (G4). Considering the general composition CnHm, we added 2, 4, m and m + 2 (G2 and G3) or m + 4 (G4) OH groups. The OH groups were added forming bonds with carbon atoms from the basal plane and substituting the hydrogens of the edge planes. Symmetrical and non-symmetrical GO-QDs with respect to two C2 symmetry axes were studied based on the functionalisation patterns shown in Fig. 1. Yan et al. showed that the most stable configurations contain epoxide and hydroxyl groups in close proximity.16 We calculated models where the hydroxyl groups are relatively close, which stabilises the surface due to the formation of hydrogen bonds. All the considered models and their total energies are reported in the ESI.†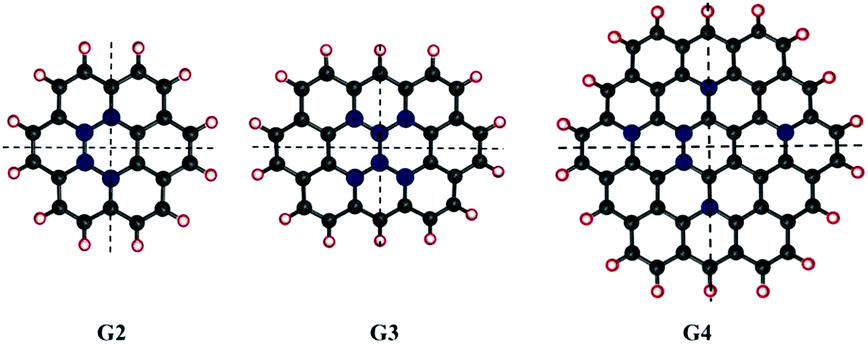 | ||
| Fig. 1 Pristine graphene quantum dots considered in this study. The positions functionalised for the axial plane substitutions are shown in red, and the carbons that were functionalised with OH are shown in blue. The average radii of these QDs are 0.92 nm, 1.05 nm and 1.39 nm respectively. | ||
Functionalisation induces distortion of the geometry which affects the properties. Herein, distortion from planarity was measured by calculating the deviation of each ring from the plane. Considering the six possible dihedrals formed by the carbons connected by bonds, the maximum deviation from the plane was defined as the absolute value of the larger of these angles (θi). The average of these angles (θ) was used as a measure of geometric distortion (see the values for all the GO-QDs in the ESI†).
Theoretical methods are very useful to interpret the nature of electronic excitations, but the level of theory should be carefully chosen. A proper description of charge transfer (CT) states is very important for the analysis of the mechanism of fluorescence. It has been suggested that there is an important role of the functional groups in the fluorescence mechanism of G-QDs.21 To study the electronic and optical properties of the GO-QDs, density functional theory (DFT) and linear response time-dependent functional theory (TDDFT)33 calculations were performed.
Two density functionals were considered, the hybrid B3LYP34 and the long-range corrected functional ωB97X-D.35 It is well known that typical hybrid functionals, like B3LYP, have problems in describing CT states. B3LYP is still one of the most popular hybrid functionals and some of the previous calculations of quantum dots with a similar size have been performed with this functional.18 These problems are alleviated using long-range corrected functionals like ωB97X-D,35 which also includes dispersion correction. TDDFT calculations with the ωB97X-D functional have shown a very good performance for highly delocalised molecular systems.36,37 Resolution of identity coupled cluster to the second order (CC2)38 calculations were performed for the G2 and G2-2OH-C1 models with the def2-TZVP basis set. RI-CC2 results are in good agreement with the TDDFT calculations. A more detailed comparison of the results using different levels of theory can be found in the ESI.† Our discussion is based on the results obtained at the TDDFT-ωB97X-D/6-311+G(d) level of theory, unless otherwise specified.
The vertical excitations of the lowest 20 excited states were calculated using TDDFT. To be able to describe diffuse excited states, we consider a triplet zeta basis set including polarisation and diffuse functions, 6-311+G(d).39 The ground state geometries of the functionalized GO-QDs were optimised at B3LYP/6-311+G(d) and ωB97X-D/6-311+G(d) levels of theory. The relaxation of the geometries in S1 was done at TDDFT-B3LYP/6-311+G(d) and TDDFT-ωB97X-D/6-311+G(d) levels of theory.
The effect of vibrations on the broadening of the absorption spectra of G2, G2-2OH-C1, G3 and G3-2OH-C1 was considered using the nuclear ensemble approximation40 as implemented in the Newton-X program.41 This method considers that spectral broadening is obtained due to the contribution of an ensemble of structures generated from a Wigner distribution based on the harmonic frequencies. 20 excited states and 200 geometries were considered to perform these simulations. Further, to analyse the effect of solvent on the electronic spectrum of G2, the PCM method42 was used considering cyclohexane as solvent.
The optical band gaps were calculated as the difference of energy between the ground and the first excited states.43 The ionisation potentials were calculated as the energy difference between the cation and the neutral system. The atomic charges for the ground and the first excited states were obtained using the natural bond orbital (NBO) method.44 DFT and TDDFT calculations were performed using the Gaussian program45 and CC2 calculations using Turbomole.46
C. Results and discussion
Ionisation potentials
Similar to the interactions of organic molecules with metal surfaces in the application of self-assembled monolayers (SAMs),47,48GO-QDs can be covalently functionalized showing interesting behaviour on gold surfaces.49 The design of efficient devices based on GO-QDs requires the understanding of the position of energy levels and their alignments with respect to the energy levels of molecules and metal contacts.50 To provide an absolute reference for the electronic states of the considered GO-QDs models with respect to vacuum, the ionisation potentials were evaluated.Fig. 2 illustrates the shift in the energy of the excited states of selected GO-QDs. Functionalisation with OH groups has an important effect on the first ionisation potentials (IP), which are smaller than the values of the corresponding pristine G-QDs. This effect can be understood considering the destabilisation of the occupied molecular levels because of the incorporation of atomic orbitals from electronegative atoms, which also has an effect on the optical band gaps which are smaller than in the corresponding pristine QDs.
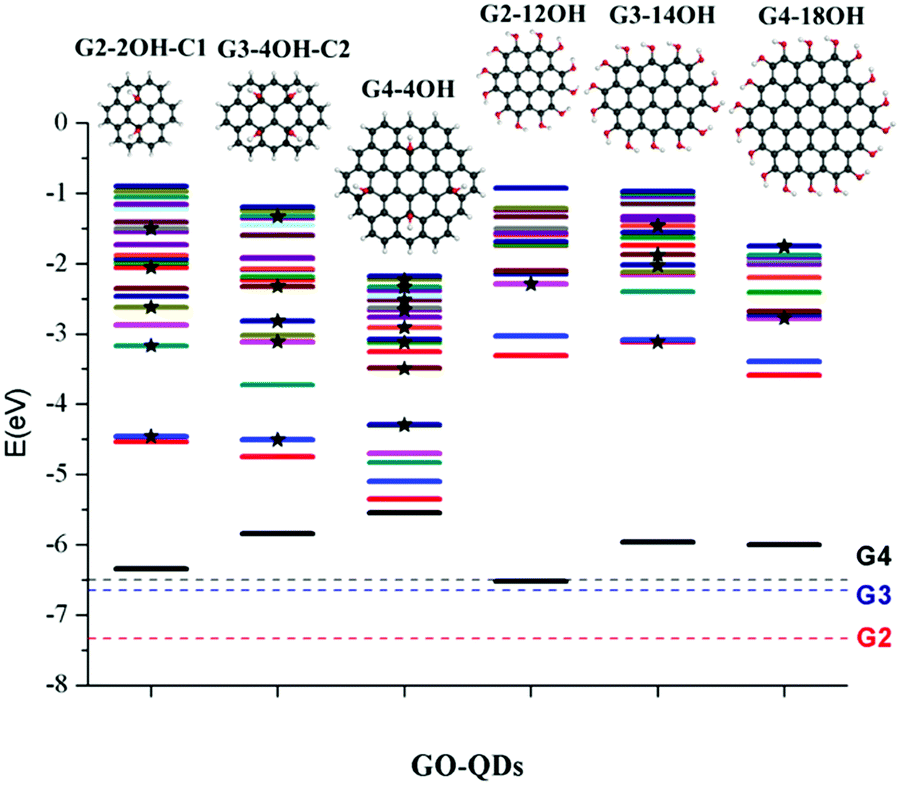 | ||
| Fig. 2 20 lowest excited states for selected GO-QDs (TDDFT-ωB97X-D/6-311+G(d)). The electronic states were aligned with respect to vacuum, using the ionisation potentials calculated as the energy difference between the cation and the neutral GO-QDs. The energies of S0 for the GO-QDs were shifted to the –IP value. The discontinuous lines show the –IP reference for the pristine QDs (G2: red, G3: blue, G4: black). The excited states with oscillator strengths larger than 0.1 are highlighted with stars. | ||
In the series G2, G3, and G4, with the addition of aromatic rings the ionisation potentials decrease. In the case of G2, the calculated ionisation potential is 7.34 eV, in very good agreement with the experimental value of 7.29 eV.51 The calculated IP for G3 is 6.65 eV, which is also in good agreement with the experimental value of 6.71 eV.51 The calculated ionisation potential for G4 is 6.50 eV, which is only slightly shifted with respect to the value for G3.
These calculations show a strong effect of the position of the OH groups on the electronic properties and the optical gaps (Fig. 2). For G2-2OH-C1, the calculated IP is 6.34 eV, which is about 1 eV smaller than in G2. In the case of G2-12OH with edge functionalisation and a larger number of hydroxyl groups, the IP is reduced to 6.52 eV. For the G3 and G4 based GO-QDs, similar effects are observed. The IPs for G3-4OH-C2 and G3-12OH are 5.84 and 5.96 eV respectively. In the case of G4-18OH, the ionisation potential is shifted to 6.00 eV, while the value for G4-4OH is 5.55 eV. In general, all examined electronic properties are more affected by functionalisation on the basal plane than by edge position substitutions. We analyse the reason for this behaviour in the next sections.
Tuning of optical gaps and fluorescence
Regardless of the position of the substituents, functionalisation with hydroxyl groups reduces the optical gap with respect to the values of the corresponding pristine QDs. In the case of G2 and G4 and the corresponding edge functionalised GO-QDs (G2-12OH and G4-18OH), the optical transitions and emission are not allowed by symmetry, but these transitions can show some intensity because of the geometry distortion caused by vibrations (the absorption and emission spectra of G2 and G3 are shown in Fig. 11 and 12). We have discussed the effect of substitutions on the oscillator strengths in the last section of the paper.Fig. 3 shows the effect on the optical gaps and emission energy for all considered G2 based QDs. The optical gap for coronene (G2) at the TDDFT-ωB97X-D/6-311+G(d) level of theory is 3.57 eV in very good agreement with the experimental value reported in cyclohexane which is 3.54 eV.52 Our calculations using cyclohexane showed that the solvent does not affect the first absorption band (3.57 eV).
 | ||
| Fig. 3 S1–S0 optical gaps (in eV) calculated at the TDDFT-ωB97X-D/6-311+G(d) level of theory for the OH functionalised quantum dots based on pristine G2. Red bars correspond to the vertical excitation and grey bars to the fluorescence energy. | ||
The GO-QD model with the smallest variation of optical gap values with respect to the pristine G2 is G2-12OH, where all hydrogens were substituted by OH groups. The largest effect on the gaps is obtained when the G2 is functionalised on the basal plane (G2-2OH-C1, G2-2OH-C2, G2-4OH-C1, G2-4OH-C2 and G2-12OH). The relaxation of the geometry on the first excited state has a very small effect on the gap because the S1 minima are only slightly distorted with respect to the Franck–Condon geometries. Emission energies show similar tendencies to the optical band gaps (Fig. 3). The larger Stokes shift (0.8 eV) is obtained for G2-2OH-C2 and it is associated with reorientation of the hydroxyl groups.
HOMO, HOMO−1, LUMO and LUMO+1 frontier orbitals have the most important contributions to S1. The features of these orbitals do not change significantly because of functionalisation (ESI†). The orbitals from the hydroxyl groups have a relatively small contribution to the frontier orbitals as can be seen in the case of G2-2OH-C1 and G2-12OH. For G2, the main electronic transitions involved in S1 are HOMO → LUMO+1 (47.9%), HOMO−1 → LUMO (47.9%), HOMO → LUMO (2.0%) and HOMO−1 → LUMO+1 (2.0%). Functionalisation tunes the contributions of these transitions (Table 1).
| GQs | Contributions (%) to S1 | |
|---|---|---|
| G2 | H−1 → L | H → L+1 |
| 47.9% | 47.9% | |
| G2-2OH-C1 | H−1 → L | H → L+1 |
| 78.0% | 9.6% | |
| G2-2OH-C2 | H → L | H−1 → L+1 |
| 85.1% | 6.0% | |
| G2-4OH-C1 | H−1 → L | H → L |
| 51.7% | 37.7% | |
| G2-4OH-C2 | H−1 → L | H → L |
| 43.7% | 42.0% | |
| G2-12OH | H → L | H−1 → L+1 |
| 34.0% | 34.0% | |
| G2-14OH | H−1 → L | H → L+1 |
| 77.0% | 20.0% |
For G2-2OH-C1, the most important transitions are HOMO−1 → LUMO (78.1%) and HOMO → LUMO+1 (9.6%). In the case of G2-12OH, the main electronic transitions are HOMO → LUMO (34.1%), HOMO−1 → LUMO+1 (34.1%), HOMO → LUMO+1 (13.6%) and HOMO−1 → LUMO (13.6%). In most cases, the first excited states show important contribution of at least two electronic transitions; consequently, the HOMO–LUMO analysis cannot provide a complete picture of these states. A detailed analysis of electron S1–S0 densities is discussed below in connection with the fluorescence mechanism.
Our calculations show that the tuning of the optical gap by basal plane functionalisation is mainly related to geometry distortion. The distortion from the planar geometry has an important effect on the localisation of the electron densities in S0 and S1. The analysis of the electron densities is in line with this interpretation and will be further analysed. The significant role of geometry distortion can be illustrated by substituting the OH groups by hydrogens in the G2-2OH-C1 model. The obtained optical gap is 1.96 eV (1.94 eV without geometry relaxation). Considering that the optical gap for G2-2OH-C1 is 1.80 eV, the most important effect of the basal plane functionalisation can be associated with geometry deformation. The effect of the functional group is minor.
Another important factor is the position of the functionalisation, which determines the number of aromatic rings deviated from the plane and less involved in the aromatic delocalisation. In general, GO-QDs with a larger number of distorted aromatic rings and more deviated from the plane have smaller optical gaps, more shifted with respect to the corresponding pristine QDs. Both factors are captured by the average angle θ (ESI†).
For G2, all positions in the (1,1) central unit are equivalent (see Fig. 7). In the case of G2-2OH-C2 (θ = 17.9°), which has the same number of OH groups as G2-2OH-C1 (θ = 20.7°), but a smaller deformation of the geometry, the reduction of the optical band gap (2.82 eV) with respect to G2 is less significant. Considering the pattern of the functionalisation in G2-2OH-C1, five aromatic rings deviate significantly from the plane and four in the case of G2-2OH-C2 (ESI†).
The effect of geometry distortion induced by edge functionalisation in elongated armchair graphene nanoflakes was examined by Cocchi et al. with important effects on the absorption properties.53 Our edge functionalised GO-QDs do not show a significant geometry distortion because of the small size of the OH groups, which do not induce an important steric hindrance (the values of θ for G2-12OH, G3-14OH and G4-18OH are 1.3, 1.3 and 1.0 respectively, see ESI†). But some stabilisation in the system is detected due to the formation of hydrogen bonds.
In general, increasing the number of OH groups in the basal plane positions decreases the gap, but this effect strongly depends on the position of the functionalisation and correlates with the variation of the geometries. Substituting the edge hydrogens in G2-4OH-C1 (θ = 21.2°) and G2-4OH-C2 (θ = 20.9°) has a small effect on the gaps, with the values decreasing to 1.56 eV and 1.70 eV, respectively. The calculated optical band gap for G2-14OH (θ = 21.8°) is 1.64 eV. This model combines the functionalisation of G2-2OH-C1 (optical gap: 1.80 eV) and the substitutions of G2-12OH (optical gap: 3.21 eV), which confirms that the most important effect on the optical band gap is the distortion of the geometry induced by the hydroxyl groups.
The effect of functionalisation on larger QDs is illustrated for G3 and G4. While increasing the size of the aromatic system reduces the optical gaps, the effect of functionalization in larger QDs is similar to the observed for G2. The optical gaps are shifted to the red, with a larger effect of the basal plane functionalisation. The experimental absorption spectrum for G3 in dichloromethane (dielectric constant = 8.93) shows the first band at 2.8 eV associated with the S0–S1 transition. The optical gap for G3 is 3.15 eV (Fig. 4), which is about 0.4 eV smaller than in G2. The fluorescence excitation spectrum of G3 in a supersonic beam showed the S1–S0 emission band (0–0 transition) at 2.66 eV,54 which is in very good agreement with our calculated value of 2.79 eV. This transition showed a small red shift (about 0.01 eV) in 1-methylnaphthalene solvent (dielectric constant = 2.7).54
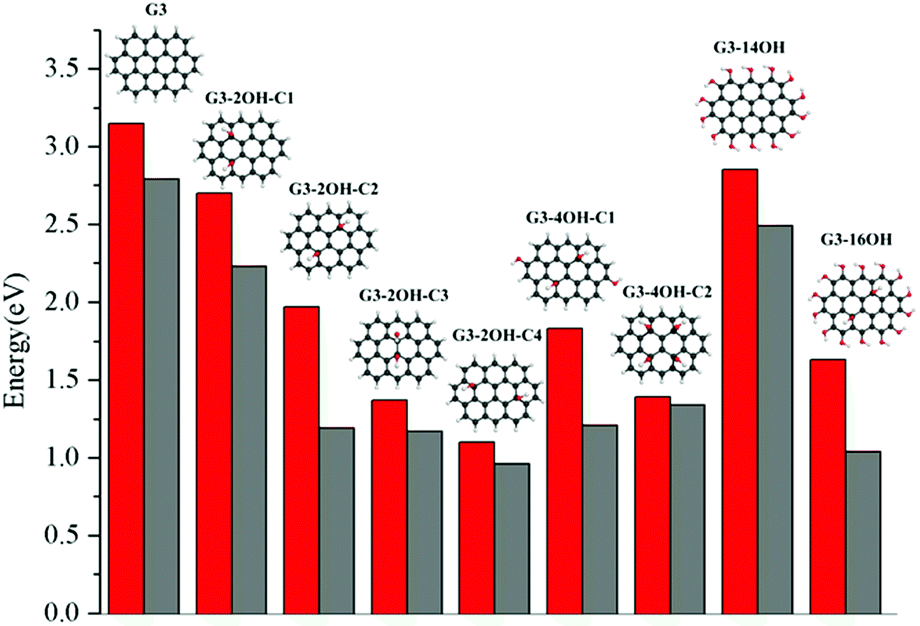 | ||
| Fig. 4 S1–S0 optical gaps (in eV) calculated at the TDDFT-ωB97X-D/6-311+G(d) level of theory for the OH functionalised quantum dots based on pristine G3. Red bars correspond to the vertical excitation and grey bars to the fluorescence energy. | ||
G3 belongs to a lower symmetry group compared to G2 and G4. Here, we consider the functionalisation of non-equivalent positions in G3. The largest shift from the G3 optical gap is obtained for G3-2OH-C4 (θ = 17.6°), with an optical gap of 1.10 eV, followed by G3-2OH-C3 (1.37 eV, θ = 14.1°) (ESI†). While both GO-QDs show an important geometry distortion, there are other G3 based GO-QDs with a more significant deviation from the plane. The reason for these small optical gaps is the functionalisation of positions with large electron–hole separation, which is analysed in the next section.
The effect of selective functionalisation of G4 on the optical gaps is illustrated in Fig. 5. The calculated optical gap for G4 is 2.68 eV. The largest effect on the gaps is obtained for G4-22OH (θ = 19.9°) with similar functionalisation to that in G4-18OH (θ = 9.8°) and G4-4OH (θ = 18.7°).
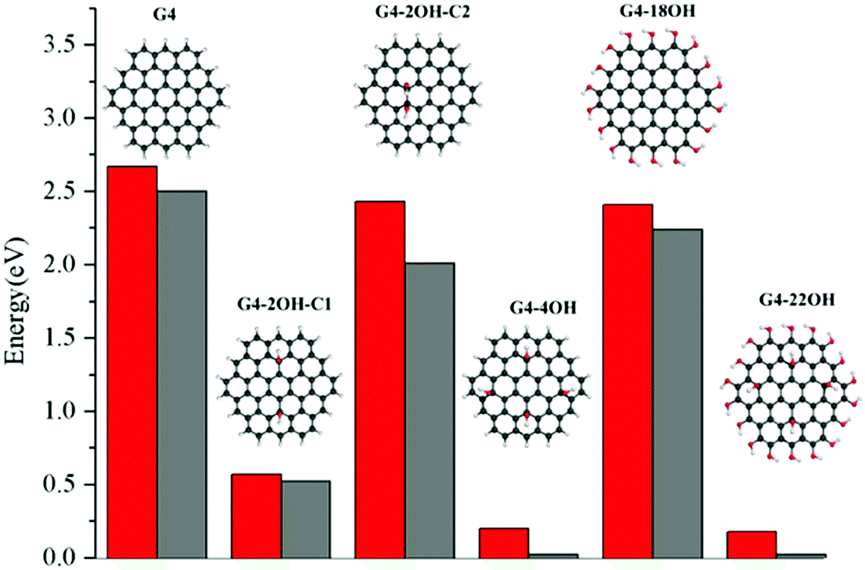 | ||
| Fig. 5 S1–S0 optical gaps (in eV) calculated at the TDDFT-ωB97X-D/6-311+G(d) level of theory for the OH functionalised quantum dots based on pristine G4. Red bars correspond to the vertical excitation and grey bars to the fluorescence energy. | ||
Controlling the fluorescence wavelength is very important for a wide range of applications. Small changes in the geometries in S1 with respect to the Franck–Condon geometry were found. Consequently, the optical gaps and fluorescence energies are correlated (Fig. 3–5). All considered GO-QDs have their fluorescence wavelength shifted to the red with respect to the corresponding pristine G-QDs. The substitution of all the Franck–Condon geometry edge hydrogens shifted the fluorescence about 0.3 eV with respect to the pristine G-QDs. The oscillator strengths of these transitions are reported in the ESI.†
Fig. 6 shows the calculated GO-QDs with fluorescence in the visible region. The rest of the calculated GO-QDs have their emission wavelength in the infrared region or lower energy regions. If a significant shift is required, the basal carbons have to be functionalised. The combined effect of increasing the size of the GO-QDs and selective substitution can produce crossings between S1 and S0. This reduction of the gap is not favourable for applications because of competition between fluorescence and non-radiative mechanisms that are more likely to happen if the gap is small.
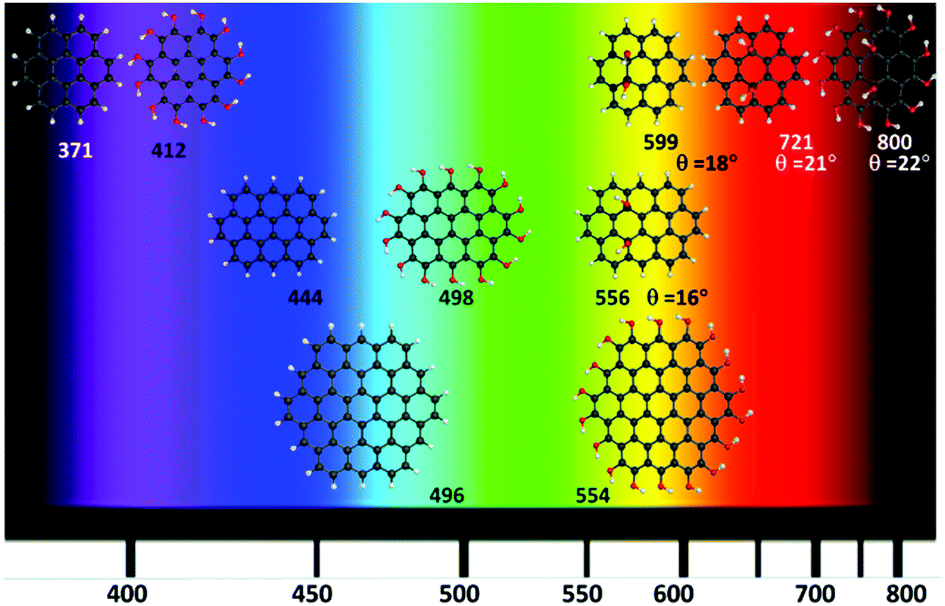 | ||
| Fig. 6 Calculated G-QDs with fluorescence in the visible (nm) (TDDFT-ωB97X-D/6-311+G(d)). | ||
Electron–hole separation
The study of the S1–S0 electron density differences shows the combined effect of all involved electronic transitions (Fig. 7–9). This analysis also provides information about the electron–hole separation induced by the electronic excitation. It has been proposed that fluorescence of GO-QDs can be associated with confinement of electrons within the sp2 electron density clusters.18 The plots of the electron density S1–S0 differences show localisation of electron density in specific regions of the GO-QDs. The mechanism of fluorescence of GO-QDs has also been associated with the CT to and from the functional groups during the electronic transition.Basal plane functionalisation affects the geometries of the GO-QDs, which are not planar due to the change of hybridisation of the functionalised carbons from sp2 to sp3. At the same time, the contribution of the oxygen orbitals to electronic transitions destabilises the occupied molecular orbitals. The analysis of the electron densities of the excited state can aid in identifying which of these factors play a major role in the fluorescence mechanism. Our calculations show that the optical gap and emission are controlled by the creation of localised electron densities and that the role of CT to and from the hydroxyl groups is minor.
Functionalisation on the basal plane has an important effect on the electron–hole separation. The deformation of the geometry creates clusters with a large separation of the electron–hole. In contrast, functionalisation on the edge positions does not change significantly the distribution of the electron densities with respect to the pristine G-QDs (Fig. 7). This explains the minor effect of functionalisation on edge positions on the optical gaps and emission energies.
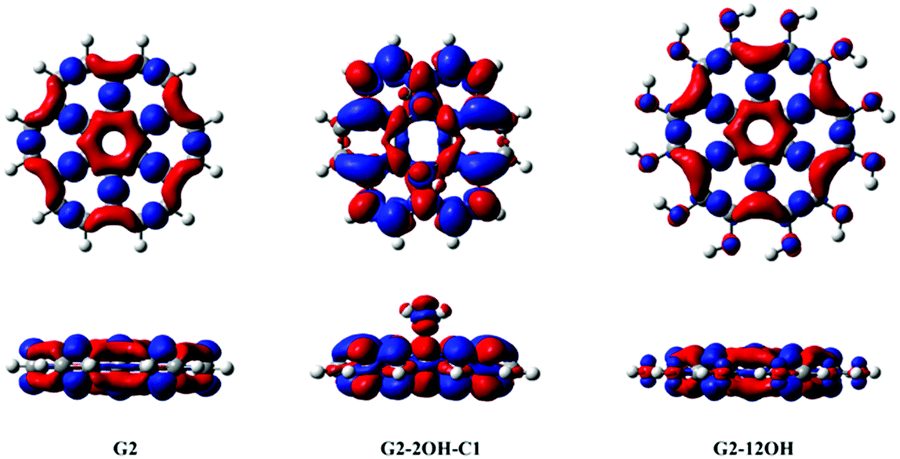 | ||
| Fig. 7 Electron density differences (S1–S0) for G2, G2-2OH-C1 and G2-12OH. At the bottom, the lateral views are shown. Positive regions are in red and negative regions are in blue. (Contours: 0.0004) | ||
In the case of G2 and G2-12OH, the excitation to S1 increases the electron density on the central aromatic ring (1,1).55 Only a small fraction of electron density from the hydroxyl groups is transferred to the aromatic system. To quantify the magnitude of the CT, we calculated the NBO charges in S0 and S1.
Our calculations show that in the case of G2-2OH-C1, the S0–S1 transition only increases the electron density of each hydroxyl oxygen about 0.013 e. For G2-12OH, a decrease of the electron density of about 0.004 e is found on each oxygen. In the case of G2-14OH, which combines edge and basal plane functionalisation, there is a small increase of the electron density on oxygen bonded to the basal C (0.011 e). The value of electron density on the hydroxyl groups depends on the position of the group. These calculations show that the CT from and to the hydroxyl groups does not play an important role in the first excited state and in the fluorescence of these GO-QDs.
The difference of S1–S0 electron densities shows a different pattern in G3 when compared to G2. Excitation promotes electron density from three carbon centre π(C–C–C) to π(C–C) bonds (Fig. 8). In line with tuning of the optical gaps, functionalisation of the edge positions (G3-12OH) has a small effect on the electron densities, showing a similar symmetry and patterns as that obtained for G3. Our NBO calculations also show a small electron transfer between the hydroxyl groups and the QDs. In the case of G3-2OH-C1, the total electron transfer to the two hydroxyl groups is 0.03 e, which is larger than that obtained for similar G2 based GO-QDs but still very small. The transfer from OH to the aromatic system in G3-12OH is also small, with an electron density of only 0.05 e transferred from the G-QD (about 0.004 per OH group).
 | ||
| Fig. 8 Electron density differences (S1–S0) for G3, G3-2OH-C1, G3-2OH-C3 and G3-12OH. At the bottom, the lateral views are shown. Positive regions are in red and negative regions are in blue. (Contours: 0.0004) | ||
To analyse the effect of the position of the functional group on the gaps, we consider the functionalisation of G3 with two OH groups in the series G3-2OH-C1, G3-2OH-C2, G3-2OH-C3, and G3-2OH-C4. This series shows the important role of the position of the OH groups, which can be understood by analysing the electron–hole distribution in G3. G3-2OH-C3 and G3-2OH-C4 are obtained by functionalising carbon atoms with significant electron density (S1–S0) in the pristine G3. Consequently, they show a larger deviation of the optical gaps (Fig. 8).
In the series G3-2OH-C1, G3-2OH-C2, G3-4OH-C1, G3-4OH-C2, and G3-16OH, two OH groups are the functionalising positions with a node in the S1–S0 electron density. For these cases, a larger distortion of the geometry is related to larger deviation from the G3 optical gap (ESI†). Increasing the number of hydroxyl groups from G3-2OH-C2 to G3-4OH-C1 has a minor effect on the optical gap (1.97 eV to 1.83 eV). This effect is more important for G3-14OH, where all hydrogens are substituted, but the main changes with respect to G3 are due to the functionalisation of the basal plane positions similar to G2-14OH.
Our calculations show a small effect of the CT from or to the OH groups, with similar tendencies to that observed for G2GO-QDs. In the case of functionalisation of the basal plane positions, a small electron transfer from the GDs can be found. For the G3 based G-QDs, the maximum CT value was 0.02 e in the case of G3-18OH, to one of the OH bonded to a basal plane carbon. For the G4 based G-QDs, the maximum CT is obtained for G4-22OH (0.03 e). The electron transfer from the OH on the edge positions is one order of magnitude smaller. These calculations show that the magnitude of CT from and to OH groups is very small, but there is a tendency of increasing the magnitude with the size of the G-QDs.
The comparison of the electron density (S1–S0) differences of G2 and G4 shows an inverse pattern (Fig. 9). The S0–S1 electron transition transfers electron density from the central C6 aromatic unit (1,1) to the adjacent C–C bonds. That means that the hole has an important density on the central unit, in contrast to G2 where the electron had a more significant density in the (1,1) central unit. There is a reordering of the frontier orbitals from G2 to G4, where the HOMO and HOMO−1 occupied orbitals of G2 resemble the LUMO and LUMO+1 of G4 (ESI†).
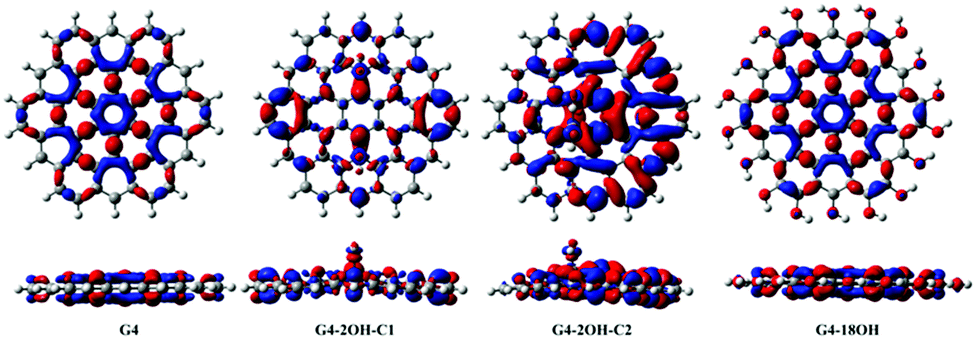 | ||
| Fig. 9 Electron density differences (S1–S0) for G4, G4-2OH-C1, G4-2OH-C2 and G4-18OH. At the bottom, the lateral views are shown. Positive regions are in red and negative regions are in blue. (Contours: 0.0004) | ||
G2 and G4 belong to the same series of D6h polycyclic hydrocarbons. Analysis of the ground state electron density using the natural density partitioning method shows that coronene (G2) has a layer of delocalised concentric pi-systems and circumcoronene (G4) has seven localised sextets, with only one Clar's structure (Fig. 10).56 Clar's rule states that the Kekulé resonance structure with a larger number of disjoint aromatic sextets is the most important for the characterization of the properties of the ground state.57
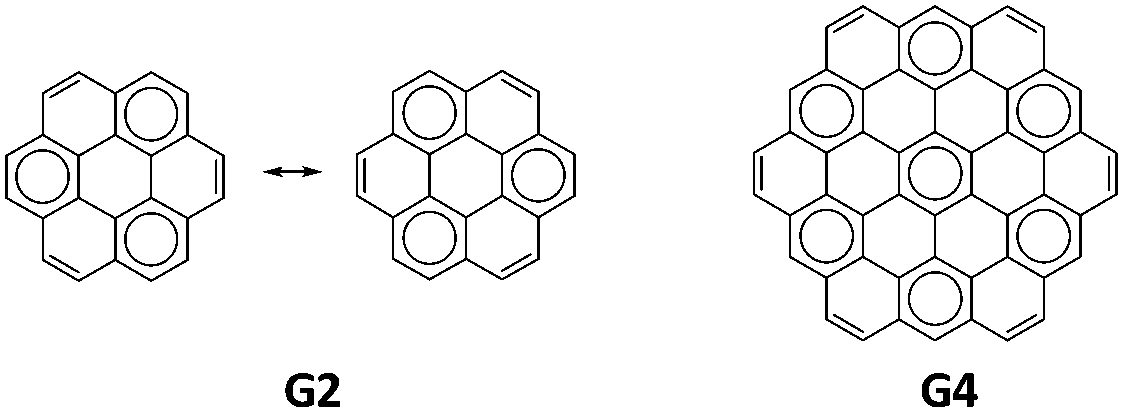 | ||
| Fig. 10 Clar's structures for G2 and G4 showing the sextet in the ring (1,1) for G4 and the external sextets for G2. | ||
This rule has implications for the electronic structure of the excited states because those structures with the least amount of aromatic sextets will contribute more significantly to the excited states. Considering the topology of G2, the resonance structure with a larger number of disjoint sextets has 3 sextets in the outer region, while the resonance structure with one Kekulé structure contributes. Taking these ideas into account, Clar's rule beautifully explains the opposite behaviour of electron density differences observed for G2 and G4.
Li et al. used quasiparticle calculations to analyse the effect of substitutions at one edge position of G4 for different substituents, including OH.26 The authors discussed the effect of orbital hybridisation and CT on the electronic structure and optical properties. Hybridisation was associated with a reduction of the gap, while CT was associated with opening of the gap. In the case of OH, significant hybridisation on the HOMO orbital was found, with a little effect on the LUMO orbital. The authors found a transfer of 0.93 e from the QD to the OH group based on atoms in molecules electron partition of the electron density. To compare with their results, we consider the QD as well (G4-OH) (ESI†).
In the ground state, we found a smaller electron transfer with NBO of about −0.2 e (−0.67 e for O and +0.47 e for H). Considering the differences in the electron densities between S1 and S0, only 0.002 e is transferred from the G-QD to the OH during the electron transition, which is in line with the small variation of the optical gap obtained for this G-QD. The optical band gap calculated at TDDFT-ωB97X-D/6-311+G(d) is 2.67 eV, which is only 0.01 eV shifted with respect to the G4-QDs. These calculations show that the CT from and to the OH does not have an important effect on the optical gap or the fluorescence mechanism.
Higher energy excited states
Fig. 2 shows that functionalisation has an important effect on the higher energy excited states. Regardless of their small intensities, some intermediate states could participate in the relaxation to the ground state. For example, S2 might be involved in the de-excitation process of all considered GO-QDs. Non-adiabatic dynamics simulations showed the role of the intermediate states in the relaxation of perylene esters.58 Here, we focus on the analysis of the effect of the brightest excited states, which have the most important contribution to the spectra. The effect of functionalisation on the absorption spectra is illustrated in the case of G2-2OH-C1.The nuclear ensemble approximation was used to consider the effect of the vibrations on the absorption spectrum (Fig. 10).40G2 has only two bright states in the region between 3.5 and 6.4 eV (first 20 excited states). These states are degenerate and correspond to S3 and S4 (4.71 eV and oscillator strength of 1.061, symmetry D6h). The predicted band associated with the first bright state transition is red-shifted about 0.2 eV (4.5 eV). While considering the solvent the band is further red-shifted about 0.1 eV (4.4 eV), which shows a much better agreement with the experimental value of 4.10 eV.52
The main effect of functionalisation on the spectra is the shift to the red, which is very important in the case of G2-2OH-C1 because of the functionalisation of the basal plane carbons (Fig. 11). The first band, associated with the S0–S1 transition, is more intense than in the pristine G2. The intensities of the brightest states (S3 and S4) are distributed among several excited states in G2-2OH-C1 and other models. In the series G2, G2-2OH-C1, G2-2OH-C2, G2-4OH-C1, and G2-4OH-C2, the energies of the first bright states are 4.71 (S3, S4), 3.25 (S3), 3.11 (S3), 3.25 (S3), and 3.11 (S3) respectively.
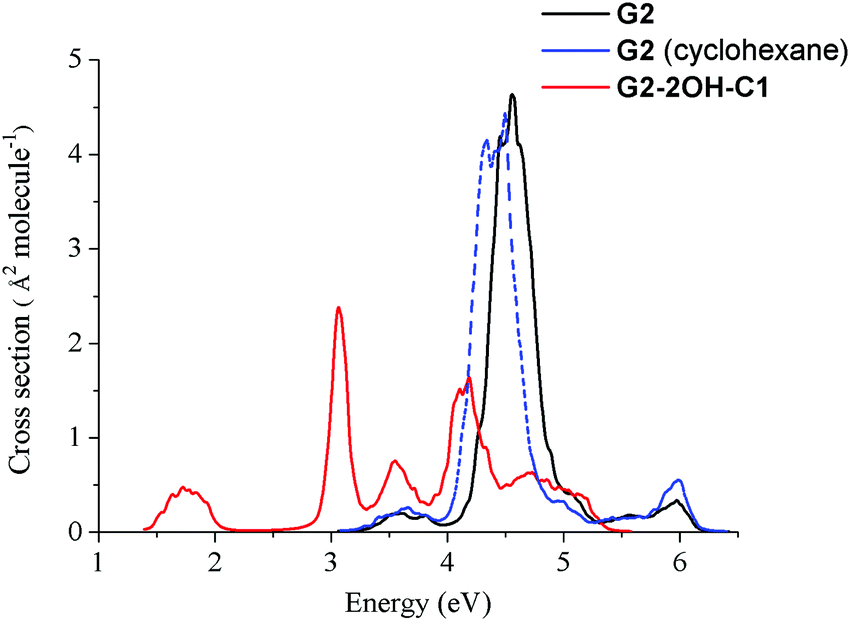 | ||
| Fig. 11 Spectra of G2 and G2-2OH-C1 quantum dots calculated at the TDDFT-ωB97X-D/6-311+G(d) level of theory using the nuclear ensemble approximation. | ||
In general, substitutions on the basal plane positions lower the symmetry increasing the number of excited states with oscillator strengths larger than 0.1, but with smaller individual values (ESI†). Consequently, new features are found in the spectra (Fig. 11). For G2-12OH, where all edge positions are functionalised with hydroxyl groups (symmetry S6), the energies of the brightest excited states are shifted to 4.23 eV (oscillator strength of 1.094) with similar stabilisation to that obtained for S1.
In contrast to G2 and G4, where S1 has zero oscillator strength, for G3 S1 has an oscillator strength of 0.221 with an important contribution from the HOMO–LUMO transition (90%). The brightest excited state is S6 (E = 4.32 eV, oscillator strength = 1.695) followed by S7 (E = 4.52 eV, oscillator strength = 0.429) (ESI†). For S6, the main electronic transitions are HOMO → LUMO+1 (48%) and HOMO−1 → LUMO (48%), while for S7, the HOMO−1 → LUMO+2 transition has a contribution of 78%.
The functionalisation of the edge positions in G3-14OH shifted the energies of these states to E(S6) = 3.94 eV and E(S7) = 4.09 eV. The energy of the brightest excited states for basal plane functionalised GO-QDs is more affected. In the case of G3-16OH which combines functionalisation of the basal plane and the edge positions, the brightest excited state is S14 (E = 4.50 eV, oscillator strength = 0.713). There are many excited states with significant oscillator strengths, such as S5 (E = 3.34 eV, oscillator strength = 0.223), S6 (E = 3.46 eV, oscillator strength = 0.323), S8 (E = 3.88 eV, oscillator strength = 0.631), S10 (E = 4.15 eV, oscillator strength = 0.344), and S12 (E = 4.39 eV, oscillator strength = 0.272).
For G3 based GO-QDs, the energy of the brightest excited states depends significantly on the position of the functionalisation. In general, the energy of the state is shifted to the red, but some substitution patterns show a small shift or even a shift to the blue. These differences are related to the reordering of the orbitals because of functionalisation and the creation of localised electron density clusters. In the case of G3-2OH-C1, G3-2OH-C3, and G3-2OH-C4, the energy of the brightest excited state is shifted to the red with energies of 3.71 eV (S6), 3.12 eV (S4) and 3.52 eV (S6) respectively.
In the case of G3-2OH-C2, where two of the carbons are functionalised, the brightest states E(S8) = 4.23 eV (oscillator strength, 0.331), E(S9) = 4.37 eV (oscillator strength, 0.643), E(S13) = 4.79 eV (oscillator strength, 0.376) and E(S15) = 4.97 eV (oscillator strength, 0.638), which are close or blue-shifted with respect to the brightest states of G3.
If two hydroxyl groups are added to the edge positions to obtain G3-4OH-C1, the energy of these transitions is shifted to the red with E(S7) = 4.05 eV (oscillator strength, 0.407) and E(S9) = 4.24 eV (oscillator strength, 0.794). Adding the hydroxyl groups symmetrically in G3-4OH-C2 produces a pattern similar to that observed for G3-2OH-C1, with a further redshift with E(S3) = 1.22 eV (oscillator strength, 1.219). These calculations show the important effect of the position of the functional groups on tuning the absorption properties of these GO-QDs. Similarly to the case of G2, functionalisation of G3 to G3-2OH-C1 shifted the whole spectrum to the red (Fig. 12). In contrast to G2 the intensity of the first band decreased.
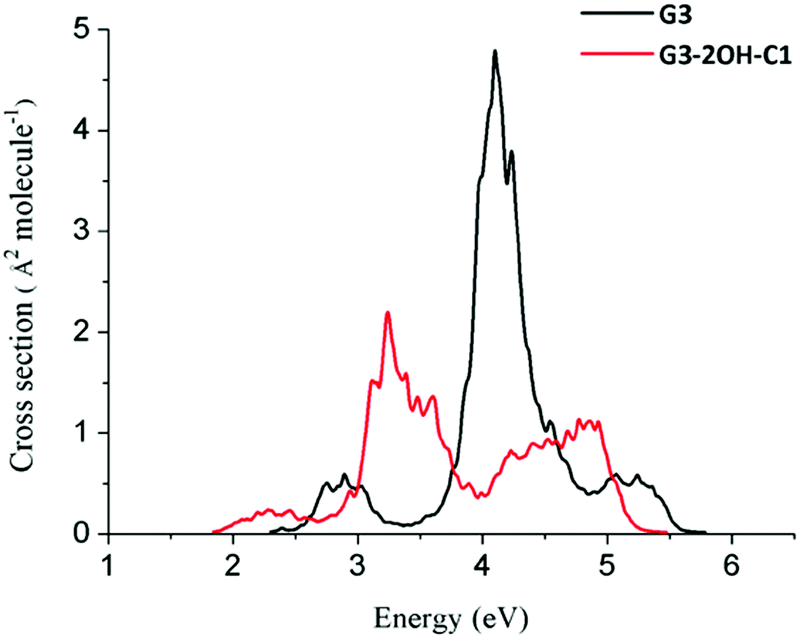 | ||
| Fig. 12 Spectra of G3 and G3-2OH-C1 quantum dots calculated at the TDDFT-ωB97X-D/6-311+G(d) level of theory using the nuclear ensemble approximation. | ||
For G4, the brightest excited states are the degenerate S3 and S4 with an energy of 3.58 eV and an oscillator strength of 1.579. For G4-18OH, the energy of these states is shifted to 3.22 eV (oscillator strength = 1.657), which is similar to the shift for S1. Functionalisation in the basal plane has a very strong effect on the energy levels of G4 based QDs, as we have already discussed in the case of S1. For the GO-QDs showing the most important shifts for S1 (G4-2OH-C1, G4-4OH and G4-22OH) the brightest states shifted to the red.
In the case of G4-2OH-C1, the brightest excited state is S8 with an energy of 2.94 eV. The addition of two hydroxyl groups to obtain G4-4OH shifted the energy to 2.89 eV. But several intermediate excited states showed significant intensity such as S6 (1.26 eV, oscillator strength = 0.121), S7 (2.06 eV, oscillator strength = 0.1087), S9 (2.43 eV, 0.1098) and S11 (2.64 eV, oscillator strength = 0.387). The brightest excited state in G4-22OH is S13 with an energy of 2.58 eV (oscillator strength = 0.559). For G4-2OH-C2, in the low energy region, we can find S3, S4 and S5 (3.19, 3.24 and 3.60 eV) with important oscillator strengths.
Conclusions
We modelled the effect of OH-functionalisation on the electronic structure of zigzag-edge GO-QDs. The effects of CT and geometry distortion on the optical gaps and fluorescence mechanism were considered. Unlike previous theoretical studies on G-QDs that considered the features of the frontier molecular orbitals, our analysis is based on the study of electron densities of the excited states.Our calculations clearly show that the electronic properties of GO-QDs can be tuned by selective functionalisation with OH groups. Functionalisation with hydroxyl groups decreases the ionisation potentials of the GO-QDs with respect to the associated pristine G-QDs. Charge transfer from and to the hydroxyl groups does not play an important role in the fluorescence mechanism. More importantly, localization of sp2 clusters due to the distortion of the geometry controls the S1–S0 transitions.
We predicted that the functionalisation of the positions with larger electron–hole separation in the pristine G-QDs affects largely the properties. Hydroxyl groups located on the basal plane have a remarkable effect on the properties, while substitutions on the edge plane affect the properties to a minor extent.
For functionalisation of positions with similar electron–hole separation in the pristine G-QDs, the optical gap strongly correlates with the distortion of the geometry induced by the substituent. The effect of increasing the functional groups depends on the position of the functionalisation and to what extent the geometry is deviated from the plane. Thus our analysis offers a strategy to tune the properties of GO-QDs based on the distortion of the geometry and the functionalisation of positions with large electron–hole separation in the pristine G-QDs.
Experiments have shown that reduction of oxidised GO-QDs blue shifted the fluorescence.17,59 Our theoretical investigations show a similar tendency when the number of hydroxyl groups decreases from the functionalised GO-QDs to the corresponding pristine G-QDs.
Extensive functionalisation of basal plane positions should be damaging for several applications due to the associated reduction of the optical gap and fluorescence energy, which can increase the probability of non-radiative crossings to the ground state. These results open up new opportunities for the design of OH functionalised GO-QDs for a wide range of applications.
Acknowledgements
The calculations were performed using the Queen Mary's MidPlus computational facilities, supported by QMUL Research-IT and funded by EPSRC grant EP/K000128/1 and NTU HPC clusters. RCO acknowledges the support from the School of Biological and Chemical Sciences at Queen Mary University of London.References
- K. P. Loh, Q. Bao, G. Eda and M. Chhowalla, Nat. Chem., 2010, 2, 1015–1024 CrossRef CAS PubMed.
- G. Eda, G. Fanchini and M. Chhowalla, Nat. Nanotechnol., 2008, 3, 270–274 CrossRef CAS PubMed.
- G. Eda and M. Chhowalla, Adv. Mater., 2010, 22, 2392–2415 CrossRef CAS PubMed.
- P. V. Kamat, J. Phys. Chem. Lett., 2011, 2, 242–251 CrossRef CAS.
- J. M. Yun, J. S. Yeo, J. Kim, H. G. Jeong, D. Y. Kim, Y. J. Noh, S. S. Kim, B. C. Ku and S. I. Na, Adv. Mater., 2011, 23, 4923–4928 CrossRef CAS PubMed.
- X. Zhu, Y. Zhu, S. Murali, M. D. Stoller and R. S. Ruoff, ACS Nano, 2011, 3333–3338 CrossRef CAS PubMed.
- J. William S. Hummers and R. E. Offeman, J. Am. Chem. Soc., 1958, 80, 1339 CrossRef.
- T. Szab, O. Berkesi, P. Forg, K. Josepovits, Y. Sanakis, D. Petridis and I. Dkny, Chem. Mater., 2006, 2740–2749 CrossRef.
- A. Hunt, D. A. Dikin, E. Z. Kurmaev, T. D. Boyko, P. Bazylewski, G. S. Chang and A. Moewes, Adv. Funct. Mater., 2012, 22, 3950–3957 CrossRef CAS.
- M. Z. Hossain, J. E. Johns, K. H. Bevan, H. J. Karmel, Y. T. Liang, S. Yoshimoto, K. Mukai, T. Koitaya, J. Yoshinobu, M. Kawai, A. M. Lear, L. L. Kesmodel, S. L. Tait and M. C. Hersam, Nat. Chem., 2012, 4, 305–309 CrossRef CAS PubMed.
- A. Bagri, C. Mattevi, M. Acik, Y. J. Chabal, M. Chhowalla and V. B. Shenoy, Nat. Chem., 2010, 2, 581–587 CrossRef CAS PubMed.
- C. Y. Kong, W. L. Song, M. J. Meziani, K. N. Tackett, L. Cao, A. J. Farr, A. Anderson and Y. P. Sun, J. Supercrit. Fluids, 2012, 61, 206–211 CrossRef CAS.
- G. Eda, Y. Y. Lin, C. Mattevi, H. Yamaguchi, H. A. Chen, I. S. Chen, C. W. Chen and M. Chhowalla, Adv. Mater., 2010, 22, 505–509 CrossRef CAS PubMed.
- W. Gao, L. B. Alemany, L. Ci and P. M. Ajayan, Nat. Chem., 2009, 1, 403–408 CrossRef CAS PubMed.
- S. Hu, Chem. Rec., 2016, 16, 219–230 CrossRef CAS PubMed.
- J.-A. Yan, L. Xian and M. Y. Chou, Phys. Rev. Lett., 2009, 103, 86802 CrossRef PubMed.
- H. Zheng, Q. Wang, Y. Long, H. Zhang, X. Huang and R. Zhu, Chem. Commun., 2011, 47, 10650 RSC.
- M. A. Sk, A. Ananthanarayanan, L. Huang, K. H. Lim and P. Chen, J. Mater. Chem. C, 2014, 2, 6954 RSC.
- M.-H. Jang, H. D. Ha, E.-S. Lee, F. Liu, Y.-H. Kim, T. S. Seo and Y.-H. Cho, Small, 2015, 11, 3773–3781 CrossRef CAS PubMed.
- J. T. Robinson, S. M. Tabakman, Y. Liang, H. Wang, H. S. Casalongue, D. Vinh and H. Dai, J. Am. Chem. Soc., 2011, 133, 6825–6831 CrossRef CAS PubMed.
- S. Vempati and T. Uyar, Phys. Chem. Chem. Phys., 2014, 16, 21183–21203 RSC.
- J. Peng, W. Gao, B. K. Gupta, Z. Liu, R. Romero-Aburto, L. Ge, L. Song, L. B. Alemany, X. Zhan, G. Gao, S. A. Vithayathil, B. A. Kaipparettu, A. A. Marti, T. Hayashi, J.-J. Zhu and P. M. Ajayan, Nano Lett., 2012, 12, 844–849 CrossRef CAS PubMed.
- S. S. R. K. C. Yamijala, M. Mukhopadhyay and S. K. Pati, J. Phys. Chem. C, 2015, 119, 12079–12087 CAS.
- M. Zhao, F. Yang, Y. Xue, D. Xiao and Y. Guo, ChemPhysChem, 2014, 15, 157–164 CrossRef CAS PubMed.
- C. Cocchi, D. Prezzi, A. Ruini, M. J. Caldas and E. Molinari, J. Phys. Chem. C, 2012, 116, 17328–17335 CAS.
- Y. Li, H. Shu, X. Niu and J. Wang, J. Phys. Chem. C, 2015, 119, 24950–24957 CAS.
- C. Cocchi, D. Prezzi, A. Ruini, M. J. Caldas and E. Molinari, J. Phys. Chem. C, 2012, 116, 17328–17335 CAS.
- M. Zhao, F. Yang, Y. Xue, D. Xiao and Y. Guo, ChemPhysChem, 2014, 15, 950–957 CrossRef CAS PubMed.
- I. A. Popov and A. I. Boldyrev, Eur. J. Org. Chem., 2012, 3485–3491 CrossRef CAS.
- P. Johari and V. B. Shenoy, ACS Nano, 2011, 5, 7640–7647 CrossRef CAS PubMed.
- C. Cocchi, D. Prezzi, A. Ruini, M. J. Caldas and E. Molinari, J. Phys. Chem. Lett., 2011, 2, 1315–1319 CrossRef CAS PubMed.
- S. S. R. K. C. Yamijala, M. Mukhopadhyay and S. K. Pati, J. Phys. Chem. C, 2015, 119, 12079–12087 CAS.
- M. E. Casida, THEOCHEM, 2009, 914, 3–18 CrossRef CAS.
- A. D. Becke, J. Chem. Phys., 1993, 98, 5648 CrossRef CAS.
- J.-D. Chai and M. Head-Gordon, Phys. Chem. Chem. Phys., 2008, 10, 6615–6620 RSC.
- K. Sen, R. Crespo-Otero, W. Thiel and M. Barbatti, Comput. Theor. Chem., 2014, 1040–1041, 237–242 CrossRef CAS.
- K. Sen, R. Crespo-Otero, O. Weingart, W. Thiel and M. Barbatti, J. Chem. Theory Comput., 2013, 9, 533–542 CrossRef CAS PubMed.
- C. Hättig and A. Köhn, J. Chem. Phys., 2002, 117, 6939 CrossRef.
- R. Krishnan, J. S. Binkley, R. Seeger and J. A. Pople, J. Chem. Phys., 1980, 72, 650 CrossRef CAS.
- R. Crespo-Otero and M. Barbatti, Theor. Chem. Acc., 2012, 131, 1237 CrossRef.
- M. Barbatti, G. Granucci, M. Ruckenbauer, F. Plasser, R. Crespo-Otero, J. Pittner, M. Persico and H. Lischka, NEWTON-X: a package for Newtonian dynamics close to the crossing seam, 2013, http://www.newtonx.org Search PubMed.
- J. Tomasi, B. Mennucci and R. Cammi, Chem. Rev., 2005, 105, 2999–3093 CrossRef CAS PubMed.
- J.-L. Bredas, Mater. Horiz., 2014, 1, 17–19 RSC.
- A. E. Reed, R. B. Weinstock and F. Weinhold, J. Chem. Phys., 1985, 83, 735 CrossRef CAS.
- M. J. Frisch, G. W. Trucks, H. B. Schlegel, G. E. Scuseria, M. A. Robb, J. R. Cheeseman, G. Scalmani, V. Barone, B. Mennucci, G. A. Petersson, H. Nakatsuji, M. Caricato, X. Li, H. P. Hratchian, A. F. Izmaylov, J. Bloino, G. Zheng, J. L. Sonnenberg, M. Hada, M. Ehara, K. Toyota, R. Fukuda, J. Hasegawa, M. Ishida, T. Nakajima, Y. Honda, O. Kitao, H. Nakai, T. Vreven, J. A. Montgomery, Jr., J. E. Peralta, F. Ogliaro, M. Bearpark, J. J. Heyd, E. Brothers, K. N. Kudin, V. N. Staroverov, T. Keith, R. Kobayashi, J. Normand, K. Raghavachari, A. Rendell, J. C. Burant, S. S. Iyengar, J. Tomasi, M. Cossi, N. Rega, J. M. Millam, M. Klene, J. E. Knox, J. B. Cross, V. Bakken, C. Adamo, J. Jaramillo, R. Gomperts, R. E. Stratmann, O. Yazyev, A. J. Austin, R. Cammi, C. Pomelli, J. W. Ochterski, R. L. Martin, K. Morokuma, V. G. Zakrzewski, G. A. Voth, P. Salvador, J. J. Dannenberg, S. Dapprich, A. D. Daniels, O. Farkas, J. B. Foresman, J. V. Ortiz, J. Cioslowski and D. J. Fox, Gaussian 09, Revision C.01, Gaussian, Inc., Wallingford CT, 2010 Search PubMed.
- R. Ahlrichs, M. Bär, M. Häser, H. Horn and C. Kölmel, Chem. Phys. Lett., 1989, 162, 165–169 CrossRef CAS.
- C. M. Crudden, J. H. Horton, I. I. Ebralidze, O. V Zenkina, A. B. McLean, B. Drevniok, Z. She, H.-B. Kraatz, N. J. Mosey, T. Seki, E. C. Keske, J. D. Leake, A. Rousina-Webb and G. Wu, Nat. Chem., 2014, 6, 409–414 CrossRef CAS PubMed.
- K. R. Geethalakshmi, X. Yang, Q. Sun, T. Y. Ng and D. Wang, RSC Adv., 2015, 5, 88625–88635 RSC.
- A. B. Shivanandareddy, M. Kumar, V. Lakshminarayanan and S. Kumar, RSC Adv., 2015, 5, 47692–47700 RSC.
- P. V. C. Medeiros, G. K. Gueorguiev and S. Stafström, Phys. Rev. B: Condens. Matter Mater. Phys., 2012, 85, 205423 CrossRef.
- E. Clar, J. M. Robertson, R. Schloegl and W. Schmidt, J. Am. Chem. Soc., 1981, 103, 1320–1328 CrossRef CAS.
- R. Rieger, M. Kastler, V. Enkelmann and K. Müllen, Chem. – Eur. J., 2008, 14, 6322–6325 CrossRef CAS PubMed.
- C. Cocchi, D. Prezzi, A. Ruini, M. J. Caldas and E. Molinari, J. Phys. Chem. C, 2012, 116, 17328–17335 CAS.
- A. Amirav, J. Chem. Phys., 1981, 74, 3745 CrossRef CAS.
- I. Gutman, S. J. Cyvin and V. Ivanov-Petrović, Z. Naturforsch., A: Phys. Sci., 1998, 53, 699–703 CrossRef CAS.
- I. A. Popov and A. I. Boldyrev, Eur. J. Org. Chem., 2012, 3485–3491 CrossRef CAS.
- M. Solà, Front. Chem., 2013, 1, 22 Search PubMed.
- J. Vollbrecht, C. Wiebeler, A. Neuba, H. Bock, S. Schumacher and H. Kitzerow, J. Phys. Chem. C, 2016, 120, 7839–7848 CAS.
- C.-T. Chien, S.-S. Li, W.-J. Lai, Y.-C. Yeh, H.-A. Chen, I.-S. Chen, L.-C. Chen, K.-H. Chen, T. Nemoto, S. Isoda, M. Chen, T. Fujita, G. Eda, H. Yamaguchi, M. Chhowalla and C.-W. Chen, Angew. Chem., Int. Ed., 2012, 51, 6662–6666 CrossRef CAS PubMed.
Footnote |
| † Electronic supplementary information (ESI) available. See DOI: 10.1039/c6tc02785g |
| This journal is © The Royal Society of Chemistry 2016 |