β-Cyclodextrin supported MoO3–CeO2 nanocomposite material as an efficient heterogeneous catalyst for degradation of phenol†
Madhukar E. Navgire*a,
Parikshit Gogoib,
Baithy Malleshamc,
Agolu Rangaswamyc,
Benjaram M. Reddy*c and
Machhindra K. Landed
aPost Graduate Department of Chemistry, Jijamata College of Science and Arts Bhende, Maharashtra, India. E-mail: navgireme@yahoo.co.in; Fax: +91 2427255304; Tel: +91 2427255304
bDepartment of Chemistry, Nowgong College, Nagaon, Assam, India
cInorganic and Physical Chemistry Division, CSIR-Indian Institute of Chemical Technology, Uppal Road, Hyderabad, India. E-mail: bmreddy@iict.res.in; mreddyb@yahoo.com; Fax: +91 4027160921; Tel: +91 4027193510
dDepartment of Chemistry, Dr. B. A. M. University, Aurangabad, India
First published on 14th March 2016
Abstract
With the aim of efficiently degrading organic pollutants through an easily operated procedure, a series of MoO3–CeO2 and β-cyclodextrin supported MoO3–CeO2 nano-composite materials were synthesized by using a co-precipitation method. A surfactant such as Cetyl Trimethyl Ammonium Bromide (CTAB) was used during the synthesis of this nano-composite material. These prepared catalysts are thoroughly characterized by various techniques such as XRD, BET, FT-IR, pyridine adsorbed FT-IR, Raman spectroscopy, SEM and TEM. The XRD study results suggested the formation of nanocrystalline materials which is also clearly observed from the SEM and TEM analysis. Raman measurements disclosed the presence of oxygen vacancies and lattice defects in all synthesized nano-composite samples. The catalytic activities of the synthesized materials were successfully tested for the degradation of phenol by using hydrogen peroxide at room temperature. It is surprising that the phenol degradation efficiency of the β-cyclodextrin supported MoO3–CeO2 nano-composite material is exhibited higher than that of other materials, which has been mainly attributed to the promoting effect of β-cyclodextrin. The degradation reaction is carried out at room temperature with continuous stirring and without light irradiation. Therefore, this degradation reaction is different from conventional heterogeneous catalysis or photocatalysis, in which the pollutants cannot be degraded completely, but it may transform from one phase to another phase. The gradual decrease in COD value shows the degradation of phenol that leads to the conversion of organic compounds into harmless gaseous CO2 and inorganic ions. Thus, this reported phenol degradation reaction is a quite promising green technology, which could be widely applied in practice.
1. Introduction
Currently, environmental pollution is a serious challenge for the entire world. Textile dyes and other industrial dyestuffs constitute one of the largest groups of organic compounds containing a large content of aromatics, while conventional biological treatment methods are ineffective for discoloration and degradation in some cases.1 Generally, stable polycyclic aromatic hydrocarbons are contained in organic dye pollutants. Hence, conventional physical procedures cannot effectively degrade all these pollutants.2–5 It is estimated that ca. 10% of the dye is lost during dyeing processes and released into wastewater.6 It is an essential need to develop novel treatment methods for converting these organic dyes to harmless compounds in terms of the increasing public concern and the stringent international environmental standards (e.g., ISO 14001).7 Advanced oxidation processes (AOPs) are powerful methods for the remediation of wastewater and for the removal of color.8 Many of these processes are operated through the generation of hydroxyl radicals (OH˙), which are strong oxidant species that can attack most of the organic structures found in wastewater.8,9 Peroxide (H2O2), ozone (O3) and molecular oxygen (air) have also been widely used as green oxidants in AOPs because of their green by-products and high content of active oxygen species.10 From an economic point of view, molecular oxygen (air) is the cheapest agent for industrial application. Thus, the development of an efficient catalytic system for direct activation of molecular oxygen is of great interest.Catalytic wet peroxide oxidation is a well-known process used for the abatement of water pollutants.11,12 Like other advanced oxidation processes, it is based on the action of hydroxyl and hydroperoxyl radicals produced, in this case, upon catalytic decomposition of hydrogen peroxide under relatively mild operating conditions (50–130 °C, 1–5 atm) in the presence of a solid catalyst. However, the difficulty of developing suitable catalysts is pointed out in the literature,13 being currently the factor limiting the industrial application of peroxide oxidation. This still remains as an important challenge for research on this topic. Current trends are addressed to the development of supported and un-supported metal nanoparticles, being the most studied molybdenum, ceria, magnetite, etc.14,15.
Due to the wide applications in various fields, cerium and molybdenum oxides have great interest of researchers. The cerium can act as a fantastic oxygen storage and release reservoir through a facile mutual transformation of Ce4+/Ce3+ under oxidation–deoxidation conditions.16–19 Likewise, MoO3–CeO2 is an effective selective catalytic reduction catalyst to remove nitrogen oxides (NOx).20,21 Also, V–Mo(W)/TiO2 is one of the most widely commercially used reduction catalyst.22 Furthermore, Ce/TiO2, as a sorbent for elemental mercury (HgO) in simulated flue gas, exhibits the advantages of both catalytic oxidation and oxygen storage. Some study was done on MoO3–CeO2 to catalytic degradation of organic dyes such as rhodamine-B and safranin-T dyes at room temperature.23
Cyclodextrins (CDs) are a group of naturally cyclic oligosaccharides, with six, seven, or eight glucose subunits linked by α-(1,4)-glycosidic bonds in a torus shaped structure and are denominated as α-, β-, and γ-CD, respectively.24 Attention has recently been focused on cyclodextrin based polymeric materials in a wide variety of applications due to their unique sorption properties. The sustained interest in the research and application of cyclodextrin-based copolymer materials is attributed to the ability of forming inclusion compounds with a wide range of organic molecules through host–guest interactions: the interior cavity of the molecule provides a relatively hydrophobic environment into which an apolar organic compound can be trapped. Recently, a number of insoluble cyclodextrin polymer or co-polymers have been widely used for various applications such as contaminants removal from wastewater, protein refolding, drug delivery etc. However, there are few reports on multifunctional β-cyclodextrin containing CuO, Fe3O4 nanoparticles.25,26
In general, both molybdenum oxide and cerium oxide based catalysts have attracted much attention, because of their numerous applications in various fields. Molybdenum oxide based catalysts have been widely used in many important oxide or acid catalytic reactions.27 Furthermore, cerium oxide (or ceria) based materials contain a high concentration of mobile oxygen vacancies, which act as local sources or sinks for the oxygen involved in reactions taking place on the catalyst surface.28 The high oxygen mobility, oxygen storage capacity and strong interaction with the supported metal render this material very interesting for a wide range of catalytic applications involving oxidation and reforming of hydrocarbons.29,30 It is believed that if catalytic wet air oxidation of a dye can occur within very short time at mild conditions, especially at room temperature and atmospheric pressure, a long existence time of oxygen in the system is required. Ceria is a well-known additive for increasing oxygen storage/release capacity. Thus, addition of some MoO3 into CeO2 might enhance the catalytic activity.
Therefore, the purpose of this work was to synthesize series of β-cyclodextrin supported MoO3–CeO2 nanocomposite crystalline material by a modified co-precipitation method and subjected to thermal treatments. The synthesized materials were characterized by using various sophisticated techniques. The catalytic efficiency of this prepared material was evaluated as an oxidation catalyst for the degradation of model organic pollutant such as phenol.
2. Experimental section
2.1 Synthesis of series of MoO3–CeO2
A series of MoO3–CeO2 nanocomposite materials were synthesized with different loadings of molybdenum using co-precipitation method. In a typical experiment, the requisite quantities of aqueous solutions of (NH4)6Mo7O24·4H2O, Ce(NO3)3·6H2O (Aldrich, AR grade), and cetyl-trimethyl ammonium bromide (Aldrich, AR grade) were dissolved in double distilled water and stirred vigorously using magnetic stirrer. Subsequently, the dilute aqueous ammonia solution (25%) was added drop wise to the reaction mixture solution with continuous stirring until the pH reached to ∼8.5. The reaction mixture was continuously stirred for 24 h, and then solution was kept for 24 h to facilitate aging. The resulting precipitated slurry was filtered off, washed with double distilled water, oven dried at 363 K for 24 h, and finally calcined at 773 K for 5 h in air atmosphere. For convenience, the synthesized samples, including 1 wt% MoO3/CeO2, 5 wt% MoO3/CeO2, 10 wt% MoO3/CeO2, and 15 wt% MoO3/CeO2 are designated with MC-1, MC-5, MC-10, and MC-15, respectively.2.2 Preparation of β-cyclodextrin supported MoO3–CeO2
The β-cyclodextrin supported MoO3–CeO2 (CD-MC-15) nanoparticles were prepared by precipitation method. β-Cyclodextrin (0.5 g) was dissolved in double distilled water followed by the addition of finely powder MC-15 (1.7 g). The suspension was then kept with constant stirring for 24 h. Subsequently, the nanoparticles were separated by centrifugation and washed with double distilled water and oven dried for 24 h at 363 K. Finally, it was grounded using mortar-pestle to obtain the final β-cyclodextrin supported MoO3–CeO2 catalyst.2.3 Catalyst characterization
Catalyst characterization is one of the crucial aspects of catalyst design since it gives information about crystallinity, surface structure, active sites, particle size and morphology, as well as some other important characteristic features. The prepared samples were characterized by various sophisticated techniques.The X-ray diffraction data was acquired in the 2θ range of 20–80° on a Rigaku Multiflex instrument using Cu Kα (λ = 1.5418 Å) radiation source and a scintillation counter detector (SCD). Crystalline phases present in the samples were identified with the help of JCPDF-ICDD. Brunauer–Emmett–Teller surface area analysis of samples was characterized by the BET method performing adsorption of nitrogen at 77 K with Micrometrics ASAP 2010.
The Fourier transformation infra-red spectra (FTIR) were recorded on FTIR spectrometer (SHIMADZU-FTIR/4100), Japan in the range 4000–500 cm−1.
Raman spectra were recorded at room temperature on a Horiba Jobin-Yvon HR800 Raman spectrometer fitted with a confocal microscope and liquid-nitrogen cooled charge coupled device (CCD) detector. The emission line at 632.81 nm of Ar+ ion (Spectra Physics) laser was used as an excitation source for the visible Raman spectroscopy. The laser was focused on the sample under a microscope with the diameter of the analyzed spot being ∼1 μm. The acquisition time was adjusted according to the intensity of Raman scattering. The wavenumber values reported from the spectra are accurate to within 1 cm−1.
The powder morphology was observed by scanning electron microscope (SEM), analysis was performed on a JEOL JSM-6700F electron microscope.
The TEM studies were made on a JEM-2010 (JEOL) instrument equipped with a slow-scan CCD camera at an accelerating voltage of 200 kV. Samples for TEM were prepared by crushing the materials in an agate mortar and dispersing them ultrasonically in ethanol. After dispersion, a droplet was deposited on a copper grid supporting a perforated carbon film and allowed to dry.
The UV-vis DRS measurements were performed under ambient conditions using a JASCO Varian UV-vis spectrophotometer in the wavelength range of 200–800 nm with an integration sphere diffuse reflectance attachment. The sample was diluted in a KBr matrix by pelletization.
Chemical Oxygen Demand (COD) was determined by Dichromate reflux method as per APHA-AWWA-WPCF (1980). It is the measure of oxygen consumed by strong oxidizing agent (potassium dichromate) during oxidation of organic matter.
The liquid products obtained after phenol degradation reaction were analyzed by HPLC equipped with 2490 refractive index detector.
2.4 Catalytic activity measurements
The phenol degradation tests were carried out at pH = 7.0 in 25 mL of conical flask placed on a magnetic stirrer at room temperature. In a typical experiment, the reaction suspension was prepared by adding 0.1 g of catalyst amount into 5 mL of pure phenol (45 mM) and 10 mL of 30% H2O2 (100 mM) solution to initiate the reaction. After 1 h of reaction time, the catalyst was separated from the reaction mixture by centrifugation and obtained liquid products were monitored using Ultra-Violet visible (UV-vis) spectrophotometer in the range of 200–800 nm. The change in intensity of peak at λmax for phenol at 270 nm was observed for all the samples. These liquid products were also analyzed by HPLC equipped with 2490 refractive index detector. Each experiment was run in triplicate, average values and standard deviations are presented.3. Results and discussion
3.1 XRD analysis
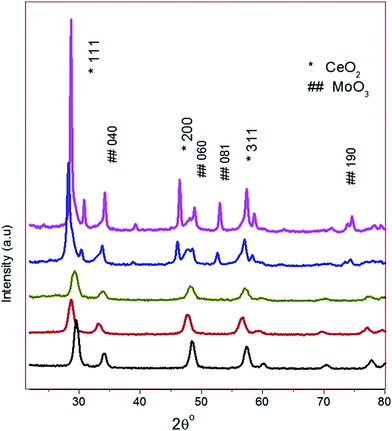
In order to understand the phase symmetry of the prepared samples were systematic analyzed by powder X-ray diffraction (XRD) technique. The XRD profiles of the synthesized catalysts calcined at 773 K are shown in Fig. 1. From Fig. 1(a), the MC-1 material exhibits that the high intense peaks were observed at 2θ values of 29.6, 46.2 and 57.3° with diffraction lines at d-spacing values of 3.1, 1.9 and 1.6°, which are corresponding to (111), (200) and (311) planes of the cubic structure of CeO2, respectively (JCPDS no.43-1002).31 Similarly, low intensity peaks were identified at 2θ values of 34.3, 48.8, 52.9 and 74.6° with diffraction lines at d-spacing values of 3.3, 1.5, 1.3, and 1.1° that are attributed to the planes of (040), (060), (081) and (190), which are indicating presence of small content of orthorhombic MoO3 species. It was clearly noticed from Fig. 1 that all the XRD peaks are identified as MoO3 peaks in the synthesized materials (JCPDS card 76-1003).32 Same diffraction pattern was observed for remaining all series of material shown in Fig. 1(b–d). In addition, as the increasing the Mo loading in the MC-5, MC-10 and MC-15 samples gives gradual increase in peaks intensity (at 2θ° = 26) for the plane of (040) corresponding to the presence of MoO3 species. Interestingly, the XRD pattern of β-cyclodextrin supported MoO3–CeO2 (CD-MC-15) sample is also exhibited a typically same as MoO3–CeO2 sample in the investigated region (Fig. 1(e)). There is no diffraction peaks corresponding to β-cyclodextrin was noticed in the investigated XRD region, it is either due to the amorphous nature or fine dispersion of the β-cyclodextrin on the MoO3–CeO2 material. The average particle size (T) of all samples can be calculated using Scherrer equation as follows.where, T = average particle size, λ = wavelength, θ = diffraction angles, β = FWHM (full width half maximum).
The average crystallite sizes of the powder were calculated on base of the (111) diffraction peak at 2θ° = 29.61 using Debye–Scherrer formula.33 The average particle size of CeO2 decreases with the addition of MoO3, and the smallest crystallite size is observed for CD-MC-15 is found to be 45.055 Å, while largest size of is 90.999 Å for MC-1 shown in Table 1. The gradual decrease in crystallite size from MC-1 to MC-15 as wt% of MoO3 increases from 1–15%. The remarkable decrease the crystallite size was observed in the CD-MC-15 sample, which might be due to the beneficial effect of the β-cyclodextrin towards the inhibition of the crystallite growth against higher thermal treatments. On the other hand, this decreases in size may be due to, Ce4+ ion radius (0.087 nm) is larger than Mo6+ ion radius (0.059 nm), thus when Mo(VI) is introduced into CeO2, the crystal size of CeO2 decreases.34
The obtained BET surface area values of the MC-1, MC-5, MC-10, MC-15, and CD-MC-15 samples are presented in Table 1. The surface area was considerable increased with increasing the Mo-loading in MoO3–CeO2 samples, which is due to inhibit the crystal growth against the higher calcinations temperature. As well, it was found that the addition of β-cyclodextrin significantly enhances the specific surface area of the MoO3–CeO2, which is in good agreement with the crystallite size decrease. It can also be explained by the formation of porous compounds between the β-cyclodextrin and the MC support. The specific surface area of the MC-1, MC-5, MC-10, MC-15, and CD-MC-15 samples are found to be 47, 52, 58, 69, and 83 m2 g−1, respectively.
3.2 FT-IR spectroscopy study
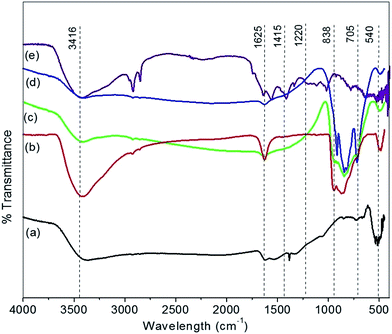
The Fig. 2(a–e) shows the FT-IR spectrums of the prepared materials such as MC-1, MC-5, MC-10, MC-15, and CD-MC-15 over the 4000–500 cm−1 range. Two peaks at 1415, 1220 cm−1 are due to stretching and bending mode of oxygen available in the Ce–O–Ce and the Ce![[double bond, length as m-dash]](https://www.rsc.org/images/entities/char_e001.gif) O indicate that the presence of a CeO2. Three strong vibrations were observed at 838, 705 and 540 cm−1, associated to the stretching and bending mode of Mo–O–Mo and the Mo
O indicate that the presence of a CeO2. Three strong vibrations were observed at 838, 705 and 540 cm−1, associated to the stretching and bending mode of Mo–O–Mo and the Mo![[double bond, length as m-dash]](https://www.rsc.org/images/entities/char_e001.gif) O indicating the existence of a layered orthorhombic MoO3 phase.35 The peak at 1625 cm−1, associated with the vibration mode of the M–OH bond.36 Due to coordinated crystalline water present in material, it gives observed OH-stretching at 3100 cm−1.37 The broad band around 3416 cm−1 is due to O–H stretching vibration modes of the adsorbed water on the surface of the powder.38
O indicating the existence of a layered orthorhombic MoO3 phase.35 The peak at 1625 cm−1, associated with the vibration mode of the M–OH bond.36 Due to coordinated crystalline water present in material, it gives observed OH-stretching at 3100 cm−1.37 The broad band around 3416 cm−1 is due to O–H stretching vibration modes of the adsorbed water on the surface of the powder.38
3.3 Raman spectroscopy
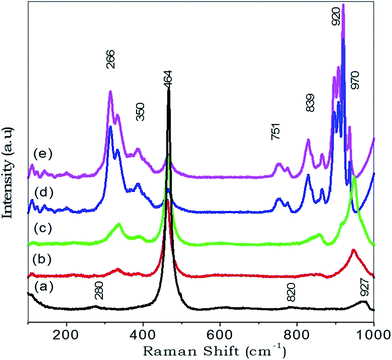
Since the mobility of oxygen atoms in the lattice is a critical property for most of the applications of the mixed oxides, both as ionic/electronic conductors and redox catalysts a deep insight into these structural details is desirable. Raman spectroscopy is a good technique, sensitive to both M–O bond arrangement and lattice defects.39,40The Raman spectra of prepared series of nanocomposite material MC-1, MC-5, MC-10, and MC-15 are shown in Fig. 3(a–d) respectively. The Raman spectra displays a prominent peak at ∼464 cm−1 for CeO2 which indicates the triply degenerate F2g mode of oxygen anions around the cerium cations and a small shoulder at approximately 920 cm−1 assigned as longitudinal optical (LO) mode arises due to relaxation of symmetry rules.41–45 The spectra of catalysts, displayed the appearance of several Raman bands at: 280–355, 464, 751, 820–840, and 920–970 cm−1. These bands were ascribed to different crystalline phases in collaboration with the XRD patterns (Fig. 1). Raman band observed at ∼464 cm−1 is assigned to bulk CeO2 crystallites, while the simultaneous presence of Raman bands 288, 828 and 946 cm−1 are clearly indicative of bulk MoO3 crystallites. The appearance of Mo![[double bond, length as m-dash]](https://www.rsc.org/images/entities/char_e001.gif) O (949 cm−1) and Mo–O–Mo (828 cm−1) vibration modes for the MC-1 to MC-15 catalyst indicates that the MoO3 structures could form on the CeO2 surface with monomeric or polymeric units.46 For instance, the 464 cm−1 bulk CeO2 Raman band was apparent in all series of material and its intensity increased as increased the wt% of MoO3, irrespective of the catalyst support used. The band at ∼335 and ∼828 cm−1 is gives gradual increases in intensity from MC-1 to MC-15 were mainly due to increase in wt% of MoO3 in CeO2.47 The spectra shown in Fig. 3(e) for CD-MC-15 material was same as MoO3–CeO2 sample. Probably, this broad band in high intensity at 266 as well as at 920 cm−1 is due to creation of more number of oxygen vacancies.
O (949 cm−1) and Mo–O–Mo (828 cm−1) vibration modes for the MC-1 to MC-15 catalyst indicates that the MoO3 structures could form on the CeO2 surface with monomeric or polymeric units.46 For instance, the 464 cm−1 bulk CeO2 Raman band was apparent in all series of material and its intensity increased as increased the wt% of MoO3, irrespective of the catalyst support used. The band at ∼335 and ∼828 cm−1 is gives gradual increases in intensity from MC-1 to MC-15 were mainly due to increase in wt% of MoO3 in CeO2.47 The spectra shown in Fig. 3(e) for CD-MC-15 material was same as MoO3–CeO2 sample. Probably, this broad band in high intensity at 266 as well as at 920 cm−1 is due to creation of more number of oxygen vacancies.
3.4 SEM-EDS analysis
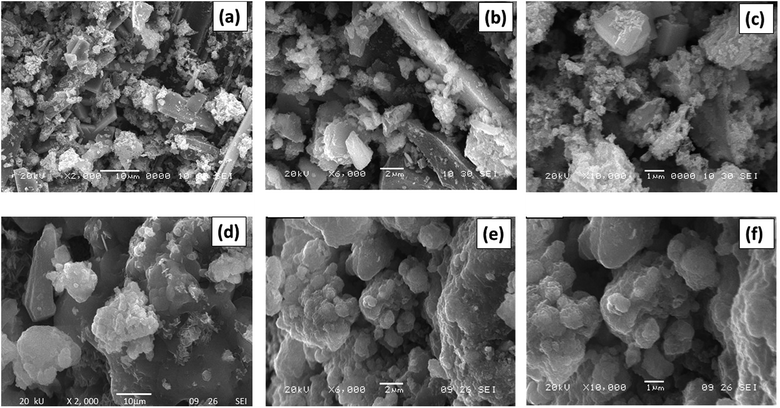
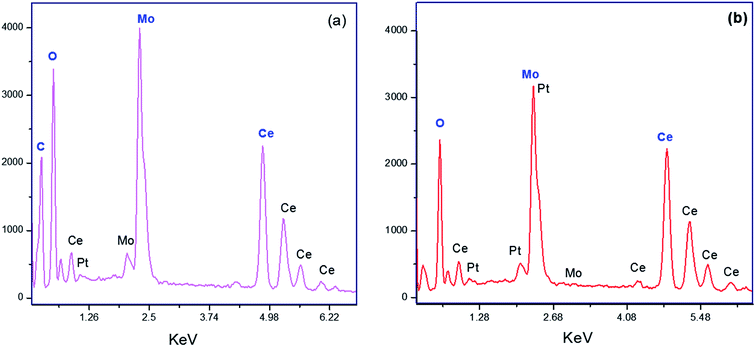
In order to understand the surface morphology and to know the surface dispersion of the active species on the support, the efficient studies were carried out on the SEM analysis. Fig. 4(a–c) shows SEM morphology photographs for MC-15 materials which shows highly porous in nature and nanocrystalline structure. It shows good dispersion of MoO3 on the surface of CeO2. It is evident that the sample shows an irregular appearance and well-known MoO3 species have been sintered due to the high temperature calcinations. From the SEM micrograph of the CD-MC-15 shown in Fig. 4(d–f), it can be clearly seen that effect of addition of β-cyclodextrin into MoO3–CeO2 material evidently shows alteration in crystallite size, improvement in morphology and increasing the porosity.Elemental compositions of 15 wt% MoO3–CeO2 (MC-15) sample was carried out using the EDS study and obtained graphs are shown in Fig. 5(a). The elemental quantitative results were observed for C![[thin space (1/6-em)]](https://www.rsc.org/images/entities/char_2009.gif) :
:![[thin space (1/6-em)]](https://www.rsc.org/images/entities/char_2009.gif) O
O![[thin space (1/6-em)]](https://www.rsc.org/images/entities/char_2009.gif) :
:![[thin space (1/6-em)]](https://www.rsc.org/images/entities/char_2009.gif) Mo
Mo![[thin space (1/6-em)]](https://www.rsc.org/images/entities/char_2009.gif) :
:![[thin space (1/6-em)]](https://www.rsc.org/images/entities/char_2009.gif) Ce atomic ratios fairly close to the expected bulk ratios indicating good distribution of the metal species in the sample (Table S1 in the ESI†). Similarly Fig. 5(b) shows the peak corresponding to the carbon, it is direct evidence of the β-cyclodextrin supported 15 wt% MoO3–CeO2 present in CD-MC-15 sample. This noticeable observation reveals the minimum stoichiometric ratio of the sample CD-MC-15 is maintained.
Ce atomic ratios fairly close to the expected bulk ratios indicating good distribution of the metal species in the sample (Table S1 in the ESI†). Similarly Fig. 5(b) shows the peak corresponding to the carbon, it is direct evidence of the β-cyclodextrin supported 15 wt% MoO3–CeO2 present in CD-MC-15 sample. This noticeable observation reveals the minimum stoichiometric ratio of the sample CD-MC-15 is maintained.
3.5 TEM analysis
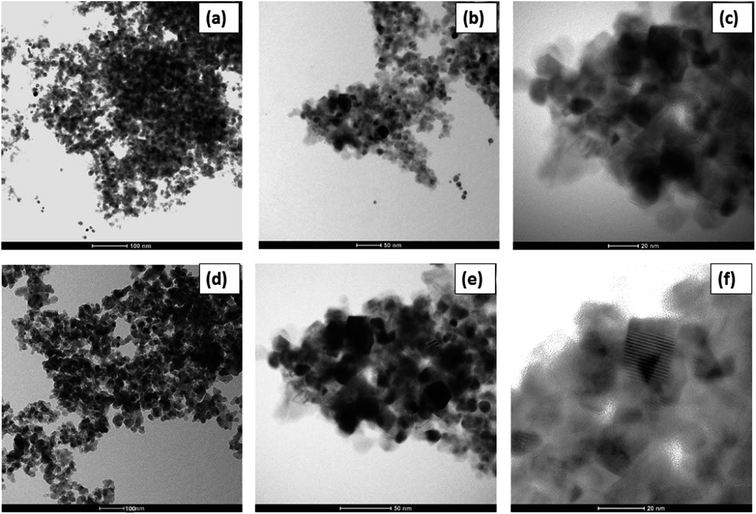
TEM analysis was performed to know the average particle size of the synthesized material. The TEM images of MC-15 are shown in Fig. 6(a–c). As stated, no exact estimation of the particle size from the TEM images was attempted in this study. It is clearly seen from the TEM images that the synthesized material with nanoparticles have clarity. However, all samples exhibited highly crystalline nano-sized particles in the broad range of 15–20 nm. Fig. 6(d–f) shows the nanocrystalline nature of CD-MC-15 material. As can be clearly noticed from the Fig. 6(b), the crystalline nature was enhanced after incorporation of β-cyclodextrin into the MC-15 sample. The decrease in particle size in the range between of 10 to 20 nm observed for modified sample was mainly due to β-cyclodextrin addition.3.6 Pyridine FTIR (Py-FTIR) spectroscopy
The pyridine adsorbed FTIR (Py-FTIR) spectroscopy of MC-1, MC-5, MC-10, MC-15 and CDMC-15 catalysts were performed to distinguish the Brønsted and Lewis acid sites in the synthesized catalysts (Fig. S1 in the ESI†). Three major FT-IR bands were found in the region of 1700–1300 cm−1. It can be seen from the figure that all samples exhibited a prominent peak at around 1639 cm−1, which can be attributed to the pyridine adsorbed on Brønsted acidic sites.48,49 Moreover, the existence of IR bands at 1455 cm−1 can be indexed to the pyridine adsorbed on Lewis acidic sites. The IR band at 1490 cm−1 indicates the existence of both Brønsted and Lewis acidic sites.49 As can be noticed from the figure, all the prepared catalysts exhibit a higher number of Brønsted acid sites compared to that of Lewis acid sites. The existence of a high amount of Brønsted acidic sites reveals a pivotal role in the phenol oxidation reaction even at room temperature.3.7 Phenol degradation activity study
The catalytic efficiency of the synthesized catalysts was investigated for phenol degradation reaction and the obtained results are shown in Fig. 7 and 8. In each experiment, the reaction suspension was prepared by adding 0.1 g of catalyst amount into 5 mL of pure phenol (45 mM) and 10 mL of 30% H2O2 (100 mM) solution to initiate the reaction. As can be noticed from the Fig. 7, the concentration of phenol was remarkably decreased after the completion of the reaction. Among all the catalytic materials, CD-MC-15 catalyst was observed higher phenol degradation activity when compared to that of remaining catalysts. It is mainly attributed to increase an availability of more active sites including more surface area, smaller particle size and ample vacancy defects by addition of the β-cyclodextrin into MoO3–CeO2 (CD-MC-15). The color intensity of the phenol solution was increases to around 80% for the modified with β-cyclodextrin catalytic material when compared with the MC-1, MC-5, MC-10 and MC-15, as shown in Fig. 8. The chance in colour of phenol in the solution from colorless to dark brown is shown which is attributed to the formation of intermediates like catechol, resorcinol and glycerol etc. during the degradation of phenol in presence of catalyst and H2O2 after 1 h of reaction time.50–52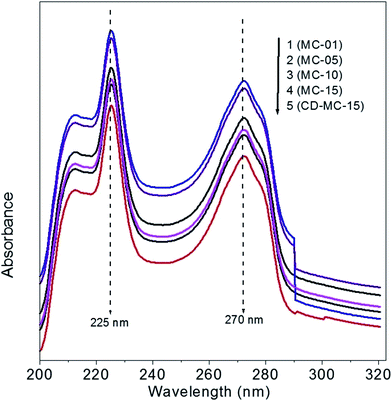 | ||
| Fig. 7 UV-visible absorption spectra of phenol degradation activity. Reaction conditions: 0.1 g of catalyst amount, 1 h of reaction time, room temperature, 5 mL of pure phenol and 10 mL of 30% H2O2. | ||
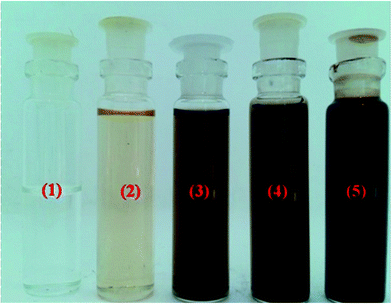 | ||
| Fig. 8 Photographs of phenol degradation process for (1) MC-1, (2) MC-5, (3) MC-10, (4) MC-15 and (5) CD-MC-15 catalysts, respectively. | ||
The efficiency of phenol degradation was performed overall synthesized catalysts under the reaction conditions same as in Fig. 8 and obtained phenol conversions are presented in the Table 2. Although the catalytic activity of phenol degradation is very low in the absence of catalyst, the catalytic activity in the presence of catalysts satisfactorily improved. It was found that CD-MC-15 catalyst show a higher catalytic performance when compared to that of MC catalysts. From the HPLC analysis, the conversion of phenol was found to be ∼6.4, 15.3, 27.6, 44.7 and 65.8% for MC-1, MC-5, MC-10, MC-15, and CD-MC-15 samples after 1 h of reaction time, respectively. It might be attributed to increase an availability of more active sites (describes in above paragraph) by addition of the β-cyclodextrin into MoO3–CeO2. As well, the measured chemical oxygen demand (COD) for the degradation of phenol before and after the reaction over prepared catalysts and obtained results are presented in the Table 2. The COD values represent the amount of organic compounds in water and a remarkable decrease in the COD value was noticed after the degradation of phenol. The gradual decrease in COD values was observed for all catalysts after 1 h of the reaction time. The observed phenol degradation of MC-1, MC-5, MC-10, MC-15 and CD-MC-15 catalysts are ∼8.1, 18.9, 35.0, 52.0 and 73.8%, respectively. This decrease in COD values shows the degradation of phenol that leads to the conversion of organic compounds into harmless gaseous CO2 and inorganic ions. This noticeable observation is indeed due to the oxidation and degradation of phenol by radical species into aromatic compounds, low-molecular carboxylic acids, carbon dioxide and water.53
The plausible reaction mechanism for the degradation of phenol into various compounds over the metal oxide catalyst was proposed based on the experimental evidences. Recently, Quintanilla et al.54 reported that the presence of hydroxyl radicals was confirmed by using a selective quencher, and a reaction mechanism was proposed based on the redox cycle skilled between different metal valence species. We have also expected this reaction proceeds through a complex scheme of reactions involving a number of intermediates, such as aromatic compounds (i.e., resorcinol, hydroquinone and p-benzoquinone) and low molecular weight carboxylic acids (maleic, malonic, oxalic, acetic and formic). According to the following steps: (i) adsorption of phenol and hydrogen peroxide on the catalysts surface to produced hydroxyl and hydroperoxyl radicals. Finally, (ii) the formed hydroxyl radicals react with phenol molecules over the metal oxide surface to produce various compounds.55
• Decomposition of H2O2 produce hydroxyl and hydroperoxyl radicals over the metal oxide nanoparticles by a redox cycle:
| H2O2 + Mn+ → OH˙ + OH− + Mm+ | (1) |
| H2O2 + Mm+ → OOH˙ + H+ + Mn+ | (2) |
• The oxidation of phenol with radical species to produce various organic compounds, such as aromatic compounds, carboxylic acids, carbon dioxide, water etc.
| Phenol + OH˙ + OOH˙→ aromatics + acids + CO2 + HO2 | (3) |
4. Conclusions
The series of MoO3–CeO2 and β-cyclodextrin supported MoO3–CeO2 nanocomposite materials were successfully synthesized by a co-precipitation method. These prepared materials were characterized by various sophisticated techniques such as XRD, BET, FTIR, Pyridine-FTIR, Raman, SEM-EDS and TEM technique. The XRD and TEM results suggested the formation of smaller nanocomposite nature of the prepared materials. Raman results disclosed that the β-cyclodextrin supported on MoO3–CeO2 catalyst was exhibited high amount of oxygen vacancy defects when compared with the un-supported MoO3–CeO2 catalysts. The catalytic performance of the MoO3–CeO2 based nanocomposite materials was studied for degradation of phenol with H2O2 under the ambient reaction conditions. β-Cyclodextrin supported MoO3–CeO2 nanocomposite showed the highest catalytic performance than un-supported MoO3–CeO2 materials, which is due to the high specific surface area associated with more pore volume, lower particle size and ample oxygen defect sites. Also, the more decrease in COD values shows the highest degradation of phenol that leads to the conversion of organic compounds into harmless gaseous CO2 and inorganic ions over the CD-MC-15 catalyst. Hence, the present study offers remarkable advantages such as nontoxic, non-corrosive, inexpensive and eco-friendly conditions. Simply this heterogeneous catalysis reaction is successful under environmental benign conditions.Acknowledgements
Madhukar Navgire and Parikshit Gogoi are thanks to the Indian Academy of Sciences, Bangalore for IASc-INSA-NASI Summer Research Fellowship Programme 2014 and Head, I&PC Division, CSIR-Indian Institute of Chemical Technology, Hyderabad for providing laboratory facility to us. Similarly, Baithy Mallesham and Agolu Rangaswami thanks the Council of Scientific and Industrial Research (CSIR-UGC), New Delhi, for the award of research fellowships.References
- X. W. Zhang, Y. Z. Wang, G. T. Li and J. H. Qu, J. Hazard. Mater., 2006, 134, 183–189 CrossRef CAS PubMed.
- Z. Xing, W. Zhou, F. Du, Y. Qu, G. H. Tian, K. Pan, C. G. Tian and H. G. Fu, Dalton Trans., 2014, 43, 790–798 RSC.
- Y. Jin, N. Li, H. Liu, X. Hua, Q. Zhang, M. Chen and F. Teng, Dalton Trans., 2014, 43, 12860–12870 RSC.
- S. Zhao, J. Z. Li, L. Wang and X. H. Wang, Clean: Soil, Air, Water, 2010, 38(3), 268–274 CrossRef CAS.
- I. K. Konstantyinou and T. A. Albanis, Appl. Catal., B, 2004, 49, 1–14 CrossRef.
- L. Young and J. Yu, Water Res., 1997, 31, 1187–1193 CrossRef CAS.
- M. Stylidi, D. I. Kondarides and X. E. Verykios, Appl. Catal., B, 2003, 40, 271–286 CrossRef CAS.
- R. Andreozzy, V. Caprio, A. Insola and R. Marotta, Catal. Today, 1999, 53, 51–59 CrossRef.
- M. Navgire, M. Lande, A. Gambhire, S. Rathod, D. Aware and S. Bhitre, Bull. Mater. Sci., 2011, 34, 535–541 CrossRef CAS.
- Z. Xi, N. Zhou, Y. Sun and K. Li, Science, 2001, 292, 1139–1141 CrossRef CAS PubMed.
- E. V. Rokhina and J. Virkutyte, Crit. Rev. Environ. Sci. Technol., 2010, 41, 125–167 CrossRef.
- S. Perathoner and G. Centi, Top. Catal., 2005, 33, 207–224 CrossRef CAS.
- S. Navalon, M. Alvaro and H. Garcia, Appl. Catal., B, 2010, 99, 1–26 CrossRef CAS.
- A. Gambhire, M. Lande, B. Arbad, S. Rathod, R. Gholap and K. Patil, Mater. Chem. Phys., 2011, 125, 807 CrossRef CAS.
- M. Navgire, A. Yelwande, D. Tayde, B. Arbad and M. Lande, Chin. J. Catal., 2012, 33, 261 CrossRef CAS.
- J. Zhou, W. Hou, P. Qi, X. Gao, Z. Luo and K. Cen, Environ. Sci. Technol., 2013, 47(17), 10056–10062 CrossRef CAS PubMed.
- P. Sudarsanam, B. Mallesham, D. N. Durgasri and B. M. Reddy, RSC Adv., 2014, 4, 11322–11330 RSC.
- R. Mellaerts, J. Delvaux, P. Leveque, B. Wuyts, G. V. Mooter, P. Augustijns, B. Gallez, I. Hermansd and J. Martens, RSC Adv., 2013, 3, 900–909 RSC.
- P. Sudarsanam, A. Rangaswamy and B. M. Reddy, RSC Adv., 2014, 4, 46378–46382 RSC.
- J. Li and X. Liu, Mater. Lett., 2013, 112, 39–42 CrossRef CAS.
- L. Lietti, G. Ramis and F. Berti, Appl. Catal., B, 1998, 18(1), 1–36 Search PubMed.
- Y. Peng, R. Qu, X. Zhang and J. Li, Chem. Commun., 2013, 49, 6215–6217 RSC.
- W. Li, S. Zhao, B. Qi, Y. Du, X. Wang and M. Huo, Appl. Catal., B, 2009, 92(3), 333–340 CrossRef CAS.
- K. A. Connors, Chem. Rev., 1997, 97, 1325–1357 CrossRef CAS PubMed.
- B. Kaboudin, R. Mostafalua and T. Yokomatsub, Green Chem., 2013, 15, 2266–2274 RSC.
- Y. Kang, L. Zhou, X. Lib and J. Yuan, J. Mater. Chem., 2011, 21, 3704–3710 RSC.
- J. Haber, The Role of Molybdenum in Catalysis, Climax Molybdenum, Ann Arbor, MI, 1981 Search PubMed.
- A. Trovarelli, Catal. Rev.: Sci. Eng., 1996, 38, 439–520 CAS.
- N. A. Yassir and R. L. V. Mao, Appl. Catal., A, 2007, 332, 273–288 CrossRef.
- V. S. Mishra, V. V. Mahajani and J. B. Joshi, Ind. Eng. Chem. Res., 1995, 34, 2–48 CrossRef CAS.
- K. R. Tsai, D. A. Chen, H. L. wan, H. B. Zhang, G. D. Lin and P. X. Zhang, Catal. Today, 1999, 51, 3–23 CrossRef CAS.
- L. Kihlborg, Ark. Kemi, 1963, 21, 557 Search PubMed.
- B. Cullity, Elements of X-Ray Diffraction, 2nd edn, 1978 Search PubMed.
- M. Mohamed and S. Katib, Appl. Catal., A, 2005, 287, 236–243 CrossRef CAS.
- T. S. Sian and G. B. Reddy, Appl. Surf. Sci., 2004, 236, 1–5 CrossRef CAS.
- G. Zakharova, C. Taschner and V. Volkov, Solid State Sci., 2007, 9, 1028–1032 CrossRef CAS.
- M. Dhanasankar, K. Purushothaman and G. Muralidharan, Appl. Surf. Sci., 2011, 257, 2074–2079 CrossRef CAS.
- T. Cheng, Z. Fang, G. Zou, Q. Hu, B. Hu, X. Yang, Y. Zhang and Y. Bull, Mater. Sci., 2006, 29, 701–704 CAS.
- R. D. Monte and J. Kaspar, J. Mater. Chem., 2005, 15, 633–648 RSC.
- B. Mallesham, P. Sudarsanam, G. Raju and B. M. Reddy, Green Chem., 2013, 15, 478–489 RSC.
- W. Shan, Z. Feng, Z. Li, J. Zhang, W. Shen and C. Li, J. Catal., 2004, 228, 206–217 CrossRef CAS.
- J. R. McBride, K. C. Hass, B. D. Poindexter and W. H. Weber, J. Appl. Phys., 1994, 76, 2435–2441 CrossRef CAS.
- M.-F. Luo, Z.-L. Yan, L.-Y. Jin and M. He, J. Phys. Chem. B, 2006, 110, 13068–13071 CrossRef CAS PubMed.
- B. M. Reddy, G. Thrimurthulu, L. Katta, Y. Yamada and S. E. Park, J. Phys. Chem. C, 2009, 113, 15882–15890 CAS.
- B. Mallesham, P. Sudarsanam, B. V. Shiva Reddy and B. M. Reddy, Appl. Catal., B, 2016, 181, 47–57 CrossRef CAS.
- I. E. Wachs and C. A. Roberts, Chem. Soc. Rev., 2010, 39, 5002–5017 RSC.
- N. A. Yassir and R. L. V. Mao, Appl. Catal., A, 2006, 305, 130–139 CrossRef.
- B. Mallesham, P. Sudarsanam and B. M. Reddy, Catal. Sci. Technol., 2014, 4, 803–813 CAS.
- B. Mallesham, P. Sudarsanam and B. M. Reddy, Ind. Eng. Chem. Res., 2014, 53, 18775–18785 CrossRef CAS.
- N. S. Inchaurrondo, J. Cechini, J. Font and P. Haure, Appl. Catal., B, 2012, 111, 641–648 CrossRef.
- E. A. Secco, Can. J. Chem., 1988, 66, 329 CrossRef CAS.
- E. Saputra, S. Muhammad, H. Sun and S. Wang, RSC Adv., 2015, 5, 8455–8462 RSC.
- L. Kekisheva, I. Smirnov, N. Ostroukhov, N. Petrovich, V. Sitnik, H. Riisalu and Yu. Soone, Oil Shale, 2007, 24, 573–581 CAS.
- A. Quintanilla, S. García-Rodríguezb, C. M. Domíngueza, S. Blascoa, J. A. Casasa and J. J. Rodriguez, Appl. Catal., B, 2012, 111–112, 81–89 CrossRef CAS.
- C. M. Dominguez, A. Quintanilla, J. A. Casas and J. J. Rodriguez, Chem. Eng. J., 2014, 253, 486–492 CrossRef CAS.
Footnote |
| † Electronic supplementary information (ESI) available. See DOI: 10.1039/c5ra25966e |
| This journal is © The Royal Society of Chemistry 2016 |


