
 Open Access Article
 This Open Access Article is licensed under a Creative Commons Attribution-Non Commercial 3.0 Unported Licence
Evaluating 3D printing to solve the sample-to-device interface for LRS and POC diagnostics: example of an interlock meter-mix device for metering and lysing clinical urine samples†
Erik
Jue
a,
Nathan G.
Schoepp
b,
Daan
Witters
b and
Rustem F.
Ismagilov
*ab
aDivision of Biology and Biological Engineering, California Institute of Technology, 1200 E. California Blvd., Pasadena, CA, USA. E-mail: rustem.admin@caltech.edu
bDivision of Chemistry and Chemical Engineering, California Institute of Technology, 1200 E. California Blvd., Pasadena, CA, USA
First published on 28th April 2016
Abstract
This paper evaluates the potential of 3D printing, a semi-automated additive prototyping technology, as a means to design and prototype a sample-to-device interface, amenable to diagnostics in limited-resource settings, where speed, accuracy and user-friendly design are critical components. As a test case, we built and validated an interlock meter-mix device for accurately metering and lysing human urine samples for use in downstream nucleic acid amplification. Two plungers and a multivalve generated and controlled fluid flow through the device and demonstrate the utility of 3D printing to create leak-free seals. Device operation consists of three simple steps that must be performed sequentially, eliminating manual pipetting and vortexing to provide rapid (5 to 10 s) and accurate metering and mixing. Bretherton's prediction was applied, using the bond number to guide a design that prevents potentially biohazardous samples from leaking from the device. We employed multi-material 3D printing technology, which allows composites with rigid and elastomeric properties to be printed as a single part. To validate the meter-mix device with a clinically relevant sample, we used urine spiked with inactivated Chlamydia trachomatis and Neisseria gonorrhoeae. A downstream nucleic acid amplification by quantitative PCR (qPCR) confirmed there was no statistically significant difference between samples metered and mixed using the standard protocol and those prepared with the meter-mix device, showing the 3D-printed device could accurately meter, mix and dispense a human urine sample without loss of nucleic acids. Although there are some limitations to 3D printing capabilities (e.g. dimension limitations related to support material used in the printing process), the advantages of customizability, modularity and rapid prototyping illustrate the utility of 3D printing for developing sample-to-device interfaces for diagnostics.
Introduction
We evaluate multi-material 3D printing for the design and prototyping of an interlock meter-mix device that meters and lyses human urine samples for a workflow compatible with limited-resource settings (LRS) and point of care (POC) diagnostic testing. 3D printing comprises a set of additive manufacturing techniques that allows the formation of complex 3D structures with minimal restrictions. The emerging technological capabilities of 3D printing bring exciting advancements in the fabrication of micro- and macrofluidic devices, enabling architectures that would be difficult with conventional fabrication techniques such as soft lithography.1,2 A primary advantage of 3D printing is the ability to rapidly prototype and iterate new designs, without needing to tool expensive molds.3 3D printing reduces the design and prototyping time from weeks and months down to hours and days, making prototyping more cost-effective and therefore more accessible—particularly for research labs where needs may change frequently. Because 3D printing is semi-automated, it minimizes assembly time, the requirements for labor, and reproducibility issues, therefore reducing many of the barriers that currently prevent some research labs from prototyping complex 3D parts.2 The customizable design files generated in computer-aided design (CAD) software can be easily modified in coordination with experiments. 3D printed materials also exhibit a wide range of properties, with varying levels of rigidity, surface roughness, optical clarity, and biocompatibility to fit a diverse range of device requirements.4 In combination, all of these advantages make 3D printing attractive for prototyping fluidic devices relevant to lab-on-a-chip and diagnostics fields.The sample-to-device interface for diagnostics is a critical component of nucleic acid amplification testing (NAAT) in LRS, and remains an unsolved challenge.5,6 Many NAAT technologies are not amenable to LRS, because NAAT is an intrinsically multistep process involving sample metering, lysis, nucleic acid (NA) purification, amplification, and detection.7 To be useful in clinical practice in POC or LRS, the entire NAAT workflow should be fully automated, user-friendly (without training or pipetting steps to meet CLIA-waiver), rapid, equipment-free, sensitive, and specific. To equip a portable device with complete sample-in to answer-out functionality requires the appropriate consideration of all upstream and downstream processes. While many efforts have been taken to automate nucleic acid (NA) purification and amplification, sample metering must always be addressed because a user in LRS or at the POC cannot be asked to pipette accurately. Furthermore, combining sample transfer with the step in which the sample is mixed with the lysis buffer is attractive, because it has the advantage of minimizing the cost and complexity of an integrated diagnostic device, and could benefit such devices being developed in research labs, including our own.8–11 Precise metering is especially critical in NAAT testing of sexually transmitted diseases (STDs), such as Chlamydia trachomatis (CT) and Neisseria gonorrhoeae (NG).12 In 2013, there were 1![[thin space (1/6-em)]](https://www.rsc.org/images/entities/char_2009.gif) 401906 and 333004 reported cases of CT and NG, respectively, in the United States, with many more cases unreported and undiagnosed.13 The Centers for Disease Control and Prevention (CDC) estimates 20 million new STD infections per year in the US, accounting for $16 billion in health care costs.13 The CDC now recommends NAAT for CT/NG diagnosis14 because these tests are sensitive, accurate and use non-invasive urine samples. Many of these tests need to be done under LRS or POC settings.
401906 and 333004 reported cases of CT and NG, respectively, in the United States, with many more cases unreported and undiagnosed.13 The Centers for Disease Control and Prevention (CDC) estimates 20 million new STD infections per year in the US, accounting for $16 billion in health care costs.13 The CDC now recommends NAAT for CT/NG diagnosis14 because these tests are sensitive, accurate and use non-invasive urine samples. Many of these tests need to be done under LRS or POC settings.
Currently, there is no standardized way to deliver a known amount of sample mixed with lysis buffer to an LRS- or POC-compatible NAAT diagnostic device. A method for doing so is subject to the following constraints: (i) meter a precise volume of urine with <5% coefficient of variation (CV), (ii) mix urine with premeasured, preloaded lysis buffer at a specific ratio (as determined by the extraction chemistry), (iii) transfer the lysed urine without dripping potentially infectious solution, (iv) perform these operations quickly, in a user-friendly, equipment-free manner that minimizes potential user errors, and (v) maintain the sensitivity and specificity of the overall assay (no loss of nucleic acids to 3D printed surfaces, contamination, or leachates).
Here, we evaluate the capabilities of multi-material 3D printing to design and prototype a single-use disposable macrofluidic device that meets the above constraints. We also discuss the advantages and disadvantages of 3D printing as a research tool for device development. Multi-material printing, wherein different materials are combined into a single printed part, offer expanded capabilities, so we chose to specifically investigate multi-material 3D printing as a tool for building sample-to-device interfaces. We have previously demonstrated the utility of multi-material printing in the development of a pumping lid for interfacing with microfluidic devices,15 however the pumping lid we developed was only used to compress air, and did not contact fluids directly. Here, we expand on the ability to use multi-material printed parts to generate sealed fluid cavities through the development of a multivalve and plungers used within our device.
Results and discussion
Interlock design and meter-mix device operation
To operate the meter-mix device (see ESI† video), the user performs three simple steps 1. insert urine suction tube into patient sample and pull urine plunger, 2. remove from patient sample and slide multivalve, and 3. push lysis buffer plunger to eject the mixed solution. The device can then be easily disposed of as biohazardous waste. Furthermore, the user of the device cannot accidentally perform these three operations out of order due to the presence of interlock features attached to the plungers. In the initial position, the urine plunger interlock blocks the sliding of the multivalve, and the multivalve blocks the movement of the lysis buffer plunger (Fig. 1A). When the user pulls up on the urine plunger, urine is aspirated through the suction tube, through the valve, and into the urine chamber. Pulling up on the urine plunger also releases the interlock that was blocking the multivalve (Fig. 1B and C). The user then slides the multivalve, which disconnects the urine suction tube inlet while generating two new outlets to a static mixer, one outlet for urine and the other for lysis buffer which has been pre-stored on the device. By pre-storing the lysis buffer on device, we eliminate many manual pipetting steps and reduce user error.16 The sliding of the multivalve also creates openings for the urine plunger interlock and the lysis buffer plunger interlock (Fig. 1C). In the final step, the user pushes down on the lysis buffer plunger, which also pushes the urine plunger, ejecting both urine and lysis buffer through the static mixer (Fig. 1D). The total user operating time is between 5 and 10 s.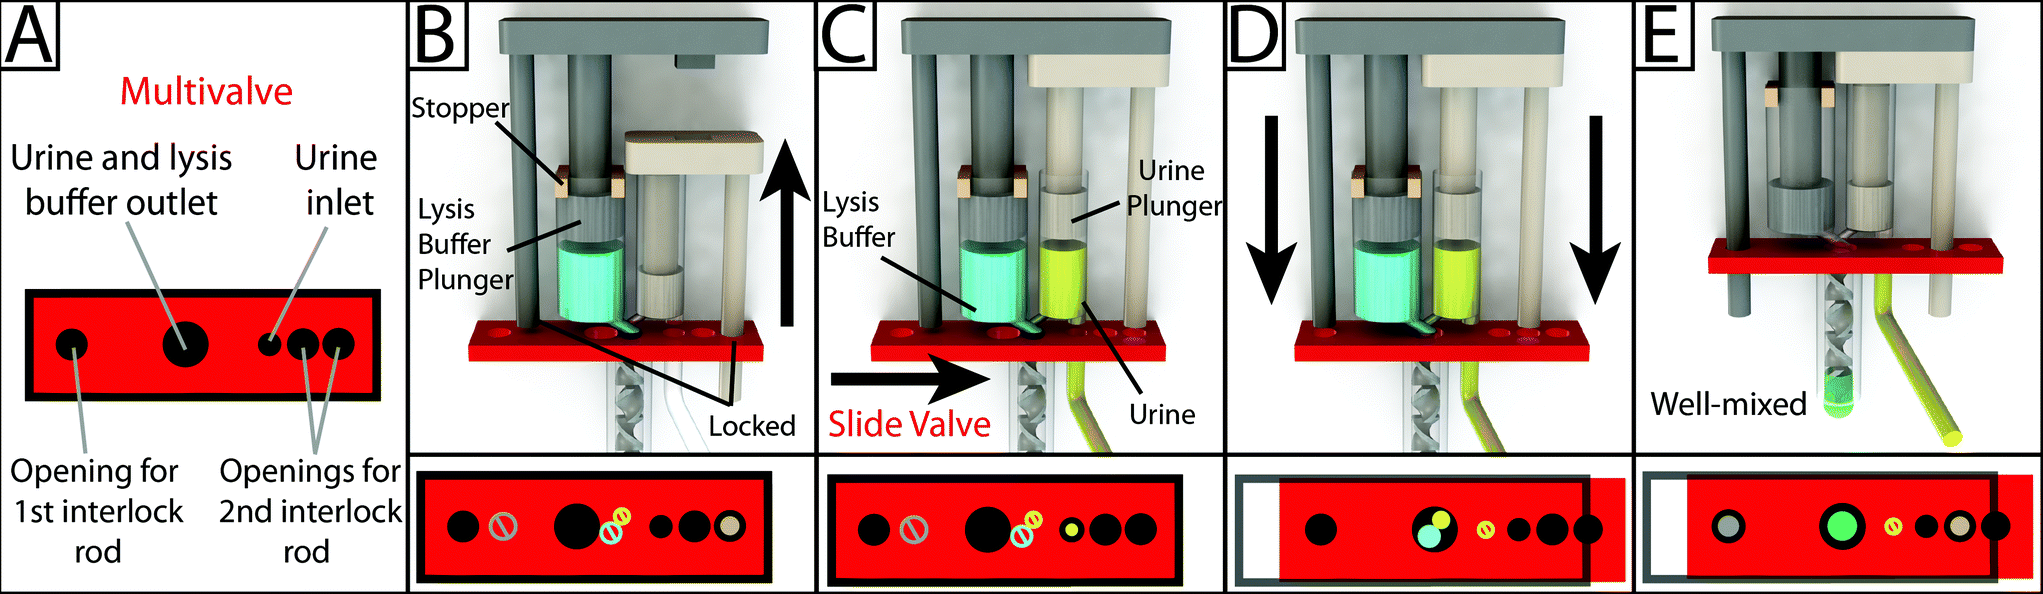 | ||
| Fig. 1 Schematic overview of the design and operation of the 3D-printed interlock meter-mix device for metering and mixing a urine sample with lysis buffer. (A) The multivalve has five holes that are labeled accordingly. (B) Lysis buffer (blue) is preloaded into the lysis buffer chamber, where the topmost position of the lysis buffer plunger (left, grey) is pre-determined by stoppers (tan). The urine plunger interlock rod (right, beige) is positioned within the multivalve, preventing the valve from sliding and simultaneously blocking the lysis buffer plunger interlock rod. The user pulls up on the urine plunger (C) until it contacts and is stopped by the lysis buffer plunger, aspirating urine and simultaneously removing the urine plunger interlock rod from the multivalve. The user slides the multivalve (D), closing off the urine suction tube, opening the lysis buffer and urine outlets to the mixer, and providing openings for both interlock rods. In the final step, the user pushes down on the lysis buffer plunger (E), ejecting urine and lysis buffer through a static mixer, wherein the solutions are well mixed before finally being ejected from the tip of the mixer. Red blocks at the bottom of each panel show a top-down view of the multivalve. Black circles and rings indicate holes in the multivalve. Slashed circles indicate the presence of a feature that is blocked by the multivalve. Colored circles indicate the presence of an interlock rod or an open channel for the flow of a solution. | ||
The meter-mix device is composed of eight assembled parts: 1. main enclosure, 2. lysis buffer plunger, 3. urine plunger, 4. two plunger stoppers, 5. multivalve, 6. urine suction tube, 7. static mixer elements, and 8. static mixer case (Fig. 2). All parts were designed using 3D CAD software (Solidworks 2015 Education Edition) and fabricated using an Objet 260 multi-material 3D printer (Stratasys, Eden Prairie, MN, USA). We judiciously selected two semi-transparent photopolymer materials, Veroclear and TangoPlus, corresponding to a rigid plastic, analogous to poly(methyl methacrylate) (PMMA), and a soft, elastomeric material, analogous to rubber, respectively. By utilizing translucent materials, fluids are visible as they are transported among chambers of the device, providing visual feedback during operation. All of the parts were composed of Veroclear, providing a strong structure. The plunger heads, stoppers, and the multivalve were printed with a combination of Veroclear and TangoPlus, which enabled us to design sliding surfaces and generate seals. With the exception of the plunger stoppers, each part underwent between seven and 25 unique design iterations. In the Fig. 2 demonstration, which shows the entire device assembly and operation, 1150 μL 0.05% (v/v) sky blue Ateco dye (August Thomson Corp., Glencove, NY, USA) was preloaded into the lysis buffer chamber and 0.1% lemon yellow Ateco dye was manually loaded into the urine chamber. These two dye solutions were run through the device and combined to form a green mixed solution (Fig. 2D).
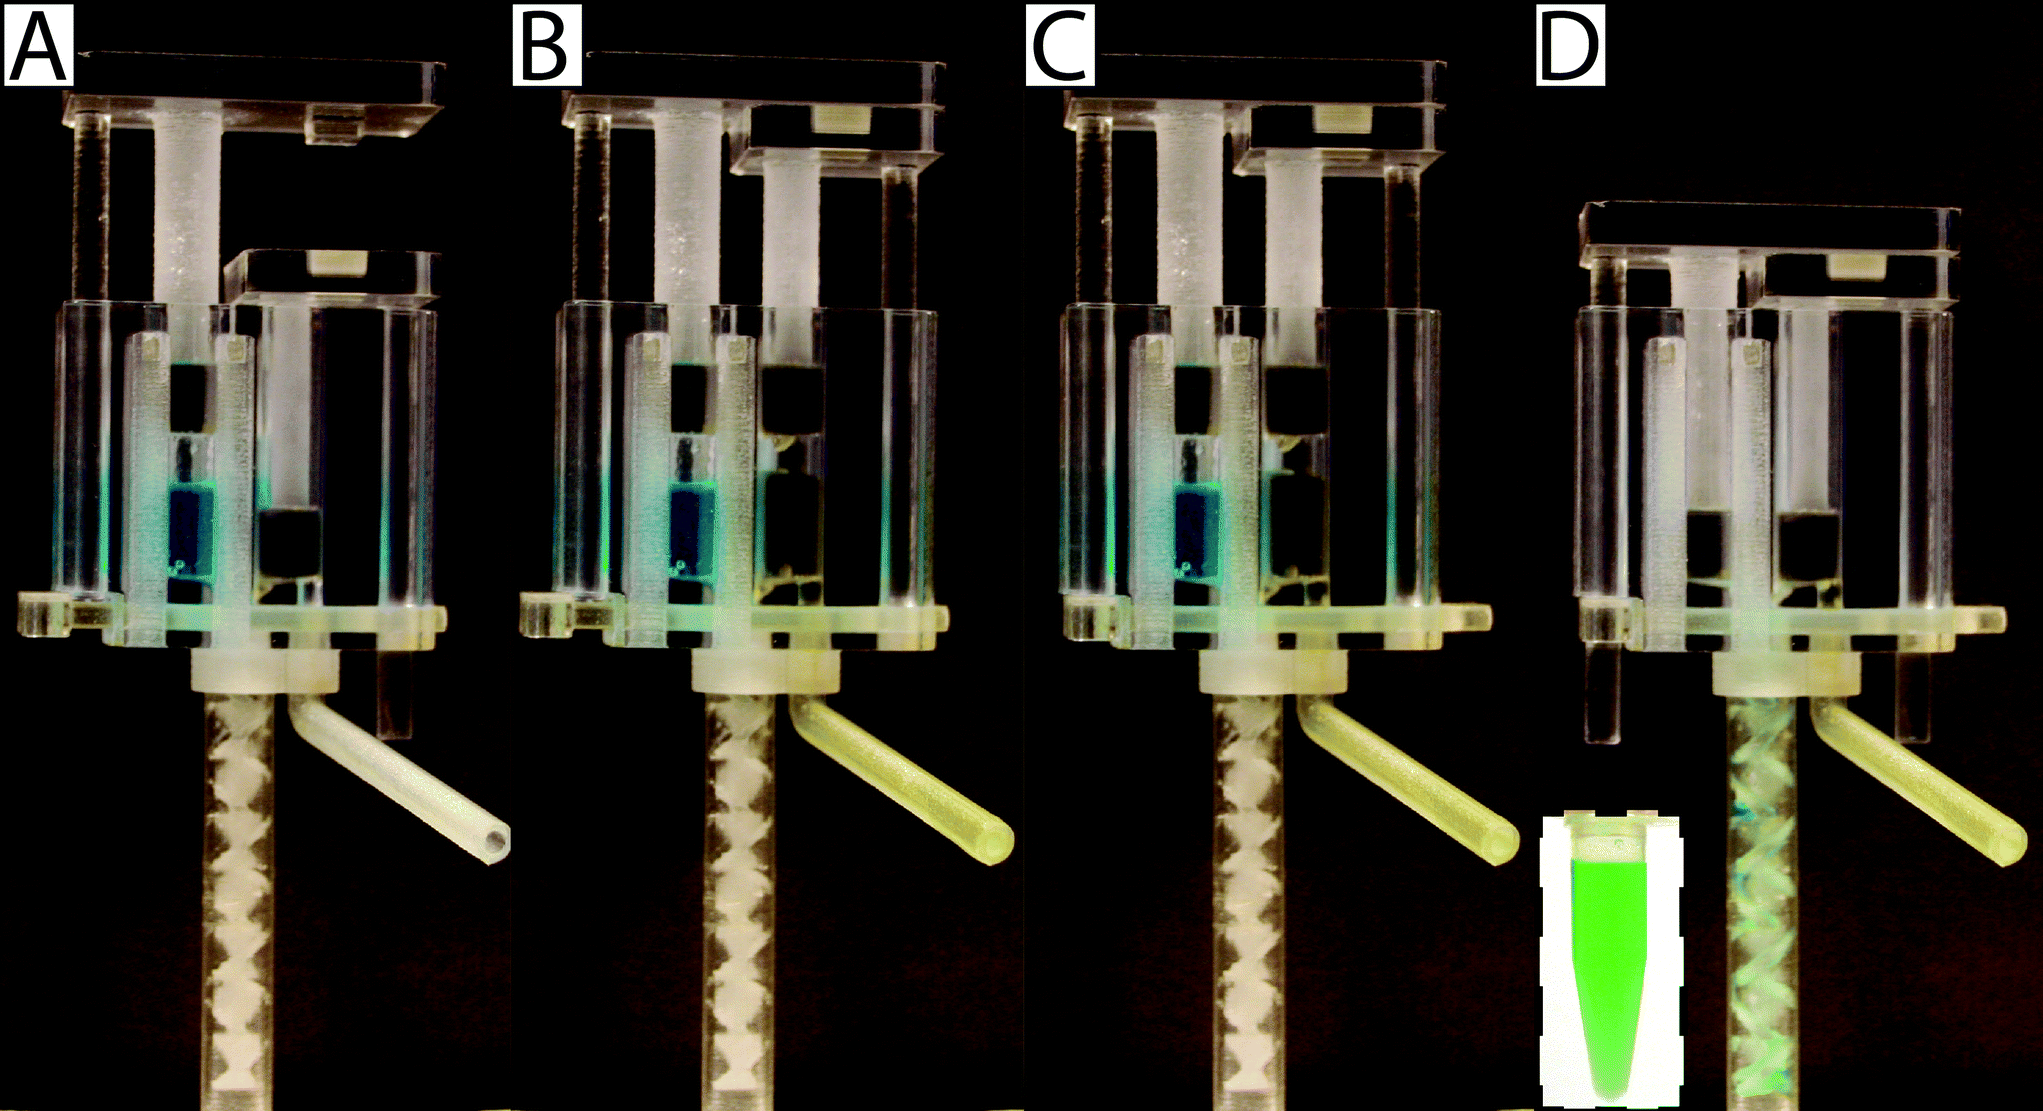 | ||
| Fig. 2 Photographs of the device at different stages of operation. (A) In the initial position, blue dye representing lysis buffer is preloaded and the urine plunger is down. (B) In the second position, the urine plunger contacts the lysis buffer plunger and a specific volume of yellow dye representing urine is metered. (C) In the third position, the multivalve was slid 5 mm to the right, simultaneously closing and opening new connections. (D) In the final position, both plungers are down, dispensing a green solution out through the static mixer and into a 1.5 mL tube (inset). | ||
Designing and prototyping leak-proof connections
To ensure reliable device operation, all of the seals on the device need to be hermetically sealed. We accomplish this using the capability of multi-material 3D printing to generate materials jointly composed of hard plastic (Veroclear) and soft rubber-like material (TangoPlus). We used multi-material printing for fabricating both plungers and the multivalve. The challenge with creating leak-proof connections is determining the appropriate dimensions, overlap, and the ratio of soft:hard material to create a strong leak-proof connection that is still easy to move by hand. We took advantage of the rapid prototyping capabilities of 3D printing to quickly converge on functional designs. For the urine chamber, we found a good fit using an 8 mm diameter hole and an 8 mm diameter plunger head, where the inner diameter of the plunger head consisted of 7.2 mm Veroclear; the remaining diameter was filled with TangoPlus. For the lysis buffer chamber, we found good fit using an 11.31 mm diameter hole and an 11.31 mm diameter plunger head, where the inner diameter of the plunger head consisted of 10.18 mm Veroclear; the remaining diameter was filled with TangoPlus. These parameters made hermetically sealed connections capable of generating and holding a vacuum. We selected the dimensions of the chambers in the main enclosure to provide the desired air volumes and mixing ratios (see Accurate dispensing). To generate the multivalve seal, an open cavity was designed through the side of the main enclosure, with raised ridges around each hole for the inlets and outlets. The multivalve was 2.7 mm thick, with 0.54 mm TangoPlus (20%) layered on the top and 0.54 mm on the bottom. At the points of contact between the multivalve and the inlet/outlet ridges, there was a 0.2 mm overlap where the ridge pushed into the TangoPlus layer (by 3D CAD design). To assist sealing and sliding, we applied silicone oil to lubricate all contact points at movable interfaces (plunger heads, chambers, and the multivalve).
Plunger system and accurate metering
To accurately meter urine, we designed a plunger system with predetermined start and stop positions. During device operation, the urine plunger is pulled up until it contacts the underside of the lysis buffer plunger. The volume displaced by the plunger was calculated in CAD software, providing an estimate for the volume of urine aspirated into the device. To precisely calibrate metering, the working design was iterated by testing prototypes of the device by aspirating deionized water, weighing the device, and modifying the height of the plunger stoppers to adjust the volume displaced by the plunger. To accurately meter lysis buffer, we use a pipettor to preload the meter-mix device. When the device is set to the initial configuration, lysis buffer is sealed on both sides by the lysis buffer plunger and multivalve. This is advantageous for a disposable LRS and POC device because the filling step can be performed during manufacturing and assembly. In this way, the end-user does not need to consider handling of the lysis buffer during device operation.With diagnostic devices, it is important to minimize dead volumes to avoid wasting reagents, losing sample, or introducing a source of variability. One strength of 3D printing is that potential sources of dead volume can be identified and reduced during the design process. For the meter-mix device, we identified four potential sources of dead-volume: urine lost in the suction tube, urine lost in the urine chamber, lysis buffer lost in the lysis buffer chamber, and mixed solution remaining in the static mixer. We recognize that patient urine is abundant, and that it is acceptable for the meter-mix device to overfill urine; however, the final volume of urine ejected from the device must be consistent between runs. To ensure accurate, consistent ejected volumes, the dead-volume of the urine suction tube was taken into account while modifying the positions of the plunger stoppers. It should be noted that dead-volume can be reduced by changing the design of the suction tube as required. For our meter-mix device, we were concerned with dead volumes of urine remaining in the urine chamber and the static mixer, which could contribute to differences in the volumes of urine ejected between runs. In particular, a user who sees liquids trapped in the static mixer may be inclined to shake the meter-mix device, introducing error which affects the accuracy of downstream quantitative processes. To remove this dead volume, we leave a pocket of air that sits above the lysis buffer within the lysis buffer chamber. After urine is aspirated into the device, we designed the system so that the heights of the pockets of air are roughly equal (the air initially residing in the suction tube is incorporated into the device during the aspiration step). These two pockets of air produce a blow-out volume of air which removes the dead volumes of urine and lysis buffer that would otherwise remain in the chambers and static mixers.
We wanted to ensure that after urine is aspirated into the urine chamber, urine is unable to leak out through the tip of the urine suction tube. Bretherton previously examined this problem, and found the dimensionless bond number, Bo (which relates gravity to surface tension), to be a guiding parameter.17 The bond number is related to the density difference between the liquid and air, the diameter of the tube, and the surface tension of the liquid. He predicted that for a vertical tube that is sealed at one end, a bubble contained within will not rise if Bo < 0.842.17 Thus, in our meter-mix device, if the bond number is low, and a bubble enters the urine suction tube, the bubble will be immobile, preventing solution from dripping out through the tip of the urine suction tube. Bretherton's prediction suggests that we want to minimize the bond number, which we can do simply by reducing the diameter of the 3D-printed urine suction tube. We would not, however, want to make the diameter so small that it generates a high resistance to flow, as this would generate a noticeable delay in the filling time and negatively affect the user experience. Tube diameter is constrained with our 3D printing methods because as tube diameter decreases, it becomes increasingly difficult to remove the support material and clean inside the tube. For our device, we limited our testing to >1.5 mm diameter sized suction tubes. At the millimeter scale, there was no noticeable delay between pulling up on the urine plunger and filling of the urine chamber.
We tested the Bretherton prediction using 3D-printed parts. A simple plunger system was designed along with suction tubes of varying diameters. In multi-material 3D printing, the printing of support material can be avoided for some geometries and configurations. We printed straight suctions tubes in the vertical configuration, which does not print support within the suction tube and therefore does not require support cleaning. Although we can choose not to print some support pieces, one limitation of our multi-material printer is that it always prints support material for the bottom layer in contact with the 3D printer's build plate. When one side of the model is printed in contact with support and the other parts of the model are located on the exterior sides of the device, there may be minor differences between dimensions and surface roughness. For example, we found that when printing straight tubes upright, the diameter on the side of the tube in contact with the 3D printer's build plate was slightly smaller than the opposite opening. A discrepancy between parts of the model in contact with the build plate and parts that are open to the air is not an exclusively multi-material 3D printing characteristic, but is common to many types of 3D printers. Care was taken to always use the side of the tube in contact with the build plate for the connection to the body of the plunger system.
To test the Bretherton prediction, we used the opposite side of the suction tube to aspirate solution into the tube. The suction tube was manually disturbed through tapping the tip in order to introduce bubbles, mimicking a real-world user experience where the user bumps the device. We found that there was general agreement between bond number and the Bretherton prediction (Table 1). Using water, for a bond number ≤ 0.416, no bubbles entered the device and no fluid dripped from the tip. For bond numbers between 0.544 and 0.688, a bubble entered the tube releasing some drops, but the bubble did not rise and the liquid–air interface at the tip regained stability. Close to the Bretherton prediction at Bo = 0.850, bubbles entered the tube and both rise and no rise of the bubble were observed, which seemed to depend on the size of the bubble incorporated. Finally, for a large bond number (1.028), drops were released when the bubble initially entered the tube, the liquid–air interface at the tip regained stability, and we saw bubble rise as predicted by Bretherton. The experiment was repeated using ethanol, which has a lower surface tension than water, with similar results. We also observed that for very large bond numbers (Bo ≥ 2.155), once the ethanol–air interface at the tip was disturbed, a column of air entered the suction tube, spilling all of the solution out of the tip. Accounting for Bretherton's prediction, the limitations of cleaning support material, and for the pocket of air for blow-out, we selected a suction tube diameter of 2.3 mm in the final design. The surface tension of urine from healthy patients ranges from 48–70 mN m−1.18 Using the low value of surface tension at 48 mN m−1, a density of 1.01, and a 2.3 mm diameter gives a Bo = 0.272.
| Fluid | Diameter (mm) | Bo | Observed behavior |
|---|---|---|---|
| Water | 2 | 0.136 | No drip |
| 2.5 | 0.212 | No drip | |
| 3 | 0.306 | No drip | |
| 3.5 | 0.416 | No drip | |
| 4 | 0.544 | Bubble sticks | |
| 4.5 | 0.688 | Bubble sticks | |
| 5 | 0.850 | Bubble sticks/bubble rises | |
| 5.5 | 1.028 | Bubbles rises | |
| Ethanol | 2 | 0.345 | Bubble sticks |
| 2.5 | 0.539 | Bubble sticks | |
| 3 | 0.776 | Bubble sticks/bubble rises | |
| 3.5 | 1.056 | Bubble rises | |
| 4 | 1.379 | Bubble rises | |
| 4.5 | 1.746 | Bubble rises | |
| 5 | 2.155 | Liquid spills as air column rises | |
| 5.5 | 2.608 | Liquid spills as air column rises |
Accurate dispensing
The flow rate of each solution is determined by the design of the device chambers, plungers, and outlets. We designed each chamber of the device to undergo the same driving pressures over the entire dispensing operation. We can accomplish this by matching the solution height, air pocket height, and plunger heights in both chambers. For example, a 2:1 volume ratio can be obtained by making the area of one chamber twice the area of the second chamber. The cross-sectional area of the channels and outlet valves should also be maintained at the 2:1 ratio to obtain the flow resistance and corresponding volumetric flow rate. In our device, we designed the device with a 2:1 volume ratio between lysis buffer and urine, but we were cognizant of the potential for flow irregularities near the beginning and end of the flow regime. If slight inaccuracies during filling cause urine to enter the static mixer prematurely or after all of the lysis buffer has gone through, this could leave some urine unmixed and unlysed. This could lead to inaccuracies during downstream quantification and unlysed bacteria are a biohazard. To address these concerns, we slightly overfilled the lysis buffer compartment leading to a final lysis buffer to urine volume ratio of 2.2:1.
We evaluated the dispensing accuracy of our device using water, green dye, spectrophometer measurements, and a balance. To examine inter-device variability, we tested three different device prototypes each run in triplicate (Table 2). There was no significant difference among devices for aspiration volume (P = 0.46) or the volume expelled (P = 0.44). Sample aspiration was found to accurately meter ∼790 μL (<1% CV). As previously described, the blow-out volume of air is responsible for ejecting the final volumes of urine and lysis buffer remaining in the chambers and the static mixer. We found that pushing the plunger down over the course of 1–2 s led to relatively little error in the final ejection volume (<2% CV). However, pushing the plunger down faster (in <1 s) pushed bubbles through the static mixer and greater volumes of liquid remained in the device, resulting in reduced ejection volumes (∼1350 μL). In real-world applications, it is important to minimize differences resulting from user operation. Future designs can address the issue of plunger speed affecting dead volume by reducing the diameter of the outlets to prevent bubbles from escaping before the fluid. The ratio of solution ejected from the lysis buffer chamber and the urine chamber was calculated by measuring the absorbance of the final ejected solution and comparing it to the green dye loaded into the lysis buffer chamber. We found that dispensed volumes out of the lysis buffer chamber and urine chamber were similar, with percent deviations of 2.5% and 6.7%.
| Device | Trial | Aspiration volume (μL) | Ejection volume (μL) | Calc. volume from lysis chamber (μL) | Calc. volume from urine chamber (μL) |
|---|---|---|---|---|---|
| 1 | 1 | 782 | 1591 | 1067 | 524 |
| 2 | 784 | 1613 | 1121 | 492 | |
| 3 | 798 | 1660 | 1135 | 525 | |
| 2 | 1 | 796 | 1619 | 1150 | 469 |
| 2 | 799 | 1630 | 1065 | 565 | |
| 3 | 791 | 1577 | 1120 | 457 | |
| 3 | 1 | 788 | 1611 | 1134 | 477 |
| 2 | 787 | 1586 | 1106 | 480 | |
| 3 | 799 | 1572 | 1099 | 473 | |
| AVG | 792 | 1607 | 1111 | 496 | |
| STD | 6 | 27 | 28 | 33 | |
| CV | 0.8% | 1.7% | 2.5% | 6.7% | |
Static mixer design and mixing evaluation
To simplify the user experience and eliminate mixing by pipetting or vortexing, we designed an on-device Kenics static mixer (KMS), a common mixer used for a variety of industrial applications.19 We had previously designed the flow rates of urine and lysis buffer to exit the outlets at a consistent flow rate. We predicted that a KMS mixer placed after the lysis buffer and urine outlets would be an efficient way to mix the two streams. The static mixer is composed of alternating left- and right-hand 180° helical twists with 90° offsets between elements. This immobile structure encased within a tube guides the flow of solutions from the center of the tube to the wall of the tube and from the wall to the center. Each element splits and recombines streams of flow, rapidly homogenizing the fluid, similar to mixing by chaotic advection in moving plugs.14,20,21 We designed a KMS static mixer composed of eight elements, with a diameter of 5 mm, and a length:diameter ratio of 1.25:1. Limited by the requirements of removing support material from 3D-printed parts, it was not feasible to print the entire mixer and tube enclosure as a single unit. Instead, we used a modular approach, printing the mixer elements and the mixer case as separate pieces. Both parts were printed in the upright configuration.
When static mixer elements were printed with the glossy finish setting, only the topmost element was glossy and had different surface roughness and dimensions than the other elements (remaining parts had the matte finish because they were printed in contact with supporting material). To address this issue, we printed the static mixer elements with the matte finish (Fig. 3A). The static mixer elements and the static mixer case were cleaned separately and assembled carefully because the static mixer elements were very prone to breaking (Fig. 3B–D).
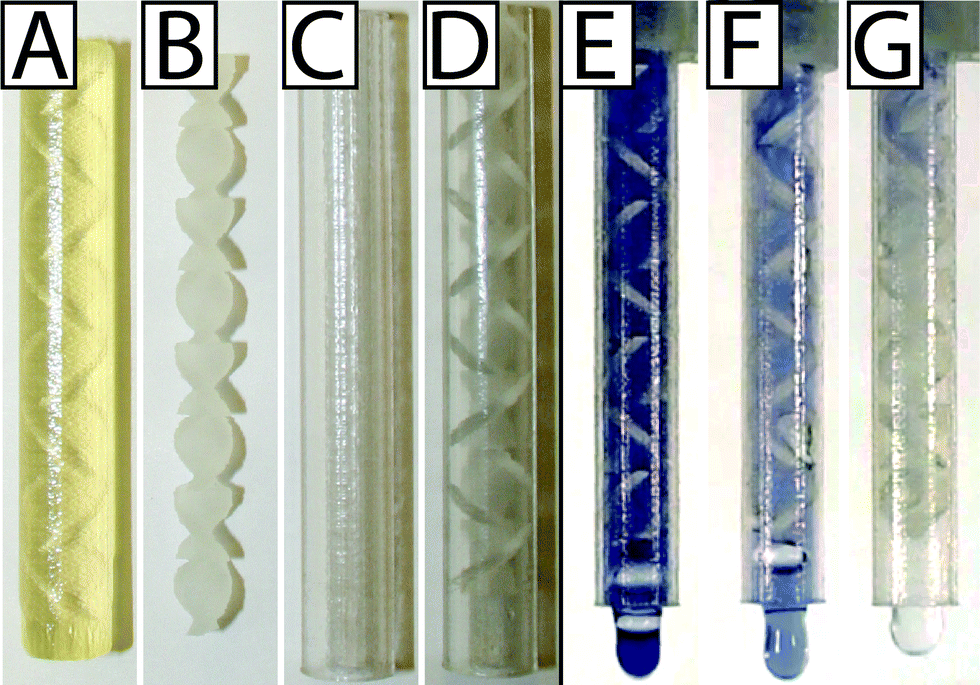 | ||
| Fig. 3 Assembly of the static mixer (A–D) and a demonstration of its use in the meter-mix device (E–G). (A) Freshly printed static mixer elements before cleaning. (B) Static mixer elements after a 15 min cleaning step to remove support material. (C) Static mixer case. (D) Assembled static mixer with elements inserted into case. (E) Iodine–starch indicator loaded into both chambers and ejected through the static mixer. (F) Iodine–starch indicator mixing with water to show a dilution. (G) Iodine–thiosulfate de-colorization reaction demonstrating rapid mixing within the first few static mixer elements. | ||
To evaluate mixing quality, a starch iodine–thiosulfate decolorization was used. The decolorization reaction is a preferred method to evaluate mixing because any pockets of unmixed regions will be visible.22 The initial decolorization reaction occurs quickly in a 1:1 iodine:thiosulfate ratio, although a secondary reaction leads to the reappearance of color so higher ratios of iodine:thiosulfate (e.g. 1:1.2 or 1:1.4) can be used.23–25 For the meter-mix device, we used a 1:1.05 ratio because the design enables rapid mixing within the timescale of the device operation. The starch iodine solution was loaded into the urine chamber through the suction tube, and the sodium thiosulfate was preloaded into the lysis buffer chamber. The device mixed the two solutions within the first three to four elements (Fig. 3G). As a control, to confirm that the loss of color is due to mixing and not an artifact of the chemical or optical properties of the 3D printed part, we also show the static mixer element fully filled and while mixing with a solution that does not cause decolorization. We ran the meter-mix device with starch iodine indicator loaded into both chambers (Fig. 3E) and in a separate experiment with starch iodine loaded into the urine chamber and water loaded into the lysis buffer chamber (Fig. 3F).
Function and biocompatibility
We evaluated the meter-mix device for compatibility with a routine nucleic acid extraction kit by comparing the metering and mixing steps performed by the device with standard approaches for metering and mixing (manual pipetting and vortexing). Two concerns are the potential for nucleic acids to bind to 3D printed surfaces, and the potential for compounds from 3D printed materials to leach into the solutions, both of which can negatively affect downstream analysis of nucleic acids. We preloaded the device with 1150 μL lysis buffer and aspirated urine spiked with 104 cells per mL of either C. trachomatis (CT) or N. gonorrhoeae (NG) through the suction tube. The multivalve was slid and the plungers were pushed manually, ejecting the solutions through the static mixer and into a 2 mL polypropylene tube. An off-device sample was tested in parallel, with 1100 μL lysis buffer and 500 μL spiked urine (see Table 2) metered by a pipettor and the solution mixed by vortex. We also ran no-template controls containing clean urine for both on and off-device conditions. After mixing, all samples were processed in parallel according to the manufacturer's instructions using the QIAamp Viral RNA Mini kit (recommended for purification of bacterial DNA from urine). Following extraction, nucleic acid concentrations were compared using routine quantitative polymerase chain reaction (qPCR) with primers previously evaluated for the detection of C. trachomatis26 or N. gonorrhoeae.27 The threshold cycles for vortexed and device-mixed samples were not statistically different (Fig. 4), indicating that there was no significant loss of nucleic acids and or material leaching that inhibited downstream analysis. No-template negative controls showed no amplification after 35 cycles.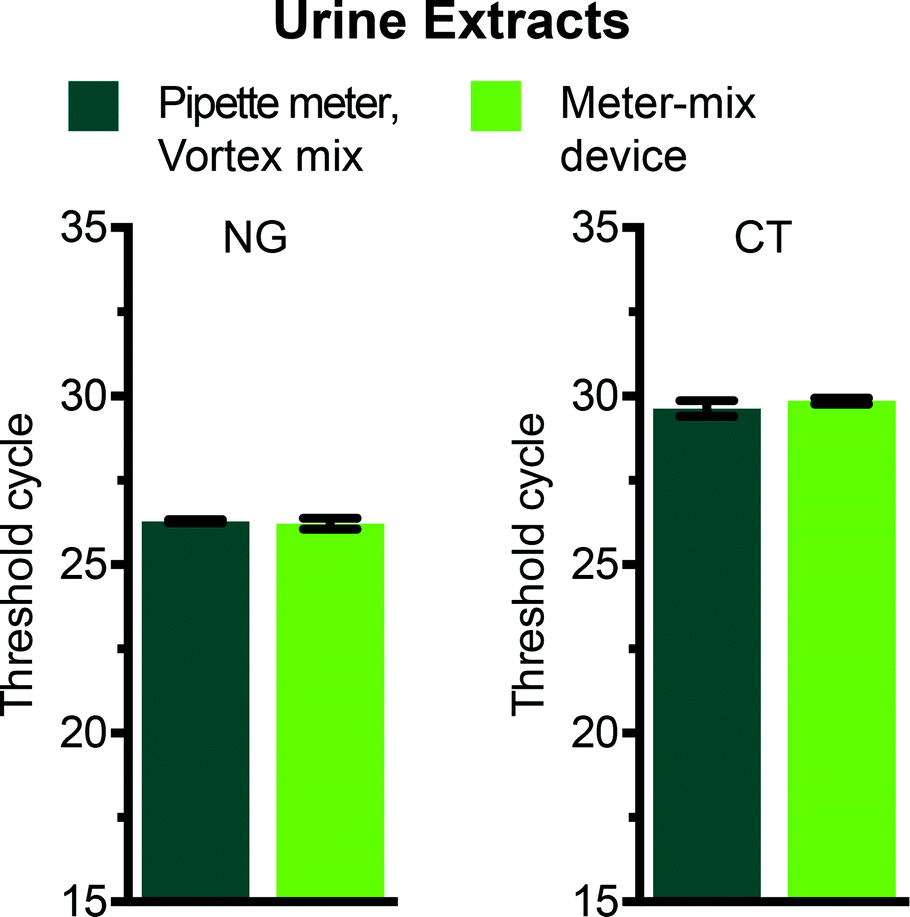 | ||
| Fig. 4 qPCR threshold cycles on DNA extracted from urine spiked with either inactivated Chlamydia trachomatis (CT) or Neisseria gonorrhoeae (NG). Sample metering and mixing with lysis buffer was performed with either the meter-mix device (light green bars) or standard pipette and vortex (dark green bars). The remainder of the extraction protocol was identical for both conditions. | ||
Experimental
Meter-mix device cleaning and assembly
Printed parts were cleaned using pipette tips or copper wire and rinsed with water. The urine plunger, lysis buffer plunger, multivalve, and both chambers of the main enclosure chambers were lubricated with viscous silicone oil (dimethylpolysiloxane 12500 cSt, Sigma Aldrich, St. Louis, MO, USA). To assemble, first the urine plunger was inserted into the urine chamber of the main enclosure followed by the lysis buffer plunger into the lysis buffer chamber. The two plunger stoppers were then inserted, locking the topmost position of the lysis buffer plunger. The multivalve was inserted into the main enclosure from the side, and pushed into its final position to preload 1150 μL lysis buffer through the outlet. The multivalve was then moved into its starting position, the urine plunger pushed to the bottom of the chamber, and the urine suction tube and static mixer were attached. For these joints, the outer diameter of the static mixer case (8 mm) and the outer diameter of the urine suction tube (4.5 mm) was sized exactly to the diameter of adapters on the main enclosure. After cleaning, a thin layer of support material remains at the junctions of the main enclosure. Because this support material is shed from the joints during device use, we used silicone oil to enhance the seal.
Characterization of metering and dispensing
To evaluate metering and dispensing, we loaded into the lysis buffer chamber 1150 μL 0.5% (v/v) green food color dye (The Kroger Co., Cincinnati, OH, USA) diluted in deionized water. Deionized water was aspirated into the urine chamber through the urine suction tube, and mass measured to obtain the aspirated volume (using water density of 1 g mL−1). The multivalve was pressed and the solution ejected into a pre-tared conical tube to obtain the mass of the solution ejected from the device. The resulting solutions were well-mixed through vortexing. The original 0.5% (v/v) green dye and each resulting solution was diluted by 20×, loaded into a cuvette, and measured with a UV-vis spectrophotometer (Nanodrop 2000c, Thermo Scientific, Wilmington, DE, USA). Measurements were taken at the wavelength where the absorbance was maximal (630 nm), and the ratio was used to determine the volume of solutions ejected from each chamber.Iodine–thiosulfate decolorization reaction
Iodine, starch indicator, and sodium thiosulfate solutions were prepared according to the “Handbook of industrial mixing”.22 Briefly, 1150 μL sodium thiosulfate nonahydrate (0.5 mM, ThermoFisher Scientific, Waltham, MA, USA) was loaded into the the lysis buffer chamber. Starch indicator was prepared by adding 100 mg starch, soluble potato, powder (J.T. Baker, Center Valley, PA, U.S.) and 20 g potassium iodide to 10 mL deionized water. 50 μL of this starch solution was added to a 1 mL solution of iodine (1 mM, Alfa Aesar, Ward Hill, MA, USA), coloring the solution dark bluish-purple. The final ratio of iodine:thiosulfate was 1:1.05. A video was taken using a Samsung Galaxy S4 camera, and frames extracted during device operation when the flow fully filled the static mixer (Fig. 3E–G).
Qiagen extraction and qPCR experiment
In order to test device compatibility with biological samples and ensure that downstream nucleic acid analysis was not negatively affected, we compared samples that were metered and mixed on-device against traditional vortex mixing using a commercial nucleic acid extraction kit (QIAamp Viral RNA Mini Kit, 52904). Lysis buffer was loaded with 2 ng μL−1 carrier DNA (salmon sperm DNA, Thermo Fisher AM9680). Non-infectious CT and NG samples were obtained from ZeptoMetrix Corp. (NATNG-ERCM, NATCT(434)-ERCM, Buffalo, NY, USA). Quantitative PCR was performed on a Roche LightCyler 96. PCR reactions consisted of 5 μL SsoFast EvaGreen Supermix (BioRad cat no. 1725200), 2.0 μL of template (extracted spiked urine), 0.5 μL of 20× primer stocks, and 2.5 μL nuclease-free water. The primers used26,27 were previously evaluated for the detection of either CT or NG. Final primer concentration in the reaction was 500 nM. Thermal cycling consisted of a 3 min initial denaturation step at 95 °C, followed by 40 cycles of 20 s at 95 °C, 20 s at 62 °C, and 20 s at 72 °C. Melt analysis confirmed specific product for all reactions.Conclusions
We showed that multi-material 3D printing can be used to prototype a disposable interlock meter-mix device that accurately meters urine and completely mixes it with lysis buffer in a format that meets the requirements for a downstream NAAT compatible with LRS and POC settings. The 3D-printed device accurately aspirated predetermined volumes into a urine chamber with a coefficient of variation of 0.8%. Urine and lysis buffer were dispensed through a KMS static mixer at a 2.2:1 mixing ratio. Printing with translucent materials enabled visual confirmation of fluid movement and showed that mixing occurred within the first few elements of the static mixer, with homogenization and lysis later verified by qPCR. Printing with multi-material 3D printer enabled us to use a combination of composites to create airtight seals that slide without leaking or losing vacuum pressure. Using a 3D printer also helped address the potential for sample dripping, a biohazardous concern when working with bodily fluids and potentially dangerous solutions, as we were able to test Bretherton's prediction for bubble rising through several prototype iterations and identify optimal tube dimensions that ensured the sample did not drip.
The 3D-printed device was designed to optimize the user's experience: operation is simple (three steps); interlock features protect against user error; neither pipetting nor vortexing are required; and the entire device operation is completed within 5 to 10 s (see ESI† video). We validated our device by lysing urine samples spiked with CT/NG and performed downstream processes to quantify nucleic acids through qPCR. These results confirmed that the 3D-printing materials (Veroclear and TangoPlus) were biocompatible; we observed no loss of nucleic acids and devices performed equally well compared with the standard protocol of pipettor metering and vortex mixing in a polypropylene tube. Finally, we demonstrated that the performance of the meter-mix device matched the performance of standard laboratory protocols for metering and mixing, with a substantially shorter time period for device operation.
The meter-mix device described here is not limited to mixing urine with lysis buffer. A common operation in biology, chemistry, and medicine is to mix two solutions of known volume. Due to the customizability of 3D printing and CAD design, it is easy to adapt the meter-mix device to different volumes or configurations. In some applications, it may be desirable to meter two different solutions at the time of use. In this example, the meter-mix device could be reconfigured with an additional suction tube appended to the lysis buffer chamber. Given the versatility of the meter-mix device, it may be useful in a variety of applications such as sequencing, dilutions, or chemical syntheses. Because the meter-mix device simplifies and accelerates workflow, protects against user error and provides a user-friendly experience, we foresee its future application in research labs and limited-resource settings. For example, time-sensitive laboratory measurements may require metering and mixing on the timescale of single digit seconds rather than the tens of seconds required for pipetting. In commercial applications, an important advantage of a single-use disposable device is that it can be assembled and pre-loaded with lysis buffer before it is shipped, eliminating a pipetting step for the end user.
Throughout the course of device development, the 3D printing workflow was a major advantage over analogous forms of prototyping, such as soft lithography. Prototyping with 3D printing was rapid, enabling us to design, test, redesign, and reprint a prototype in the period of a single day. For small parts that can be printed in less than a few hours, it is possible to iterate multiple designs in a single day. The ease with which parts can be modified after having developed the initial design allowed us to print multiple variations of the meter-mix device at once and determine the optimal architecture of each part in a single experiment. This was useful for determining the diameter of the suction tube, setting the parameters for the static mixer, and adjusting the fit for the seals. Another advantage with 3D printing is that the 3D CAD models which are developed during the design stage can also be utilized and adapted for injection molding. This is important in commercial applications, where large quantities are required, because injection molding has higher start-up costs but lower costs per part than 3D printing. We also found modularity to be an important advantage with 3D printing. Parts can be built as separate components and later reassembled, reducing build time (which relies heavily on z-axis height). It is also easier, and less expensive, to validate and iterate with individual components than to redesign and reprint an entire device. Of course, the final cost of producing these devices using standard manufacturing methods (injection molding) will be even lower than prototyping costs.
The greatest limitation we faced with multi-material 3D printing pertained to the support material. We faced three specific issues: (i) wherever support material is printed in contact with the model, the printer produces a matte finish with different surface characteristics and dimensions compared with the glossy finish of parts that do not contact the support material, (ii) it can be difficult to remove the support material for some geometries, so care needs to be taken during the design to account for cleaning, and (iii) removal of the support material takes time, requiring ∼45 min to clean all of the components for a single device. As new support material is developed, this limitation will diminish. For example, some companies have developed new dissolvable support materials that can be removed in a soak-and-rinse process; however, these processes are still diffusion-limited and may be difficult to implement when cleaning long, narrow channels relevant to microfluidic devices. Despite some limitations, we conclude that 3D printing is an attractive prototyping technology with great potential for solving the sample-to-device interface problem in diagnostics, especially in resource-limited settings.
Acknowledgements
This research was supported by DARPA Cooperative Agreement HR0011-11-2-0006. The content of this article does not necessarily reflect the position or the policy of the Government, and no official endorsement should be inferred. This material is also based upon work supported by National Science Foundation Graduate Research Fellowships DGE-1144469 (to E. J.). R. F. I. holds an Innovation in Regulatory Science Award from BWF. We thank Natasha Shelby for contributions to writing and editing this manuscript.References
- C. M. B. Ho, S. H. Ng, K. H. H. Li and Y.-J. Yoon, Lab Chip, 2015, 15, 3627–3637 RSC
.
- B. C. Gross, J. L. Erkal, S. Y. Lockwood, C. Chen and D. M. Spence, Anal. Chem., 2014, 86, 3240–3253 CrossRef CAS PubMed
- A. Waldbaur, H. Rapp, K. Lange and B. E. Rapp, Anal. Methods, 2011, 3, 2681–2716 RSC
- A. Pilipović, P. Raos and M. Šercer, Int. J. Adv. Manuf. Tech., 2007, 40, 105–115 CrossRef
- A. Niemz, T. M. Ferguson and D. S. Boyle, Trends Biotechnol., 2011, 29, 240–250 CrossRef CAS PubMed
- P. Craw and W. Balachandran, Lab Chip, 2012, 12, 2469–2486 RSC
- R. W. Peeling, K. K. Holmes, D. Mabey and A. Ronald, Sex. Transm. Infect., 2006, 82(5), v1–6 CrossRef PubMed
- D. Lee, Y. T. Kim, J. W. Lee, D. H. Kim and T. S. Seo, Biosens. Bioelectron., 2016, 79, 273–279 CrossRef CAS PubMed
- Q. Tian, Y. Mu, Y. Xu, Q. Song, B. Yu, C. Ma, W. Jin and Q. Jin, Anal. Biochem., 2015, 491, 55–57 CrossRef CAS PubMed
- R. C. den Dulk, K. A. Schmidt, G. Sabatte, S. Liebana and M. W. Prins, Lab Chip, 2013, 13, 106–118 RSC
- A. V. Govindarajan, S. Ramachandran, G. D. Vigil, P. Yager and K. F. Bohringer, Lab Chip, 2012, 12, 174–181 RSC
- W. Huang, C. A. Gaydos, M. R. Barnes, M. Jett-Goheen and D. R. Blake, Sex. Transm. Infect., 2013, 89, 108–114 CrossRef PubMed
-
CDC, Reported STDs in the United States 2012 National Data for Chlamydia, Gonorrhea and Syphilis, 2014, http://stacks.cdc.gov/view/cdc/21549 Search PubMed
- J. R. Papp, J. Schachter, C. A. Gaydos and B. Van Der Pol, Recommendations for the Laboratory-Based Detection of Chlamydia trachomatis and Neisseria gonorrhoeae — 2014, 2014, vol. 63, pp. 1–19.
- S. Begolo, D. V. Zhukov, D. A. Selck, L. Li and R. F. Ismagilov, Lab Chip, 2014, 14, 4616–4628 RSC
- S. Makwana, B. Basu, Y. Makasana and A. Dharamsi, Int. J. Pharm. Invest., 2011, 1, 200–206 CrossRef PubMed
- F. P. Bretherton, J. Fluid Mech., 1961, 10, 166–188 CrossRef
- C. O. Mills, E. Elias, G. H. Martin, M. T. Woo and A. F. Winder, J. Clin. Chem. Clin. Biochem., 1988, 26, 187–194 CAS
-
A. W. Etchells and C. F. Meyer, in Handbook of Industrial Mixing, John Wiley & Sons, Inc., 2004, ch. 7, pp. 169, 391–477, DOI:10.1002/0471451452
- H. Song, D. L. Chen and R. F. Ismagilov, Angew. Chem., Int. Ed., 2006, 45, 7336–7356 CrossRef CAS PubMed
- H. Song, M. R. Bringer, J. D. Tice, C. J. Gerdts and R. F. Ismagilov, Appl. Phys. Lett., 2003, 83, 4664–4666 CrossRef CAS PubMed
-
D. A. R. Brown, P. N. Jones, J. C. Middleton, G. Papadopoulos and E. B. Arik, in Handbook of Industrial Mixing, John Wiley & Sons, Inc., 2004, ch. 4, pp. 145–256, DOI:10.1002/0471451452
- A. D. Awtrey and R. E. Connick, J. Am. Chem. Soc., 1951, 73, 1341–1348 CrossRef CAS
- S. Hashimoto, Y. Chikamochi and Y. Inoue, Chem. Eng. Sci., 2012, 80, 30–38 CrossRef CAS
- P. J. Carreau, I. Patterson and C. Y. Yap, Can. J. Chem. Eng., 1976, 54, 135–142 CrossRef CAS
- J. B. Mahony, K. E. Luinstra, J. W. Sellors and M. A. Chernesky, J. Clin. Microbiol., 1993, 31, 1753–1758 CAS
- B. S. Ho, W. G. Feng, B. K. Wong and S. I. Egglestone, J. Clin. Pathol., 1992, 45, 439–442 CrossRef CAS PubMed
Footnote |
| † Electronic supplementary information (ESI) available. See DOI: 10.1039/c6lc00292g |
| This journal is © The Royal Society of Chemistry 2016 |