Cellular entry of graphene nanosheets: the role of thickness, oxidation and surface adsorption
Jiuling
Wang
a,
Yujie
Wei
a,
Xinghua
Shi
*a and
Huajian
Gao
b
aState Key Laboratory of Nonlinear Mechanics, Institute of Mechanics, Chinese Academy of Sciences, Beijing 100190, People's Republic of China. E-mail: shixh@imech.ac.cn
bSchool of Engineering, Brown University, 610 Barus & Holley, 182 Hope Street, Providence, RI 02912, USA
First published on 26th June 2013
Abstract
Coarse grained molecular dynamics simulations are conducted to study the interaction of graphene nanosheets with a lipid bilayer, focusing on the effects of graphene thicknesses (single/multi-layered graphene), oxidation and surface absorption by lipid molecules. The results show that a hydrophobic corner of graphene can pierce into the bilayer, while different oxidations of the nanosheets affect their final equilibrium configurations in the bilayer: lying across or within the hydrophobic core of the bilayer. The underlying mechanism is clarified by calculating the energy barrier for graphene piercing into the bilayer. Our studies provide fundamental guidance towards understanding how graphene enters cells, which is important for biomedical diagnostics and therapies, and for managing health impacts following occupational or environmental exposure.
Introduction
Nanoparticles (NPs) have become prevalent in many application fields such as cosmetics, textile, bioimaging and biomedicine. The growing applications of NPs pose serious concerns about their toxicity as they enter the human body via various pathways including the respiratory system, skin absorption, intravenous injection and implantation.1–5 As a result, there is an urgent need to understand the potential physiological and pathological reactions after exposure of the body to NPs. Carbon family nanomaterials, including carbon nanotube (CNT), fullerene and graphene, are important NPs that have attracted continuous experimental and theoretical investigations into their cytotoxicity.6–29 In particular, graphene has shown great potential for next generation microchips, biosensors, tissue engineering and drug delivery30–39 due to its extraordinary electronic, thermal and mechanical properties.40 It is important to assess the hazards of graphene to human health, to create safer biomedical diagnostics and therapies and to regulate occupational and environmental exposure. Geometrically, before graphene reaches the target cellular compartments, it needs to overcome biomembrane barriers first. Therefore, it is of great importance to investigate graphene–membrane interactions.While various experimental techniques are being developed to probe NP–membrane interaction, molecular dynamics simulations have been broadly adopted as a powerful, complementary tool of investigation in parallel to experiments. To alleviate the well-known limitations of atomistic simulations in time and size scales, Marrink et al. developed a coarse grained molecular dynamics (CGMD) simulation technique based on the so-called Martini force field.41,42 This method resulted in improvements in simulation time and size scales by several orders of magnitude, and has been successfully applied to problems involving interactions between nanomaterials and cells.14–16,19,26,27,29
In the present work, we investigate the interaction between a patch of lipid bilayer and a number of graphene nanosheet samples including single/multi-layered pristine graphene, oxidized graphene, and lipid covered graphene. By using CGMD, we obtain the energy landscape associated with graphene entering the bilayer. It will be shown that the oxidation and adsorption of lipid molecules can both play a key role in the cellular entry of graphene nanosheets.
Method
The coarse grained model
To study the interaction between graphene and lipid bilayer at atomistic level at micro length and time scales, the CGMD method developed by Marrink et al. was adopted.41–43 In this method, there are four types of coarse grained particles in a lipid molecule: polar (P), nonpolar (N), apolar (C) and charged (Q). Each particle type has several subtypes for fine tuning, and 728 1-palmitoyl-2-oleoyl-sn-glycero-3-phosphocholine (POPC) lipid molecules are selected to construct a bilayer system with interactions described by the Martini Force Field.42 The graphene sheet is constructed by mapping 9 carbon atoms into 1 CG particle shown in orange in Fig. 1a, where the distance between the nearest two particles is 0.4254 nm. The SC4 particle type is used to describe a graphene particle with hydrophobic properties.43 To mimic graphene oxide (GO), some graphene particles are oxidized (type P1), as shown in magenta in Fig. 1b. To appropriately reflect the bending rigidity of graphene, particles within a distance of 1.2 nm are connected by harmonic springs with a force constant of 12![[thin space (1/6-em)]](https://www.rsc.org/images/entities/char_2009.gif) 000 kJ mol−1 nm−2. In all simulations, the size of graphene nanosheet is selected to be 5.526 × 5.956 nm2. The interaction parameters for different particles are listed in Table 1, where C6 and C12 are parameters of the Lennard-Jones potential V(r) = C6r−6 − C12r−12.
000 kJ mol−1 nm−2. In all simulations, the size of graphene nanosheet is selected to be 5.526 × 5.956 nm2. The interaction parameters for different particles are listed in Table 1, where C6 and C12 are parameters of the Lennard-Jones potential V(r) = C6r−6 − C12r−12.
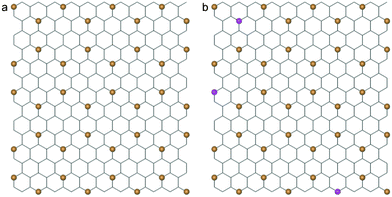 | ||
| Fig. 1 (a) A coarse-grained structure of graphene (orange beads) superimposed onto the corresponding atomistic lattice. (b) The CG model of a partially oxidized graphene sheet with oxidized CG particles in magenta. | ||
| type1 | type2 | C6 | C12 | interaction level |
|---|---|---|---|---|
| SC4 | Q0 | 1.1642 × 10⁻¹ | 1.2549 × 10⁻³ | semi repulsive |
| Qa | 1.1642 × 10⁻¹ | 1.2549 × 10⁻³ | semi repulsive | |
| Na | 1.3366 × 10⁻¹ | 1.4408 × 10⁻³ | almost intermediate | |
| C1 | 1.3366 × 10⁻¹ | 1.4408 × 10⁻³ | almost intermediate | |
| C3 | 1.5091 × 10⁻¹ | 1.6267 × 10⁻³ | intermediate | |
| P4 | 1.1642 × 10⁻¹ | 1.2549 × 10⁻³ | semi repulsive | |
| P4 | Q0 | 2.4145 × 10⁻¹ | 2.6027 × 10⁻³ | supra attractive |
| Qa | 2.4145 × 10⁻¹ | 2.6027 × 10⁻³ | supra attractive | |
| Na | 1.7246 × 10⁻¹ | 1.8590 × 10⁻³ | semi attractive | |
| C1 | 8.6233 × 10⁻² | 9.2953 × 10⁻⁴ | repulsive | |
| C3 | 1.1642 × 10⁻¹ | 1.2549 × 10⁻³ | semi repulsive | |
| P1 | Q0 | 1.7246 × 10⁻¹ | 1.8590 × 10⁻³ | semi attractive |
| Qa | 2.1558 × 10⁻¹ | 2.3238 × 10⁻³ | attractive | |
| Na | 1.9402 × 10⁻¹ | 2.0914 × 10⁻³ | almost attractive | |
| C1 | 1.1642 × 10⁻¹ | 1.2549 × 10⁻³ | semi repulsive | |
| C3 | 1.5091 × 10⁻¹ | 1.6267 × 10⁻³ | intermediate | |
| P4 | 1.9402 × 10⁻¹ | 2.0914 × 10⁻³ | almost attractive | |
| SC4 | 1.5091 × 10⁻¹ | 1.6267 × 10⁻³ | intermediate |
Simulation detail
A bilayer patch consisting of 182 POPC molecules is obtained by self-assembly of lipids in aqueous solution. By multiplying the obtained patch 4 times, we obtain a larger lipid bilayer consisting of 728 POPC molecules with a lateral dimension of 15.2 nm × 15.2 nm. The bilayer plane lies parallel to the xy-plane, and a graphene nanosheet is vertically arranged in close proximity above the bilayer (at a distance smaller than 0.6 nm). A simulation box of 15.2 nm × 15.2 nm × 20 nm is then constructed and water particles are filled in. A periodic boundary condition is applied in all three dimensions. During the simulation, the system is first run for 0.3 ns in a canonical (NVT) ensemble with both graphene and lipid bilayer restrained to equilibrate the system. Then the simulations are conducted in an isothermal-isobaric (NPT) ensemble at a temperature of 323 K and a pressure of 1 bar. The Berendsen barostat with semi-isotropic pressure coupling is used to adjust the pressure.44 The nonbonded interaction is calculated with a cutoff of 1.2 nm. In all simulations the time step is 30 fs. All simulations were performed with the GROMACS software package,45 and VMD was used for molecular visualization.46Results and discussion
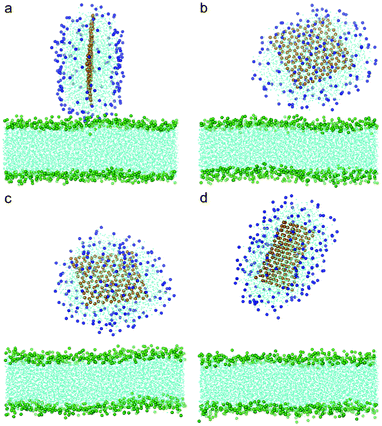
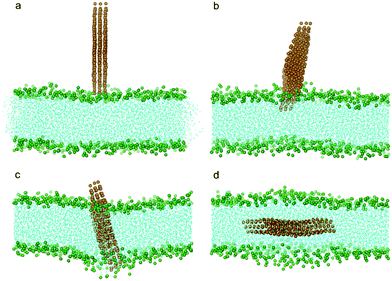
To understand how hydrophobic graphene interacts with a lipid bilayer, we first select a graphene nanosheet without any oxidation. It is seen that the graphene first jumps away from the surface of the bilayer (Fig. 2a, 2b). We attribute this behavior of graphene to repulsion between the hydrophobic graphene particles and the hydrophilic lipid heads. After Brownian motion of around 73.5 ns, the graphene gets close to the bilayer with one of its corners pointing downward (Fig. 2c). The graphene nanosheet then pierces into the bilayer until a metastable, trans-membrane configuration is reached, as shown in Fig. 2e. Eventually, the nanosheet rotates and comes to rest in the middle of the lipid bilayer (Fig. 2f) as an interstitial NP. Fig. 3a shows the evolution of the interaction energy between graphene and lipid bilayer. It is seen that the interaction energy undergoes two drops in the process. The first large drop occurs as the graphene pierces into the bilayer and the second small drop (shown by arrow) can be related to the rotation of the nanosheet to its resting position in the hydrophobic core of the bilayer. The evolution of distance and angle between graphene and bilayer are further shown in Fig. 3b and Fig. 3c, respectively, indicating the entry of graphene is a combination of insertion and rotation. The process is quite similar to that described in one recent paper,19 where graphene is wrapped by a POPC lipid monolayer before it interacts with the bilayer.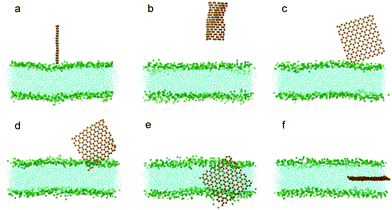 | ||
| Fig. 2 Snapshots of a graphene nanosheet entering a lipid bilayer membrane with a time sequence of (a) 0 ns, (b) 17 ns, (c) 73.5 ns, (d) 75.5 ns, (e) 115 ns and (f) 166 ns. The graphene is shown in orange and the lipids in cyan with green head groups (phosphodiester groups). For clarity, water molecules are not shown here. | ||
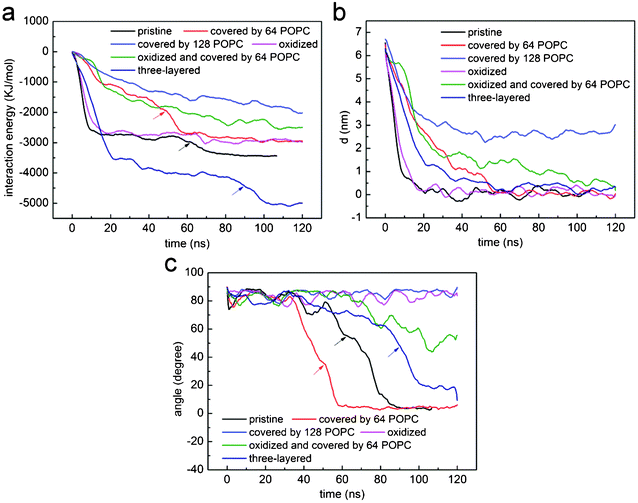 | ||
| Fig. 3 The evolution of (a) interaction energy, (b) distance and (c) angle between lipid bilayer and a nanosheet of graphene that is pristine (black), coated with 64 (red) and 128 (blue) POPC lipids, oxidized (magenta), three-layered (dark blue), oxidized and coated by 64 POPC lipids (green). For comparison purposes, the profiles for pristine graphene (black) have been shifted by 73.5 ns leftwards. | ||
To investigate how a coated POPC lipid monolayer on graphene may affect its interaction with a bilayer, we further conducted a series of simulations with graphene coated with 32, 64, 128 and 182 POPC molecules, corresponding to a surface absorption density of 0.486, 0.972, 1.945 and 2.7649 nm−2, respectively. At a relatively low density of coating (the first three cases), the edges or corners of graphene are still exposed to the aqueous solution. To enhance the probability of graphene interacting with bilayer and reduce waiting time, we placed one corner of the graphene close to the lipid membrane within a distance of 0.15 nm while keeping all other details the same as described above. For the three cases of relatively low density, the graphene exhibits similar behavior as the case without coating, i.e. it ends up residing in the middle of the bilayer while the POPC lipids are detached from the graphene and fused into the upper leaf of the bilayer (Fig. 4a–d). The interaction energy between graphene and bilayer shown in Fig. 3a is seen to decrease slower than the case of pristine one, suggesting that the lipid coating tends to impede graphene insertion. It is noteworthy that, if the initial distance between graphene and bilayer is increased, for example, to 0.3 nm, the entry of graphene into the bilayer will not be observed within the limited simulation time (300 ns).
 | ||
| Fig. 4 Snapshot configurations of graphene covered by 64 POPC lipids entering bilayer at (a) 0 ns, (b) 8.4 ns, (c) 35.7 ns and (d) 81 ns. The color scheme is the same as that used in Fig. 2 except the head groups of lipids wrapping the graphene are shown in blue. | ||
When graphene is coated with a relatively high density of POPC lipids (e.g., the case of 182 lipids), the POPC lipids fully encapsulate the graphene in a micelle. In this case, there are no exposed edges or corners, and the graphene has no opportunity to directly contact the bilayer. It has been reported that as the micelle comes in contact with the bilayer, the lipids within the micelle and bilayer fuse together and reassemble into a new bilayer.19 During such a fusion process, the graphene nanosheet enters the hydrophobic core of the bilayer and lies parallel to the mid-plane.19 In our simulations, the graphene and micelle form a stable complex which diffuses within the aqueous solution without any fusion within the limited simulation time (Fig. 5). We will show shortly that this is due to the energy barrier for membrane fusion.
 | ||
| Fig. 5 Snapshot configurations of graphene covered by 182 POPC lipids entering bilayer at (a) 0 ns, (b) 30 ns, (c) 60 ns and (d) 150 ns. The color scheme is the same as that used in Fig. 4. | ||
To shed light on how the density of coated lipids influences the entry of graphene into the bilayer, we performed potential of mean force (PMF) calculations to obtain the energy barrier for graphene entering the bilayer. By using an umbrella sampling technique and a weighted histogram analysis method (WHAM),47,48 we conducted a series of simulations with graphene restrained at certain positions along the entry route. In all sampling simulations, the graphene plane is perpendicular to the bilayer plane with its corner in contact with the bilayer first (Fig. 6a, inset). The simulations were carried out in an NPT ensemble at a temperature of 323 K with semi-isotropic coupling. At each restrained point, we run the simulation for 30 ns to ensure sufficient relaxation, and continue the simulation for another 60 ns for sampling.
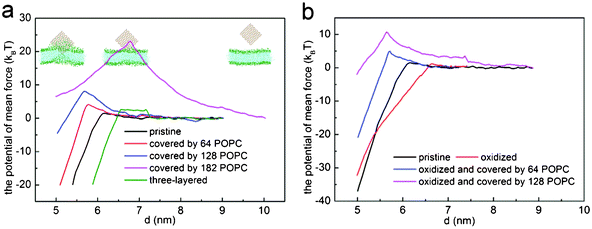 | ||
| Fig. 6 The potential of mean force for (a) three-layered graphene (green), pristine graphene (black), graphene covered with 64 (red), 128 (blue) and 182 (magenta) POPC lipids, and (b) oxidized graphene (red) and graphene covered with 64 (blue) and 128 (magenta) POPC lipids. | ||
Fig. 6a shows the PMF as a function of the distance d between the center of mass of graphene and lipid bilayer. For pristine single-layer graphene, graphene covered by 64, 128 and 182 POPC lipids, the corresponding energy barriers for graphene piercing the bilayer are found to be 1.54 kBT, 4.14 kBT, 8.08 kBT and 23.50 kBT, respectively. Therefore, the energy barrier is small for pristine graphene nanosheets and those covered with a low density of POPC lipids coating. For the fully encapsulated case of 182 POPC lipids, the energy barrier is much higher. As illustrated in simulations shown in Fig. 4 and 5, both the entry mechanisms and the associated energy barriers are different for these cases. For the case of 182 lipids, the barrier stems from the repulsion between lipids in the graphene encapsulated micelle and the bilayer before they are fused; while for pristine graphene and for the cases of low density POPC coating, the repulsion between graphene and lipid heads accounts for the barrier. So a lipid coating of graphene can substantially alter the energy barrier of graphene entry into cell. By adjusting the adsorption density of lipids on graphene, it may be possible to manipulate both the dispersion and cellular entry mechanisms of graphene.
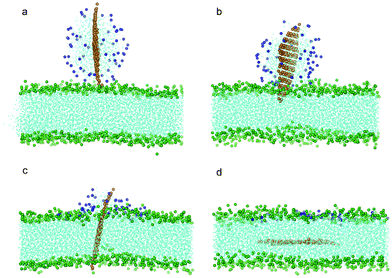
Because the edges of graphene can be oxidized intentionally or unintentionally during synthesis, we further investigated how partially oxidized edges of graphene may affect its entry into the bilayer. With 10% of the carbon particles at the edges oxidized as P1 particles (Fig. 1b) which are hydrophilic, we repeated the simulations for pristine graphene with all the other conditions remaining the same as in previous calculations. It was found that the graphene can spontaneously squeeze into the bilayer (Fig. 7a–c). However, unlike a pristine graphene nanosheet which finally ends up residing in the middle of the bilayer (Fig. 2f), the oxidized graphene remains standing across the bilayer almost orthogonal to the bilayer plane (Fig. 3c, Fig. 7d). This can be attributed to the fact that the edges of the oxidized graphene nanosheet favor the hydrophilic head groups of lipids as well as water.
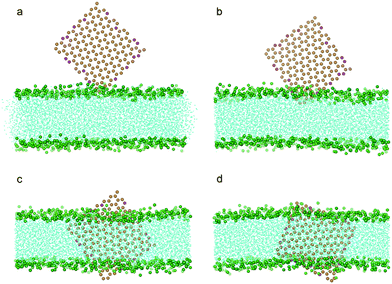 | ||
| Fig. 7 Snapshot configurations of an edge oxidized graphene nanosheet entering a bilayer at 0 ns, 2.1 ns, 16.8 ns, 120.0 ns. The color scheme is the same as that used in Fig. 2, except that the oxidized particles of graphene are shown in magenta. | ||
We note that the degree of oxidation can greatly affect the final state of graphene within the bilayer. When only 5% of the carbon particles are oxidized, we found that the graphene finally lies parallel in the middle of the bilayer, the same configuration we see for pristine graphene. The ratio of hydrophilic/hydrophobic groups plays a key role in determining the final state of the graphene: for a low hydrophilic over hydrophobic ratio, the graphene finally lies parallel in the middle of the bilayer while it stands across the bilayer when the hydrophilic–hydrophobic ratio is high. This suggests that we may control the final state of graphene within the bilayer by tuning the ratio of hydrophilic over hydrophobic groups on graphene.
We have investigated the interaction of a 64-POPC-covered oxidized graphene nanosheet (10% carbon particles oxidized) with the bilayer membrane in the same way. As shown in Fig. 8, after the graphene pierces and the lipid coating fuses into the bilayer, the nanosheet stands across the bilayer, similar to that seen in Fig. 7.
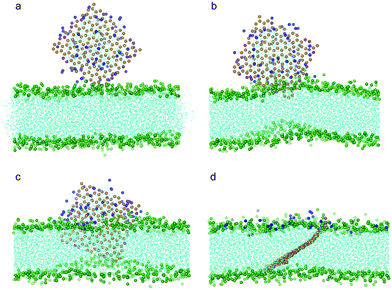 | ||
| Fig. 8 Snapshot configurations of an oxidized graphene nanosheet covered by 64 POPC lipids entering a bilayer membrane at time sequences of 0 ns, 12 ns, 20.7 ns, and 238 ns. The color scheme is the same as that used in Fig. 7. | ||
The PMF for pristine graphene, oxidized graphene and oxidized graphene covered by 64 and 128 POPC lipids entering a bilayer is shown in Fig. 6b. The corresponding energy barriers are 1.54 kBT, 1.17 kBT and 4.99 kBT and 10.76 kBT, respectively. It is seen that the entry barrier for oxidized graphene is even lower than that for the pristine ones. We therefore conclude that partial oxidation of graphene edges may facilitate its entry into cells.
In all the above studies we have focused on a monolayered graphene nanosheet piercing into a bilayer. In reality, one often encounters few-layered graphene (FLG) nanosheets. To explore how the thickness of FLG influences its interaction with a bilayer, we conducted simulations with the monolayered graphene replaced by a three-layered graphene. Similarly to the monolayer cases, the three-layered graphene still uses its corner to pierce into the bilayer (Fig. 9b). After insertion and rotation, the FLG finally lies parallel in the middle of the bilayer (Fig. 3, 9c, d). The energy barrier for the FLG to pierce through the bilayer is about 2.7 kBT, larger than the monolayer case (Fig. 6a). We also tested a system with nine-layered graphene and obtained similar results, indicating that the thickness of FLG has only a minor influence on the entry energy barrier, and the sharp corner of FLG can initiate piercing.
 | ||
| Fig. 9 Snapshot configurations of three-layered graphene entering a lipid bilayer at time sequences of 0 ns, 6.0 ns, 65.7 ns and 169.5 ns. The color scheme is the same as that used in Fig. 2. | ||
Compared with the case of carbon nanotubes,18,26,27 there are some differences and similarities for cellular entry of graphene nanosheets. By using an atomistic MD simulation, Kraszewski et al. found that there would be an evident potential well at the water/lipid interface when CNT got close to the lipid bilayer.18 However, through our CGMD simulations, we did not find a remarkable energy well for pristine graphene. This may be attributed to the approximations of Martini Force Field regarding long-range interactions. Lelimousin et al. explored the role of CNT length and diameter when it is inserted in a bilayer membrane.27 They found that CNTs adopt a more tilted angle relative to the bilayer normal when the length of CNTs increased.27 It seems the aspect ratio also plays a role.49 For graphene entry we found the pristine graphene nanosheet lies in the middle of the lipid bilayer. Lee et al. found that wrapping of charged lipid headgroups and long hydrophilic PEG chains would inhibit single-walled carbon nanotube from inserting into the bilayer.26 It is similar to the case of graphene coated by 182 POPC lipids which is shown not to enter the bilayer membrane.
Conclusion
In summary, we have studied the mechanisms of interaction between a lipid bilayer and a series of graphene nanosheets, including single/multi-layered pristine graphene, oxidized graphene, and those coated with lipid molecules of different densities. We found that pristine and few-layered graphene nanosheets can spontaneously insert into the bilayer and rotate themselves to lie parallel in the middle of the bilayer. The edge oxidized graphene nanosheets can pierce into the bilayer with the final state either parallel in the middle of the bilayer or standing upwards across the bilayer, depending on the degree of oxidation. Graphene covered by a low density of lipid molecules can still pierce into the bilayer, initiated by one of its bare corners. However, piercing can be hindered if the whole body of graphene is fully encapsulated in a lipid micelle. In the latter case, cell entry requires fusion of a graphene encapsulated micelle and the bilayer, which is a relatively high energy barrier process. The underlying mechanisms of these processes have been discussed with calculations of the associated energy barriers. We also discussed the similarities and differences between computer simulation results of graphene and CNTs.Acknowledgements
The work is supported by the National Natural Science Foundation of China (NSFC) (Grant No. 11272327), National Science Foundation (NSF) (Grant No. CMMI-1028530), and computation is mainly supported by the Supercomputing Center of Chinese Academy of Sciences (SCCAS).References
- A. Nel, T. Xia, L. Madler and N. Li, Science, 2006, 311, 622–627 CrossRef CAS.
- N. Lewinski, V. Colvin and R. Drezek, Small, 2008, 4, 26–49 CrossRef CAS.
- T. Vorup-Jensen and D. Peer, Adv. Drug Delivery Rev., 2012, 64, 1661–1662 CrossRef CAS.
- T. L. Doane and C. Burda, Chem. Soc. Rev., 2012, 41, 2885–2911 RSC.
- G. Oberdorster, E. Oberdorster and J. Oberdorster, Environ. Health Perspect., 2005, 113, 823–839 CrossRef CAS.
- G. D. Nielsen, M. Roursgaard, K. A. Jensen, S. S. Poulsen and S. T. Larsen, Basic Clin. Pharmacol. Toxicol., 2008, 103, 197–208 CrossRef CAS.
- K. Aschberger, H. J. Johnston, V. Stone, R. J. Aitken, C. L. Tran, S. M. Hankin, S. A. K. Peters and F. M. Christensen, Regul. Toxicol. Pharmacol., 2010, 58, 455–473 CrossRef CAS.
- C. W. Lam, J. T. James, R. McCluskey, S. Arepalli and R. L. Hunter, Crit. Rev. Toxicol., 2006, 36, 189–217 CrossRef CAS.
- X. C. Zhao and R. T. Liu, Environ. Int., 2012, 40, 244–255 CrossRef CAS.
- V. C. Sanchez, A. Jachak, R. H. Hurt and A. B. Kane, Chem. Res. Toxicol., 2012, 25, 15–34 CrossRef CAS.
- C. Bussy, H. Ali-Boucetta and K. Kostarelos, Acc. Chem. Res., 2013, 46, 692–701 CrossRef CAS.
- A. M. Jastrzebska, P. Kurtycz and A. R. Olszyna, J. Nanopart. Res., 2012, 14 CrossRef.
- R. Qiao, A. P. Roberts, A. S. Mount, S. J. Klaine and P. C. Ke, Nano Lett., 2007, 7, 614–619 CrossRef CAS.
- J. Wong-Ekkabut, S. Baoukina, W. Triampo, I. M. Tang, D. P. Tieleman and L. Monticelli, Nat. Nanotechnol., 2008, 3, 363–368 CrossRef CAS.
- X. Shi, Y. Kong and H. Gao, Acta Mech. Sin., 2008, 24, 161–169 CrossRef CAS.
- Y. Li, H. Yuan, A. von dem Bussche, M. Creighton, R. H. Hurt, A. B. Kane and H. Gao, Proc. Natl. Acad. Sci. U. S. A., 2013 DOI:10.1073/pnas.1222276110.
- X. Shi, A. von dem Bussche, R. H. Hurt, A. B. Kane and H. Gao, Nat. Nanotechnol., 2011, 6, 714–719 CrossRef CAS.
- S. Kraszewski, A. Bianco, M. Tarek and C. Ramseyer, PLoS One, 2012, 7, e40703 CAS.
- A. V. Titov, P. Kral and R. Pearson, ACS Nano, 2010, 4, 229–234 CrossRef CAS.
- A. Gajewicz, B. Rasulev, T. C. Dinadayalane, P. Urbaszek, T. Puzyn, D. Leszczynska and J. Leszczynski, Adv. Drug Delivery Rev., 2012, 64, 1663–1693 CrossRef CAS.
- A. J. Makarucha, N. Todorova and I. Yarovsky, Eur. Biophys. J., 2011, 40, 103–115 CrossRef CAS.
- S. Hofinger, M. Melle-Franco, T. Gallo, A. Cantelli, M. Calvaresi, J. Gomes and F. Zerbetto, Biomaterials, 2011, 32, 7079–7085 CrossRef.
- S. Pogodin and V. A. Baulin, ACS Nano, 2010, 4, 5293–5300 CrossRef CAS.
- R. Guo, J. Mao and L.-T. Yan, Biomaterials, 2013, 34, 4296–4301 CrossRef CAS.
- S. Kraszewski, F. Picaud, I. Elhechmi, T. Gharbi and C. Ramseyer, Carbon, 2012, 50, 5301–5308 CrossRef CAS.
- H. Lee, J. Phys. Chem. B, 2013, 117, 1337–1344 CrossRef CAS.
- M. Lelimousin and M. S. Sansom, Small, 2013 DOI:10.1002/smll.201202640.
- L. Monticelli, E. Salonen, P. C. Ke and I. Vattulainen, Soft Matter, 2009, 5, 4433–4445 RSC.
- E. J. Wallace and M. S. P. Sansom, Nano Lett., 2008, 8, 2751–2756 CrossRef CAS.
- P. K. Ang, M. Jaiswal, C. H. Y. X. Lim, Y. Wang, J. Sankaran, A. Li, C. T. Lim, T. Wohland, O. Barbaros and K. P. Loh, ACS Nano, 2010, 4, 7387–7394 CrossRef CAS.
- L. Zhang, J. Xia, Q. Zhao, L. Liu and Z. Zhang, Small, 2010, 6, 537–544 CrossRef CAS.
- B. Chen, M. Liu, L. Zhang, J. Huang, J. Yao and Z. Zhang, J. Mater. Chem., 2011, 21, 7736–7741 RSC.
- C. Wang, J. Li, C. Amatore, Y. Chen, H. Jiang and X.-M. Wang, Angew. Chem., Int. Ed., 2011, 50, 11644–11648 CrossRef CAS.
- Q. He, S. Wu, Z. Yin and H. Zhang, Chem. Sci., 2012, 3, 1764–1772 RSC.
- S.-J. Liu, Q. Wen, L.-J. Tang and J.-H. Jiang, Anal. Chem., 2012, 84, 5944–5950 CrossRef CAS.
- Y. Liu, X. Dong and P. Chen, Chem. Soc. Rev., 2012, 41, 2283–2307 RSC.
- K. Yang, L. Z. Feng, X. Z. Shi and Z. Liu, Chem. Soc. Rev., 2013, 42, 530–547 RSC.
- S. H. Ku, M. Lee and C. B. Park, Adv. Healthcare Mater., 2013, 2, 244–260 CrossRef CAS.
- Y. Zhang, T. R. Nayak, H. Hong and W. B. Cai, Nanoscale, 2012, 4, 3833–3842 RSC.
- K. S. Novoselov, Rev. Mod. Phys., 2011, 83, 837–849 CrossRef CAS.
- S. J. Marrink, A. H. de Vries and A. E. Mark, J. Phys. Chem. B, 2004, 108, 750–760 CrossRef CAS.
- S. J. Marrink, H. J. Risselada, S. Yefimov, D. P. Tieleman and A. H. de Vries, J. Phys. Chem. B, 2007, 111, 7812–7824 CrossRef CAS.
- L. Monticelli, J. Chem. Theory Comput., 2012, 8, 1370–1378 CrossRef CAS.
- H. J. C. Berendsen, J. P. M. Postma, W. F. Vangunsteren, A. Dinola and J. R. Haak, J. Chem. Phys., 1984, 81, 3684–3690 CrossRef CAS.
- B. Hess, C. Kutzner, D. van der Spoel and E. Lindahl, J. Chem. Theory Comput., 2008, 4, 435–447 CrossRef CAS.
- W. Humphrey, A. Dalke and K. Schulten, J. Mol. Graphics, 1996, 14, 33–38 CrossRef CAS.
- G. M. Torrie and J. P. Valleau, J. Comput. Phys., 1977, 23, 187–199 CrossRef.
- S. Kumar, D. Bouzida, R. H. Swendsen, P. A. Kollman and J. M. Rosenberg, J. Comput. Chem., 1992, 13, 1011–1021 CrossRef CAS.
- K. Yang and Y. Q. Ma, Nat. Nanotechnol., 2010, 5, 579–583 CrossRef CAS.
| This journal is © The Royal Society of Chemistry 2013 |