
 Open Access Article
 This Open Access Article is licensed under a
 Creative Commons Attribution 3.0 Unported Licence
Synthesis of N-doped zeolite-templated carbons via depolymerized oligomer filling: applications in EDLC electrodes†
Hiroyuki Itoi *a,
Chika Matsuokaa,
Ginga Saekia,
Hiroyuki Iwatab,
Shinichiroh Iwamuracd,
Keigo Wakabayashie,
Takeharu Yoshiie,
Hirotomo Nishiharace and
Yoshimi Ohzawaa
*a,
Chika Matsuokaa,
Ginga Saekia,
Hiroyuki Iwatab,
Shinichiroh Iwamuracd,
Keigo Wakabayashie,
Takeharu Yoshiie,
Hirotomo Nishiharace and
Yoshimi Ohzawaa
aDepartment of Applied Chemistry, Faculty of Engineering, Aichi Institute of Technology, 1247 Yachigusa, Yakusa, Toyota 470-0392, Japan. E-mail: itoi-hiroyuki@aitech.ac.jp
bDepartment of Electrical and Electronics Engineering, Aichi Institute of Technology, Yachigusa 1247, Yakusa-cho, Toyota 470-0392, Japan
cAdvanced Institute for Materials Research (WPI-AIMR), Tohoku University, 2-1-1 Katahira, Aoba-ku, Sendai 980-8577, Japan
d3DC Inc., 2-1-1 Katahira, Aoba-ku, Sendai 980-8577, Japan
eInstitute of Multidisciplinary Research for Advanced Materials, Tohoku University, 2-1-1 Katahira, Aoba-ku, Sendai 980-8577, Japan
First published on 12th September 2024
Abstract
Zeolite-templated carbons (ZTCs) are widely studied from basic research to applied research owing to their characteristic pore structures. To synthesize ZTCs, molecules with a size smaller than the pore sizes of template zeolites have been used as carbon sources for their carbonization in the zeolite pores. Therefore, the type of carbon sources has been limited to molecules with a size smaller than the pore sizes of zeolites. In this study, highly structurally regular N-doped zeolite-templated carbons are synthesized using propylene as a carbon source and chitin as both carbon and nitrogen sources via a depolymerized oligomer filling (DOF) mechanism. Chitin, the second most abundant biopolymer on the Earth, consists of N-acetylglucosamine (GlcNAc) as its unit structure and has a much larger size than the zeolite pores. NaY zeolite is used as a template without drying and mixed with chitin. The mixture is subjected to chemical vapor deposition (CVD) using propylene and subsequent heat treatment for graphitization, followed by HF etching for zeolite removal. Upon heating the mixture of the zeolite and chitin, chitin is catalytically depolymerized into chitin oligosaccharide radicals by the zeolite, and the radicals are absorbed into the zeolite pores below 450 °C, which is supported by electron spin resonance and N2 adsorption/desorption analyses. The ZTC structure is completed by propylene CVD for adequately filling carbon into the zeolite pores. A validation experiment is conducted using GlcNAc instead of chitin to confirm that the N-doped ZTC is synthesized via the DOF mechanism. The resulting N-doped ZTCs have high structural regularity and high surface areas ranging from 3420 to 3740 m2 g−1, and show a higher area-normalized capacitance than undoped ZTC as electric double-layer capacitor electrodes. Utilizing chitin from crustacean shells as one of the raw materials highlights an innovative approach to waste reduction and advances sustainable materials science, contributing to the circular economy and sustainable development goals.
1. Introduction
Zeolite-templated carbons (ZTCs) are synthesized using zeolites as templates and therefore inherit the structural regularity of the template zeolites.1 ZTCs, with their ordered microporous structure, excel as adsorbents and electrode materials, offering enhanced adsorption/desorption kinetics2 and high volumetric H2 adsorption capacity.3 Their electrochemical oxidation further boosts performance in capacitors.4,5 While these applications remain in fundamental research, they have clarified the influence of the micropore structure of ZTCs on their key properties. Synthetic methods of ZTCs are mainly divided into one- or two-step carbon filling, and both methods require a graphitization process after carbon filling, followed by zeolite removal.6,7 One-step carbon filling is a simple process but specific surface areas of the resulting ZTCs are at most 3000 m2 g−1 when using NaY zeolite as a template.8 On the other hand, two-step carbon filling is a complicated method in comparison to the one-step one; however, the resulting ZTCs have high structural regularity and high specific surface areas of ∼4000 m2 g−1 in the case of using NaY zeolite.6 High surface area ZTCs have potential as electrode materials and adsorbents owing to their high surface areas and high structural regularity.4,8–14 Carbon filling methods are classified into chemical vapor deposition (CVD) and wet impregnation.7,15,16 By using CVD for one-step carbon filling, it is possible to perform the heat treatment for graphitization immediately afterwards, without removing the sample from the furnace. On the other hand, two-step carbon filling normally comprises wet impregnation and CVD methods. To synthesize ZTCs with a specific surface area of ∼4000 m2 g−1, furfuryl alcohol (FA) is used as a carbon source in the initial carbon filling stage. This process involves the wet impregnation of previously dried NaY zeolite with FA followed by its polymerization to form polyfurfuryl alcohol (PFA) within the zeolite pores.17 In the second carbon filling stage, the obtained zeolite/PFA composite is heated to the requisite temperature for CVD using propylene, which carbonizes the PFA and further deposits carbon within the zeolite pores. However, due to its complicated synthetic processes, this synthesis method exhibits slightly lower reproducibility in terms of the specific surface area and structural regularity of the resulting ZTC.18Previously, we reported a simple synthetic method of high surface area ZTCs from sugar (e.g., glucose, xylose, and sucrose) and propylene as carbon sources using NaY zeolite.19 In the method, the zeolite did not need to be dried and sugar was directly mixed with the undried zeolite. The necessary amount of sugar was only the same volume as the total pore volume of the zeolite (i.e., 0.32 cm3 per gram of NaY zeolite), which significantly reduced the amount of the carbon source in comparison to the methods using FA. The mixture was subjected to propylene CVD and heat treatment for filling carbon into the zeolite pores. Upon heating, the adsorbed water desorbed from the zeolite and sugar was then absorbed into the zeolite pores upon reaching its melting temperature. The absorbed sugar was carbonized into nanographenes in the zeolite nanopores before the CVD, and the nanographenes were extended and interconnected during the CVD. Finally, the heat treatment completed the ZTC structure and the zeolite was removed by HF etching. This method did not require any organic solvent or polymerization process and the resulting ZTCs had high structural regularity and a high specific surface area of ∼3870 m2 g−1.
Very recently, we have reported the synthesis of high surface area ZTC using biomass (e.g., starch and cellulose) and propylene, and the synthesis method was the same as that using sugar.20 The optimized amount of starch was the same volume as the total pore volume of the zeolite, and the mixture of starch and undried NaY zeolite was subjected to propylene CVD and heat treatment. Starch was decomposed into oligosaccharides by the zeolite and the oligosaccharides were absorbed into the zeolite pores below 350 °C. The oligosaccharides were carbonized into nanographenes and the ZTC structure was completed within the zeolite pores by the propylene CVD and heat treatment. The resulting ZTC had high structural regularity and a high specific surface area of 3760 m2 g−1. Meanwhile, cellulose was not readily decomposed into oligosaccharides due to the rigid structure in comparison to starch.21 Some of the undecomposed cellulose remained on the outer surface of zeolite particles, resulting in the formation of amorphous carbons. Therefore, the optimized amount of cellulose was 1.4 times larger than that in the case of using starch for fully filling zeolite pores with oligosaccharides. The cellulose-derived ZTC had high structural regularity but the specific surface area was 3330 m2 g−1 due to the formation of amorphous carbons between the ZTC particles. The amorphous carbons were, however, very small particles in comparison to the particle size of ZTC. By pelletizing the ZTCs using a binder, the volumetric surface areas were 630 and 670 m2 cm−3 for starch- and cellulose-derived ZTCs, respectively, demonstrating no significant difference between them. Porous carbons are voluminous powder and normally compressed before use for practical applications such as adsorbents and electrodes. Therefore, the use of cellulose for preparing ZTCs is environmentally friendly in terms of sustainable development.
Here, we demonstrate the synthesis of highly structurally regular N-doped ZTCs from N-acetylglucosamine (GlcNAc) and chitin as both nitrogen and carbon sources and propylene as a carbon source using NaY zeolite. This method can use undried NaY zeolite, and the mixture of the zeolite with GlcNAc or chitin is subjected to propylene CVD and heat treatment for constructing an N-doped ZTC framework within the zeolite pores. Chitin is a polysaccharide of β-1,4-linked GlcNAc and the second most abundant biopolymer in nature after cellulose.22 Chitin is one of the main components of crustacean shells such as crab and shrimp but most of them are discarded as industrial waste every year around the world.23 We first examine the synthesis of N-doped ZTCs with high structural regularity and high surface area from GlcNAc and propylene. We then try the synthesis of N-doped ZTC from chitin and propylene to substitute chitin for GlcNAc and attempt to elucidate the mechanism of ZTC formation by comparing the results obtained using GlcNAc and chitin. Electron spin resonance (ESR) spectroscopy is used to reveal that chitin is catalytically depolymerized into chitin oligosaccharide radicals by the zeolite. This depolymerized oligomer filling (DOF) mechanism enables the absorption of carbon and nitrogen sources into the zeolite pores, which has a much smaller size than chitin. The resulting GlcNAc- and chitin-derived ZTCs have high structural regularity with specific surface areas of 3740 and 3420 m2 g−1, respectively, and the difference in specific surface area is attributed to the chitin-derived amorphous carbons deposited on the ZTC particles. However, both N-doped ZTCs have the identical volumetric surface area of 740 m2 g−1 and higher volumetric capacitances than undoped ZTC as electric double-layer capacitor (EDLC) electrodes in an organic electrolyte. GlcNAc is mainly produced by hydrolysis of chitin using concentrated acid,24 and therefore utilization of chitin is advantageous to synthesize ZTC in terms of reducing associated environmental pollution and harmful byproducts.
2. Experimental section
2.1 Materials and synthesis
NaY zeolite (HS-320: Na-form, SiO2/Al2O3 molar ratio = 5.5) and chitin were purchased from FUJIFILM Wako Pure Chemical Corp. GlcNAc was purchased from Tokyo Chemical Industry Co., Ltd. Because chitin contained adsorbed water, the amount of adsorbed water was determined by drying chitin at 100 °C for 3 h under vacuum. Meanwhile, GlcNAc contained a negligible amount of adsorbed water and can be ignored for synthesizing ZTC. In the preliminary experiment, ca. 500 mg of NaY zeolite was dried using a 10 mL glass vial at 100 °C for 6 h under vacuum. The mass of the dried zeolite was weighed from the weight difference between the empty vial and the one containing the dried zeolite. The same volume of undried GlcNAc as the total pore volume of NaY zeolite (i.e., 0.324 mL per gram of the zeolite) is defined as 1.0; 0.324 mL of GlcNAc corresponds to 0.50 g calculated from the density (1.54 g cm−3).25 The same mass of dried chitin per gram of zeolite is defined as 1.0 but undried chitin was used for the ZTC synthesis. GlcNAc or chitin was mixed with the dried zeolite and the mixture was placed in a horizontal quartz furnace (inner diameter: 58 mm). N2 was flown to the furnace and the temperature was increased at 10 °C min−1 to 700 °C. Upon reaching 700 °C, propylene (4 vol%) was introduced to the furnace for 2 h and pure N2 was then flown for 30 min to remove propylene from the furnace. Subsequently, the temperature was increased to 900 °C at 5 °C min−1 and the temperature was maintained at 900 °C for 3 h for heat treatment. The flow rates of N2 and N2/propylene gases were kept at 950 mL min−1 throughout the propylene CVD and heat treatment. The zeolite was removed by mixing the resulting NaY/carbon composite and hydrofluoric acid (HF, 46.0%–48.0%, Kanto Chemical Co., Inc.) for 5 h at room temperature. The mass of HF per gram of the NaY/carbon composite was 20 g. The solution was then filtered using a polytetrafluoroethylene (PTFE) membrane filter (pore size: 10 μm, Millipore) and the resulting ZTC was dried at 150 °C for 6 h under vacuum.2.2 Characterization
The following measurements and characterizations were performed according to the same method reported elsewhere:19 X-ray diffraction (XRD) analysis, N2 adsorption/desorption measurement, simultaneous thermogravimetry–differential thermal analysis (TG–DTA), Raman spectroscopy analysis, and transmission electron microscopy (TEM) observation. To avoid overestimating the specific surface area of ZTC, the Brunauer–Emmett–Teller (BET) specific surface area (SBET) was calculated using the adsorption isotherm within a relative pressure (P/P0) range of 0.01 to 0.05.8,26 Meanwhile, to calculate the SBET of NaY zeolite and zeolite-containing samples, a P/P0 range of 0.05 to 0.20 was used. The micropore volume (Vmicro) was calculated based on the Dubinin–Radushkevich method. The total pore volume (Vtotal) was determined from the amount of adsorbed N2 at a P/P0 of 0.96. The mesopore volume (Vmeso) was calculated by subtracting the micropore volume from the total pore volume. The pore size distribution was calculated by the density functional theory (DFT) method based on the carbon slit pore model (−196 °C, N2). A differential scanning calorimeter measurement of GlcNAc was performed on a DSC-60 Plus (Shimadzu) using an aluminum sealing cell at a heating rate of 10 °C min−1 up to 300 °C. X-ray photoelectron spectroscopy (XPS) analysis was done with a KRATOS ESCA-3400 instrument using Mg Kα radiation (1253.6 eV). ZTC was attached on an indium foil, which was previously subjected to Ar etching to remove impurities. Scanning electron microscopy (SEM) imaging was conducted using a JCM-7000 NeoScope (JEOL) at an acceleration voltage of 15 kV. ESR spectra were collected at room temperature using an ESR X-band spectrometer (JES-X330, JEOL Ltd) at a microwave frequency of 9.4 GHz and a microwave power of 1 mW.272.3 Electrochemical measurements
All measurements were performed at 25 °C using a three-electrode aluminum cell. The electrolyte solution was 1 M tetraethylammonium tetrafluoroborate (Et4NBF4; Tomiyama Pure Chemical Industries, Ltd) in propylene carbonate (PC; Tomiyama Pure Chemical Industries, Ltd). A reference electrode was prepared using 1 M Et4NBF4 and 0.1 M AgClO4 (Aldrich) in acetonitrile (FUJIFILM Wako Pure Chemical Corp.). For working electrode preparation, ZTC was mixed with PTFE binder (PTFE 6-J, Du Pont-Mitsui Fluorochemicals Company, Ltd) and carbon black (CB; DENKA BLACK Li, Denka Company Ltd) with a ZTC/PTFE/CB weight ratio of 18![[thin space (1/6-em)]](https://www.rsc.org/images/entities/char_2009.gif) :1:1. The mixture was rolled out and the resulting sheet was punched into a circular sheet with a 11.3 mm diameter (i.e., 1.0 cm2), which contained approximately 5.0 mg of ZTC. A counter electrode was prepared using activated carbon (MSC30, Kansai Coke and Chemicals Co., Ltd) in the same manner as the working electrode preparation. The working and counter electrodes were immersed in the electrolyte solution with a separator (glass microfiber filter, GF/A, Whatman) under vacuum at 25 °C for 24 h. Cyclic voltammetry (CV), impedance analysis, and galvanostatic charge/discharge (GC) measurement were performed on a potentiostat/galvanostat instrument (VMP3, Bio-Logic). CV was conducted at 1 mV s−1 in the potential range from −1.5 to 0.3 V. Subsequently, the Nyquist plots were collected by impedance analysis at −1.0 and 0.2 V with a potential amplitude of 10 mV. Finally, GC was measured in the potential range from −1.5 to 0.3 V at current densities from 2 to 0.05 A g−1. The obtained Nyquist plots were fitted to an equivalent circuit using EC-Lab Z-fit software (Bio-Logic). Gravimetric capacitance (Cg [F gZTC−1], the capacitance per gram of ZTC) was calculated from the following equation:
:1:1. The mixture was rolled out and the resulting sheet was punched into a circular sheet with a 11.3 mm diameter (i.e., 1.0 cm2), which contained approximately 5.0 mg of ZTC. A counter electrode was prepared using activated carbon (MSC30, Kansai Coke and Chemicals Co., Ltd) in the same manner as the working electrode preparation. The working and counter electrodes were immersed in the electrolyte solution with a separator (glass microfiber filter, GF/A, Whatman) under vacuum at 25 °C for 24 h. Cyclic voltammetry (CV), impedance analysis, and galvanostatic charge/discharge (GC) measurement were performed on a potentiostat/galvanostat instrument (VMP3, Bio-Logic). CV was conducted at 1 mV s−1 in the potential range from −1.5 to 0.3 V. Subsequently, the Nyquist plots were collected by impedance analysis at −1.0 and 0.2 V with a potential amplitude of 10 mV. Finally, GC was measured in the potential range from −1.5 to 0.3 V at current densities from 2 to 0.05 A g−1. The obtained Nyquist plots were fitted to an equivalent circuit using EC-Lab Z-fit software (Bio-Logic). Gravimetric capacitance (Cg [F gZTC−1], the capacitance per gram of ZTC) was calculated from the following equation:where Δt is the time from −1.5 to 0.3 V, MZTC is the mass of ZTC in the electrode (i.e., excluding the masses of PTFE and CB) and ΔV is the potential range (i.e., 1.8 V) despite the current densities. Volumetric capacitance (CV [F cmZTC+PTFE+CB−3], the capacitance per cubic centimeter of the electrode containing ZTC, PTFE, and CB) was calculated using the electrode density of ZTC (ρ) and the gravimetric capacitance according to the following equation:
where MPTFE and MCB are the masses of PTFE and CB in the electrode, respectively. Because the weight ratio of ZTC in the electrode was 0.9 (vide supra), MZTC/(MZTC + MPTFE + MCB) corresponds to 0.9. For measuring the electrode density of ZTC, ca. 100 mg of the mixture containing ZTC, PTFE, and CB with a weight ratio of 18
 :1:1 was pressed into a 13 mm disc at 30 MPa for 150 s using a Compact Table-Top Universal/Tensile Tester (EZ-LX, Shimadzu). The thickness and mass were accurately measured using an autocollimator (DIGIMICRO, MF-501, Nikon) and a microbalance, respectively.
3. Results and discussion
3.1 ZTCs prepared using GlcNAc
In a preliminary investigation, we synthesized N-doped ZTCs using dried NaY zeolite and evaluated how varying amounts of GlcNAc influence their structural regularity and specific surface area. Given the structural similarity between chitin and GlcNAc, akin to that between cellulose and glucose, we hypothesized that successful synthesis of ZTCs using GlcNAc could imply the feasibility of using chitin for the same purpose. Previous experiments have demonstrated that both glucose and cellulose can serve as effective precursors for ZTC,19,20 bolstering our hypothesis that chitin could also be a viable precursor for synthesizing N-doped ZTCs. For the purposes of this study, we have established a reference value of 1.0 for the amount of GlcNAc, equating to 0.50 g, used per gram of the dried zeolite, corresponding to its total pore volume (i.e., 0.324 cm3 g−1). The synthesis method is very simple and the mixture of the dried zeolite and GlcNAc was subjected to propylene CVD and heat treatment for graphitization, followed by zeolite removal with HF. The ZTCs synthesized from GlcNAc and propylene are designated as G (X)-P, where X indicates the amount of GlcNAc used and P signifies that the materials were subjected to propylene CVD. Additionally, we prepared another ZTC, designated as G (0.8), by using an amount of GlcNAc equal to 0.8 and following the same temperature program as that used for G (X)-P, but without introducing propylene into the furnace. Fig. 1(a) shows the XRD patterns of the GlcNAc-derived ZTCs. The ZTCs except for G (0.8) showed a distinct peak at 6.4° but did not show a broad peak at ca. 26°. The peak at 6.4° suggests the transcription of the (111) plane from NaY zeolite into the ZTC. Furthermore, the intensity of this peak increases as the structural regularity of the ZTC improves.19,20,28,29 The structural regularity of the GlcNAc-derived ZTCs increased with the GlcNAc amount up to 0.8. Beyond this point, further addition of GlcNAc led to a decrease in structural regularity. Meanwhile, G (0.8) did not show the distinct peak, suggesting that the use of both GlcNAc and propylene is indispensable for replicating the structural regularity of the zeolite. G (0.8) did not have structural regularity and a broad peak at 26° resulted from the structural collapse upon removing the template zeolite due to inadequate carbon filling and the resulting fragile structure.19,20,28,29 Fig. 1(b) and (c) show the N2 adsorption/desorption isotherms and pore size distributions of the GlcNAc-derived ZTCs, respectively. All the ZTCs adsorbed N2 below a P/P0 of 0.05 due to the existence of micropores. Meanwhile, G (1.2)-P and G (1.4)-P showed a hysteresis in their isotherms. The BET specific surface areas and pore volumes of the ZTCs are summarized in Table 1. The BET specific surface areas and the structural regularity of the ZTCs were maximized by using a GlcNAc amount of 0.8 and the BET specific surface area of G (0.8)-P was as high as 3770 m2 g−1. The pore size distributions of the ZTCs except for G (0.8) showed a distinct peak at 1.2 nm (Fig. 1(c)). The peak intensity of G (0.8) was much lower than those of the other ZTCs due to the inadequate carbon filling into the zeolite pores and the absence of structural regularity. The distinct peak in the pore size distribution suggests that the ZTCs inherited the structural regularity of the template zeolite, resulting in a uniform pore size of 1.2 nm.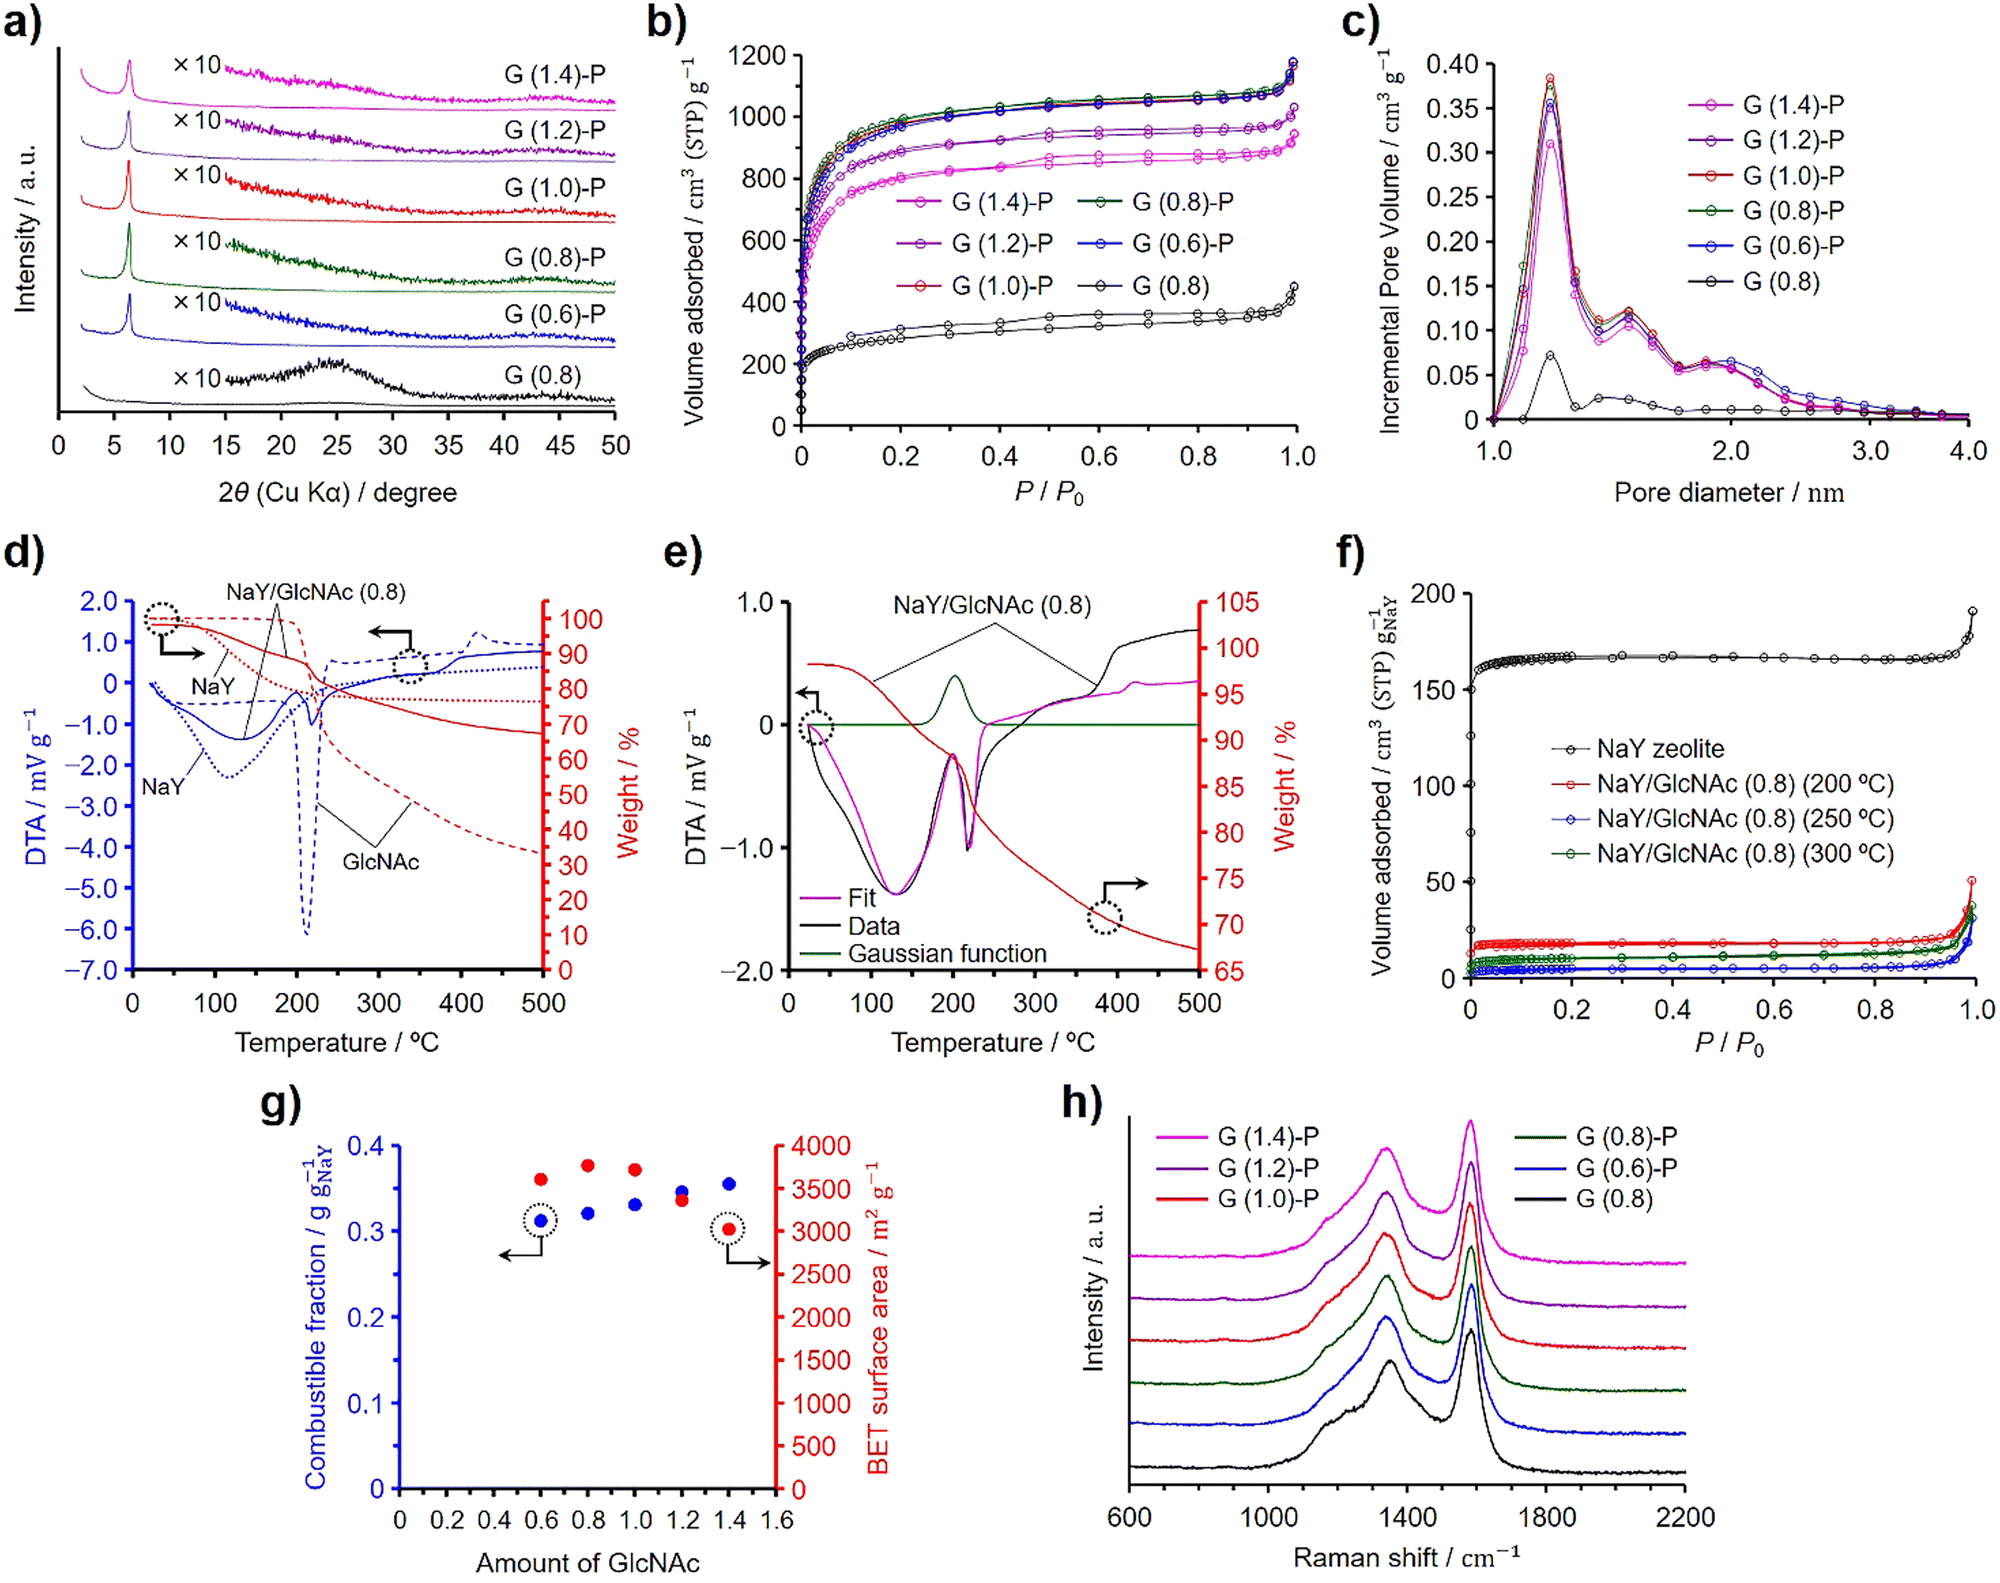 | ||
| Fig. 1 Results of the structural characterization and analyses: (a) XRD patterns, (b) N2 adsorption/desorption isotherms, and (c) pore size distributions for the GlcNAc-derived ZTCs. (d) TG–DTA patterns of NaY zeolite, GlcNAc, and NaY/GlcNAc (0.8). (e) TG and fitting DTA results of NaY/GlcNAc (0.8). (f) N2 adsorption/desorption isotherms of NaY zeolite and NaY/GlcNAc (0.8) heated at 200, 250, and 300 °C. The amount of adsorbed N2 was normalized per gram of the zeolite. (g) Dependences of the BET specific surface areas of the GlcNAc-derived ZTCs and the combustible fractions of the zeolite/carbon composites prepared using GlcNAc on the GlcNAc amount. (h) Raman spectra of the GlcNAc-derived ZTCs. | ||
| Samples | SBETa (m2 g−1) | Vtotalb (cm3 g−1) | Vmicroc (cm3 g−1) | Vmesod (cm3 g−1) | Combustible fraction (g gNaY−1) |
|---|---|---|---|---|---|
| a BET specific surface area.b Total pore volume.c Micropore volume calculated by the DR method.d Mesopore volume calculated from the difference between Vtotal and Vmicro. | |||||
| G (0.6)-P | 3610 | 1.67 | 1.50 | 0.17 | 0.312 |
| G (0.8)-P | 3770 | 1.69 | 1.58 | 0.11 | 0.321 |
| G (1.0)-P | 3720 | 1.67 | 1.56 | 0.11 | 0.331 |
| G (1.2)-P | 3360 | 1.50 | 1.41 | 0.10 | 0.346 |
| G (1.4)-P | 3030 | 1.37 | 1.26 | 0.11 | 0.355 |
| G (0.8) | 1040 | 0.57 | 0.42 | 0.15 | 0.167 |
The combustible fractions in the zeolite/carbon composites (i.e., before HF etching) were measured by TG analysis and the results are shown in Table 1. The combustible fraction increased with increasing GlcNAc amount and showed a different tendency from that of the BET specific surface areas and structural regularity of the ZTCs. We then collected TG–DTA spectra on the zeolite, GlcNAc, and a zeolite–GlcNAc mixture using 0.8 of GlcNAc, referred to as NaY/GlcNAc (0.8) (Fig. 1(d)). The samples were heated under a N2 flow at 10 °C min−1, which was the same heating rate as that used in the ZTC synthesis. When heated, the TG and DTA spectra of the zeolite showed a decrease in weight and an endothermic peak, respectively, due to the desorption of adsorbed water. Meanwhile, GlcNAc exhibited a distinct DTA peak and weight loss around 210 °C, attributed to its fusion and subsequent decomposition, which were separately confirmed by differential scanning calorimetry (Fig. S1, ESI†). In contrast, the DTA spectrum of NaY/GlcNAc (0.8) could not be accounted for solely by the individual results of GlcNAc and the zeolite (Fig. S2, ESI†). This likely results from the exothermic absorption of GlcNAc by the zeolite, with the associated enthalpy change explained by adsorption and immersion enthalpies. Given that the external surface area of the zeolite is significantly smaller than its micropore-based internal surface area, the immersion enthalpy is negligibly small compared to the adsorption enthalpy. Therefore, we used a Gaussian function to replicate the adsorption peak and performed peak fitting using this function combined with the DTA spectra of GlcNAc and the zeolite, as shown in Fig. 1(e). The fitted spectrum was in good agreement with the DTA spectrum of the mixture up to 230 °C. The Gaussian function suggests that the absorption of GlcNAc into the zeolite completed at ca. 220 °C, which is below the decomposition temperature of GlcNAc (Fig. S1, ESI†). The reason for the deviation of the fitted spectrum from the DTA spectrum of NaY/GlcNAc (0.8) above 230 °C is explained by the different reaction environment between absorbed and bulk GlcNAc; the former one decomposed in the zeolite pores. To confirm the absorption of GlcNAc into the zeolite, NaY/GlcNAc (0.8) was heated at 10 °C min−1 under N2 to 200, 250, and 300 °C, and cooled to room temperature on reaching the target temperatures. The N2 adsorption/desorption isotherms of the zeolite and the resulting mixtures are shown in Fig. 1(f), where the amounts of adsorbed N2 are normalized per gram of the zeolite. NaY zeolite showed a type I isotherm, typical of microporous materials. If GlcNAc was not absorbed into the zeolite, the normalized isotherms would not differ from the result of the zeolite because the specific surface area of GlcNAc is negligible in comparison to that of the zeolite. However, the heated NaY/GlcNAc (0.8) samples showed much lower normalized amounts of adsorbed N2 than the zeolite. The BET specific surface areas and total pore volumes of the heated mixtures are summarized in Table 2, along with their normalized values. The mixture heated at 250 °C showed the lowest normalized BET specific surface area and total pore volume among the mixtures. These results are in good agreement with the Gaussian function in Fig. 1(e). The absorption of GlcNAc into the zeolite proceeded synergistically with the onset of GlcNAc melting, starting around 200 °C and completing by 250 °C. Below 300 °C, some of the absorbed GlcNAc decomposed within the zeolite pores, leading to an increase in the normalized surface area and pore volume for the mixture heated at 300 °C compared to that heated at 250 °C.
Fig. 1(g) presents the BET specific surface areas of the ZTCs derived from GlcNAc and propylene, as well as the combustible fractions of the zeolite/carbon composites. The combustible fractions linearly increased with increasing GlcNAc amount. Since both the structural regularity and BET specific surface area were maximized at a GlcNAc amount of 0.8, the zeolite pores were fully filled with carbon and nitrogen by using a GlcNAc amount of 0.8 without deposits on the outer surfaces of the zeolite particles. An increase in the combustible fraction for the composites prepared using the GlcNAc amounts more than 0.8 is attributed to the formation of GlcNAc-derived amorphous carbons on the outer surfaces of the zeolite particles (vide infra). A Raman spectroscopy analysis provides information on the microstructure for carbon-based materials and can confirm the existence of nanographenes.30 Graphite and graphene exhibit a distinct G band at 1580 cm−1 in their Raman spectra, while the introduction of defects leads to the appearance of a D band at 1350 cm−1.31–33 The Raman spectra of the GlcNAc-derived ZTCs are shown in Fig. 1(h). All the ZTCs showed the same intensity ratios of D and G bands regardless of the GlcNAc amount and the absence of propylene CVD. Because the existence of the G band evidences the formation of graphene sheets, the G band in the Raman spectrum of G (0.8) indicates that GlcNAc was converted to nanographenes in the zeolite pores. For the synthesis of GlcNAc-derived ZTCs using propylene CVD, GlcNAc was absorbed into the zeolite pores below 250 °C and the absorbed GlcNAc was decomposed into N-containing nanographenes. The nanographenes were extended and interconnected during the propylene CVD, and the subsequent heat treatment for graphitization completed the N-doped ZTC structure. Due to the spatial confinement of the zeolite's micropores, the ZTC framework is composed of single-layer graphene with a width of about 1 nm, resulting in numerous edge sites.1,30,34 Consequently, the Raman spectrum of ZTC does not exhibit a 2D band around 2650 cm−1, as observed in graphene.32 This is the same formation mechanism as the ZTC synthesis using sugars and propylene. Glucose, sucrose, and xylose can be used as precursors for ZTC in combination with propylene CVD. These sugars were readily absorbed into NaY zeolite on reaching their melting temperatures and the absorbed sugars were decomposed into nanographenes inside the zeolite pores. Neither sugars alone nor propylene CVD in isolation could form the three-dimensional ZTC structure; a combination of sugar utilization and propylene CVD was essential for the completion of the ZTC framework.19 The distinction in synthesis between using sugars and GlcNAc is attributed to their molecular structures and the presence of nitrogen in GlcNAc. The decrease in the structural regularity and the formation of mesopores became pronounced when excess amounts of GlcNAc ranging from 2.0 to 4.0 were used (Fig. S3, ESI†). An excess amount of GlcNAc was not absorbed into the zeolite pores but melted and decomposed covering the zeolite particles (Fig. S4, ESI†). Consequently, GlcNAc-derived amorphous carbon shells were formed on the outer surface of the zeolite particles, leading to the formation of mesopores (Fig. 1(b) and Fig. S3b, ESI†). The amorphous carbon shells disturbed the diffusion of propylene into the zeolite pores during the CVD. Therefore, the GlcNAc amount of 0.8 is appropriate for filling the zeolite pores and balancing the high structural regularity and high specific surface area. The GlcNAc amount of 0.8 is the optimized value but this value is smaller than the total pore volume of the zeolite. However, the normalized BET specific surface area of NaY/GlcNAc (0.8) heated at 250 °C was only 17 m2 g−1 (Table 2), supporting that the zeolite pores were almost filled with GlcNAc. Probably, because GlcNAc has an acetyl group as a side chain, the molecular packing in the micropores of the zeolite was different from that in the bulk.
3.2 ZTCs prepared using chitin
Chitin was used instead of GlcNAc as the nitrogen and carbon sources to synthesize N-doped ZTCs, employing the same synthesis method as that used with GlcNAc, including propylene CVD. Unlike GlcNAc, chitin contains adsorbed water (vide infra). To quantify this, chitin was dried at 100 °C for 3 h under vacuum in preliminary experiments to measure its water content. Subsequently, considering the measured water content, undried chitin was mixed with pre-dried and weighed NaY zeolite. The chitin quantity containing the same molar amount of GlcNAc units as a reference GlcNAc amount of 1.0 per gram of the dried zeolite (i.e., 0.50 g) was set to 1.0. The ZTCs synthesized using chitin are denoted as C (X)-P, where X represents the amount of chitin used. Furthermore, we synthesized C (1.0) using the same amount of chitin, set at 1.0, under the identical synthesis conditions applied to C (1.0)-P, except for the omission of propylene. Fig. 2 presents the characterization results for chitin-derived ZTCs. The XRD patterns revealed that the structural regularity of the ZTCs increased with the chitin amount up to a value of 1.0, but beyond this point, it diminished (Fig. 2(a)). This suggests that an optimal structural regularity was achieved with a chitin amount of 1.0. The N2 adsorption/desorption isotherms of the chitin-derived ZTCs are categorized as type I and the amount of adsorbed N2 decreased with the chitin amount (Fig. 2(b)). By comparing the adsorption isotherms of C (0.6)-P, C (0.8)-P, and C (1.0)-P, the amounts of adsorbed N2 at a P/P0 of 0.1 were almost the same, but the amount of adsorbed N2 between P/P0 values of 0.1 and 1.0 decreased with the chitin amount, suggesting that the mesopore volume decreased with the chitin amount from 0.6 to 1.0. The BET specific surface areas and pore volumes of the chitin-derived ZTCs are summarized in Table 3. The BET specific surface areas of the chitin-derived ZTCs decreased slightly with an increase in chitin amount up to 1.0, but showed a marked decrease with further increases. The pore size distributions of the chitin-derived ZTCs showed a distinct peak at 1.2 nm and the peak intensity had a correlation with the BET specific surface areas (Fig. 2(c)). From these results, it was found that high structural regularity and high surface area can be achieved simultaneously with a chitin amount of 1.0. The combustible fractions of the zeolite/carbon composites prepared from chitin and propylene are summarized in Table 3. As shown in the table, the combustible fractions increased with the chitin amount but were larger than those of the zeolite/carbon composites prepared from GlcNAc and propylene (Table 1).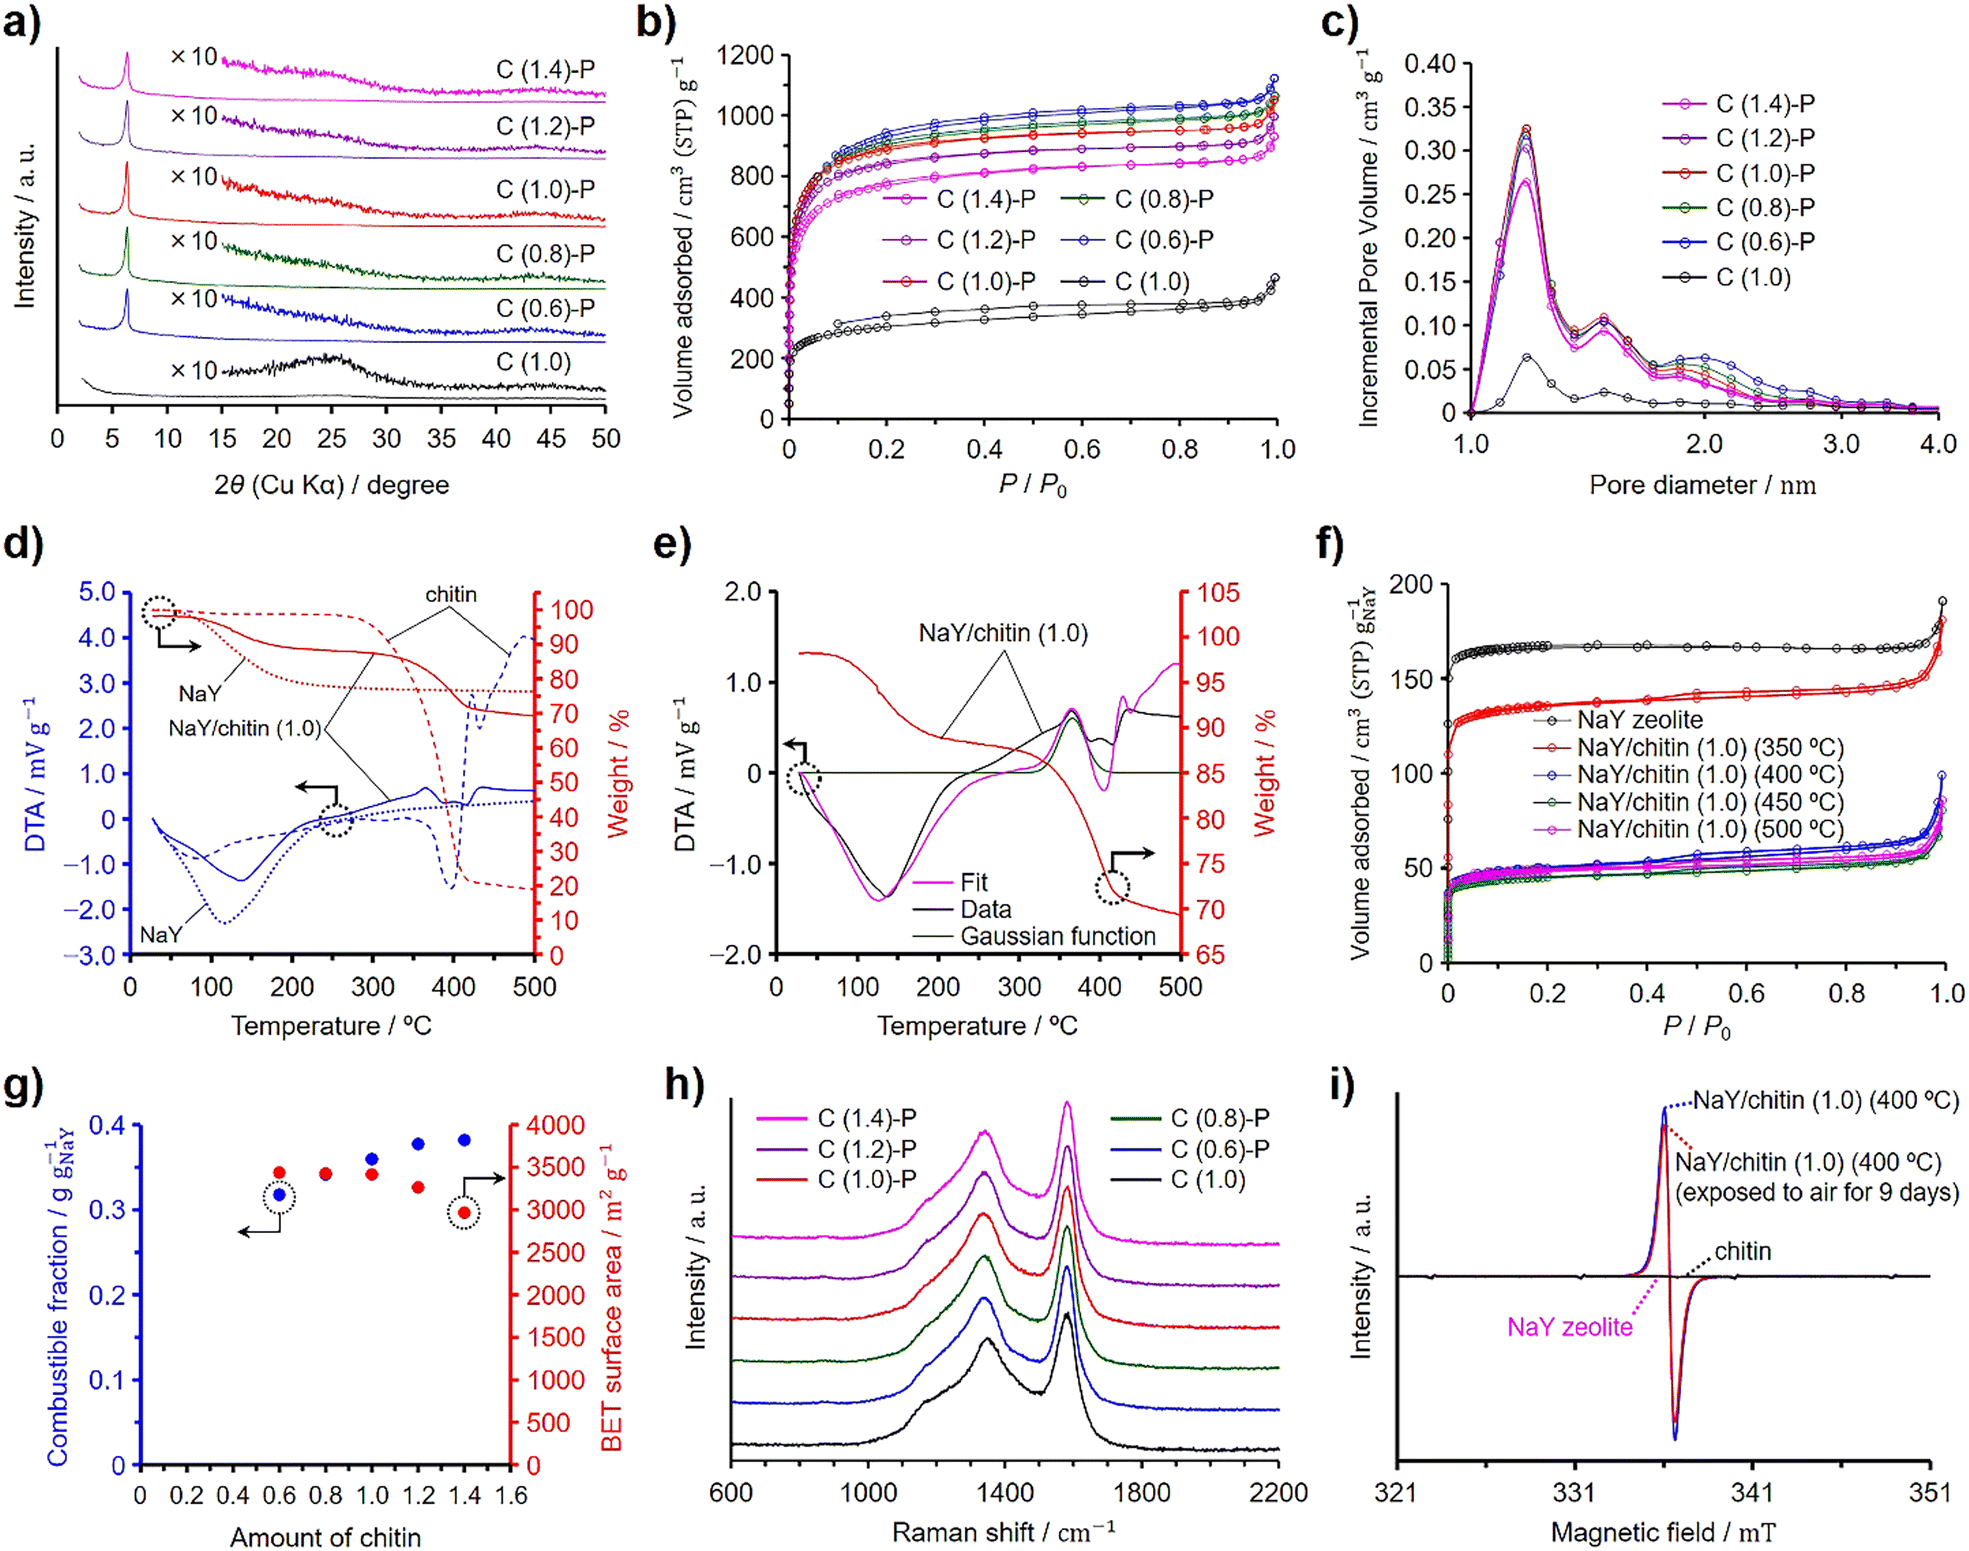 | ||
| Fig. 2 Results of the structural characterization and analyses: (a) XRD patterns, (b) N2 adsorption/desorption isotherms, and (c) pore size distributions for the chitin-derived ZTCs. (d) TG–DTA patterns of NaY zeolite, chitin, and NaY/chitin (1.0). (e) TG and fitting DTA results of NaY/chitin (1.0). (f) N2 adsorption/desorption isotherms of NaY/chitin (1.0) heated at 350, 400, 450, and 500 °C, shown along with the results of the zeolite. The amount of adsorbed N2 was normalized per gram of the zeolite. (g) Dependences of the BET specific surface areas of the chitin-derived ZTCs and the combustible fractions of the zeolite/carbon composites prepared using chitin on the chitin amount. (h) Raman spectra of the chitin-derived ZTCs. (i) ESR spectra of NaY zeolite, chitin, and NaY/chitin (1.0) heated at 400 °C. | ||
| Samples | SBETa (m2 g−1) | Vtotalb (cm3 g−1) | Vmicroc (cm3 g−1) | Vmesod (cm3 g−1) | Combustible fraction (g gNaY−1) |
|---|---|---|---|---|---|
| a BET specific surface area.b Total pore volume.c Micropore volume calculated by the DR method.d Mesopore volume calculated from the difference between Vtotal and Vmicro. | |||||
| C (0.6)-P | 3440 | 1.63 | 1.42 | 0.21 | 0.318 |
| C (0.8)-P | 3430 | 1.56 | 1.43 | 0.13 | 0.341 |
| C (1.0)-P | 3420 | 1.50 | 1.42 | 0.08 | 0.360 |
| C (1.2)-P | 3260 | 1.42 | 1.36 | 0.07 | 0.377 |
| C (1.4)-P | 2970 | 1.34 | 1.23 | 0.11 | 0.382 |
| C (0.8) | 130 | 0.60 | 0.45 | 0.15 | 0.196 |
Fig. 2(d) shows the TG–DTA patterns of chitin, NaY zeolite, and the mixture of chitin and the zeolite with a chitin amount of 1.0, denoted as NaY/chitin (1.0). The TG–DTA patterns of chitin showed a slight decrease in weight with a broad endothermic peak at ca. 80 °C, indicating the desorption of adsorbed water. Chitin showed a decrease in weight without a significant endothermic peak when the temperature exceeded approximately 280 °C, and further increases in temperature led to a substantial weight loss below 400 °C, suggesting that chitin decomposed without fusion (vide infra).35 The decomposition temperature of chitin was higher than that of GlcNAc due to the rigid structure of chitin. The DTA pattern of NaY/chitin (1.0) could not simply be explained by a mere superposition of the DTA patterns of chitin and the zeolite (Fig. S2, ESI†), a phenomenon also observed in the DTA pattern of NaY/GlcNAc (0.8), because the zeolite depolymerized chitin into chitin oligosaccharides, which were then absorbed into the zeolite pores (vide infra). Similar to NaY/GlcNAc (0.8) depicted in Fig. 1(e), a Gaussian function was employed to simulate the exothermic peak resulting from the absorption of chitin oligosaccharides by the zeolite. Peak fitting was then conducted using this Gaussian function along with the DTA patterns of both the zeolite and chitin (Fig. 2(e)). Although the fitted curve deviated slightly from the experimental data, it provided a closer approximation to the experimental results than a simple summation of the DTA patterns of the zeolite and chitin (Fig. S2, ESI†). The Gaussian function in Fig. 2(e) suggests that the absorption of chitin oligosaccharides completed below 450 °C. To verify the depolymerization of chitin and the subsequent absorption of the resulting chitin oligosaccharides into the zeolite (i.e., depolymerized oligomer filling, DOF), NaY/chitin (1.0) was heated at 10 °C min−1 under a N2 atmosphere up to target temperatures ranging from 350 to 500 °C. Upon reaching the designated temperature, the heated NaY/chitin (1.0) was immediately cooled to room temperature and then subjected to N2 adsorption/desorption analysis. Fig. 2(f) shows the results of the N2 adsorption/desorption measurement, plotted as normalized values per gram of the zeolite. The amount of adsorbed N2 was significantly decreased when the mixture was heated above 350 °C and reached its minimum at 450 °C. Table 4 summarizes the BET specific surface areas and total pore volumes of the heated NaY/chitin (1.0), including their normalized values. Among the mixtures, the one heated at 450 °C exhibited the lowest normalized BET specific surface area and total pore volume. Probably, DOF began to occur above 350 °C and was completed by 450 °C, as suggested by the results in Fig. 2(e). However, all the mixtures exhibited a hysteresis and adsorbed a larger amount of N2 than NaY/GlcNAc (0.8) heated at 200–300 °C, because excess chitin was decomposed into amorphous porous carbon without fusion when heated under a N2 atmosphere.35 This was confirmed by heating chitin under a N2 atmosphere without the zeolite and propylene using the same temperature program applied to the ZTC synthesis (Fig. S5, ESI†). The resulting heated chitin contained micropores and mesopores, whereas NaY zeolite does not contain mesopores. Therefore, the hysteresis observed in the heated NaY/chitin (1.0) is attributed to the decomposed chitin outside the zeolite pores. Under the same conditions, GlcNAc first melted and then underwent carbonization into nonporous amorphous carbons (Fig. S4b and S5, ESI†). On the other hand, ZTCs synthesized with propylene and excess chitin, namely C (1.2)-P and C (1.4)-P, exhibited no distinct hysteresis, in contrast to those derived from GlcNAc (Fig. 2(b)). Furthermore, the ZTCs synthesized with propylene and excess chitin in the range from 2.0 to 4.0 exhibited a negligibly small hysteresis (Fig. S6, ESI†), compared to the ZTCs prepared with propylene and an excess of GlcNAc between 2.0 and 4.0 (Fig. S3, ESI†). The absence of hysteresis is attributed to the deposition of carbon within the micropores and mesopores of the chitin-derived porous carbons during the propylene CVD process. This assertion was confirmed by applying propylene CVD to chitin, without using zeolite, under the identical conditions employed for the ZTC synthesis (Fig. S5, ESI†). Unlike the synthesis of GlcNAc-derived ZTCs, excess chitin did not melt (Fig. S7, ESI†) but did consume propylene. Consequently, an inadequate supply of propylene led to a decrease in both the structural regularity and the BET specific surface area of the chitin-derived ZTCs when the chitin amount exceeded 1.0. To optimize the structural regularity and BET specific surface area of GlcNAc-derived ZTCs, the optimal amount of GlcNAc was found to be 0.8. This finding implies that a chitin amount of 0.8, possessing the same molecular units as the GlcNAc amount used in the synthesis of G (0.8)-P, was anticipated to optimize the structural regularity and BET specific surface area. However, in the case of C (1.0)-P, it was found that 20% of the chitin, hindered by its rigid structure, could not be converted into chitin oligosaccharides and instead formed nonporous amorphous carbons, accumulating between the ZTC particles (vide infra). On the other hand, the remaining 80% of the chitin was successfully converted into chitin oligosaccharides, which were then absorbed into the zeolite pores. As a result, C (1.0)-P achieved structural regularity comparable to that of G (0.8)-P but exhibited a lower surface area.
| Samples | SBET (m2 g−1) | Vtotal (cm3 g−1) | SBETa (g gNaY−1) | Vtotala (g gNaY−1) |
|---|---|---|---|---|
| a Normalized value per gram of NaY zeolite. | ||||
| NaY/chitin (1.0) (350 °C) | 335 | 0.170 | 461 | 0.234 |
| NaY/chitin (1.0) (400 °C) | 141 | 0.086 | 172 | 0.105 |
| NaY/chitin (1.0) (450 °C) | 135 | 0.077 | 155 | 0.088 |
| NaY/chitin (1.0) (500 °C) | 140 | 0.079 | 166 | 0.093 |
Fig. 2(g) summarizes the combustible fractions of the zeolite/carbon composites and the BET specific surface areas of the ZTCs prepared from chitin and propylene. The combustible fractions increased with the chitin amount and were larger than those of the composites prepared using GlcNAc (Fig. 1(g)). This explains why C (1.0)-P had a lower BET specific surface area than G (0.8)-P, despite having the same level of structural regularity. The BET specific surface areas decreased with the chitin amount due to the increasing presence of nonporous amorphous carbons. The Raman spectra of the chitin-derived ZTCs are presented in Fig. 2(h). All the spectra showed the same intensity ratios of the G and D bands, regardless of the chitin amount and the absence of propylene CVD. The formation of the chitin-derived ZTCs is explained by the DOF mechanism. The absorbed chitin oligosaccharides were decomposed into N-containing nanographenes and the nanographenes were interconnected together by the propylene CVD. To validate the formation of chitin oligosaccharides, we further analyzed the NaY/chitin (1.0) heated at 400 °C by ESR spectroscopy. As shown in Fig. 2(i), the ESR spectra of the zeolite and chitin did not show a peak derived from radicals, while the heated NaY/chitin (1.0) showed a distinct peak in the spectrum, suggesting that chitin was depolymerized into oligosaccharides by homolysis. If chitin was depolymerized into chitin oligosaccharide radicals by homolysis, some of the radicals would be quenched by O2 under an air atmosphere. Therefore, the heated NaY/chitin (1.0) was exposed to air for 9 days and analyzed again. As a result, a decrease in the peak intensity was observed in the spectra. The presence of the residual peak indicates that chitin oligosaccharide radicals were located within the zeolite micropores. In micropores filled with chitin oligosaccharides, diffusion of O2 was hindered, making it difficult for O2 to react with these radicals.
3.3 XPS and electron microscopy observations of N-doped ZTCs
We analyzed G (0.8)-P and C (1.0)-P that had the highest structural regularity among the GlcNAc- and chitin-derived ZTCs, respectively, by XPS to determine the type of the doped nitrogen. XPS analysis provides surface information about materials,36 with surface carbon and nitrogen atoms detected at approximately 285 and 400 eV, respectively, in the spectra.37,38 Fig. 3 shows the N 1s spectra of G (0.8)-P and C (1.0)-P collected by the XPS analysis. The N 1s spectra were deconvoluted into four components (Table 5): pyridine (N-6, 398.4 eV), pyridone/pyrrole (N-5, 400.0 eV), quaternary (N-Q, 401.0 eV), and oxidized nitrogens (N-X, 403.5 eV).39,40 The amounts of quaternary nitrogen in G (0.8)-P and C (1.0)-P were higher than those of the other nitrogen forms, at 37% and 39%, respectively. Because quaternary nitrogen increases the electrical conductivity of carbon-based materials,23,41,42 these ZTCs are expected to show high area-normalized capacitance (i.e., capacitance per unit specific surface area) and high capacitance retention at high current densities. Meanwhile, although pseudocapacitance associated with pyridone/pyrrole and pyridine nitrogens tends to decrease at high current densities, these materials are still expected to exhibit characteristic pseudocapacitive behaviors.43 This is because the total contents of pyridone/pyrrole and pyridine nitrogens were greater than those of quaternary nitrogen in these ZTCs. The elemental compositions of G (0.8)-P and C (1.0)-P were further determined by conventional elemental analysis (Table 5) and the N/C atomic ratios of G (0.8)-P and C (1.0)-P were 0.016 and 0.021, respectively. Meanwhile, the N/C atomic ratios of G (0.8)-P and C (1.0)-P, determined by XPS analysis, were 0.016 and 0.022, respectively. Although XPS analysis provides surface information of materials, the N/C ratios determined by XPS analysis aligned with those determined by conventional elemental analysis. The marginally higher nitrogen content in C (1.0)-P, relative to G (0.8)-P, is attributed to the accumulation of chitin-derived amorphous carbons between the ZTC particles.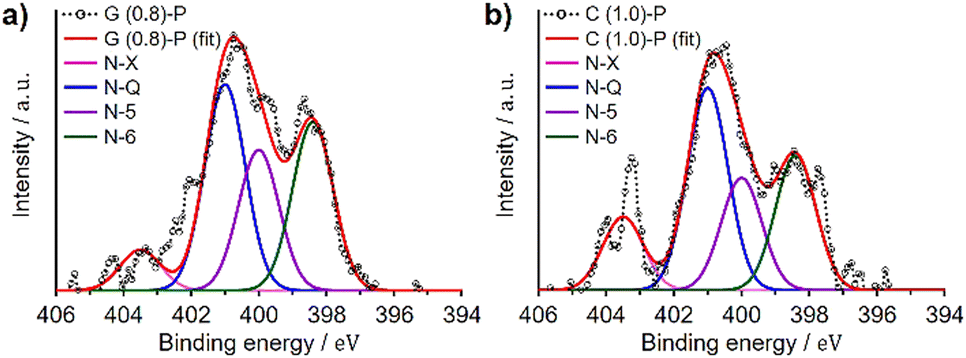 | ||
| Fig. 3 N 1s spectra of (a) G (0.8)-P and (b) C (1.0)-P. | ||
| Sample | Elemental analysis (wt%) | N-6 (%) | N-5 (%) | N-Q (%) | N-X (%) | |||
|---|---|---|---|---|---|---|---|---|
| C | H | N | Oa | 398.4b eV | 400.0b eV | 401.0b eV | 403.5b eV | |
| a Calculated as the remainder.b The bandwidth (full-width at half-maximum, FWHM) of each peak was 1.41 eV. | ||||||||
| G (0.8)-P | 88.2 | 1.5 | 1.7 | 8.6 | 30.3 | 25.3 | 37.1 | 7.3 |
| C (1.0)-P | 88.7 | 1.5 | 2.2 | 7.6 | 25.8 | 21.5 | 38.7 | 14.1 |
G (0.8)-P and C (1.0)-P showed the highest structural regularity among the ZTCs prepared using GlcNAc and chitin, respectively, and were observed by SEM and TEM to confirm their structural morphology. As shown in the SEM images of G (0.8)-P (Fig. 4(a)), ZTC particles were agglomerated into secondary particles and no particles other than ZTC particles were observed. TEM observation of G (0.8)-P did not confirm carbon shells on the outer surfaces of the ZTC particles (Fig. 4(b)). On the other hand, a large particle different from ZTC particles was observed in the SEM images of C (1.0)-P (Fig. 4(c)), which had the same morphology as the chitin heat-treated with and without propylene CVD using the same temperature program as that used for the ZTC synthesis (Fig. S7, ESI†), indicating that the large particle in Fig. 4(c) was chitin-derived amorphous carbon formed without fusion.35 However, no carbon shells were observed on the outer surfaces of the ZTC particles during TEM observation because excess chitin was converted into amorphous carbons without fusion (Fig. 4(d)). Unlike graphitized carbons, amorphous carbons are not sensitive to the XRD and Raman spectroscopy analyses in comparison to ZTC particles and cannot be readily detected when existing with ZTC particles (Fig. 1(a), (h) and 2(a), (h)).20 Amorphous carbons can be confirmed by XRD analysis as carbon (002) diffraction only when ZTC contains a large amount of amorphous carbons (Fig. S3a and S6a, ESI†).44
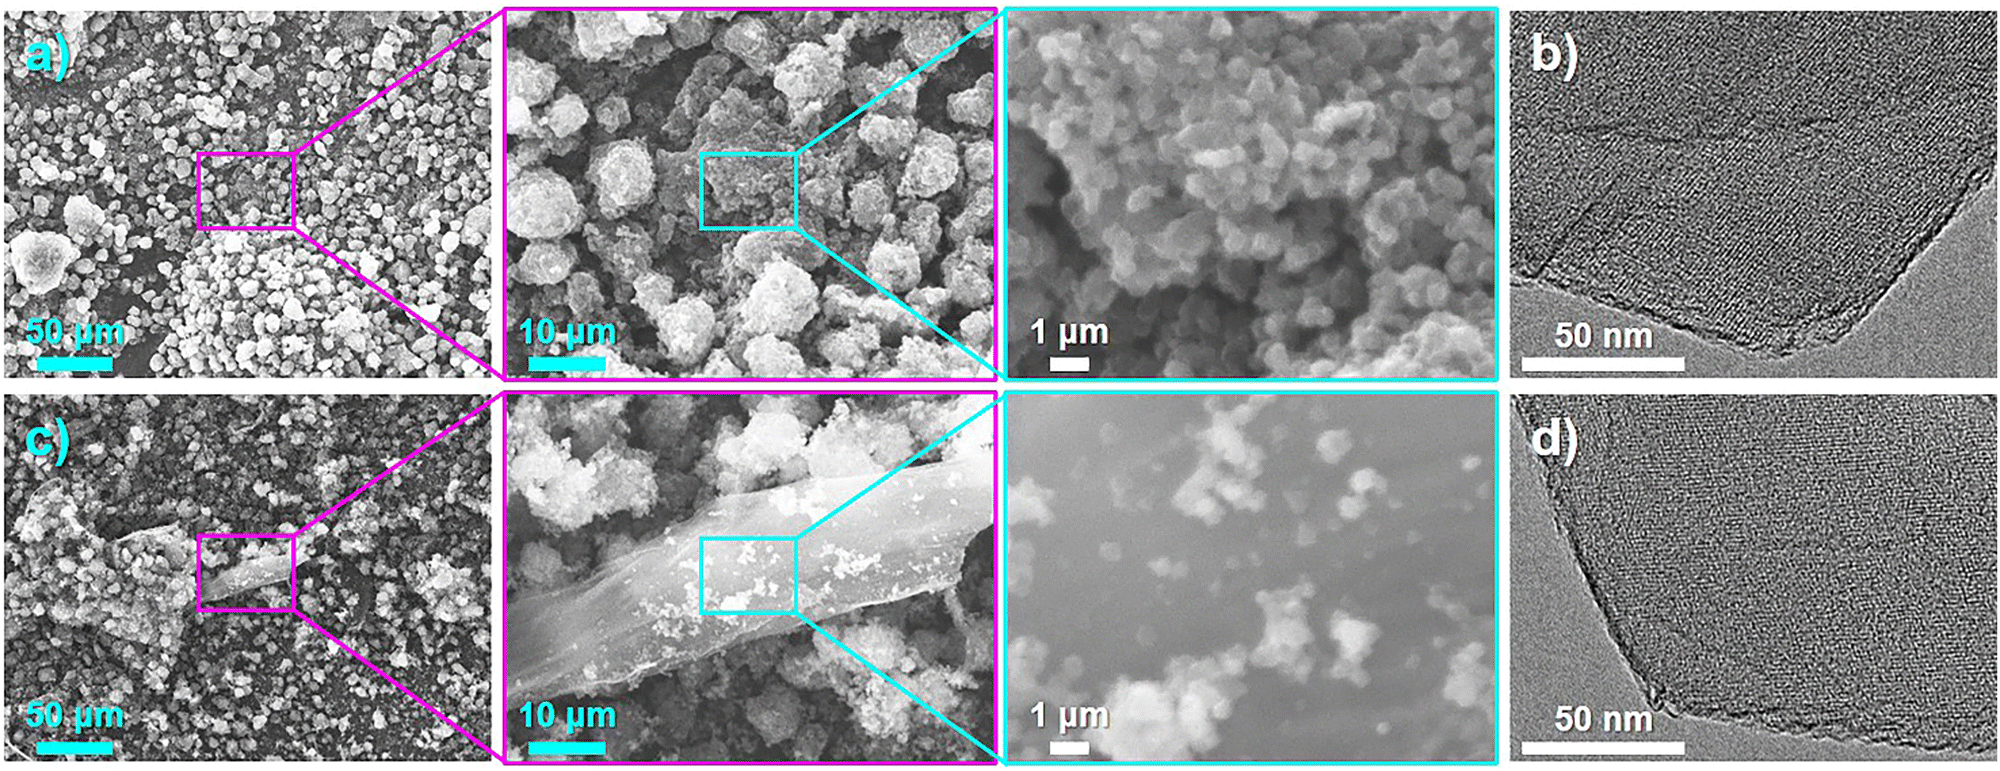 | ||
| Fig. 4 (a) and (c) SEM and (b) and (d) TEM images of (a) and (b) G (0.8)-P and (c) and (d) C (1.0)-P. | ||
3.4 Synthesis of G (0.8)-P and C (1.0)-P without drying NaY zeolite and structural characterization of G (0.8)-P, C (1.0)-P, and their derived electrodes
G (0.8)-P and C (1.0)-P showed the highest structural regularity among the GlcNAc- and chitin-derived ZTCs, respectively. In the preliminary experiments, the zeolite was previously dried to calculate the mass of the dried zeolite and the amounts of adsorbed water in the zeolite and chitin were determined to be 19.8 wt% and 6.6 wt%, respectively. Considering the amounts of the adsorbed water in the zeolite and chitin, G (0.8)-P and C (1.0)-P were synthesized without a drying process and their BET specific surface areas and pore volumes are summarized in Table 6. By comparing with the BET specific surface areas and pore volumes of G (0.8)-P and C (1.0)-P prepared using the dried zeolite (Tables 1 and 3), it is obvious that the drying process can be omitted for the ZTC synthesis using GlcNAc and chitin. Normally, porous carbons are used in compressed forms such as pellet or granular forms, and volumetric values (e.g., surface area and pore volume) are practically more important than gravimetric ones. Therefore, the densities of the electrodes prepared using G (0.8)-P and C (1.0)-P were determined to compare their volumetric surface areas. The electrodes were prepared by mixing ZTC with carbon black and a binder (i.e., polytetrafluoroethylene, PTFE) and used to measure their performance as electric double-layer capacitor electrodes (vide infra). Table 7 summarizes the results of the N2 adsorption/desorption and density measurements of the electrodes for G (0.8)-P and C (1.0)-P prepared using the undried zeolite. Because the weight ratio of ZTC in the electrode was 0.9 (for details, see the Experimental section), the BET specific surface areas of the electrodes per gram of ZTC (i.e., excluding the masses of carbon black and the binder) were 3550 and 3290 m2 g−1 for G (0.8)-P and C (1.0)-P, respectively. The observed decrease in BET specific surface area per gram of ZTC in the electrodes is attributed to the partial structural collapse of ZTC due to its mechanical mixing with carbon black and PTFE. The electrode density of C (1.0)-P is higher than that of G (0.8)-P because the amount of amorphous carbons in C (1.0)-P was not so significant to expand the average space between ZTC particles (Fig. 4(c)). Consequently, the volumetric surface area and micropore volume of C (1.0)-P, calculated based on its density, were 740 m2 cm−3 and 0.31 cm3 cm−3, respectively, and were almost the same as those of G (0.8)-P, whereas the BET specific surface area of C (1.0)-P was lower than that of G (0.8)-P (Table 6).| Samples | SBET (m2 g−1) | Vtotal (cm3 g−1) | Vmicro (cm3 g−1) | Vmeso (cm3 g−1) |
|---|---|---|---|---|
| G (0.8)-P | 3740 | 1.64 | 1.58 | 0.06 |
| C (1.0)-P | 3420 | 1.54 | 1.43 | 0.11 |
| Samples | SBET (m2 g−1) | Vtotal (cm3 g−1) | Vmicro (cm3 g−1) | Vmeso (cm3 g−1) | Density (g cm−3) |
|---|---|---|---|---|---|
| a Electrodes contain 5 wt% of PTFE and 5 wt% of carbon black. | |||||
| G (0.8)-P | 3200 | 1.51 | 1.32 | 0.19 | 0.232 |
| C (1.0)-P | 2960 | 1.35 | 1.23 | 0.12 | 0.251 |
3.5 EDLC performance of G (0.8)-P and C (1.0)-P
The EDLC performance of G (0.8)-P and C (1.0)-P was evaluated using a three-electrode cell in 1 M Et4NBF4/PC at 25 °C. For comparison, the undoped ZTC was prepared from FA and propylene according to the original synthetic method using NaY zeolite,8,9 and its EDLC performance was evaluated under the same conditions. Note that the elemental composition of the undoped ZTC, as determined by the conventional elemental analysis, was previously found to be 90.3%, 1.9%, and 7.8% for carbon, hydrogen, and oxygen, respectively.13 The BET specific surface area of the undoped ZTC was 3700 m2 g−1 and the total and micropore volumes were 1.60 and 1.55 cm3 g−1, respectively (Fig. S8, ESI†). Because ZTC is electrochemically oxidized above 0.3 V (vs. Ag/Ag+),20 electrochemical measurements were performed between −1.5 and 0.3 V to exclude the effects of additionally doped oxygen species on the EDLC behavior.20 As shown in the voltammograms in Fig. 5(a), the ZTCs showed asymmetrically shaped voltammograms. It has been reported that graphene nanoribbons have band gaps when their widths become a few nanometers.45 The voltammograms of semiconductive single-walled carbon nanotubes show linearly increasing current by electrochemical doping when the potential is increased or decreased from the open circuit potentials.46 ZTCs synthesized using NaY zeolite are also semiconductive as long as ZTCs are synthesized without the formation of carbon shells, which are highly conductive, on the outer surfaces of ZTC particles.11 This is because the frameworks of the ZTCs were structurally restricted to the unstacked nanographene structure by the nanopore confinement.1,30,34 The open circuit potentials of G (0.8)-P and C (1.0)-P were −0.37 V, while that of the undoped ZTC was −0.27 V. However, the increase in the current was not linear for the ZTCs when the current was decreased from the open circuit potential, whereas an increase in potential above 0.3 V causes the electrochemical oxidation of ZTC. The nonlinearly increasing current is mainly attributed to the reversible redox reactions of acid anhydride that originally exists in the ZTCs. Since acid anhydride can be removed by heating ZTC at 400 °C, 400 °C heated ZTC shows linearly increasing current.11 The deviation in the voltammogram from the semiconductive ZTC is explained by the pseudocapacitive behavior of the ZTC. The undoped ZTC showed a nearly identical surface area to G (0.8)-P and a higher surface area than C (1.0)-P, but exhibited the smallest current among the ZTCs.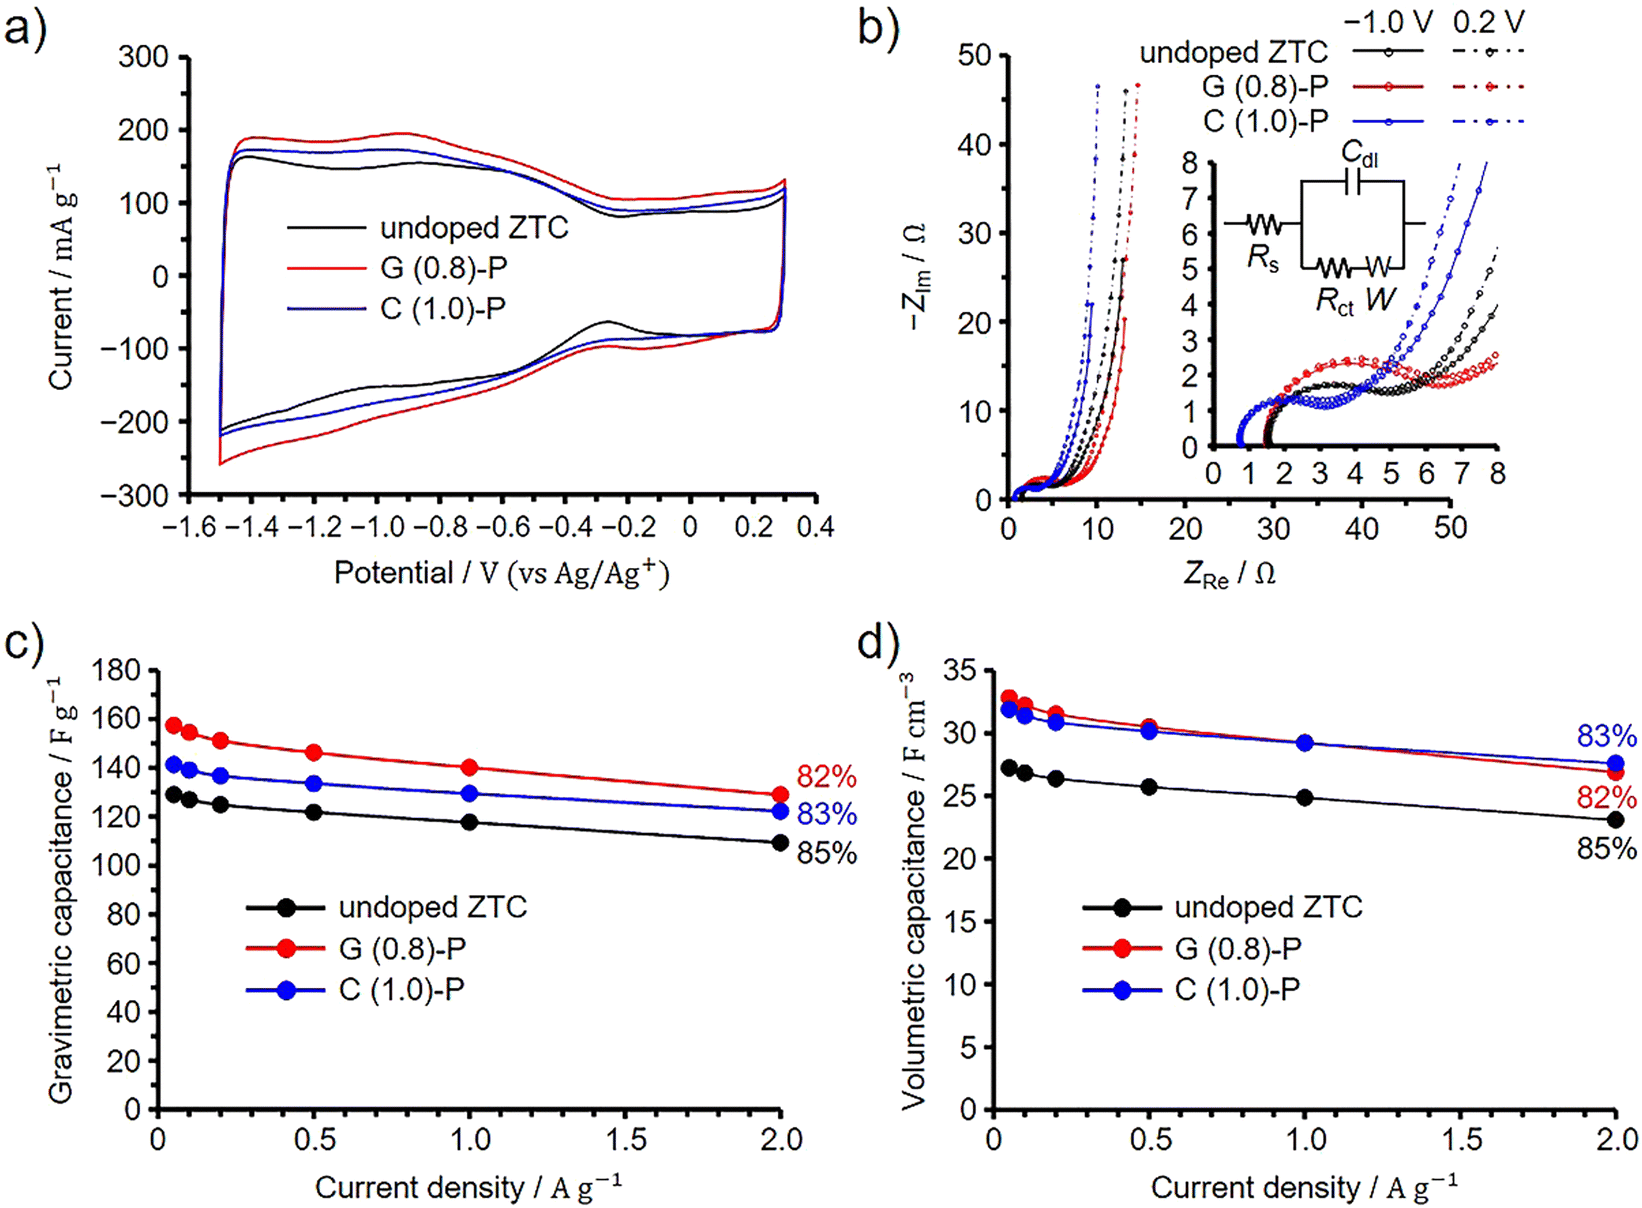 | ||
| Fig. 5 Results of three-electrode cell measurements for G (0.8)-P and C (1.0)-P performed at 25 °C, shown along with the results of the undoped ZTC. (a) Cyclic voltammogram collected at 1 mV s−1. (b) Nyquist plots collected at −1.0 and 0.2 V (vs. Ag/Ag+). Insets show the magnified spectra at low frequencies and the equivalent circuit; Rs, Rct, Cdl, and W represent the series resistance, charge transfer resistance, double-layer capacitance, and Warburg impedance, respectively.47,48 Dependence of (c) gravimetric and (d) volumetric capacitances on the current densities. Percentages in panels (c) and (d) indicate the capacitance retention values at 2 A g−1 based on the capacitances at 0.05 A g−1. | ||
We then performed an impedance spectroscopy analysis at −1.0 and 0.2 V and the obtained Nyquist plots are shown in Fig. 5(b). Note that the difference in the point where the spectrum intersects the horizontal axis is attributed to the difference in the resistance of the connection from the cell to the instrument used for the electrochemical measurements and it was found that such a difference does not affect the EDLC performance.49 The results obtained at low and high frequencies correspond to the quasi-vertical line and semicircle regions of the spectra, respectively. The slope of the quasi-vertical line increases as diffusion resistance decreases, while the diameter of the semicircle increases with increases in both contact and charge transfer resistances.4,8,50,51 Because all ZTCs exhibited high structural regularity, diffusion resistance was significantly reduced even in small micropores of 1.2 nm.8 Consequently, the differences in diffusion resistance among the ZTCs were negligible. Meanwhile, by fitting their Nyquist plots collected at −1.0 V (Fig. 5(b), inset), the charge transfer resistances of G (0.8)-P, C (1.0)-P, and the undoped ZTC were calculated to be 3.1, 4.3, and 2.3 Ω, respectively (for details, see Section S9 in the ESI†).47,48 If the capacitance were enhanced by nitrogen-derived pseudocapacitance, the charge transfer resistances of G (0.8)-P and C (1.0)-P would increase.13,52 Conversely, if the electrical conductivities of G (0.8)-P and C (1.0)-P were increased due to N-doping, both their charge transfer and diffusion resistances would also decrease.35,53,54 The predominant form of doped nitrogen in G (0.8)-P and C (1.0)-P was quaternary nitrogen, known to enhance electrical conductivity.23,41,42 It is also plausible that the pseudocapacitance from pyridone/pyrrole and pyridine nitrogens significantly contributes to charging and discharging processes,43 given their substantial presence relative to quaternary nitrogen in these samples. Indeed, G (0.8)-P and C (1.0)-P exhibited pseudocapacitive behavior in their voltammograms (Fig. 5(a)). As long as the same zeolite is used for ZTC synthesis, the particle size remains consistent, resulting in uniform contact resistance both among ZTC particles and between ZTC particles and the current collector. However, the chitin-derived amorphous carbons in C (1.0)-P reduced electrode resistance, thereby decreasing both contact and charge transfer resistances.20 In the Nyquist plots, the effect of the chitin-derived amorphous carbons was particularly prominent for C (1.0)-P. In contrast, G (0.8)-P, lacking amorphous carbons, displayed a significant influence of pyridone/pyrrole and pyridine nitrogens, which increased the charge transfer resistance.
Fig. 5(c) and (d) present the dependences of the gravimetric and volumetric capacitances on the current density, respectively. The percentages in the figures correspond to the capacitance retention values at 2 A g−1 based on the capacitances at 0.05 A g−1. The difference in gravimetric capacitance between the ZTCs cannot be explained by the difference in their BET specific surface areas, and the area-normalized capacitances at 0.05 A g−1 were 4.20, 4.13, and 3.49 μF cm−2 for G (1.0)-P, C (0.8)-P, and the undoped ZTC, respectively. Because all the ZTCs exhibited high structural regularity, the difference in area-normalized capacitance is attributed to the doped nitrogen. Meanwhile, the variations in capacitance retention among the ZTCs are minimal. Increasing pseudocapacitance and electrical conductivity should affect the EDLC performance of G (0.8)-P and C (1.0)-P. However, any negative impact on capacitance retention at high current densities, typically caused by pseudocapacitance, is offset by the conductivity improvements from chitin-derived amorphous carbons and quaternary nitrogen in the electrodes. Because C (1.0)-P and G (0.8)-P have the same volumetric surface area, their volumetric capacitances are nearly identical and higher than that of the undoped ZTC across all current densities. Likely, the enhancement in electrical conductivity and pseudocapacitance increased the area-normalized capacitance without reducing capacitance retention.
In terms of sustainable development and reducing biomass waste from crustacean shells, chitin is a more important precursor for synthesizing N-doped ZTCs than GlcNAc, which is mainly derived from chitin.24 Additionally, C (1.0)-P demonstrated higher volumetric capacitances than the undoped ZTC across all current densities. The current synthetic method does not require drying the zeolite or polymerizing monomers prior to CVD, thereby eliminating the need for complicated synthetic apparatus and multiple synthetic steps. Currently, the use of hazardous HF is inevitable to remove zeolite for ZTC synthesis. Despite ongoing research into alternative methods, none have fully replaced HF, leading to a reduced surface area and pore volume in ZTCs. In this study, we also address the safety and environmental concerns associated with the HF use. GlcNAc-derived ZTCs are also useful due to the absence of amorphous carbons, allowing for studies on the effect of N-doping by comparing with the undoped ZTC. Physical and chemical processes such as diffusion, reactions, and adsorption of ions and molecules in uniform-sized micropores are critically important for materials design, particularly in the development of adsorbents, electrodes, and other devices. In comparison to nitrogen-doped ordered mesoporous carbons, N-doped ZTCs offer distinct advantages due to their microporous structure. The highly uniform and small pore sizes in ZTCs provide enhanced interactions with small molecules and ions, leading to superior performance in applications such as gas adsorption and separation. Additionally, the N-doping in ZTCs further enhances their electrical conductivity and chemical reactivity, making them particularly effective in catalysis and electrochemical applications where high surface area and specific pore structures are critical. We are currently exploring the applications of N-doped ZTCs prepared from GlcNAc and chitin.
4. Conclusion
N-doped ZTCs were synthesized using GlcNAc and chitin as sources of carbon and nitrogen, with additional carbon provided by propylene, employing NaY zeolite as a template. This is the most simplified method to synthesize N-doped ZTC, utilizing N-containing biomass resources as both carbon and nitrogen sources, without the use of organic solvents or polymerization procedures. Upon heating, GlcNAc was promptly absorbed into the zeolite pores. Simultaneously, chitin depolymerized into chitin oligosaccharide radicals before being absorbed into the zeolite through a DOF mechanism. Before propylene CVD, the absorbed GlcNAc and chitin oligosaccharides were converted into nitrogen-containing nanographene within the zeolite micropores. During the CVD process, these nanographenes further extended and interconnected to form the framework of the N-doped ZTC. To achieve high structural regularity, GlcNAc and chitin were used in amounts 0.8 times and 1.0 times the total pore volume of the zeolite, respectively. Chitin and GlcNAc, each in an amount equal to 0.8 times the total pore volume of the zeolite, were used to form nanographenes. The remaining chitin, amounting to 0.2 times the total pore volume of the zeolite, accumulated as amorphous carbons between zeolite particles. Due to the doped nitrogen, the N-doped ZTCs demonstrated higher volumetric capacitances than the undoped ZTC, ranging from 0.05 to 2 A g−1. This improvement is attributed to the pseudocapacitance from pyridone/pyrrole and pyridine nitrogens, along with enhanced electrical conductivity provided by quaternary nitrogen. The chitin-derived ZTC exhibited a lower specific surface area than the GlcNAc-derived ZTC due to the accumulation of amorphous carbon. However, both ZTCs demonstrated identical volumetric capacitances across all current densities. Porous carbons are often used in compressed forms, highlighting the practical potential of chitin-derived ZTC for electrode and adsorption applications. This aligns with sustainable development goals by minimizing material waste and promoting recycling.Author contributions
Hiroyuki Itoi: conceptualization, data curation, formal analysis, funding acquisition, investigation, methodology, project administration, supervision, visualization, writing – original draft; Chika Matsuoka: investigation, validation, visualization; Ginga Saeki: investigation, validation, visualization; Hiroyuki Iwata: investigation; Shinichiroh Iwamura: data curation; Keigo Wakabayashi: data curation; Takeharu Yoshii: formal analysis; Hirotomo Nishihara: investigation; Yoshimi Ohzawa: writing – review & editing.Data availability
The data supporting this article have been included as part of the ESI.†Conflicts of interest
There are no conflicts to declare.Acknowledgements
This work was financially supported by the Cooperative Research with Atsumitec Co., Ltd and the “Five-star Alliance” in “NJRC Mater. & Dev.”.References
- H. Nishihara and T. Kyotani, Chem. Commun., 2018, 54, 5648–5673 RSC.
- L. Ji, F. Liu, Z. Xu, S. Zheng and D. Zhu, Environ. Sci. Technol., 2009, 43, 7870–7876 CrossRef CAS PubMed.
- H. Nishihara, P.-X. Hou, L.-X. Li, M. Ito, M. Uchiyama, T. Kaburagi, A. Ikura, J. Katamura, T. Kawarada, K. Mizuuchi and T. Kyotani, J. Phys. Chem. C, 2009, 113, 3189–3196 CrossRef CAS.
- H. Itoi, H. Nishihara, T. Ishii, K. Nueangnoraj, R. Berenguer-Betrián and T. Kyotani, Bull. Chem. Soc. Jpn., 2014, 87, 250–257 CrossRef CAS.
- K. Nueangnoraj, H. Nishihara, T. Ishii, N. Yamamoto, H. Itoi, R. Berenguer, R. Ruiz-Rosas, D. Cazorla-Amorós, E. Morallón, M. Ito and T. Kyotani, Energy Storage Mater., 2015, 1, 35–41 CrossRef.
- P.-X. Hou, T. Yamazaki, H. Orikasa and T. Kyotani, Carbon, 2005, 43, 2624–2627 CrossRef CAS.
- Z. X. Ma, T. Kyotani and A. Tomita, Carbon, 2002, 40, 2367–2374 CrossRef CAS.
- H. Itoi, H. Nishihara, T. Kogure and T. Kyotani, J. Am. Chem. Soc., 2011, 133, 1165–1167 CrossRef CAS PubMed.
- H. Itoi, S. Tazawa, H. Hasegawa, Y. Tanabe, H. Iwata and Y. Ohzawa, RSC Adv., 2019, 9, 27602–27614 RSC.
- H. Nishihara, S. Ittisanronnachai, H. Itoi, L.-X. Li, K. Suzuki, U. Nagashima, H. Ogawa, T. Kyotani and M. Ito, J. Phys. Chem. C, 2014, 118, 9551–9559 CrossRef CAS.
- H. Nishihara, H. Itoi, T. Kogure, P. X. Hou, H. Touhara, F. Okino and T. Kyotani, Chemistry, 2009, 15, 5355–5363 CrossRef CAS PubMed.
- M. Ito, H. Nishihara, K. Yamamoto, H. Itoi, H. Tanaka, A. Maki, M. T. Miyahara, S. J. Yang, C. R. Park and T. Kyotani, Chemistry, 2013, 19, 13009–13016 CrossRef CAS PubMed.
- H. Itoi, H. Nishihara and T. Kyotani, Langmuir, 2016, 32, 11997–12004 CrossRef CAS PubMed.
- J. Miao, Z. Lang, T. Xue, Y. Li, Y. Li, J. Cheng, H. Zhang and Z. Tang, Adv. Sci., 2020, 7, 2001335 CrossRef CAS PubMed.
- T. Gunawan, R. Wijiyanti and N. Widiastuti, RSC Adv., 2018, 8, 41594–41602 RSC.
- J. Shi, W. Li and D. Li, Colloids Surf., A, 2015, 485, 11–17 CrossRef CAS.
- K. Matsuoka, Y. Yamagishi, T. Yamazaki, N. Setoyama, A. Tomita and T. Kyotani, Carbon, 2005, 43, 876–879 CrossRef CAS.
- T. Kyotani, T. Nagai, S. Inoue and A. Tomita, Chem. Mater., 1997, 9, 609–615 CrossRef CAS.
- H. Itoi, R. Hirade, C. Matsuoka, Y. Kasai, K. Morishita, Y. Gotoh, H. Iwata and Y. Ohzawa, ACS Sustainable Chem. Eng., 2022, 10, 10827–10838 CrossRef.
- H. Itoi, C. Matsuoka, R. Hirade, G. Saeki, S. Sugiyama, K. Morishita, Y. Kasai, H. Iwata and Y. Ohzawa, Carbon Trends, 2022, 9, 100228 CrossRef CAS.
- B. Liu and Z. Zhang, ACS Catal., 2016, 6, 326–338 CrossRef CAS.
- E. C. Monge, T. R. Tuveng, G. Vaaje-Kolstad, V. G. H. Eijsink and J. G. Gardner, J. Biol. Chem., 2018, 293, 3849–3859 CrossRef CAS PubMed.
- Q. Jiang, Y. Ni, Q. Zhang, J. Gao, Z. Wang, H. Yin, Y. Jing and J. Wang, Energy Fuels, 2022, 36, 4026–4033 CrossRef CAS.
- S.-W. Lee, B.-Y. Lee and M.-K. Oh, J. Agric. Food Chem., 2018, 66, 13191–13198 CrossRef CAS PubMed.
- L. N. Johnson and D. C. Phillips, Nature, 1964, 202, 588 CrossRef CAS PubMed.
- K. Kaneko and C. Ishii, Colloids Surf., 1992, 67, 203–212 CrossRef CAS.
- K. Wakabayashi, T. Yoshii and H. Nishihara, Carbon, 2023, 210, 118069 CrossRef CAS.
- H. Itoi, Y. Kasai, K. Morishita, R. Suzuki, Y. Gotoh, C. Matsuoka, M. Miyaji, R. Hirade, Y. Tanabe, H. Iwata and Y. Ohzawa, Microporous Mesoporous Mater., 2021, 326, 111378 CrossRef CAS.
- H. Itoi, C. Matsuoka, R. Hirade, Y. Kasai, Y. Gotoh, H. Iwata and Y. Ohzawa, Carbon Rep., 2023, 2, 50–59 CrossRef.
- H. Nishihara, Q. H. Yang, P. X. Hou, M. Unno, S. Yamauchi, R. Saito, J. I. Paredes, A. Martinez-Alonso, J. M. D. Tascon, Y. Sato, M. Terauchi and T. Kyotani, Carbon, 2009, 47, 1220–1230 CrossRef CAS.
- H. Wang and Y. H. Hu, Ind. Eng. Chem. Res., 2011, 50, 6132–6137 CrossRef CAS.
- M. S. Dresselhaus, A. Jorio, M. Hofmann, G. Dresselhaus and R. Saito, Nano Lett., 2010, 10, 751–758 CrossRef CAS PubMed.
- Y. Mu, B. Chen, H. Zhang, M. Fei, T. Liu, N. Mehta, D. Z. Wang, A. J. M. Miller, P. L. Diaconescu and D. Wang, J. Am. Chem. Soc., 2024, 146, 13438–13444 CrossRef CAS PubMed.
- H. Nishihara, H. Fujimoto, H. Itoi, K. Nomura, H. Tanaka, M. T. Miyahara, P. A. Bonnaud, R. Miura, A. Suzuki, N. Miyamoto, N. Hatakeyama, A. Miyamoto, K. Ikeda, T. Otomo and T. Kyotani, Carbon, 2018, 129, 854–862 CrossRef CAS.
- H. Itoi, G. Saeki, T. Usami, S. Takagi, H. Suzuki, T. Ishii, H. Iwata and Y. Ohzawa, ACS Sustainable Resour. Manage., 2024, 1, 743–756 CrossRef CAS.
- G. Zhang, S. Sun, D. Yang, J.-P. Dodelet and E. Sacher, Carbon, 2008, 46, 196–205 CrossRef CAS.
- S. W. Sheehan, J. M. Thomsen, U. Hintermair, R. H. Crabtree, G. W. Brudvig and C. A. Schmuttenmaer, Nat. Commun., 2015, 6, 6469 CrossRef CAS PubMed.
- H. Zhang, B. Chen, T. Liu, G. W. Brudvig, D. Wang and M. M. Waegele, J. Am. Chem. Soc., 2024, 146, 878–883 CrossRef CAS PubMed.
- N. Kostkova, M. Vorokhta, M. Kormunda, R. Pilar, G. Sadovska, P. Honcova, E. Mikyskova, J. Moravkova and P. Sazama, Microporous Mesoporous Mater., 2024, 379, 113286 CrossRef CAS.
- J. Liu, Y. Deng, X. Li and L. Wang, ACS Sustainable Chem. Eng., 2016, 4, 177–187 CrossRef CAS.
- C. Long, L. Jiang, X. Wu, Y. Jiang, D. Yang, C. Wang, T. Wei and Z. Fan, Carbon, 2015, 93, 412–420 CrossRef CAS.
- K. Zou, Y. Deng, J. Chen, Y. Qian, Y. Yang, Y. Li and G. Chen, J. Power Sources, 2018, 378, 579–588 CrossRef CAS.
- D. Hulicova-Jurcakova, M. Kodama, S. Shiraishi, H. Hatori, Z. H. Zhu and G. Q. Lu, Adv. Funct. Mater., 2009, 19, 1800–1809 CrossRef CAS.
- Z. Ma, T. Kyotani and A. Tomita, Chem. Commun., 2000, 2365–2366, 10.1039/b006295m.
- Y.-W. Son, M. L. Cohen and S. G. Louie, Phys. Rev. Lett., 2006, 97, 216803 CrossRef PubMed.
- O. Kimizuka, O. Tanaike, J. Yamashita, T. Hiraoka, D. N. Futaba, K. Hata, K. Machida, S. Suematsu, K. Tamamitsu, S. Saeki, Y. Yamada and H. Hatori, Carbon, 2008, 46, 1999–2001 CrossRef CAS.
- H. Jia, J. Sun, X. Xie, K. Yin and L. Sun, Carbon, 2019, 143, 309–317 CrossRef CAS.
- Y. Gong, D. Li, Q. Fu, Y. Zhang and C. Pan, ACS Appl. Energy Mater., 2020, 3, 1585–1592 CrossRef CAS.
- H. Itoi, S. Maki, T. Ninomiya, H. Hasegawa, H. Matsufusa, S. Hayashi, H. Iwata and Y. Ohzawa, Nanoscale, 2018, 10, 9760–9772 RSC.
- Y. Wang, Z. Shi, Y. Huang, Y. Ma, C. Wang, M. Chen and Y. Chen, J. Phys. Chem. C, 2009, 113, 13103–13107 CrossRef CAS.
- J. Shi, Z. Zhao, J. Wu, Y. Yu, Z. Peng, B. Li, Y. Liu, H. Kang and Z. Liu, ACS Sustainable Chem. Eng., 2018, 6, 4729–4738 CrossRef CAS.
- T. Kwon, H. Nishihara, H. Itoi, Q. H. Yang and T. Kyotani, Langmuir, 2009, 25, 11961–11968 CrossRef CAS PubMed.
- X. Cui, G. Xu, Z. Gao, S. Zhu, Y. Zhao, X. Mo, Z. Gao, Z. Zheng and J. Zhang, Energy Fuels, 2023, 37, 4038–4047 CrossRef CAS.
- I. Yang, J. Yoo, D. Kwon, D. Choi, M.-S. Kim and J. C. Jung, Carbon, 2020, 160, 45–53 CrossRef CAS.
Footnote |
| † Electronic supplementary information (ESI) available. See DOI: https://doi.org/10.1039/d4ya00400k |
| This journal is © The Royal Society of Chemistry 2024 |