DOI:
10.1039/D4YA00012A
(Paper)
Energy Adv., 2024,
3, 1037-1046
Optimization of thermoelectric parameters for quantum dot-assisted polymer nanocomposite
Received
5th January 2024
, Accepted 12th April 2024
First published on 15th April 2024
Abstract
The interdependency among thermal conductivity, electrical conductivity, and the Seebeck coefficient acts as a challenge to enhancing thermoelectric (TE) performance. However, thanks to nanotechnology, it is possible to break this interdependency by employing the phonon glass electron crystal (PGEC) approach. The present work aims to decrease the lattice thermal conductivity by inducing nanoflower-like structures in a conducting polymer matrix. Herein, we report the thermoelectric properties of graphene oxide and titanium dioxide (GO–TiO2) quantum dots (QDs) in poly(3,4-ethylene dioxythiophene):polystyrene sulfonate (PEDOT:PSS). The effect of QDs on the thermoelectric performance of the PEDOT:PSS polymeric matrix has been investigated experimentally and then analyzed using several theoretical models. The obtained nanocomposite showed an enhancement in Seebeck coefficient and electrical conductivity while decreasing lattice thermal conductivity. Furthermore, the filler successfully broke the interdependent relationship of thermoelectric parameters due to the existence of energy-filtering phenomena and interfacial thermal resistance.
1 Introduction
Organic thermoelectric (OTE) materials serve as a potential sustainable power source for waste heat harvesting. These materials have sparked significant interest across a range of applications, including wearable electronics, IoTs, portable power generators, sensors, etc.1–3 The efficiency of these materials is evaluated by a dimensionless TE figure of merit parameter ZT using the following equation:| |  | (1) |
where, S is the Seebeck coefficient, σ is the electrical conductivity, T is the absolute temperature, and κ is the thermal conductivity. In general, thermal conductivity has two terms, κe and κl, associated with electronic and lattice thermal conductivities, respectively. In order to attain a high ZT, large values of Seebeck coefficient (S) and electrical conductivity (σ) are desirable while maintaining a low thermal conductivity (k), which is quite challenging to obtain in the bulk state. For instance, the Wiedemann–Franz law indicates that the electronic thermal conductivity is directly proportional to the electrical conductivity, as follows:where, L is the Lorenz number (2.44 × 10⁻⁸ W K−2). In addition to the Wiedmann–Franz law restrictions, Pisarenko's relation restricts the enhancement in S and σ simultaneously. However, this relationship is only valid for metals and strongly degenerate semiconductors. The complicated interdependence of these thermoelectric parameters can be summarized as:4| |  | (3) |
| |  | (4) |
| |  | (5) |
where, h is Planck's constant (6.63 × 10⁻³⁴ kg m2 s−1), m* is the density of state effective mass, n is the charge carrier concentration, μ is the carrier mobility, and t is the relaxation time. The aforementioned relationship explains that the electrical conductivity and Seebeck coefficient share the opposite dependency of n, μ, and m*. However, the Wiedmann–Franz model does not allow increasing electrical conductivity while decreasing thermal conductivity. Such complex interaction among the TE parameters is especially strong in the bulk state, making it much more difficult to achieve a high thermoelectric ZT value. However, great progress has been made in the past few decades by employing various strategies to enhance ZT by switching at least one dimension of the material to the nanoscale. It can break the interdependency of the thermoelectric parameters and make it possible to enhance the thermoelectric ZT.5–7
The phonon glass electron crystal (PGEC) approach is an interesting strategy for breaking the interdependency of thermoelectric parameters, where materials are modified to behave electrically as a crystal and thermally as a glass, which helps in accomplishing the desired goal.8 The aim of this approach is to achieve decoupling between the electronic and thermal transport quantities by introducing defects acting as phonon back-scattering sites. Properly selecting the nature and size of the defects hinders heat transport while leaving electronic transport unaffected. Furthermore, due to quantum confinement and energy filtering effects, the Seebeck coefficient may increase due to an increase in the density of states near the band boundary edges.9
This article aims to break the interdependency among TE parameters using PGEC approach. For this purpose, a heterogeneous nanoflower-like nanostructure has been utilized, which serves a dual purpose by acting as efficient lattice scattering sites and energy filtering sites. Notably, our prior article extensively detailed the synthesis, characterization, electrical conductivity, and Seebeck coefficient of titanium dioxide-decorated graphene oxide (GO–TiO2) in a poly(3,4-ethylenedioxythiophene)–poly(styrenesulfonate) (PEDOT:PSS) matrix.10 Since thermal conductivity plays a significant role in calculating the TE figure of merit ZT, the current work deals with the experimentally measured thermal conductivity of the aforementioned nanocomposite. Furthermore, this article is an effort to enhance our understanding of the behavior of TE materials by exploring diverse theoretical models. We will discuss various theoretical models to fit the experimentally obtained data for thermal conductivity, electrical conductivity, and their correlation with the Seebeck coefficient, aiming to elucidate the underlying physics. The objective is to bridge the gap between experimental findings and theoretical predictions, thereby contributing to the development and optimization of polymer nanocomposites for practical applications in thermoelectricity, electronics, and materials science.
2 Material synthesis
The polymer nanocomposite was synthesized using a two-step method. First, the GO–TiO2 nanostructure was synthesized by depositing a titanium isopropoxide precursor onto graphene oxide sheets dispersed in ethanol. The precursor was oxidized with a 1 M solution of HCl acid under mechanical stirring for 24 h. Finally, the obtained precipitate was washed and dried in an oven at 60 °C. The second step includes the synthesis of polymer nanocomposite, where an appropriate amount of GO–TiO2 filler, EDOT, PSS, and surfactant dioctyl sodium sulfosuccinate was added to the n-hexane solution and stirred well. A suitable amount FeCl3 was added to oxidize the EDOT to initiate the oxidative polymerization process. was added drop-wise into the above solution and stirred for 24 h to complete the polymerization process. All the reactions were held at room temperature. The final product was washed and dried in an oven at 60 °C and ground with a mortar and pestle. More details of the synthesis route have been published in our previous article.10
3 Characterization techniques
The nanoscale morphology of the filler was analyzed by high-resolution transmission electron microscopy (HRTEM) using FEI Titan 60–300 kV and FEI TECNAI TEM at 200 kV with LaB6 filament. The powdered material was dusted on a 3 mm carbon-coated TEM grid for sample preparation. The surface morphology of the samples was analyzed by atomic force microscopy (AFM) using a Brüker multimode equipped with a Nanoscope IIIa controller in tapping mode in ambient air. All the transport physical property measurements were performed cross-plane.
3.1 Electrical conductivity
Electrical conductivity was measured using impedance spectroscopy using an HP Hewlett–Packard 4284A impedance analyzer. The capacitance and conductance were simultaneously measured as a function of frequency. The samples were used in pellet form with a 13 mm diameter and approximately 800 m thickness. The sample surface was metalized by depositing a thin layer of gold using a Cressington Sputter Coater to ensure good contact between the sample and electrodes. The electrical conductivity σac was calculated by using σac = ε0ε′′ω, where ε0 = 8.85 × 10⁻¹² F m−1, is the vacuum permittivity, ε* = ε′ + iε′′ is the imaginary component of the complex dielectric permittivity, and the imaginary component, ε′′ = G/C0ω, where, G (conductance) and C0 (capacitance) were measured simultaneously as a function of frequency.
3.2 Thermal conductivity
The thermal conductivity of the samples was determined by photothermal infrared radiometry or photothermal radiometry (PTR).11,12 The schematic diagram is shown in Fig. 1. The PTR technique is based on the detection of infrared (blackbody) radiation obtained from the surface of the sample in response to the exposure of a modulated light source. The thermal parameters of the sample were determined from a three-layered system, which includes a front medium, an opaque sample, and a substrate. A self-normalization method was used to eliminate the instrument frequency dependence by including the ratio of PTR signals obtained with and without substrate. More details of the method could be found elsewhere.13,14 A modulated Ventus laser (Laser Power Supply: MPC 6000 quantum laser, Model No. Ventus 532, voltage 11–14 V DC, and current rating 85 A) was used to originate the modulated thermal excitation wave across the sample. The incoming PTR signal was detected by a nitrogen-cooled mercury–cadmium–telluride (MCT) detector and processed by a lock-in amplifier (Model No. 7225 DSP). The obtained experimental data was analyzed by considering a one-dimensional heat transport model.13 All the measurements were conducted at room temperature.
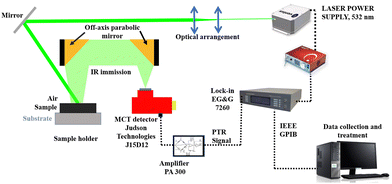 |
| | Fig. 1 Schematic diagram of the photothermal radiometry technique. | |
3.3 Seebeck coefficient
The Seebeck coefficient is defined as the induced potential difference (ΔV) in response to the temperature difference (ΔT) across the sample, i.e., S = −ΔV/ΔT. The Seebeck coefficient was measured using a home-made setup sandwiching the sample in contact with two cylinders. The temperature difference was maintained by using a nozzle heater in each cylinder. The voltage and the temperature difference across the sample were measured by a multiplexer using two type T thermocouples. The measurement setup was controlled by a computer using the Labview program. Further instrumental details can be found elsewhere.10
4 Results and discussion
4.1 Transmission electron microscopy with energy dispersive X-ray spectroscopy
TEM has been performed to analyze the morphology of GO–TiO2 filler at the nanoscale. Fig. 2 represents the energy dispersive X-ray spectroscopy of the high-angle annular dark-field (HAADF) image. Different elements, such as carbon, oxygen, and titanium have been represented by red, green, and yellow colors, respectively. In the GO–TiO2 filler, carbon is representing graphene oxide and titanium is representing TiO2. EDX images confirms the uniform distribution of TiO2 on graphene oxide surfaces.
 |
| | Fig. 2 TEM-EDX mapping of GO–TiO2 nanocomposite representing (a) selected area of mapping (b) carbon with red, (c) oxygen with green, and (d) titanium with yellow color. | |
4.2 Atomic force microscopy
The morphology of the nanocomposite was analyzed by atomic force microscopy (AFM) in tapping mode. Fig. 3 shows the AFM images of pristine PEDOT:PSS and 5 wt% GO–TiO2/PEDOT:PSS. Image Fig. 3(a) and (b) show the height and 3-D profiles of pristine PEDOT:PSS consisting of 30–40 nm long chains, consistent with the PEDOT:PSS chain length. The polymer entities were found to be scattered everywhere without any visible long-ordered network.
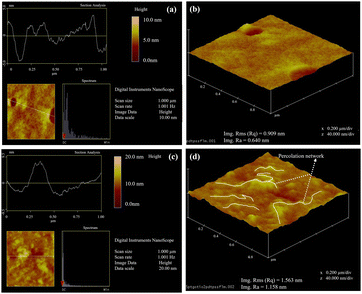 |
| | Fig. 3 AFM with (a) and (c) height profile and (b) and (d) 3D image of pristine and 5 wt% GO–TiO2/PEDOT:PSS taken by tapping mode for 1 × 1 μm2 area. The yellow lines in image (d) are showing the PEDOT chain conformation induced by the GO–TiO2 to provide long pathways for the charge transfer. | |
The root mean square (RMS) surface roughness and the average roughness (RA) values were found to be 0.90 nm and 0.64 nm, respectively. AFM images show vast changes in the morphology of the polymer with filler. Images Fig. 3(c) and (d) show the height and 3-D profiles of 5 wt% GO–TiO2/PEDOT:PSS. Generally, the PEDOT:PSS is uniformly distributed over the surface. However, the addition of the filler tends to modify the surface morphology. The bright spots correspond to dense materials and higher angles, while the dark spots correspond to mushy materials and lower angles. AFM images show that the bright spots increased after the addition of filler, which signifies the accumulation of a thick, elongated network of conducting PEDOT after separating with the PSS. The visible long conducting pathways in Fig. 3(d) indicate that the filler is bringing conducting PEDOT chains closer and connecting them via π–π interaction. The PEDOT chains become larger (50–60 nm) and more prominent after connecting with the filler. The observed large PEDOT pathways were visible, which could lead to a percolation-type network for the electrical transport and might show a drastic enhancement in the electrical conductivity. The surface roughness increased noticeably to 1.563 nm (RMS) and 1.158 nm (RA).
4.3 Thermal conductivity
Fig. 4 shows experimentally obtained photothermal signal phase vs. frequency curves by triangles and the fitted data by solid lines. The thermal diffusivity and effusivity of the samples were determined simultaneously by fitting the normalized phase vs. frequency curves. Thermal conductivity, κ, can be calculated by using the formula:15| |  | (6) |
where, e and d are the thermal effusivity and diffusivity of the sample, respectively. All the experiments were repeated three times for each sample, and the average values are presented. Fig. 5(a) shows the thermal conductivity of the composites as a function of filler weight fraction. Thermal conductivity for the 5 wt% decreases by 47% as compared to the neat polymer matrix. The decreasing trend for thermal conductivity demonstrates effective phonon scattering at the interface of the matrix and filler.16,17 The phonon scattering takes place due to the existing lattice mismatch offered by the unique structure of GO–TiO2 nano inclusions and blocks phonon pathways as depicted in Fig. 6.
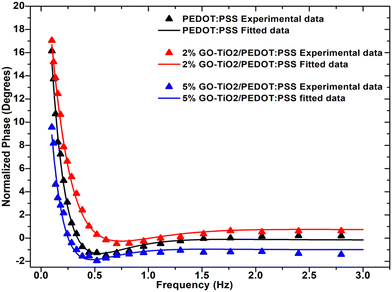 |
| | Fig. 4 Experimentally obtained phase vs. frequency curves from photothermal radiometry for GO–TiO2/PEDOT:PSS nanocomposites. | |
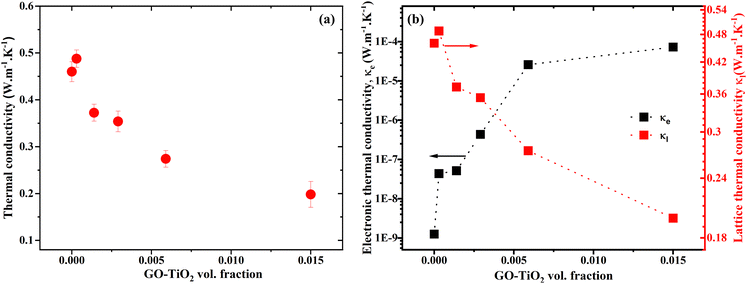 |
| | Fig. 5 (a) Total thermal conductivity and (b) electronic and lattice thermal conductivity as a function of filler wt. fraction. | |
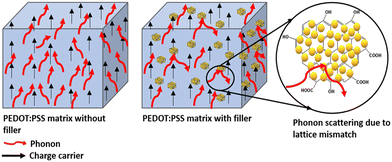 |
| | Fig. 6 Schematic representation of phonon scattering caused by the heterogeneous GO–TiO2 in polymer PEDOT:PSS matrix. The black and red arrows represent the motion of electrons and phonons. The rightmost image shows effective phonon scattering due to the filler. | |
Fig. 5(b) depicts the lattice (κl) and electronic (κe) components of the thermal conductivity, respectively, calculated from the eqn (2). It indicates that the lattice thermal conductivity has a decreasing trend. However, the electronic thermal conductivity has an increasing trend with the filler. Additionally, the contribution of electronic thermal conductivity to total thermal conductivity is insignificant due to the fact that electronic thermal conductivity is extremely low. This indicates that the decrease in total thermal conductivity originates from the lattice portion, most likely as a result of phonon scattering.
These results indicate that the synthesis method used was effective in providing a filler to function as an effective phonon scattering site to block the phonon pathways.16–18 The 3-dimensional schematic model for the transport of electrons and phonons is shown in Fig. 6. The thermal behavior of samples may be explained by the presence of an energy barrier at the interface between the matrix and the filler, which prevents phonons from passing through and scattering phonons.16,17 The reason for phonon scattering could be the existing lattice mismatch provided by the unique structure of GO–TiO2 inclusions, which blocks the phonon paths, as shown in Fig. 6.
Even if the phonon was initially introduced to explain the lattice heat propagation in crystalline materials where finite thermal conductivity is explained by phonon–phonon scattering, the phonon formalism can be extended to disordered media like polymers. In non-crystalline materials, some local organization can be defined, and phonons can propagate through these local atomic arrangements (local lattices). Vibrational modes in disordered materials are generally more complex, which can lead to the phenomenon of scattering by defects, anharmonicity, and interfaces between these local lattices (thermal boundary resistances). More information on thermal transport in disordered materials19 and more specifically on thermal transport in polymers can be obtained elsewhere.20
In the study conducted by Genovese et al.,21 the investigation centered on elucidating the correlation between morphology and thermal conductivity in polymer PEDOT. Their findings indicated that crystalline regions exhibited higher thermal conductivity than the amorphous regions. Contrarily, in the current study, we have observed a divergent trend, noting a reduction in thermal conductivity with increased crystallinity due to the presence of the filler, as demonstrated in the X-ray diffraction (XRD) data presented in our prior publication.10 In our samples, the filler GO–TiO2 interacts with the PEDOT via π–π bonds and eventually creates a long-range network consisting GO–TiO2–PEDOT–GO–TiO2 entities. This complex structure offers a high thermal resistance due to lattice change from GO–TiO2 to PEDOT and does not allow phonons to move further in the system. Consequently, phonons experience scattering at the interface between the filler and the polymer as shown in the Fig. 6, leading to a reduction in lattice thermal conductivity regardless of higher crystallinity.
This unique system resolves a complex interdependency among thermoelectric (TE) parameters. The extended GO–TiO2–PEDOT–GO–TiO2 network proves advantageous for facilitating electron contribution to electrical conductivity. Simultaneously, it acts as an effective barrier, preventing phonons from advancing further in the material. This dual functionality underscores the significance of the developed long-range network in optimizing both electrical and thermal properties, offering potential applications in the enhancement of thermoelectric performance.
4.3.1 The generalized effective medium theory (GEMT) for thermal conductivity.
The experimentally obtained data was fitted using generalized effective medium theory (GEMT) to evaluate the effective thermal conductivity of the composite as a function of the individual thermal conductivities of the matrix and the filler. This theory is described by the following equation:22| |  | (7) |
where, ϕf represent the filler factor and kf, km, and ke represents the thermal conductivities of filler, matrix, and composite, respectively.  is a constant that depends on the volumetric concentration percolation threshold ϕC and tk is the critical exponent.
Fig. 7(a) shows the experimental data with solid red circles and the best-fit GEMT data with a black line by implementing eqn (8). It shows that the experimentally obtained data is in good agreement with the GEMT model. For fitting, the initial values for Ak and tk were considered to be 2 and 1, respectively, due to the absence of any visible percolation threshold. The thermal conductivities for matrix and filler obtained from best fit data were 0.47 W m−1 K−1 and 0.06 W m−1 K−1, respectively. However, the value of the parameter tk, which defines the percolation network, and ϕC which defines the percolation threshold, have values of 0.4 and 0.99, respectively. All the fitted values have been mentioned in the Table 1. These fitted values are meaningless, indicating the inability of GEMT to adequately explain the observed thermal behavior. In GEMT, thermal resistance at the interface, also known as thermal boundary resistances, is not considered, which could explain why the GEMT cannot accurately describe the experimental thermal conductivity trend. Consequently, GEMT was unable to derive any meaningful conclusions from our samples. Hereafter, we used the theoretical model proposed by Nan et al.23 for the data fitting in the next section.
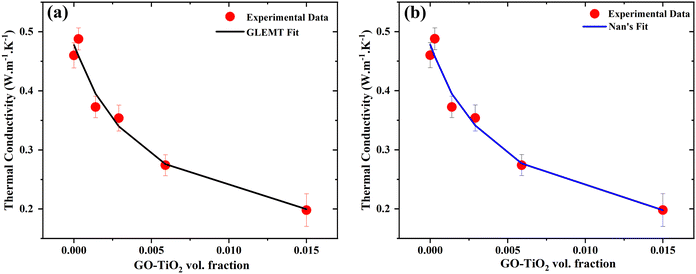 |
| | Fig. 7 Thermal conductivity experimental data obtained by the PTR technique fitted by using theoretical models (a) GLEMT and (b) Nan's model for polymer nanocomposites as a function of filler wt%. | |
Table 1 The GEMT and Nan's model fitted parameter values of the GO–TiO2/PEDOT:PSS
| Fitted parameters |
t
k (—) |
ϕ
C (—) |
κ
m (W m−1 K−1) |
κ
f (W m−1 K−1) |
R
bd (m2 K W−1) |
| GEMT |
0.4 |
0.99 |
0.47 |
0.06 |
— |
| Nan |
— |
— |
0.47 |
0.09 |
5.9 × 10⁻⁴ |
4.3.2 Nan's model for thermal conductivity.
The thermal conductivity of the polymer nanocomposites can be explained with the help of various mathematical models by considering the interfacial effects. Many studies have already been introduced to compute the effective thermal conductivities of heterogeneous nanocomposites, for example, Maxwells model, Every model, Nans model, Woodside and Messmer model, Dobson model, etc.24 In our work, we applied several models to describe the thermal conductivity behavior of our samples and found that the obtained experimental data is in good agreement with the predictions made by Nans model for spherical inclusions.23 As the morphology of GO–TiO2 can be roughly assimilated to a sphere, the effective thermal conductivity of the composites can be determined by the equation:| |  | (8) |
| |  | (9) |
where, a1 and a3 are the lengths of the major and minor axes of the spherical shape filler, keff, km, and kf, are the effective thermal conductivities of composite, matrix, and filler, respectively, and a, p, and f are a dimensionless parameter, aspect ratio, and volume fraction of filler, respectively, ac is the radius, defined bywhere, Rbd is the resistance. As the filler is in spherical shape, a1 = a3, and the aspect ratio, p, will be equal to 1. Note that, for the data fitting, the thermal conductivities of all the samples were obtained by using a two-step method. Firstly, the thermal conductivity of the GO–TiO2 composite was determined by taking GO as a matrix and TiO2 as the filler. Secondly, the GO–TiO2 composite was considered a single entity filler in the PEDOT:PSS matrix. The obtained thermal conductivity for GO–TiO2 particulates, κp, was 0.8 W K−1 m−1. Keeping the spherical shape of the inclusions in mind, the aspect ratio (p) was considered equal to 1.
Fig. 7(b) shows the experimentally obtained thermal conductivities by red symbols and Nan's fit according to eqn (8) by a solid blue line. It shows that the experimental data fits very well with the theory proposed by Nan. The obtained fitted parameters are shown in Table 1.
Nan introduced the concept of thermal boundary resistance in effective medium theory. This interfacial thermal resistance is known as resistance, which reduces the thermal conductivity of the composites. Such thermal resistance could arise from the relative roughness and lattice mismatch leading to phonon scattering at an interface, resulting in a finite temperature discontinuity at the interface, as shown in Fig. 6. Interfaces often contribute significantly to the observed properties of materials. This is even more critical for nanoscale systems where interfaces could significantly affect the properties relative to bulk materials.
Nan's fit gives a very high interfacial thermal resistance of 5.9 × 10⁻⁴ m2 K W−1, which is mainly responsible for the significant decrease in thermal conductivity of the composite. Furthermore, inter-particle scattering is neglected in the model because inclusions are considered to be well dispersed in the matrix.23 Overall, in the presented work, two fundamental issues associated with achieving thermally resistive polymer nanocomposite, i.e., uniform filler distribution to provide effective phonon scattering sites and a high interfacial resistance,16 have been addressed successfully. In addition, the non-significance of the tk parameter characterizing the percolation network from GEMT can also be explained. The filler has a high Kapitza resistance and prevents the formation of phonon-conducting pathways, resulting in low lattice thermal conductivity.
4.4 Electrical conductivity
The electrical conductivities for GO–TiO2/PEDOT:PSS nanocomposites as a function of frequency are shown in Fig. 8(a). The pristine PEDOT:PSS and 0.5 wt% GO–TiO2/PEDOT:PSS samples showed the two components of the electrical conductivity as described by Jonscher.25 It was observed that the ac electrical conductivity increased with frequency, which is typical of disordered materials such as oxides and nanocomposites. Electrical conductivity has two characteristic regimes, including a plateau region and a dispersion region. The conductivity was found to be frequency-independent in the plateau region of the low-frequency region. The second region, known as the dispersion region, is located in the high frequency zone, where the conductivity is frequency-dependent and increases sharply with increasing frequency. The observed plateau and dispersion regions correspond, respectively, to the DC and polarization components of electrical conductivities. In the low-frequency region, the tunneling of the polaron induces grain boundary polarization, which manifests as long-range mobility. In the high-frequency region, however, the correlated barrier hopping (CBH) model and short-range mobility are associated with the hopping phenomenon, which is primarily responsible for conduction. The DC conductivity in the low frequency range is caused by the polarization of the grain boundaries.
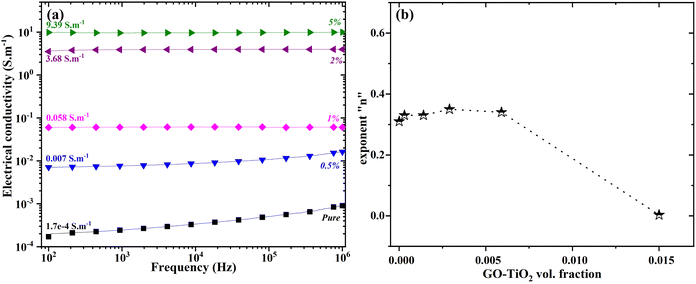 |
| | Fig. 8 (a) The electrical conductivities of GO–TiO2 nanocomposite as a function of frequency, (b) the value of exponent “n” in Jonscher power law as a function of filler vol. fraction. | |
However, the non-linear behavior in Fig. 8(a) was observed to decrease with the addition of the GO–TiO2, and it disappeared entirely after the addition of 1 wt% GO–TiO2. The DC conductivity σDC was calculated by fitting the experimentally obtained data with Jonscher's power law using the formula:22
where,
σac is the frequency dependant ac electrical conductivity,
ω is the angular frequency,
A is the characteristic parameter, and
n is the exponent that defines the conduction mechanism. If the value of
n lies between 0 and 1, a hopping mechanism is expected for the electrical conduction. If it lies between 1 and 2, the superlinear power law defines the electrical conduction. The experimentally obtained data is shown by the symbols, while the theoretical fit data is represented by the solid lines in
Fig. 8. The best-fitting data values estimate the DC electrical conductivity
σDC and the exponent “
n”. The value of the exponent “
n” for polymer nanocomposites as a function of TQDGO vol. fraction is depicted in
Fig. 8(b). It indicates that the value lies between 0 and 1, indicating that the samples' conduction mechanism is a hopping phenomenon.
4.4.1 The generalized effective medium theory (GEMT) for electrical conductivity.
The experimentally obtained electrical conductivity data has already been published in our previous article. The experimentally obtained data was fitted using generalized effective medium theory (GEMT) following the equation:| |  | (12) |
where, σf, σm, and σe represent filler electrical conductivity, matrix electrical conductivity, and composite electrical conductivity.  is a constant that depends on the volumetric percolation threshold ϕC and tσ is the percolation threshold coefficient.
Fig. 9 shows the experimental data with the green symbols and the theoretical fit with the black line. The data fits well with the theory, except for the beginning point. The generalized effective medium theory fitted data gives the values of the tσ, ϕC, σm to be equal to 1.2, 0.1, and 16, respectively, which are closer to the experimental values obtained in this work. The value tσ defines the percolation network, where the value 1.2 describes a two-dimensional percolation network in between the filler entities, also confirmed by the AFM images in Fig. 3. The percolation threshold occurs after the addition of 1 wt% filler, and the electrical conductivity was observed to be enhanced dramatically afterwards.
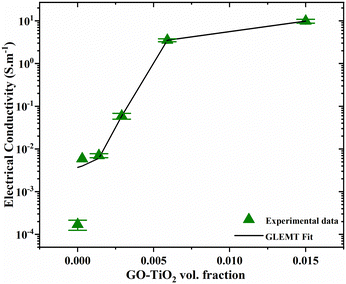 |
| | Fig. 9 Electrical conductivity experimental data fitted by using GEMT for polymer composites as a function of filler wt%. | |
5 Discussion
In this section, the correlation among the TE transport parameters, namely, Seebeck coefficient, electrical conductivity, and thermal conductivity, will be elaborated, and the optimized thermoelectric properties will be discussed.
5.1 Correlation between the Seebeck coefficient and electrical conductivity
Fig. 10(a) represents the Seebeck coefficient plotted against the natural logarithmic values of electrical conductivity. The symbols represent the experimental data; however, the red dashed line represents a linear fit. It shows that the Seebeck coefficient (S) is increasing almost linearly with the electrical conductivity (σ). In general, S and σ have a reciprocal relationship; however, this link has been broken in our situation. This behavior can be attributed to the flower-like structure of the filler. This nanostructured filler served two different purposes: firstly, it filtered out the low-energy charge carriers to enhance the Seebeck coefficient and partially replaced the insulating PSS from the PEDOT to form a long-range conducting network with the conducting PEDOT. More information can be found in our previous article.10 The relationship of the Seebeck coefficient with electrical conductivity can be represented by using Jonker's plot relation according to the equation:26| |  | (13) |
where, σ0 = Nceμ![[thin space (1/6-em)]](https://www.rsc.org/images/entities/i_char_2009.gif) exp(A), and Nc is the density of state of the conduction band, and A is a transport constant with a value in the range of 0–4. The plot of Seebeck coefficient S vs. electrical conductivity is known as a “Jonker plot” and is shown in Fig. 10(a). This plot suggests a linear relationship between Seebeck coefficient and electrical conductivity with a slope of 5.14 μV K−1 indicating the value of kB/e and an intersection on the x-axis indicating the value of the density of state mobility product, i.e., Ncμ = 3.45.
exp(A), and Nc is the density of state of the conduction band, and A is a transport constant with a value in the range of 0–4. The plot of Seebeck coefficient S vs. electrical conductivity is known as a “Jonker plot” and is shown in Fig. 10(a). This plot suggests a linear relationship between Seebeck coefficient and electrical conductivity with a slope of 5.14 μV K−1 indicating the value of kB/e and an intersection on the x-axis indicating the value of the density of state mobility product, i.e., Ncμ = 3.45.
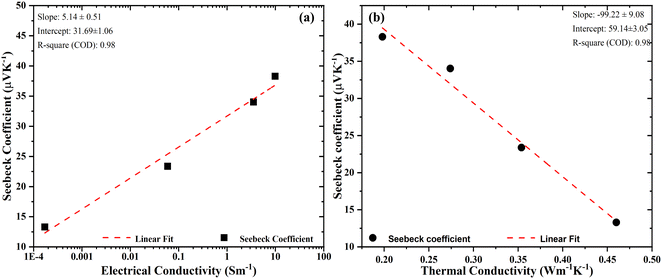 |
| | Fig. 10 Seebeck coefficient as a function of (a) electrical conductivity, data fitted by Jonker's equation, and (b) thermal conductivity. | |
5.2 Correlation between the Seebeck coefficient and thermal conductivity
The interrelationship between the Seebeck coefficient and thermal conductivity was well described by Lin and co-workers.27 They established a link between the energy-filtering effect and the interfacial temperature resistance (Kapitza resistance). They considered a two-phase model consisting of a grain phase and a grain boundary connected in series, which is one of the limitations of GEMT. The model concludes that smaller grain sizes increase the fractional temperature drop across the grain boundary and thus the Seebeck coefficient. Therefore, taking the energy filtering effect and Kapitza resistance into account, the overall global Seebeck coefficient St was shown to be:| |  | (14) |
where, Sg and Sgb are the grain and grain boundary Seebeck coefficients, respectively, κt and κg are the global and grain boundary thermal conductivities, respectively. The term Sg − Sgb < 0 indicates that when St increases, κt decreases. Our results can be analyzed in light of this two-phase model. Fig. 10(b) shows a linear relationship between the total Seebeck coefficient (St) with total thermal conductivity (κt). The symbols show the experimentally acquired values, whereas the dashed lines represent the linear fit. The initial data point within the plotted graph reveals the highest Seebeck coefficient coinciding with the lowest thermal conductivity, suggesting a mutually dependent relationship between the energy filtering effect (responsible for the enhancement of the Seebeck coefficient) and phonon scattering (responsible for lowering the thermal conductivity). The value of interfacial Seebeck coefficient can be extracted by extrapolating the graph at κ = 0, which gives a value of 59 μV K−1. Moreover, these findings indicate that both the energy filtering effect and phonon scattering arise from the same sites, specifically the filler material GO–TiO2. Consequently, the filler doesn't only act as the phonon scattering sites but also as the energy filtering sites to reduce the lattice thermal conductivity and mutually enhance the electrical conductivity and Seebeck coefficient.
5.3 Optimizing thermoelectric properties through synergistic transport property optimization
Thermoelectric power factor (PF) and figure of merit (ZT), along with all other TE parameters, are indicated in Fig. 11 as a function of charge carrier concentration. The charge carrier concentration was calculated from the impedance spectroscopy data. The calculations have been published in our previous article. The maximum values of power factor and ZT were obtained to be 0.013 W m−1 K−2 and 10−5, respectively, with an addition of 5 wt% GO–TiO2. All the TE parameters initially showed an enhancement with the carrier concentration and attained a maximum value of n 5.8 × 10²¹ before starting to decrease. However, thermal conductivity follows the opposite trend. The co-occurrence of a high Seebeck coefficient and a low thermal conductivity has a synergistic effect, resulting in an improved value of the dimensionless figure of merit, ZT. The highlighted region in Fig. 11 shows the optimized region for the best compromise among all the TE parameters and corresponds to the best TE properties of the nanocomposite.
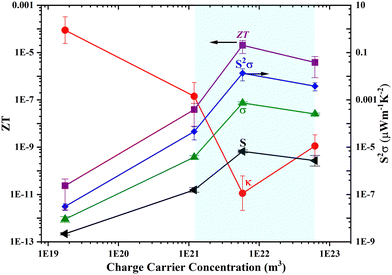 |
| | Fig. 11 Evolution of the thermoelectric figure of merit ZT (purple), power factor (blue), electrical conductivity (green), Seebeck coefficient (black), and thermal conductivity (red) as a function of charge carrier concentration The highlighted region shows the optimized region for the best TE performance of the nanocomposite. | |
The optimized TE parameters for the nanocomposite were largely obtained due to carrier energy filtering,28,29 quantum confinement,30 nanoscale defects,31etc. The addition of GO–TiO2 in the PEDOT:PSS matrix might shift the Fermi level towards the near valence band, resulting in an increase in carrier concentration. The work done by Shi et al.32,33 on Tos doping of PEDOT confirms the shifting of Fermi levels towards the valence band and hence dramatically enhances the electrical conductivity. This kind of phenomenon mostly occurs in highly disordered and heterogeneous interfaces, and this is of even greater importance for nanoscale systems, where interfaces can substantially alter the properties of bulk materials. Due to this fact, the thermal conductivity of bulk materials is higher than that of their nanoscale counterparts, which has already been reported for Bi2Te3 and silicon nanowire nanocomposites.18,34 The enhancement in electrical conductivity with a decrease in thermal conductivity behavior was similar to that of the rGO–TiO2 nanocomposite reported by Nam et al.35
6 Conclusions
In this work, we have successfully implemented various models to explain the experimental results. The current study provides a thorough understanding of the role of heterogeneous nanostructure, providing interfacial thermal resistance, in optimizing the TE parameters. The findings are particularly useful in identifying the relative importance of electron conduction and phonon scattering in this regard. The filler GO–TiO2 acted as energy filtering sites to scatter off low energy charge carriers to enhance the Seebeck coefficient and also offered a high interfacial thermal resistance to selectively decrease lattice thermal conductivity. Therefore, the interdependent relationship of TE parameters was sorted. Nevertheless, the performance of the nanocomposite is still quite low in bulk pellets; however, the improved performance in thin films has already been published in our previous article.
Author contributions
Shivani Shisodia (conceptualization, data curation, formal analysis, investigation, methodology, visualization, writing – original draft, writing – review editing), Abdelhak Hadj Sahraoui (validation, visualization, funding acquisition, project administration, supervision, writing – review editing, resources), Dharmendra Pratap Singh (validation, visualization, supervision, writing – review editing), Benoit Duponchel (data curation and software), Michael Depriester (conceptualization, investigation, validation, visualization, funding acquisition, project administration, supervision, writing – review editing, resources, software).
Conflicts of interest
There are no conflicts to declare.
Acknowledgements
The authors are thankful to Mr Benoit Escorne for his technical support. The authors acknowledge anonymous referees' insightful comments and suggestions. Université du Littoral Côte d'Opale and Université de Lille are acknowledged for providing the financial support to carry out this work. This work is a part of Shivani Shisodia's PhD work and her PhD was funded by the Université du Littoral Côte d'Opale, Dunkerque, France and Université de Lille, Lille, France.
Notes and references
- Y. F. Wang, T. Sekine, Y. Takeda, K. Yokosawa, H. Matsui, D. Kumaki, T. Shiba, T. Nishikawa and S. Tokito, Sci. Rep., 2020, 10, 2467–2474 CrossRef CAS PubMed.
- Y. Yang, Z.-H. Lin, T. Hou, F. Zhang and Z. L. Wang, Nano Res., 2012, 5, 888–895 CrossRef CAS.
- M. Jung, S. Jeon and J. Bae, RSC Adv., 2018, 8, 39992–39999 RSC.
- M. Jonson and G. D. Mahan, Phys. Rev. B: Condens. Matter Mater. Phys., 1980, 21, 4223–4229 CrossRef CAS.
- J. Jacob, U. Rehman, K. Mahmood, A. Ali, A. Ashfaq, N. Amin, S. Ikram, M. Alzaid and K. Mehboob, Phys. Lett. A, 2021, 388, 127034 CrossRef CAS.
- J. Atoyo, M. R. Burton, J. McGettrick and M. J. Carnie, Polymers, 2020, 12, 559–575 CrossRef CAS PubMed.
- X. Guan, W. Feng, X. Wang, R. Venkatesh and J. Ouyang, J. Am. Chem. Soc., 2020, 12, 13013–13020 CAS.
-
G. S. Nolas, J. Sharp and H. J. Goldsmid, The Phonon—Glass Electron-Crystal Approach to Thermoelectric Materials Research, Thermoelectrics, Springer, Berlin Heidelberg, 2001 DOI:10.1007/978-3-662-04569-5_6.
- A. Tavkhelidze, Nanotechnology, 2009, 20, 405401 CrossRef PubMed.
- S. Shisodia, B. Duponchel, G. Leroy, A. Hadj Sahraoui, D. P. Singh, C. Poupin, L. Tidahy, R. Cousin, P. Ropa and M. Depriester, Sustainable Energy Fuels, 2022, 7, 3158–3168 RSC.
- J. A. Garcia, A. Mandelis, B. Farahbakhsh, C. Lebowitz and I. Harris, Int. J. Thermophys., 1999, 2, 1587–1602 CrossRef.
- M. Depriester, P. Hus, S. Delenclos and A. Hadj Sahraoui, Rev. Sci. Instrum., 2007, 78, 036101–036105 CrossRef CAS PubMed.
- M. Depriester, P. Hus, S. Delenclos and A. H. Sahraoui, Rev. Sci. Instrum., 2005, 76, 074902–074909 CrossRef.
- A. Kusiak, J. Martan, J.-L. Battaglia and R. Daniel, Thermochim. Acta, 2013, 556, 1–5 CrossRef CAS.
-
R. C. Dante, Metals, Handbook of Friction Materials and their Applications, Elsevier, 2016, vol. 9, pp. 123–134 Search PubMed.
- S. T. Huxtable, D. G. Cahill, S. Shenogin, L. Xue, R. Ozisik, P. Barone, M. Usrey, M. S. Strano, G. Siddons, M. Shim and P. Keblinski, Nat. Mater., 2003, 2, 731–734 CrossRef CAS PubMed.
- C.-W. Nan, G. Liu, Y. Lin and M. Li, Appl. Phys. Lett., 2004, 85, 3549–3551 CrossRef CAS.
- M. Singh, K. K. Hlabana, S. Singhal and K. Devlal, J. Taibah Univ. Sci., 2016, 10, 375–380 CrossRef.
- R. Hanus, R. Gurunathan, L. Lindsay, M. T. Agne, J. Shi, S. Graham and G. Jeffrey Snyder, Appl. Phys. Rev., 2021, 8, 031311–031353 CAS.
- X. Wei, Z. Wang, Z. Tian and T. Luo, J. Heat Transfer, 2021, 143, 072101–072130 CrossRef CAS.
- C. Genovese, A. Antidormi, R. Dettori, C. Caddeo, A. Mattoni, L. Colombo and C. Melis, J. Phys. D: Appl. Phys., 2024, 50, 494002 CrossRef.
- D. S. McLachlan, M. Blaszkiewicz and R. E. Newnham, J. Am. Ceram. Soc., 1990, 73, 2187–2203 CrossRef CAS.
- C.-W. Nan, R. Birringer, D. R. Clarke and H. Gleiter, J. Appl. Phys., 1997, 81, 6692–6699 CrossRef CAS.
- K. Fedaoui, S. Madani and T. Kanit, U.P.B. Sci. Bull., Series D, 2016, 78, 91–100 Search PubMed.
- A. K. Jonscher, J. Phys. D: Appl. Phys., 1999, 32, 57–70 CrossRef.
- G. H. M. Jonker, Philips Res., 1968, 23, 131–138 Search PubMed.
- Y. Lin, M. Wood, K. Imasato, J. J. Kuo, D. Lam, A. N. Mortazavi, T. J. Slade, S. A. Hodge, K. Xi, M. G. Kanatzidis, D. R. Clarke, M. C. Hersam and G. J. Snyder, Energy Environ. Sci., 2020, 13, 4114–4121 RSC.
- Z. Zhou, J. Li, Y. Fan, Q. Zhang, X. Lu, S. Fan, K. Kikuchi, N. Nomura, A. Kawasaki, L. Wang and W. Jiang, Scr. Mater., 2019, 162, 166–171 CrossRef CAS.
- J. Peng, L. Fu, Q. Liu, M. Liu, J. Yang, D. Hitchcock, M. Zhou and J. He, J. Mater. Chem. A, 2014, 2, 73–79 RSC.
- J. Mao, Z. Liu and Z. Ren, npj Quantum Mater., 2016, 1, 1–9 Search PubMed.
- Q. Zhang, X. Ai, L. Wang, Y. Chang, W. Luo, W. Jiang and L. Chen, Adv. Funct. Mater., 2015, 25, 966–976 CrossRef CAS.
- W. Shi, T. Zhao, J. Xi, D. Wang and Z. Shuai, J. Am. Chem. Soc., 2015, 137, 12929–12938 CrossRef CAS PubMed.
- O. Bubnova, Z. U. Khan, H. Wang, S. Braun, D. R. Evans, M. Fabretto, P. Hojati-Talemi, D. Dagnelund, J.-B. Arlin, Y. H. Geerts, S. Desbief, D. W. Breiby, J. W. Andreasen, R. Lazzaroni, W. M. Chen, I. Zozoulenko, M. Fahlman, P. J. Murphy, M. Berggren and X. Crispin, Nat. Mater., 2014, 13, 190–194 CrossRef CAS PubMed.
- J.-F. Li, W.-S. Liu, L.-D. Zhao and M. Zhou, NPG Asia Mater., 2010, 2, 152–158 CrossRef.
- W. H. Nam, Y. S. Lim, W. Kim, H. K. Seo, K. S. Dae, S. Lee, W.-S. Seo and J. Y. Lee, Nanoscale, 2017, 9, 7830–7838 RSC.
|
| This journal is © The Royal Society of Chemistry 2024 |
Click here to see how this site uses Cookies. View our privacy policy here.  Open Access Article
 *a,
Abdelhak Hadj
Sahraoui
a,
Benoit
Duponchel
a,
Dharmendra Pratap
Singh
 b and
Michael
Depriester
a


 is a constant that depends on the volumetric concentration percolation threshold ϕC and tk is the critical exponent.


 is a constant that depends on the volumetric percolation threshold ϕC and tσ is the percolation threshold coefficient.

![[thin space (1/6-em)]](https://www.rsc.org/images/entities/i_char_2009.gif) exp(A), and Nc is the density of state of the conduction band, and A is a transport constant with a value in the range of 0–4. The plot of Seebeck coefficient S vs. electrical conductivity is known as a “Jonker plot” and is shown in Fig. 10(a). This plot suggests a linear relationship between Seebeck coefficient and electrical conductivity with a slope of 5.14 μV K−1 indicating the value of kB/e and an intersection on the x-axis indicating the value of the density of state mobility product, i.e., Ncμ = 3.45.
exp(A), and Nc is the density of state of the conduction band, and A is a transport constant with a value in the range of 0–4. The plot of Seebeck coefficient S vs. electrical conductivity is known as a “Jonker plot” and is shown in Fig. 10(a). This plot suggests a linear relationship between Seebeck coefficient and electrical conductivity with a slope of 5.14 μV K−1 indicating the value of kB/e and an intersection on the x-axis indicating the value of the density of state mobility product, i.e., Ncμ = 3.45.


