 Open Access Article
Creative Commons Attribution 3.0 Unported Licence
Enhanced electrochemical dissolution of iridium oxide in acidic electrolytes through presence of metal ions: shortened lifetime and hope for recovery
Raghunandan
Sharma
 *a,
Per
Morgen
a,
Darko
Makovec
 b,
Saso
Gyergyek
 b and
Shuang Ma
Andersen
 *a
*a
aDepartment of Green Technology, University of Southern Denmark, Odense M 5230, Denmark. E-mail: rash@igt.sdu.dk; mashu@igt.sdu.dk
bDepartment for Materials Synthesis, Jozef Stefan Institute, Ljubljana 1000, Slovenia
First published on 28th June 2024
Abstract
Nanoparticulate Ir-oxides are frequently used as highly active and robust anode electrocatalysts for acidic water electrolyzers. While their dissolution during the electrolyzer operation is unsought, it could be a green route for recovery of Ir from the spent electrodes. In this study, we explore such a possibility and show that the electrochemical dissolution of Ir-oxides during a potential cycling treatment can be enhanced by introducing transition metal ions (such as Cu2+) in the acidic electrolyte. Dissolution of Ir from a nanoparticulate Ir-oxide containing electrode through potential cycling between 0.0 and 1.65 V in 1 M HCl increases by a factor of ∼3 in the presence of low concentrations (e.g. 10 mM) of Cu2+. Impact of the presence of the metal ions on the Ir-oxide dissolution mechanism is characterized. Cyclic deposition and stripping of the Cu2+ ion on the Ir-oxide may be attributed to the enhanced Ir dissolution, as evidenced by cyclic voltammograms studied in detail for Cu2+. Apart from exploration of the possibility of the electrochemical dissolution-based recovery of Ir from the spent Ir-oxide electrocatalysts, the study highlights the generally negative impacts of the presence of certain metal ions in the feedstock water on the electrocatalyst durability in acidic water electrolysis. Outcomes of this study are highly relevant for the fast-growing acidic water electrolysis industry.
Sustainability spotlightGreen hydrogen production based on water electrolysis is adopted by many advanced nations. A key bottleneck for the PEM electrolysis technology is the use of iridium, a critical raw material with high industrial demand but limited primary production, which requires – recycling. Current work presents a potentiodynamic process to dissolve Ir, as an essential step for Ir recycling. The dissolution process can be further enhanced by presence of other metal ions (e.g. Cu2+) in the electrolyte due to cyclic deposition and stripping of the metal on Ir-oxide. The electrochemical recycling route is efficient, green and sustainable, which aligns well with SDG 7, 12, 13, & 17. |
Introduction
The industry of hydrogen-based renewable power, where hydrogen is used as a power carrier, is expanding fast and is judged to have enormous potential for further growth.1,2 Polymer electrolyte membrane (PEM) water electrolyzers (PEMWEs) and PEM fuel cells are among the prominent technologies, respectively for the electricity-to-hydrogen and the hydrogen-to-electricity conversions through electrochemical routes under acidic conditions. One of the major obstacles hindering further commercialization of these technologies is their current dependance on the platinum group metals (PGMs) and/or their compounds1,3 as the preferred electrocatalysts to catalyze both the cathode and anode electrochemical reactions. For example, nanosized Pt/Pt-alloys (2-5 nm) supported on carbon is used as the state-of-the-art cathode/anode electrocatalyst for PEM fuel cells, while Ir-oxide (IrOx) is considered the most efficient and durable electrocatalyst at the PEMWE anode, where high activity towards the oxygen evolution reaction (OER), i.e., the anode reaction during the electrolysis of water under acidic conditions, is essential. Apart from electrocatalysis, iridium and/or Ir-oxide nanoparticles also have versatile applications in areas including heterogeneous catalysis of chemical reactions such as hydrogenation,4,5 in biomedicine,6 and in sensors,7,8etc.However, owing to the low abundance of the PGMs in the upper earth crust,9 their large-scale extraction from the natural deposits to fulfill the growing industrial demands is neither economic nor sustainable. Therefore, recycling the PGMs from their secondary sources such as spent catalytic bodies would be inevitable to attain a continuous and sustainable supply. Although the well-established pyrometallurgical and/or hydrometallurgical routes10–12 used for extraction of PGMs can be applied to reclaim the metals from the spent electrocatalytic bodies, there are certain disadvantages of these processes. Apart from being energy and infrastructure incentive, the conventional PGM extraction routes are unsuitable for the recovery from PEM-based electrocatalysts due to the fact that combustion of catalytic bodies typically containing perfluorinated sulfonic-acid (PFSA) ionomers produces environmentally hazardous fluorocarbons.13,14 Therefore, an environmentally-friendly recycling of the PGM-based electrocatalysts by using mild conditions (dilute acids, no combustion)15–19 has attracted substantial scientific and technological interests.
Electrochemical dissolution of Pt from spent PEM fuel cell electrodes is being studied by us and several other groups.20–29 However, Ir and Ir-oxides, reputed as an extremely corrosion resistant metal, is difficult to recycle through chemical/electrochemical dissolution. However, nanoparticulate iridium-based electrocatalysts, owing to their high surface-to-volume ratio, show significant tendency towards electrochemical dissolution, especially, under the OER-active potential window, leading to a challenge for their long-term stability in the PEMWE anode electrocatalyst.30–32 The electrochemical dissolution takes place predominantly through formation of unstable oxidation states of Ir and depends critically on the catalyst structure.30 However, studies towards the recovery of Ir from spent PEMWEs using electrochemical dissolution are rarely reported. In a recent study, Moriau et al. have studied dissolution of Ir in acidic solutions (HClO4 and HCl) in the presence of organic solvents and have shown an enhanced (40×) rate of Ir dissolution in the HCl-based electrolyte as compared to that in the HClO4-based solution.33 Such studies, investigating electrochemical dissolution assisted recycling of Ir-based electrocatalysts are of substantial scientific interest and technological importance.
As another aspect, to be efficient and accessible around the globe, the coming large-scale water electrolysis plants should be able to operate using low-purity waters such as seawater that contain significant amounts of metal ions among other impurities.34 Among other challenges towards development of the impurity tolerant water electrolyzers, presence of certain impurity metal ions in the feedstock water has been reported to affect the OER activity and stability of the anode electrocatalysts adversely.35 Therefore, further studies focused on the dissolution of Ir from the Ir-oxide anode electrocatalysts in the presence of different metal ions would benefit the development of impurity tolerant OER electrocatalysts.
We here report a study on potentiodynamic dissolution of IrOx in dilute acidic electrolytes (1 M HCl) in the presence of different metal ions. The dissolution of Ir was studied by varying different experimental parameters, namely the electrolyte compositions (type of acid, concentration of Cu2+ and/or presence of other metal ions) and/or the potentiodynamic treatment conditions. Different metals with standard reduction potentials ranging between ∼−0.3 V and ∼0.8 V vs. the reversible hydrogen electrode (RHE) were studied. Structural and electrochemical characterizations were performed to understand the effects of the metal ions on the dissolution mechanisms.
Experimental methods
Materials
Ultrapure water (Milli-Q; resistivity ≥18.2 MΩ cm at 25 °C) was used for dilution purposes to prepare the electrolytes and the catalyst dispersions. Hydrochloric acid (1 M HCl; Reagent Ph. Eur.; BDH chemicals), perchloric acid (HClO4; assay: 98%, Sigma-Aldrich®), were used to prepare different aqueous electrolytes. Unless stated otherwise, high purity metal chlorides were used to prepare the electrolytes containing different metal ions. Commercially available Ir-oxide (IrOx; Alfa Aesar), isopropanol (CH3–CH(OH)–CH3; HPLC grade; purity: >99.9%; Sigma-Aldrich®) and perfluorinated sulfonic-acid (PFSA) ionomer dispersion (5 wt% Nafion® from Ion Power, Dupont D521) were used respectively as the model electrocatalyst, the dispersion medium along with ultrapure water, and the ionomer phase in the catalyst ink.Working electrode preparation
The working electrode (WE) was prepared by modifying a 5 mm diameter glassy carbon (GC) rotating disc electrode (RDE) from Pine Instruments. Firstly, GC RDE was polished to mirror finish using 5 μm – followed by 0.5 μm alumina slurry. A stock solution consisting of water, isopropanol and 5 wt% Nafion® in a volumetric proportion of 78.16, 20, 1.84 was used to prepare the catalyst ink by dispersing 10 mg of the IrOx powder in 5 mL of the stock solution by ultrasonication for 60 s using a Hielscher UP200 St ultrasonic homogenizer. The ink composition was chosen to obtain a catalyst/ionomer weight ratio of 70/30. Further, the WE was prepared by drop casting 10 μL of the catalyst ink on the cleaned GC RDE and drying it at ambient conditions while spinning at 700 rpm.Electrochemical setup and protocols
A three electrode setup consisting of the IrOx electrocatalyst modified GC RDE as the WE, a Pt counter electrode (CE) and a double junction Ag/AgCl reference electrode (RE; inner junction: sat. KCl; outer junction: sat. K2SO4; Aldrich) was used for the electrochemical studies. The three-electrode setup placed in a cleaned glass cell (Pyrex) containing 25 mL of an electrolyte, and it was attached to a Zahner®IM6e electrochemical workstation. The electrolyte was continuously purged with nitrogen before (ca. 30 min) and during the electrochemical measurements, where no rotation was applied to the WE. All the potentials measured against the Ag/AgCl RE (after ∼70% compensation of the series resistance) were converted to their corresponding values w.r.t. the RHE. In a typical experiment to study the electrochemical dissolution of Ir, the WE was subjected to a potential cycling at a specified scan rate or combination thereof between specified potential windows for specified number of cycles, as stated appropriately throughout the text. Effects of potential windows, numbers of cycles and electrolytes on the dissolution of Ir were investigated.Dissolution quantification
The iridium amounts present on the WE (Ir-loading) were measured using an X-ray fluorescence spectrometer (XRF; Thermo Scientific Niton XL3t GOLDD + XRF analyzer). The XRF analyzer was calibrated using a procedure described in our earlier publication.36 In brief, linear relationship between the amounts of Ir (0 μg to ∼100 μg) loading and the XRF intensity was confirmed by recording the XRF spectra for different amounts of Ir. The linear relationship was used to calibrate the instrument for determination of the Ir loadings on WE before and after the electrochemical treatment. The determined Ir-loading values were used to estimate the per cent wise degree of dissolution of Ir (Irdiss%) from the electrode during the electrochemical treatment (eqn (1)).The dissolution percentage, was calculated using the following equation:
 | (1) |
Structural characterizations
Evolution of the structural characteristics of the IrOx during electrochemical treatments was investigated through morphological, elemental- and surface chemical state analyses. The as-received IrOx sample was characterized with a transmission electron microscope (TEM) using a JEOL-JEM 2100, which was operated at 200 kV. Further, bulk structural characterization through X-ray diffraction (XRD) was performed using a Rigaku Miniflex 600 X-ray diffractometer equipped with unfiltered Cu Kα radiation source. The diffractogram was recorded at a scan rate of 3° min−1 and at a step size of 0.02°.Further, the IrOx catalyst ink samples removed from the GC RDEs before and after electrochemical treatments were studied through scanning TEM (STEM) using a JEOL ARM 200CF STEM operated at 80 kV. High angle annular dark field (HAADF) and annular bright field (ABF) detectors were used simultaneously, where the collection semi angles were varied respectively between 68 and 180 mrad and between 10 and 16 mrad. The elemental compositions of the samples were determined through energy-dispersive X-ray spectroscopy (EDS) using a JEOL Centurio EDS system equipped with a 100 mm2 silicon drift detector. Finally, surface chemical state evolution of the IrOx samples was studied using X-ray photoelectron spectroscopy (XPS) using a SPECS® system equipped with a dual anode X-ray source and a hemispherical analyzer. Mg Kα (1253.6 eV) radiation was used to acquire the XPS spectra, where the pass energies for the survey and the narrow scan spectra were set respectively to 50 eV and 25 eV, with the effective spectral resolutions at 2.5 eV and 1.0 eV, respectively.
Results and discussion
Structure of IrOx catalyst
Comprehensive structural analysis of the selected commercial IrOx electrocatalyst has been reported in our previous study37 (Sample ID: IrOx-02). In brief, as revealed from the TEM image of Fig. 1a, the IrOx sample consists of large agglomerates (30–50 nm) of smaller nanoparticles of ∼2 nm. The inset selected area electron diffraction (SAED) pattern shows diffraction rings corresponding to metallic Ir along with low intensity rings characteristic for tetragonal (Space group P42/mnm) IrO2.30,38 Further the XRD pattern of the sample (Fig. 1b) also shows relatively intense and sharp diffraction peaks corresponding to metallic Ir, along with the broad diffraction peaks corresponding to tetragonal IrO2. Hence, the sample consists of metallic Ir along with the IrO2 nanoparticles. Our previous analysis of synchrotron XRD data confirmed the weight fractions of Ir metal and IrO2 in the sample to be <0.1 and >0.9, respectively.37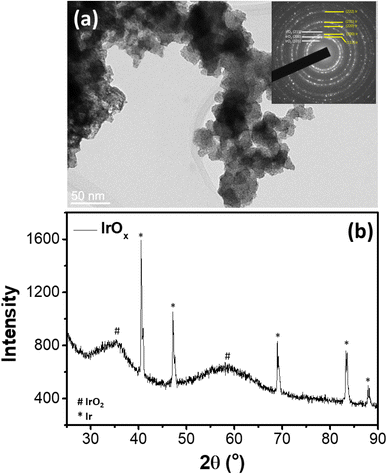 | ||
| Fig. 1 (a) TEM image and (b) XRD pattern37 of the studied IrOx sample. | ||
Effect of metal ions on Ir dissolution
Effect of the presence of certain other metal ions on the dissolution of Ir from an IrOx modified GC RDE subjected to a potential cycling in 1 M HCl was studied. Inspired by the enhanced dissolution of Pt found earlier through potential cycling in the presence of Cu2+, different metal ions having standard reduction potentials close to that of Cu2+ are now studied. Here, the IrOx modified GC RDEs (identically prepared) were subjected to an activation potential cycling (100 cycles between 0 and 1.65 V at 1 V s−1) followed by a stress cycling (100 cycles between 0 and 1.65 V at 100 mV s−1) in different electrolytes consisting of 1 M HCl and metal chlorides (metal ion concentration: 5 mM). A summary of the studied metal ions is shown in Table 1. It is evident that presence of Cu2+ enhances the Ir dissolution most efficiently, followed by Ru3+, Mo3+, Bi3+ and Ni2+. Other metal ions, namely Co2+, Rh3+ and [PtCl6]2− decrease the Ir dissolution. Owing to the highest Ir dissolution observed in its presence, this study is restricted to the Cu2+ ion hereafter.| Metal ion (Mx+)/complex | Counter ion | Standard reduction potential (V)39 (Mx+ → M0) | Ir dissolution (%) |
|---|---|---|---|
| Rh3+ | Cl− | 0.758 | 13 |
| Co2+ | Cl− | −0.280 | 13 |
| Ni2+ | Cl− | −0.257 | 20 |
| Mo3+ | Cl− | −0.200 | 23 |
| Bi3+ | Cl− | 0.308 | 21 |
| Cu2+ | Cl− | 0.342 | 34 |
| Cu2+ | SO42− | 0.342 | 32 |
| Ru3+ | Cl− | 0.249 (Ru3+ → Ru2+) | 32 |
| 0.455 (Ru2+ → Ru) | |||
| Rh3+ | Cl− | 0.758 | 13 |
| [PtCl6]2− | H+ | 0.775 ([PtCl6]2− + 2e− → [PtCl4]2− + 2Cl−) | 7 |
| 0.68 ([PtCl4]2− + 2e− → Pt + 4Cl−) | |||
| None | NA | 0.866 ([IrCl6]3− + 3e− → Ir + 6Cl−) | 16 |
| 0.77 (Ir3+ → Ir) |
To investigate the effect of anion, dissolution of Ir was also studied in 1 M HCl containing 5 mM of CuSO4. As shown in Table 1, irrespective of the anion type, presence of Cu2+ enhances the Ir dissolution significantly. The marginally higher Ir dissolution in the presence of CuCl2 compared to that in the presence of CuSO4 may be attributed to factors such as (i) the measurement uncertainty, (ii) the slightly higher concentration of Cl− in the former case and (ii) adsorption of SO42− on the Ir-oxide surface.
Electrochemistry of IrOx in electrolytes with/without Cu2+
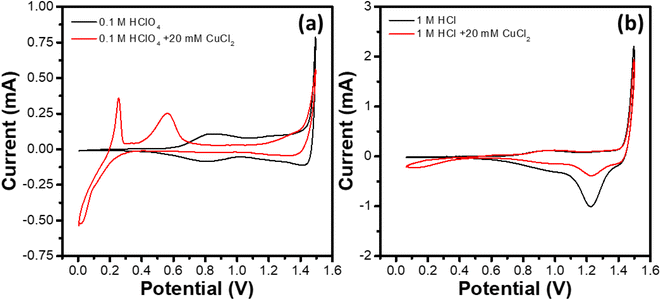
IrOx electrochemistry in four different electrolytes, namely 1 M HCl, 1 M HCl + 20 mM CuCl2, 0.1 M HClO4 and 0.1 M HClO4 + 20 mM CuCl2 was studied. Fig. 2 shows the cyclic voltammograms (CVs) of the GC RDEs modified with the IrOx electrocatalyst ink. To record the voltammogram in a certain electrolyte, the WE was activated by subjecting it to a potential cycling for 20 cycles between 0.0 and 1.2 V at a scan rate of 100 mV s−1. Further, 2 cycles were recorded at a scan rate of 10 mV s−1 between the specified potential window and the second cycle was shown here. Although no rotation was applied to the WE for removal of the generated gas bubbles,40 no visible accumulation of bubbles on WE was observed during the CV recording.The CVs recorded in the absence of Cu2+ ions show characteristic features of the IrOx. The broad current peak centered around 0.7 V in the negative-going scan of the CV recorded in 0.1 M HClO4 (Fig. 2a) corresponds to the reduction of Ir4+ to Ir3+, while the corresponding broad oxidation peak (Ir3+ → Ir4+) appears at ∼0.8 V in the positive-going scan of the CV.41,42 The onset of the OER can be observed in the positive-going scan at ∼1.4 V. Despite the presence of metallic Ir in the sample, no activity towards hydrogen adsorption/desorption is observed for the IrOx catalyst, unlike that reported for metallic Ir.43,44 This may be due to coverage of the metallic Ir core with the IrO2 shell and hence no immediate active participation of the core in the electrochemistry. Further, the CV of the IrOx electrocatalyst in the 0.1 M HClO4 + 20 mM CuCl2 electrolyte exhibits significantly different characteristics compared to that of the CV in the absence of Cu2+ ions. The reduction peaks corresponding to the underpotential and bulk depositions of Cu can be observed during the negative-going scan (potentials <0.4 V).45–47 The positive-going scan shows the oxidation peaks centered at ∼0.25 and ∼0.55 V, corresponding to the dissolution of bulk Cu and the desorption of the underpotentially deposited Cu adlayer, respectively.48,49 The onset of OER is not affected significantly by the presence of CuCl2. However, a peak current (at 1.5 V) lower than the corresponding value in the absence of CuCl2 is observed, which could be attributed to the coverage of OER active sites by adsorption of Cl− at the potentials close to the OER onset, as reported in earlier studies on different metal surfaces such as Ir,50 Pt,51 Au,52etc.
Similarly, 1 M HCl electrolyte (Fig. 2b), the CV shows the characteristic peaks corresponding to the Ir3+ ↔ Ir4+ redox couple shifted towards higher potentials by ∼0.1 V compared to the corresponding peaks in 0.1 M HClO4. The current value at 1.5 V is observed to be higher compared to that in 0.1 M HClO4 electrolyte, and a reduction peak at ∼1.25 V during the negative-going scan is observed. The observations may respectively be attributed to the evolution of Cl2 and the reduction of the surface adsorbed Cl (Cl + e− → Cl−). In the presence of Cu (electrolyte: 1 M HCl + 20 mM CuCl2), deposition of Cu for the potentials <0.5 V during negative-going cycle is evident. However, the extent of Cu deposition is reduced significantly compared to that in the 0.1 M HClO4 + 20 mM CuCl2 electrolyte. Similarly, the Cu stripping peaks (bulk/underpotentially deposited Cu) are not prominent. Also, the Cl-reduction peak at ∼1.25 V during the negative-going scan shows relatively reduced intensity compared to that in 1 M HCl, probably due to the surface deposition of more stable species such as Cu-oxides on the IrOx electrocatalyst that limit access to the active sites for Cl− adsorption.
Potentiostatic dissolution of Ir
For a fair comparison, Ir dissolution in the 1 M HCl and 1 M HCl + 20 mM CuCl2 electrolytes in the absence of an applied potential was studied by holding the identically prepared IrOx modified GC RDEs in the electrolytes for 60 min, a time equivalent to those required in the experiments involving electrochemical treatments (activation and potential cycling). Furthermore, the effect of convection in the electrolyte on the Ir dissolution was also studied by holding the same electrode for another 60 min while stirring the electrolyte. As shown in Table 2, no significant dissolution of Ir from the IrOx modified GC RDE takes place in either of the electrolyte (with/without Cu2+). Also, stirring the electrolytes at 500 rpm did not enhance the Ir loss from the electrode, which confirmed the IrOx coating on the GC RDE to be robust and excluded the possibility of significant Ir loss due to physical detachment of the catalyst layer during the potentiodynamic treatments. It is also noticeable that the Ir losses (wt%) for initial holding for 60 min. in still electrolytes are higher compared to those observed for the holding the same electrodes in the electrolytes being stirred. However, the Ir losses due to holding with/without stirring are insignificant compared to those observed during the experiments involving potentiodynamic treatments. Again, as Cu2+ can reduce to Cu+ in chloride baths53,54 and the later may be responsible for the enhanced Ir dissolution in the presence of Cu2+, effect of the presence of Cu+ on Ir dissolution was studied by exposing the Ir-oxide coated electrode to the 1 M HCl + 20 mM CuCl electrolyte for 60 min (no potential applied). As shown in Table 2, no significant dissolution of Ir takes place in the presence of Cu+. This confirms that the Ir dissolution mechanism may not be attributed to the formation of Cu+ intermediate and its reaction with the Ir-oxide.| Electrolyte composition | Treatment | Ir dissolution (%) |
|---|---|---|
| 1 M HCl | Holding for 60 min without stirring; no potential applied | 1.7 |
| 1 M HCl | Holding for 60 min with stirring (rpm 500); no potential applied | 1.1 |
| 1 M HCl + 20 mM CuCl2 | Holding for 60 min without stirring; no potential applied | 1.8 |
| 1 M HCl + 20 mM CuCl2 | Holding for 60 min with stirring (rpm 500); no potential applied | 0.2 |
| 1 M HCl + 20 mM CuCl | Holding for 60 min without stirring; no potential applied | 0.3 |
Potentiodynamic dissolution of Ir below OER onset potentials (0.1 to 1.2 V)
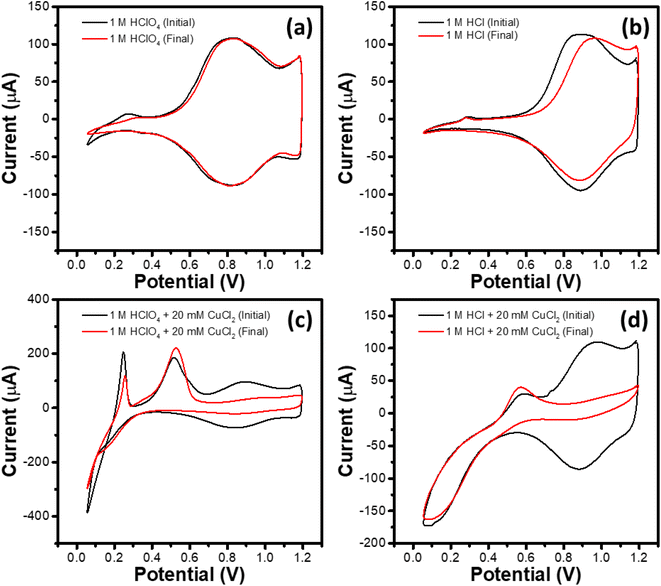
This set of experiments consisted of four identically prepared WEs subjected to a potentiodynamic treatment in different electrolytes, namely 1 M HClO4, 1 M HClO4 + 20 mM CuCl2, 1 M HCl and 1 M HCl + 20 mM CuCl2. The potentiodynamic treatment consisted of (i) activation cycling for 20 cycles at 100 mV s−1 between 1.2 and 0.0 V (start potential: 1.2 V, end potential: 1.2 V), (ii) stress cycling for 1600 cycles at 1 V s−1 between 1.2 and 0.1 V (start potential: 1.2 V, end potential: 1.2 V) along with (iii) intermittent observation cycling for 2 cycles at 10 mV s−1 between 1.2 and 0.1 V (start potential: 1.2 V, end potential: 1.2 V) after specified number (0, 20, 100, 200, 300, 400, 500, 600, 800, 1000, 1200, 1400 and 1600) of stress cycles. The second cycle of the observational CV recorded after the 0th and the 1600th stress cycles, labeled respectively as the initial and final CVs, are shown in Fig. 3a–d for different electrolytes studied here.As can be seen in Fig. 3a, no significant difference in the initial and final CV plots has been observed in 1 M HClO4 electrolyte. The CVs show the current peaks corresponding to the Ir3+ ↔ Ir4+ redox couple, as described earlier. Weak peaks corresponding to hydrogen adsorption (negative-going scan; potential <0.4 V) and desorption (positive-going scan; potential <0.4 V) are also observed for the initial CV, which become less significant for the final CV after 1600 stress cycling. Initial and final CVs for the WE subjected to the stress cycling in 1 M HCl (Fig. 3b) show similar characteristics in the hydrogen adsorption/desorption region. However, compared to that in 1 M HClO4 electrolyte, the Ir3+ ↔ Ir4+ redox couple for the initial CV in 1 M HCl shifts towards higher potentials. For the final CV, the shift increases further towards higher potentials, especially for the oxidation reaction (Ir3+ → Ir4+) during positive-going scan.
Initial and final CVs for the 1 M HClO4 + 20 mM CuCl2 and the 1 M HCl + 20 mM CuCl2 electrolytes are shown respectively in Fig. 3c and d, where the CVs exhibit characteristic features corresponding to Cu deposition and dissolution and the Ir3+ ↔ Ir4+ redox couple. Notably, in both the electrolytes containing Cu2+, the region corresponding to the Ir3+ ↔ Ir4+ redox couple shrinks during the stress cycling. Table 3 summarizes the per cent wise dissolution of Ir during the stress cycling in different electrolytes. It is evident that presence of Cu2+ enhances the Ir dissolution significantly by factors of 7.7 and 9.4 for 1 M HClO4 and 1 M HCl electrolytes, respectively. As a higher per cent wise dissolution of Ir takes place in the HCl based electrolytes as compared to that in the HClO4 based electrolytes, hereafter, this study focuses on the former.
| Electrolyte | Ir loading (μg) | Ir dissolution (%) | Dissolution enhancement factor | |
|---|---|---|---|---|
| Initial | Final | |||
| 1 M HClO4 | 15.9 | 15.6 | 1.5 | 1.0 |
| 1 M HCl | 17.6 | 17.2 | 2.2 | 1.0 |
| 1 M HClO4 + 20 mM CuCl2 | 16.8 | 14.9 | 11.3 | 7.7 |
| 1 M HCl + 20 mM CuCl2 | 16.8 | 13.4 | 20.5 | 9.4 |
Ir dissolution through potential cycling across the OER onset potential
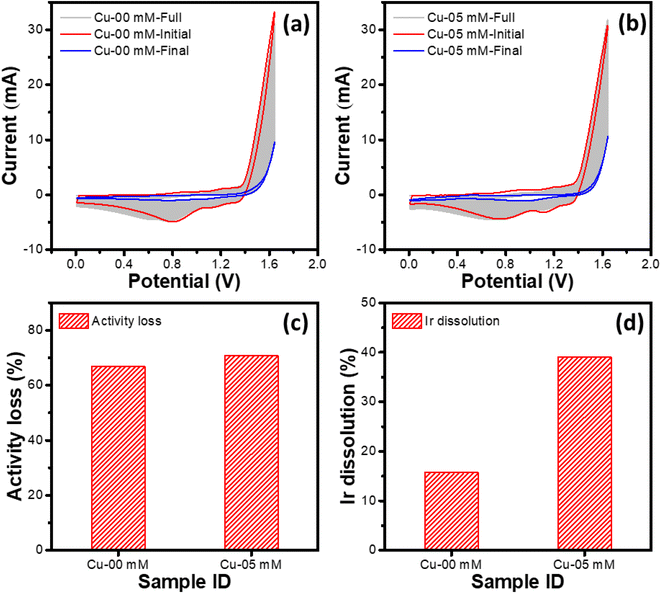
In this set of experiments, IrOx modified GC RDEs were subjected to potential cycling between 0.0 and 1.65 V (both the start and the end potentials being 1.2 V) in 1 M HCl containing different concentrations of CuCl2. CV plots shown in Fig. 4a and b correspond to potential cycling of the IrOx modified GC RDEs for 200 cycles at 100 mV s−1, respectively in 1 M HCl and 1 M HCl + 5 mM CuCl2 electrolytes.Initial (1st stress cycle) and final (200th stress cycle) highlighted with thick lines show significant evolution of the CVs during the potential cycling. The peaks corresponding to the Ir3+ ↔ Ir4+ redox couple shrink significantly. Also, the current values at 1.65 V, which correspond to the OER and the chlorine evolution reaction collectively, by ∼67% and ∼71% for the 1 M HCl and 1 M HCl + 5 mM CuCl2 electrolytes, respectively (Fig. 4c). Hence, presence of Cu2+ does not affect the oxygen and chlorine evolutions significantly. On the other hand, as depicted in Fig. 4d, the % dissolution of Ir from the electrodes during the potential cycling is affected significantly by the presence of Cu2+, showing the values of ∼16% and ∼40% for the 1 M HCl and 1 M HCl + 5 mM CuCl2 electrolytes, respectively. This clearly confirms enhancement of Ir dissolution in the presence of Cu2+. Moreover, the Ir dissolution in 1 M HCl (with/without Cu2+) increases significantly compared to that observed for the potential cycling below OER onset potentials.
Effect of Cu2+ concentration, number of potential cycles and/or scan rate
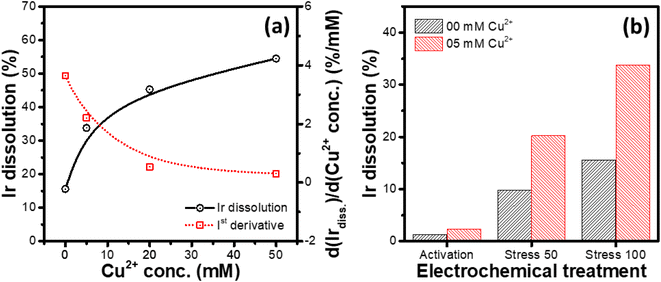
Variation of the Ir dissolution from the IrOx modified GC RDEs during potential cycling with the concentration of Cu2+ in 1 M HCl was studied. In this set of experiments, identically prepared WEs (IrOx modified GC RDEs) were subjected to an electrochemical treatment consisting of activation cycling (100 cycles between 0 and 1.65 V at 1.0 V s; start potential: 1.2 V, end potential: 1.2 V) followed by stress cycling for another 100 cycles between 0 and 1.65 V at 100 mV s−1 (start potential: 1.2 V, end potential: 1.2 V) in different electrolytes, consisting of 1 M HCl and varying concentrations (0, 5, 20 and 50 mM) of CuCl2.As depicted in Fig. 5a, it is evident that the dissolution of Ir increases with increasing the concentration of Cu2+, however, with a decreasing differential change, suggesting saturation of the Ir dissolution rate for high concentrations of Cu2+ (1st derivative of the Ir dissolution vs. Cu2+ concentration curve; Fig. 5a). Similar relationship is also observed between the number of stress cycles and the Ir dissolution rate (Fig. 5b), where the differential change in the dissolution decreases with increasing number of potential cycling. The activation treatment at a faster scan rate (1 V s−1) for 100 cycles leads to relatively smaller Ir dissolution compared to that for the potential cycling at a slower scan rate (100 mV s−1).
Structural characterizations and mechanism discussion
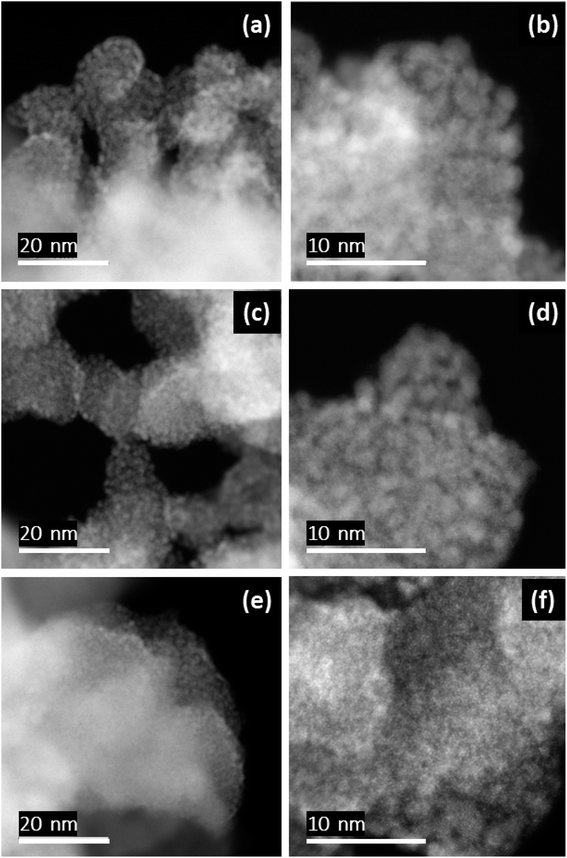
Structural characterizations on the untreated and the electrochemically treated IrOx samples collected from the GC RDEs were performed to gain the mechanistic insights into the dissolution of Ir during electrochemical treatment. Untreated and electrochemically treated samples collected from the GC RDE were analyzed for their morphological, elemental – and surface chemical characteristics, respectively through high resolution TEM, EDS and XPS techniques. The electrochemically treated samples were prepared by potential cycling of the IrOx modified GC RDEs between 0.0 and 1.65 V for 100 cycles at 1 V s−1 and another 100 cycles at 100 mV s−1 in two different electrolytes, namely 1 M HCl and 1 M HCl + 20 mM CuCl2. To be comparable, the untreated sample was also prepared by modifying a GC RDE by drop-casting 10 μL of the IrOx catalyst ink and drying at 700 rpm under ambient conditions.Surface morphology and elemental analysis
High-resolution HAADF-STEM images of the untreated and the electrochemically treated samples are shown in Fig. 6. The untreated IrOx sample consists of agglomerated globular particles (∼20 nm) densely covered with small nanoparticles of < 2 nm in size (Fig. 6a and b). Micrographs of the samples subjected to the stated stress cycling in 1 M HCl electrolyte (Ir dissolution: ∼16%) shown in Fig. 6c and d exhibit a microstructure like that of the untreated sample. Again, the microstructure does not change appreciably for the IrOx sample stress cycled in 1 M HCl + 20 mM CuCl2 electrolyte (Ir dissolution: ∼45%), as can be seen from the corresponding images of Fig. 6e and f.Furthermore, EDS mapping of different samples show similar elemental distributions with no evidence of presence of Cu in the sample exposed to the Cu2+ containing electrolyte (Fig. 7 and 8). This could be attributed to the fact that as the end potential for the electrochemical dissolution experiments was set to 1.2 V, no Cu is expected to be deposited on the electrode at that potential. Further, small amounts of Cu being adsorbed on the Ir-oxide on the electrode might be expected. However, as the Cu Kα peak is overlapping with a very small Ir L1 peak, while a smaller Cu Kβ peak is close to an onset of intensive Ir Lα peak, which makes it extremely difficult to observe small amounts of Cu in the sample.
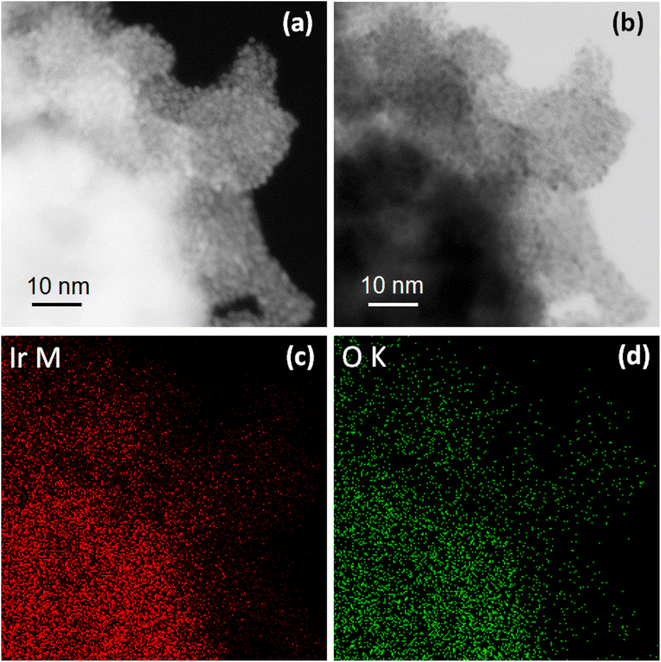 | ||
| Fig. 7 HAADF (a) and BF (b) STEM images and corresponding elemental maps for Ir (c) Ir and O (d) for IrOx sample treated electrochemically in 1 M HCl. | ||
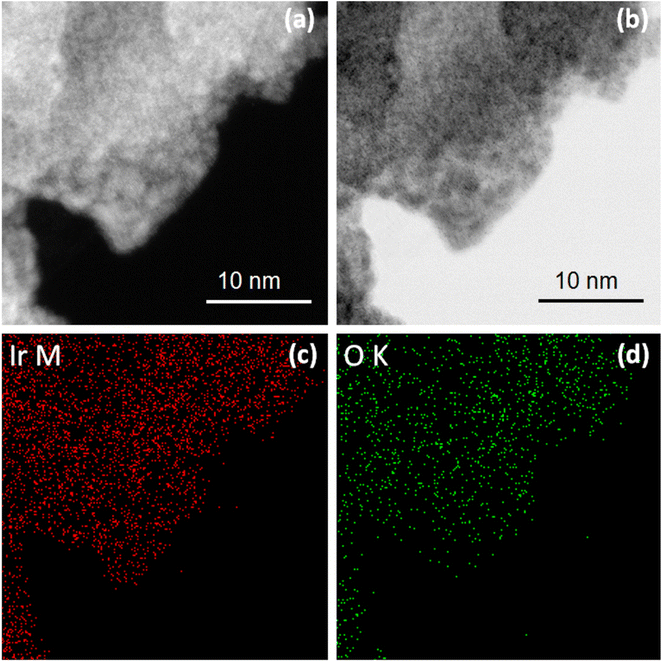 | ||
| Fig. 8 HAADF (a) and BF (b) STEM images and corresponding elemental maps for Ir (c) Ir and O (d) for IrOx sample treated electrochemically in 1 M HCl + 20 mM CuCl2. | ||
The EDS analysis showing the similar elemental distributions for different samples and the microstructural analysis of the samples do not indicate preferred dissolution of certain morphological features of the samples. The observation could indicate the observed Ir dissolution taking place through complete dissolution of the exposed Ir nanoparticles and hence unveiling the inner nanoparticles from the agglomerates, which were obscured by those removed through dissolution.
Surface chemical state
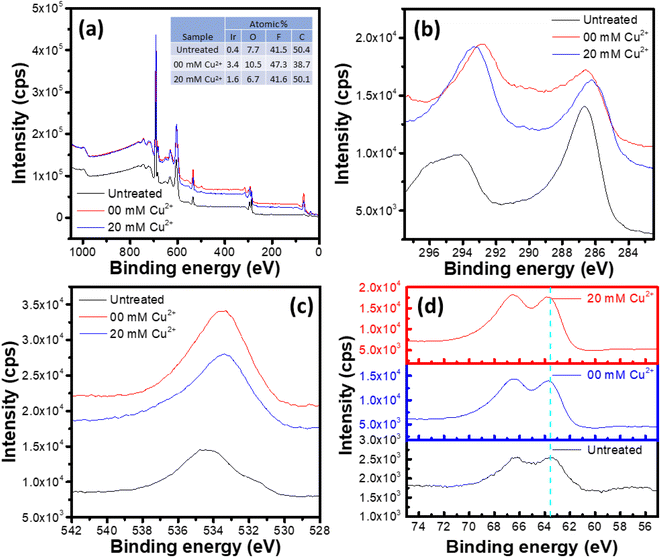
XPS survey spectra of the untreated and electrochemically treated samples are shown in Fig. 9a. All the three samples show presence of Ir, O, C and F. However, no peak corresponding to Cu was observed for the sample exposed to the Cu2+ containing electrolyte, which agrees with the observation made from the EDS analysis. The surface elemental composition of the studied samples is shown in the inset table of Fig. 9a. Here, presence of F 1s peak is due to the Nafion® ionomer in the catalyst ink, while the C 1s peak has contributions from the sample support and the adventitious carbon, apart from the carbon in the ionomer. Due to this complex contributions in the C 1s signal, the adventitious carbon peak at ∼284.7 eV![[thin space (1/6-em)]](https://www.rsc.org/images/entities/char_2009.gif) 55 could not be used for the binding energy (BE) calibration. Again, the O 1s peak originates from the oxygen functional groups on support/adventitious carbon, the IrOx and the ionomer phase. Hence, the variations of the relative abundances of C, O and F is not relevant for the Ir dissolution interpretation. The lower abundance of Ir in the untreated sample may be attributed to the coverage of the IrOx nanoparticles with the ionomer, leading to lower Ir signal. The electrochemical treatment leads to ionomer degradation, exposing the IrOx surface and hence increasing the relative Ir signal despite lower Ir content in the sample.
55 could not be used for the binding energy (BE) calibration. Again, the O 1s peak originates from the oxygen functional groups on support/adventitious carbon, the IrOx and the ionomer phase. Hence, the variations of the relative abundances of C, O and F is not relevant for the Ir dissolution interpretation. The lower abundance of Ir in the untreated sample may be attributed to the coverage of the IrOx nanoparticles with the ionomer, leading to lower Ir signal. The electrochemical treatment leads to ionomer degradation, exposing the IrOx surface and hence increasing the relative Ir signal despite lower Ir content in the sample.
The high-resolution C 1s spectra of the studied samples shown in Fig. 9b show peaks corresponding to C–C/C![[double bond, length as m-dash]](https://www.rsc.org/images/entities/char_e001.gif) O (BE range: 285–287 eV) and CF/CF2/CF3 (BE range: 291–295 eV) bonds.56–60 The C 1s spectra of the electrochemically treated samples are significantly different compared to that for the untreated sample. The difference could be attributed to the degradation of the ionomer during potential cycling, as discussed in previous reports.57,59–63 Similarly, the high-resolution O 1s spectra shown in Fig. 9c correspond to different bonds such as C–O, Ir–O, O–H etc.,58,64 which show significant impact of the potential cycling in terms of the envelope shift towards lower BE values. However, as detailed analysis of the ionomer degradation is not intended in this study, so a deconvolution and detailed analysis of the C 1s and O 1s spectra is not considered here.
O (BE range: 285–287 eV) and CF/CF2/CF3 (BE range: 291–295 eV) bonds.56–60 The C 1s spectra of the electrochemically treated samples are significantly different compared to that for the untreated sample. The difference could be attributed to the degradation of the ionomer during potential cycling, as discussed in previous reports.57,59–63 Similarly, the high-resolution O 1s spectra shown in Fig. 9c correspond to different bonds such as C–O, Ir–O, O–H etc.,58,64 which show significant impact of the potential cycling in terms of the envelope shift towards lower BE values. However, as detailed analysis of the ionomer degradation is not intended in this study, so a deconvolution and detailed analysis of the C 1s and O 1s spectra is not considered here.
High resolution Ir 4f spectra of the studied samples exhibit the 4f5/2 and 4f7/2 peak components separated by ∼3 eV.65 The samples show similar Ir 4f spectra, as indicated by the 4f5/2 component positions in the spectra (dashed vertical line in Fig. 9d), which appear at the BE value of 63.5 eV for all the studied samples. Hence, the untreated and electrochemically treated samples show similar surface chemistry of Ir, which agrees with the observations made from the microstructural analysis, i.e., part of the IrOx, which is exposed to the electrolyte, gets dissolved, leaving the undissolved sample unaffected structurally and chemically.
Discussion on dissolution enhancement mechanism in the presence of metal ions
As reported previously for Pt-based electrocatalysts, enhancement of the dissolution of Pt in the presence of Cu2+ has been attributed to the inhibition of the Ostwald ripening through redeposition of the dissolved Pt species on the undissolved Pt nanoparticles.22 The underpotential deposition of Cu on the Pt surface reduces the probability of redeposition of the Pt species, which leads to enhancement of the Pt dissolution. However, microstructural analysis of the IrOx samples subjected to the potentiodynamic treatments shows no sign of Ostwald ripening for the IrOx dissolution experiments in different electrolytes with/without Cu. Therefore, the enhancement of Ir dissolution is not related to the Ostwald ripening inhibition observed in case of Pt. Furthermore, the XPS analysis of the undissolved IrOx samples (after potentiodynamic treatment) suggests that the surface chemical state of Ir is unaltered. This could be attributed to the dissolution of Ir in the oxide surface layers that speeds up through cyclic deposition and stripping of the Cu layer, as evidenced by the presence of corresponding peaks in the cyclic voltammograms recorded in the Cu2+ containing electrolytes (Fig. 3c–d). The stripping of Cu during the positive-going scan probably removes the top IrOx layer through weakening the Ir–O–Ir bonds. The effect thus depends on the nature of the interaction between the Ir and O and M bonds, leading to significantly different effects of different metal ions, e.g., decreased dissolution in the presence of Rh3+ and enhanced dissolution when Cu2+, Bi3+ or Ru3+ ions attach to the oxide surface.The proposed mechanism is also supported by the observation that the presence of Cu+ was not found to be involved in the dissolution mechanism. Finally, as shown in Table 4, holding at a constant potential (reducing or oxidizing) does not lead to an enhanced dissolution in the presence of Cu2+ compared to that in the absence of it, though it is clear that oxidizing condition leads to higher degree of Ir dissolution. Thus, the potential cycling is observed to be the essential part of the enhancement of Ir dissolution.
| Electrolyte | Applied potential (V) | Holding time (min) | Ir dissolution (%) |
|---|---|---|---|
| 1 M HCl | 0.0 | 60 | 1.5 |
| 1 M HCl + 5 mM CuCl2 | 0.0 | 60 | 3.4 |
| 1 M HCl | 1.5 | 60 | 11.0 |
| 1 M HCl + 5 mM CuCl2 | 1.5 | 60 | 10.2 |
Applicability perspective
The observed enhancement of the dissolution of Ir through potential cycling of the electrodes consisting of the Ir-oxide electrocatalyst may be developed as an electrochemical route for recovering Ir from the acidic electrolyzer MEAs containing fluoropolymers that produce hazardous emissions when subjected to conventional pyrometallurgical procedures. While the presence of metal ions such as Cu2+ enhances the dissolution rate significantly, recovery of Ir from the dissolution bath containing both the dissolved Ir species and the additive metal ions may be achieved by conventional hydrometallurgical routes. For example, oxidation of the Ir3+ to Ir4+ followed by selective precipitation.66–68 However, in present work, such recovery of Ir was out of the scope of the current study.Conclusions
In conclusion, the electrochemical dissolution of IrOx in the presence of different metal ions has been studied. Presence of Cu2+f in the HCl-based electrolyte shows the highest percent wise dissolution of Ir during potential cycling. Compared to that in 1 M HCl, the Ir dissolution enhances by a factor of ∼3 during potential cycling between 0.0 and 1.65 V. Enhancement of the dissolution of Ir is also observed in the presence of other metal ions such Ni2+, Mo3+, Bi3+, Ru3+, etc., while presence of an ion/complex such Co2+, Rh3+and [PtCl6]2− lowers the Ir dissolution. This study could provide important ideas for development of impurity tolerant acidic water electrolyzers, where dissolution of the electrocatalyst must be minimized. On the other hand, enhancement of the Ir dissolution through potential cycling in the presence of metal ions such as Cu2+ provides an encouraging route for recovery of Ir from the Ir-based spent OER electrocatalysts through electrochemical dissolution.Conflicts of interest
There are no conflicts to declare.Acknowledgements
Authors acknowledge the financial support from Innovation Fund Denmark, InnoExplorer program, Nr. 9122-00112; Ministry of Higher Education and Science, Danish ESS lighthouse on hard materials in 3D, SOLID, Grant number 8144-00002B and Slovenian Research Agency (research core funding no. P2–0089).References
- Y. Wang, Y. Pang, H. Xu, A. Martinez and K. S. Chen, Energy Environ. Sci., 2022, 15, 2288–2328 RSC.
- S. A. Grigoriev, V. N. Fateev, D. G. Bessarabov and P. Millet, Int. J. Hydrogen Energy, 2020, 45, 26036–26058 CrossRef CAS.
- S. Shiva Kumar and V. Himabindu, Mater. Sci. Energy Technol., 2019, 2, 442–454 Search PubMed.
- H.-y. Jiang, J. Xu and B. Sun, Appl. Organomet. Chem., 2018, 32, e4260 CrossRef.
- D. Xu, P. Diao, T. Jin, Q. Wu, X. Liu, X. Guo, H. Gong, F. Li, M. Xiang and Y. Ronghai, ACS Appl. Mater. Interfaces, 2015, 7, 16738–16749 CrossRef CAS PubMed.
- S. M. King, S. Claire, R. I. Teixeira, A. N. Dosumu, A. J. Carrod, H. Dehghani, M. J. Hannon, A. D. Ward, R. Bicknell, S. W. Botchway, N. J. Hodges and Z. Pikramenou, J. Am. Chem. Soc., 2018, 140, 10242–10249 CrossRef CAS PubMed.
- M. Cui, J. Zhou, Y. Zhao and Q. Song, Sens. Actuators, B, 2017, 243, 203–210 CrossRef CAS.
- M. Zea, A. Moya, M. Fritsch, E. Ramon, R. Villa and G. Gabriel, ACS Appl. Mater. Interfaces, 2019, 11, 15160–15169 CrossRef CAS PubMed.
- R. L. Rudnick and S. Gao, in Treatise on Geochemistry, ed. H. D. Holland and K. K. Turekian, Pergamon, Oxford, 2003, pp. 1–64, DOI:10.1016/B0-08-043751-6/03016-4.
- C. Saguru, S. Ndlovu and D. Moropeng, Hydrometallurgy, 2018, 182, 44–56 CrossRef CAS.
- Z. Peng, Z. Li, X. Lin, H. Tang, L. Ye, Y. Ma, M. Rao, Y. Zhang, G. Li and T. Jiang, JOM, 2017, 69, 1553–1562 CrossRef CAS.
- C. Liu, S. C. Sun, X. P. Zhu, G. F. Tu and J. Y. Zhang, IOP Conf. Ser.: Mater. Sci. Eng., 2019, 479, 012058 CrossRef CAS.
- T. Stoiber, S. Evans and O. V. Naidenko, Chemosphere, 2020, 260, 127659 CrossRef CAS PubMed.
- M. Feng, R. Qu, Z. Wei, L. Wang, P. Sun and Z. Wang, Sci. Rep., 2015, 5, 9859 CrossRef CAS PubMed.
- B. J. Smith, D. J. Graziano, M. E. Riddle, D.-J. Liu, P. Sun, C. Iloeje, E. Kao and D. Diamond, Platinum Group Metal Catalysts-Supply Chain Deep Dive Assessment, USDOE Office of Policy (PO), 2022 Search PubMed.
- N. Hodnik, C. Baldizzone, G. Polymeros, S. Geiger, J.-P. Grote, S. Cherevko, A. Mingers, A. Zeradjanin and K. J. Mayrhofer, Nat. Commun., 2016, 7, 13164 CrossRef CAS PubMed.
- R. Sharma, M. J. Larsen, L. C. Larsen, A. Bogø, L. Grahl-Madsen and S. M. Andersen, Sustainable Energy Fuels, 2022, 6, 5177–5186 RSC.
- L. Duclos, R. Chattot, L. Dubau, P.-X. Thivel, G. Mandil, V. Laforest, M. Bolloli, R. Vincent and L. Svecova, Green Chem., 2020, 22, 1919–1933 RSC.
- J. Cui, F. Yu, M. Tian, C. Yan, T. Shen, X. Wang, U. H. Prova, C. Wang, G. Huang and S. Xu, Green Chem., 2023, 25, 9209–9217 RSC.
- R. Sharma, K. R. Nielsen, P. B. Lund, S. B. Simonsen, L. Grahl-Madsen and S. M. Andersen, ChemElectroChem , 2019, 6, 4471–4482 CrossRef CAS.
- R. Sharma, S. Gyergyek and S. M. Andersen, ChemSusChem, 2018, 11, 3742–3750 CrossRef CAS PubMed.
- R. Sharma, S. B. Simonsen, P. Morgen and S. M. Andersen, Electrochim. Acta, 2019, 321, 134662 CrossRef CAS.
- R. Sharma, S. Gyergyek, P. Morgen and S. M. Andersen, J. Electrochem. Soc., 2020, 167, 024521 CrossRef CAS.
- R. Sharma, S. J. Andreasen, J. Chamier and S. M. Andersen, J. Electrochem. Soc., 2019, 166, F963 CrossRef CAS.
- F. Xu, S. Mu and M. Pan, Int. J. Hydrogen Energy, 2010, 35, 2976–2979 CrossRef CAS.
- C. F. Nørgaard, S. N. Stamatin and E. M. Skou, Int. J. Hydrogen Energy, 2014, 39, 17322–17326 CrossRef.
- M. K. Jha, J.-c. Lee, M.-s. Kim, J. Jeong, B.-S. Kim and V. Kumar, Hydrometallurgy, 2013, 133, 23–32 CrossRef CAS.
- N. Hodnik, C. Baldizzone, G. Polymeros, S. Geiger, J.-P. Grote, S. Cherevko, A. Mingers, A. Zeradjanin and K. J. J. Mayrhofer, Nat. Commun., 2016, 7, 13164 CrossRef CAS PubMed.
- B. C. Hagelüken, Platinum Met. Rev., 2012, 56, 29–35 CrossRef.
- P. Jovanovič, N. Hodnik, F. Ruiz-Zepeda, I. Arčon, B. Jozinović, M. Zorko, M. Bele, M. Šala, V. S. Šelih, S. Hočevar and M. Gaberšček, J. Am. Chem. Soc., 2017, 139, 12837–12846 CrossRef PubMed.
- S. Cherevko, T. Reier, A. R. Zeradjanin, Z. Pawolek, P. Strasser and K. J. J. Mayrhofer, Electrochem. Commun., 2014, 48, 81–85 CrossRef CAS.
- R. V. Mom, L. J. Falling, O. Kasian, G. Algara-Siller, D. Teschner, R. H. Crabtree, A. Knop-Gericke, K. J. J. Mayrhofer, J.-J. Velasco-Vélez and T. E. Jones, ACS Catal., 2022, 12, 5174–5184 CrossRef CAS.
- L. Moriau, K. Stojanovski, P. Jovanovič, D. Escalera-López, S. Cherevko and N. Hodnik, RSC Adv., 2023, 13, 7980–7987 RSC.
- S.-W. Xu, J. Li, N. Zhang, W. Shen, Y. Zheng and P. Xi, Chem. Commun., 2023, 59, 9792–9802 RSC.
- N. Li, S. S. Araya, X. Cui and S. K. Kær, J. Power Sources, 2020, 473, 228617 CrossRef CAS.
- M. Chourashiya, R. Sharma and S. M. Andersen, Anal. Chem., 2018, 90, 14181–14187 CrossRef CAS PubMed.
- R. Sharma, M. A. Karlsen, P. Morgen, J. Chamier, D. B. Ravnsbæk and S. M. Andersen, ACS Appl. Energy Mater., 2021, 4, 2552–2562 CrossRef CAS.
- H. Yoo, K. Oh, Y.-R. Lee, K. Row, G. Lee and J. Choi, Int. J. Hydrogen Energy, 2017, 42(10), 6657–6664 CrossRef CAS.
- P. Vanysek, CRC handbook of chemistry and physics, 2000, vol. 8, pp. 8-33 Search PubMed.
- V. Karimi, R. Sharma, P. Morgen and S. M. Andersen, ACS Appl. Mater. Interfaces, 2023, 15, 49233–49245 CrossRef CAS PubMed.
- R. Kötz, in Spectroscopic and Diffraction Techniques in Interfacial Electrochemistry, ed. C. Gutiérrez and C. Melendres, Springer Netherlands, Dordrecht, 1990, pp. 409–438, DOI:10.1007/978-94-011-3782-9_14.
- Z. Pavlovic, C. Ranjan, Q. Gao, M. van Gastel and R. Schlögl, ACS Catal., 2016, 6, 8098–8105 CrossRef CAS.
- E. El Sawy and V. Birss, J. Mater. Chem., 2009, 19, 8244–8252 RSC.
- J. Juodkazytė, B. Šebeka, I. Valsiûnas and K. Juodkazis, Electroanalysis, 2005, 17, 947–952 CrossRef.
- I. M. Tidswell, C. A. Lucas, N. M. Marković and P. N. Ross, Phys. Rev. B: Condens. Matter Mater. Phys., 1995, 51, 10205–10208 CrossRef CAS PubMed.
- C. L. Scortichnini and C. N. Reilley, J. Electroanal. Chem. Interfacial Electrochem., 1982, 139, 233–245 CrossRef.
- N. M. Marković, C. A. Lucas, H. A. Gasteiger and P. N. Ross, Surf. Sci., 1997, 372, 239–254 CrossRef.
- M. Palomar-Pardavé, I. González and N. Batina, J. Phys. Chem. B, 2000, 104, 3545–3555 CrossRef.
- J. Okada, J. Inukai and K. Itaya, Phys. Chem. Chem. Phys., 2001, 3, 3297–3302 RSC.
- J. Mozota and B. Conway, J. Electrochem. Soc., 1981, 128, 2142 CrossRef CAS.
- N. Li and J. Lipkowski, J. Electroanal. Chem., 2000, 491, 95–102 CrossRef CAS.
- Z. Shi and J. Lipkowski, J. Electroanal. Chem., 1996, 403, 225–239 CrossRef.
- D. M. Soares, S. Wasle, K. G. Weil and K. Doblhofer, J. Electroanal. Chem., 2002, 532, 353–358 CrossRef CAS.
- W. Shao, G. Pattanaik and G. Zangari, J. Electrochem. Soc., 2007, 154, D201 CrossRef CAS.
- D. J. Miller, M. C. Biesinger and N. S. McIntyre, Surf. Interface Anal., 2002, 33, 299–305 CrossRef CAS.
- S. Ben Jadi, A. El Guerraf, A. Kiss, A. El Azrak, E. A. Bazzaoui, R. Wang, J. I. Martins and M. Bazzaoui, J. Solid State Electrochem., 2020, 24, 1551–1565 CrossRef CAS.
- C. Chen, G. Levitin, D. W. Hess and T. F. Fuller, J. Power Sources, 2007, 169, 288–295 CrossRef CAS.
- A. K. Friedman, W. Shi, Y. Losovyj, A. R. Siedle and L. A. Baker, J. Electrochem. Soc., 2018, 165, H733–H741 CrossRef CAS.
- R. Sharma, P. Morgen, M. J. Larsen, M. C. Roda-Serrat, P. B. Lund, L. Grahl-Madsen and S. M. Andersen, ACS Appl. Mater. Interfaces, 2023, 15, 48705–48715 CrossRef CAS PubMed.
- R. Sharma, P. Morgen, S. Chiriaev, P. B. Lund, M. J. Larsen, B. Sieborg, L. Grahl-Madsen and S. M. Andersen, ACS Appl. Mater. Interfaces, 2022, 14, 49658–49671 CrossRef CAS PubMed.
- M. Takasaki, Y. Nakagawa, Y. Sakiyama, K. Tanabe, K. Ookubo, N. Sato, T. Minamide, H. Nakayama and M. Hori, ECS Trans., 2009, 17, 439 CrossRef CAS.
- M. Robert, A. E. Kaddouri, J.-C. Perrin, S. Leclerc and O. Lottin, J. Electrochem. Soc., 2018, 165, F3209 CrossRef CAS.
- C. G. Chung, L. Kim, Y. W. Sung, J. Lee and J. S. Chung, Int. J. Hydrogen Energy, 2009, 34, 8974–8981 CrossRef CAS.
- G. Gupta, S. Sharma and P. M. Mendes, RSC Adv., 2016, 6, 82635–82643 RSC.
- V. Pfeifer, T. E. Jones, J. J. Velasco Vélez, C. Massué, R. Arrigo, D. Teschner, F. Girgsdies, M. Scherzer, M. T. Greiner, J. Allan, M. Hashagen, G. Weinberg, S. Piccinin, M. Hävecker, A. Knop-Gericke and R. Schlögl, Surf. Interface Anal., 2016, 48, 261–273 CrossRef CAS.
- M. N. Le and M. S. Lee, Geosyst. Eng., 2018, 21, 210–216 CrossRef CAS.
- U. Otgonbayar, L. Sandig-Predzymirska, A. Thiere and A. Charitos, Hydrometallurgy, 2024, 226, 106303 CrossRef CAS.
- M. Fan, S. Li, H. Deng, X. Zhang, G. Luo, Z. Huang and M. Chen, Sep. Purif. Technol., 2022, 289, 120765 CrossRef CAS.
| This journal is © The Royal Society of Chemistry 2024 |

