
Luminescent carbon dots versus quantum dots and gold nanoclusters as sensors†
J. S.
Anjali Devi
 *abc,
S.
Madanan Anju
a,
G. M.
Lekha
a,
R. S.
Aparna
a and
Sony
George
*a
*abc,
S.
Madanan Anju
a,
G. M.
Lekha
a,
R. S.
Aparna
a and
Sony
George
*a
aDepartment of Chemistry, School of Physical and Mathematical Sciences, University of Kerala, Thiruvananthapuram 695581, Kerala, India. E-mail: anjalidevijs@kannuruniv.ac.in; anjalidevijs@gmail.com; emailtosony@gmail.com; Tel: +91 8547481911 Tel: +91 9446462933
bSchool of Chemical Sciences, Mahatma Gandhi University, Priyadarsini Hills P. O., Kottayam 686560, Kerala, India
cDepartment of Chemistry, Kannur University, Swami Anandatheertha Campus, Payyanur, Edat P. O. Kannur 670327, Kerala, India
First published on 9th July 2024
Abstract
Ultra-small nanoparticles, including quantum dots, gold nanoclusters (AuNCs) and carbon dots (CDs), have emerged as a promising class of fluorescent material because of their molecular-like properties and widespread applications in sensing and imaging. However, the fluorescence properties of ultra-small gold nanoparticles (i.e., AuNCs) and CDs are more complicated and well distinguished from conventional quantum dots or organic dye molecules. At this frontier, we highlight recent developments in the fundamental understanding of the fluorescence emission mechanism of these ultra-small nanoparticles. Moreover, this review carefully analyses the underlying principles of ultra-small nanoparticle sensors. We expect that this information on ultra-small nanoparticles will fuel research aimed at achieving precise control over their fluorescence properties and the broadening of their applications.
 J. S. Anjali Devi | J. S. Anjali Devi obtained her MSc in Chemistry from the University of Kerala with first rank and gold medal in 2013. Subsequently, she joined the Department of Chemistry, University of Kerala for her PhD under the supervision of Dr Sony George with a KSCSTE Research Fellowship 2013 (Govt. of Kerala), and DST-INSPIRE Fellowship 2015 (Govt. of India). She obtained her PhD degree in 2020. The thesis is entitled “Investigation on Photoluminescence Behaviour of Carbon Dots and Gold Nanoclusters for Sensing and Imaging Application.” Then she joined Mahatma Gandhi University, Kerala as an Assistant Professor (Contract Faculty) from March 2021 to August 2023. Currently, she is working as an Assistant Professor at the Department of Chemistry, Kannur University, Kerala. She has 25 publications to her credit in international journals. Her research interests include physical chemistry, sensors, and photophysics. |
 S. Madanan Anju | S. Madanan Anju completed her MSc in Chemistry from the University of Kerala with the second rank in 2012. She did her MPhil Degree at the University of Kerala. She has qualified State Eligibility Test (Govt. of Kerala) and the National Eligibility Test (CSIR-UGC, Govt. of India). Currently, she is pursuing her Doctoral degree at the Department of Chemistry, University of Kerala under the guidance of Dr Sony George. She has over 30 publications to her credit in international journals. Her research interests include luminescent nanomaterials, cardiac biomarkers, explosive detection, and disease biomarker sensing. |
 G. M. Lekha | G. M. Lekha received an MSc (2007), and PhD (2016) from the University of Kerala. In the year 2019, she completed a postdoctoral fellowship in the group of Dr Sony George at the University of Kerala. Since 2022, she has been a higher secondary teacher at MVHSS, Arumanoor, Kerala. She is the co-author of 7 publications in international journals, and a chapter in a book entitled ‘colloidal metal oxide nanoparticle synthesis, characterization, and applications.’ Her research interests include magnetic and luminescent lanthanide-based nanoparticles. |
 R. S. Aparna | R. S. Aparna obtained her MSc in chemistry at the National Institute of Technology (NIT), Trichy, India. She pursued her PhD under the supervision of Dr Sony George at the Department of Chemistry, University of Kerala. She obtained her PhD degree in 2019. The thesis is entitled ‘Design and Development of Functionalized Copper Nanoclusters for Fluorescent Sensing and Imaging’. She has 22 publications to her credit in international journals. Her research interests include nanoscience, sensors, and bioimaging. |
 Sony George | Sony George received his PhD at the Department of Chemistry, University of Kerala, India and he is currently working as an Associate Professor in the same institution. His area of interest is the design and development of magnetic and fluorescent nanomaterials for sensing and bioimaging. He had been a visiting professor at the A. A. Athinoula Centre for Biomedical Imaging, MGH affiliated to Harward Medical School. He had a sabbatical stint at the Department of Chemical Physics, LUND University, Sweden. |
1. General overview
Luminescence is the spontaneous emission of electromagnetic radiation, especially light waves, by substances in an electronic excited state.1,2 The word ‘luminescence’ derives from two Latin words, lumen (meaning ‘light’) and escentia (meaning ‘the process of’).3 The concept of luminescence is very different from incandescence so that the latter term deals with radiative emission from a hot substance. Luminescence is formerly classified by the difference in energy source as photoluminescence, cathodoluminescence, chemiluminescence, electroluminescence, mechanoluminescence, radioluminescence and thermoluminescence [Fig. S1 in ESI†].Luminescence covers a wide array of topics. Fig. S1 (ESI†) display the depth of this overall topic. Thus, it is not practical to provide extensive coverage of all developments and features of this extremely broad area of research. Instead, we attempt to focus on fluorescence that arises from photon-induced excitation and emission.
Fluorescence refers to the spontaneous emission of radiation from an electronically excited state of a fluorescent species. It occurs through the electronic transition from the excited state to the ground state of the same spin multiplicity (Fig. S2, ESI†).1,2 The first report on fluorescence can be traced back to the observation of peculiar blue light in the infusion of a Lignum nephriticum (Latin for “kidney wood”) by Nicolás Monardes in 1565 and Franciscan Friar Bernardino de Sahagún in 1560.2 This blue fluorescence is due to oxidation of flavonoids in “kidney wood” to highly fluorescent matlaline (from the Aztec word ‘matlali’ for blue) with an emission wavelength close to 466 nm.2 Each subsequent innovation in fluorescence added wonderful features to the fluorescence signal, including intensity, lifetime, large wavelength separation (Stokes shift) between absorbing and emitting radiation as well as sensitivity to surrounding environmental factors.1,4 In many cases, fluorescence can be influenced by physicochemical aspects of the local environment (e.g.: viscosity, polarity, temperature, redox status, or pH) and interactions with quenchers.5 The interaction between a fluorophore and quenchers occurs via Förster resonance energy transfer (FRET), photoinduced electron transfer (PET), inner filter effect (IFE), aggregation, Dexter-type interaction, excimer formation or complex formation.4,6 These favourable features of fluorescence laid the foundations for fluorescent sensors which rely on a sensitive fluorescence response to specific analytes.7 To overcome the limitations of conventional organic-molecule-based fluorophores, tremendous attempts have been made to discover alternative fluorescent materials with a large Stokes shift, long lifetime, high biocompatibility, water solubility and so on. Every year, new evidence of fluorescent materials appears and interest in investigating the origin of fluorescence has risen. Owing to this intense evolution, fluorescence techniques using ultra-small nanoparticles have been developed as a powerful tool for analysis (see Fig. 1).8,9
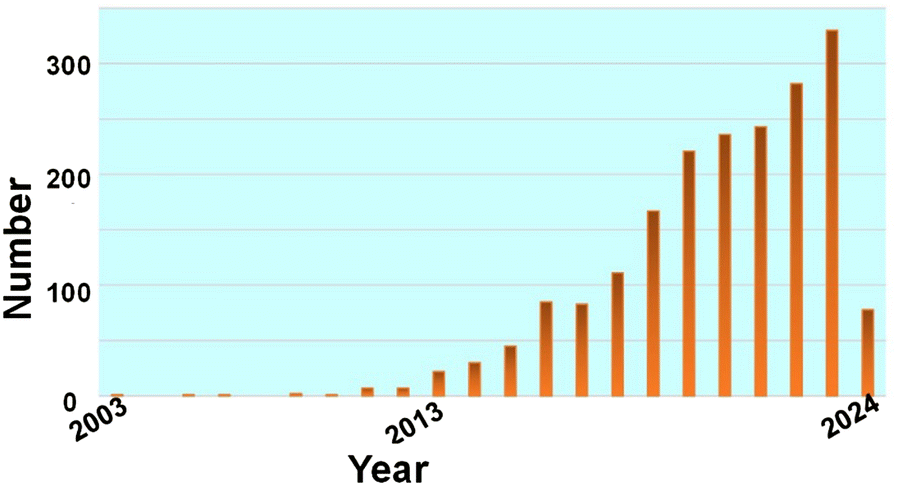 | ||
| Fig. 1 Number of publications on ultra-small nanoparticles based on Pubmed with the keyword “(ultrasmall OR carbon dots OR Gold nanocluster) AND sensing” in “Title/Abstract” section during the period 2003 to 2024 (data collected on 3 February 2024); total: 1648 results. | ||
In this article, we summarise luminescent ultra-small nanoparticle sensors, especially those smaller than 10 nm, as they can be absorbed or excreted quickly by the human body but can be circulated in the blood for a longer time.8 To date, many luminescent ultra-small nanosensors have been proposed for various applications. These materials include semiconductor nanocrystals (also known as quantum dots), metal nanoclusters (especially gold nanoclusters (AuNCs)) and carbon dots (CDs).8,10 Their photophysical properties, fluorescence origin and structural elucidation in previous reports have been given prime importance in this article. We summarise the use of these nanosensors to detect metal ions, neurotransmitters, biomarkers, biomolecules, pesticides, pH, temperature, polarity, viscosity, and hypoxia. Finally, the prospects and challenges in this rapidly maturing field are addressed.
1.1. How do they fluoresce?
Many luminescent materials exhibit two types of emission: downconversion and upconversion.8 Downconversion or Stokes shifted emission is the normal process in which particles absorb high-energy radiation and emit at lower energy. On the other hand, fluorescence upconversion occurs via an anti-Stokes phenomenon in which a high-energy photon is emitted through simultaneous multiple low-energy photon absorption or energy transfer processes.1,8 The Stokes shift is named after George Gabriel Stokes, who coined the term fluorescence in the 19th century.2 The origin of the Stokes shift in conventional organic dyes can be illustrated simply with the aid of an energy level diagram known as the Jablonski diagram (Fig. S2, ESI†).1 Many ultra-small nanoparticles exhibit upconversion fluorescence.11–13 Luminescent ultra-small nanoparticles have achieved larger Stokes shifts than conventional organic dyes. However, the detailed mechanism for fluorescence from ultra-small nanoparticles has not yet been completely understood.10,12,14Size-dependent fluorescence is widely observed in many ultra-small nanoparticles, especially semiconductor nanocrystals (quantum dots). Quantum dots are nanocrystals smaller than the typical Bohr exciton radius. At this nano-dimension, their energy levels become quantised with values directly related to the size of the quantum dots (Fig. 2).15–17 This phenomenon is called the quantum confinement effect. The absorption of a photon with energy above the semiconductor bandgap will trigger the generation of electron–hole pairs (excitons). The subsequent radiative recombination of excitons results in narrow and symmetric fluorescence emission with a long lifetime.15,17
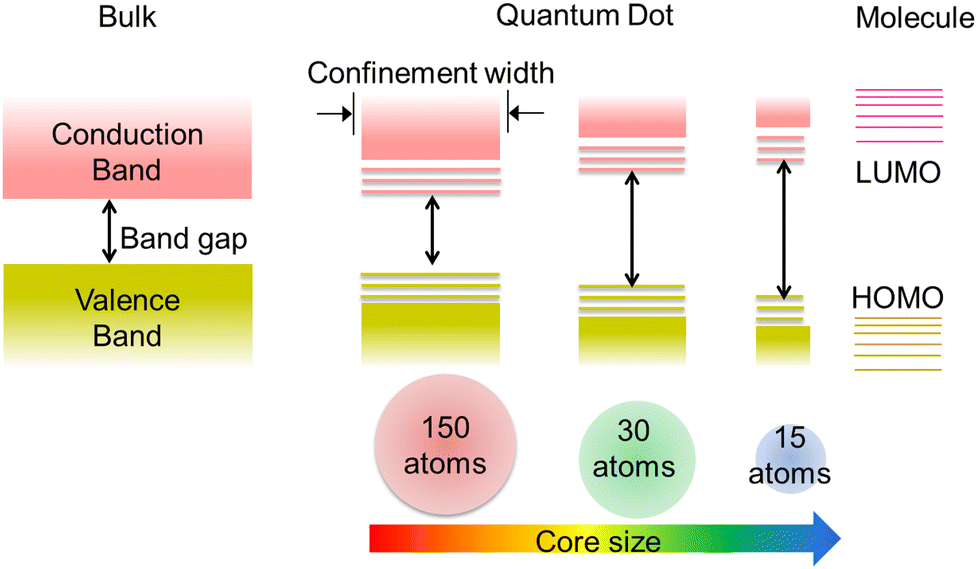 | ||
| Fig. 2 Evolving quantum confinement effect within the energy level structure of semiconductor materials on tuning the dimensions from bulk to nano-dimensional. The bulk semiconductor possesses continuous conduction and valence bands separated by a constant bandgap. The limited number of atoms in quantum dots results in discrete ‘molecule-like’ energy levels depending upon the size of the particles. The quantum dots bridge the gap between cluster molecules and bulk materials. | ||
CDs are widely visualised as quantum dots made of carbon.12 That is why the quantum confinement effect in CDs has been comprehensively investigated over the last decade.12,18 Surprisingly, much research work has provided evidence of size-dependent fluorescence in CDs.19,20 Most importantly, Lee and co-workers reported bright blue, green, yellow and red fluorescence from CDs with increasing size.19 In another case, Lin and co-workers prepared green, blue and red luminescent nitrogen-doped carbon dots (NCDs) from ortho-, meta- and para-isomers of phenylenediamines.20 They suspected that particle size and nitrogen content controlled the fluorescence colour of the CDs. From these experimental observations, researchers found some correlation between CD fluorescence and the quantum confinement effect in graphene oxide (Fig. 3). As a result, the theory of a bandgap transition within numerous isolated sp2-hybridised carbon nanodomains embedded on an sp3-hybridised carbon matrix of CDs has gained a lot of research attention.12 According to this model, a single CD particle possesses numerous conjugated π-domains containing sp2-hybridised carbon clusters at its core (i.e., the CD core is similar to the graphene oxide structure) and numerous polar surface functional groups of sp3-hybridised carbon. The fluorescence is the result of the quantum confinement effect. In contrast, researchers get confused when observing identical visible light fluorescence from CDs of ultra-small size as well as larger CDs with dimensions of several tens of nanometers.21 Subsequently, Eda et al. confirmed the probable presence of isolated sp2-hybridised carbon nanodomains within an sp3 carbon matrix of CDs by theoretical calculations using Gaussian and time-dependent density functional theory (TD-DFT).22 They calculated that isolated π-domains within a carbon core of 3 nm can accommodate more than 100 aromatic benzene rings in such a way that CDs of this dimension should have a bandgap of only 0.5 V. This calculated value of the bandgap could not provide emission in the visible region.
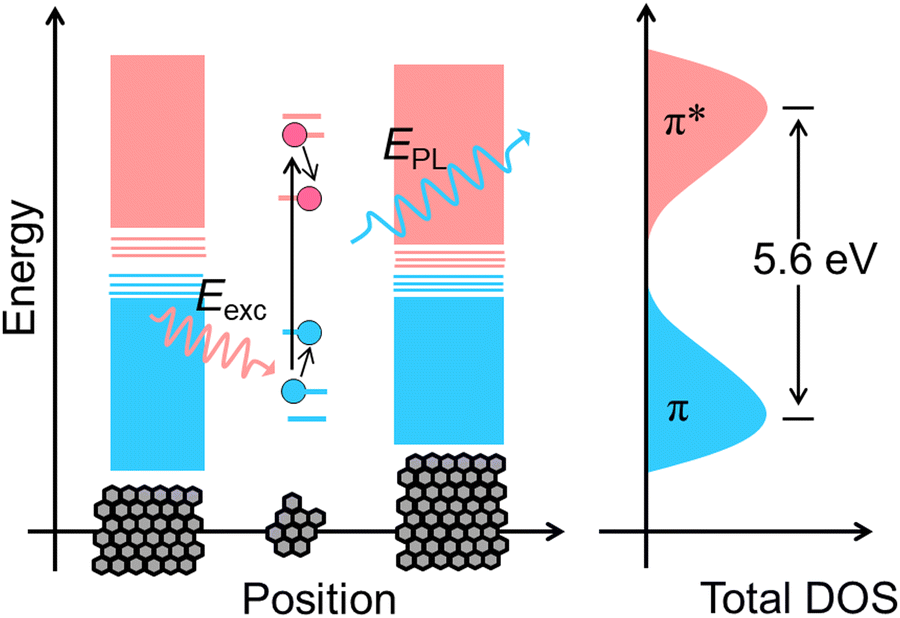 | ||
| Fig. 3 Scheme representing the electronic band structure of graphene oxide. The pink and blue bands indicate conduction and valence bands, respectively. Smaller sp2-hybridised carbon nanodomains exhibit a large bandgap due to the quantum confinement effect. The absorption of photons (Eexc) generates electron–hole pairs which on subsequent radiative recombination yield fluorescence (EPL). The black arrows symbolise electronic transitions. DOS represents the density of states. | ||
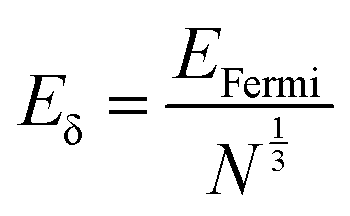
Metal nanoclusters are known as metal quantum clusters and a special case of the quantum confinement effect happens in certain metal nanoclusters (Fig. 4).23 In particular, polyamidoamine (PAMAM)-dendrimer-stabilised atomically precise AuNCs exhibit size-dependent fluorescence.24,25 This experimental evidence led to the formulation of a simple Jellium scaling law:
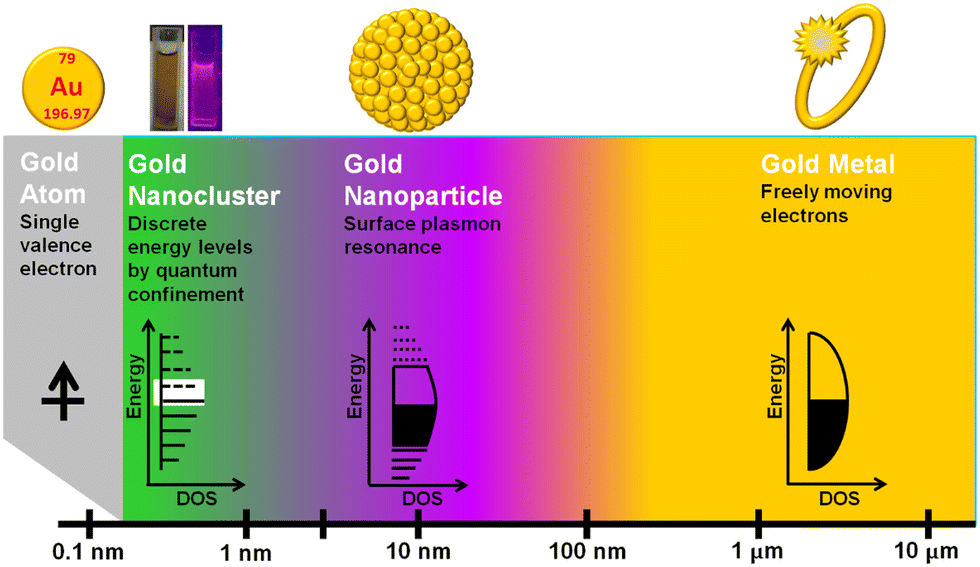 | ||
| Fig. 4 Representations of a gold ring, a gold nanoparticle, a gold nanocluster solution in a cuvette under UV illumination and visible light, as well as a metallic gold atom, are given (from right to left) in the top panel. Bottom panel: bulk gold (as in a gold ring) and gold nanoparticles exhibit continuous conduction and valence energy bands (right). The limited number of gold atoms in gold nanoclusters results in discrete ‘molecule-like’ energy levels, a quantum confinement effect, and size-dependent fluorescence. Gold nanoclusters act as a ‘missing link’ between atomic gold and plasmonic gold nanoparticles. | ||
1.2. Excitation wavelength dependence of fluorescence
The observation of excitation-wavelength-independent fluorescence emission in ultra-small nanoparticles is a very common phenomenon following the classical Kasha–Vavilov rule.30 This rule states that in any condensed phase (i.e. liquid or solution) fluorescence emission in appreciable yield occurs only from the lowest excited state of a given multiplicity (singlet or triplet) irrespective of the initial photoexcited state (see Fig. S2, ESI†).30 Consequently, the fluorescence quantum yield should remain independent of excitation wavelength. An excellent demonstration of this law can be seen in many quantum dots, AuNCs protected by proteins or small molecules14,31,32 and a few CDs.33,34The fluorescence of CDs is more complicated than that of typical semiconductor quantum dots or AuNCs. Though there is a huge difference in the size and surface state of CDs prepared through different methods, excitation-dependent fluorescence emission is a common feature of CDs except for a few cases. However, the mechanism behind this phenomenon remains a topic of debate. Initially, this excitation-dependent fluorescence is correlated to variation in the quantum confinement effect due to different-sized particles present in the ensemble used for recording the fluorescence spectrum (Fig. 5).35 Subsequently, several reports projected that different surface states or molecular states on a single particle, doping with an electronegative heteroatom, the synergic effect of quantum size, surface state and molecular state as well as solvent relaxation could have roles in multiple fluorescence centres involved in an excitation-dependent emission process. A comprehensive explanation of this matter can be found in the review article from 2016 by Gan et al.21
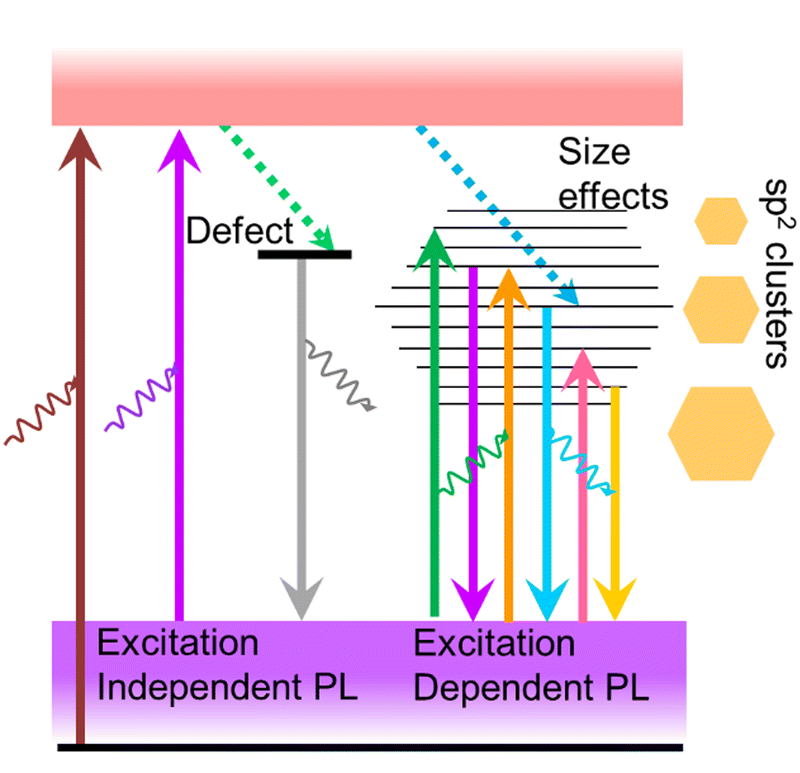 | ||
| Fig. 5 Schematic representation of surface-defect-state-derived excitation-independent fluorescence and different-sized sp2-hybridised carbon nanodomain-controlled excitation-dependent fluorescence in carbon dots. | ||
1.3. Factors affecting the fluorescence of ultra-small nanoparticles
It is well known that several parameters, including viscosity, polarity, temperature, redox status, pH and an adjacent heavy atom, can influence the photophysics of ultra-small nanoparticles (Fig. 6). Abnormal changes in these factors may affect the quality and fluorescence performance of ultra-small nanoparticles. Here, we outline the various environment-responsive fluorescent ultra-small nanoparticles that have been reported so far.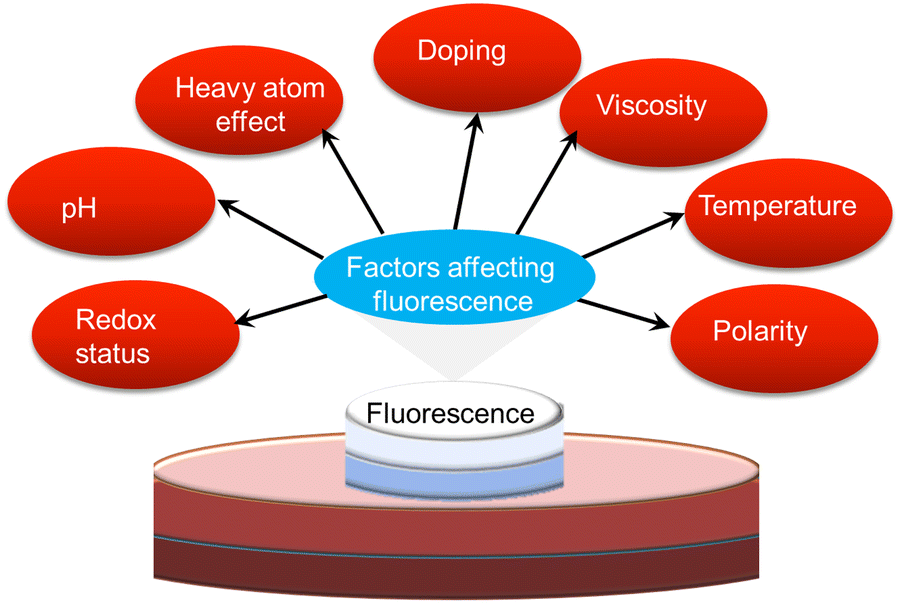 | ||
| Fig. 6 Scheme illustrating various environmental factors influencing the fluorescence performance of ultra-small nanoparticles. | ||
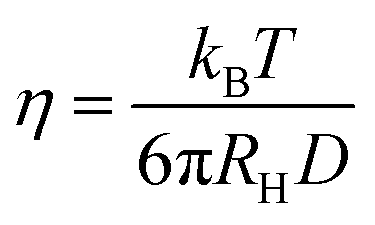
where kB is the Boltzmann constant and T is the absolute temperature. With an increase in the viscosity of the solvent, the diffusion and collision rate of a fluorophore will decrease to show less collisional non-radiative deactivation and enhanced fluorescence intensity. Using this principle, ultra-small nanoparticles of BSA-capped AuNCs have been proposed as a good microviscosity-targeting sensor in single breast cancer cells (MCF7).36 These authors found that the viscosity of breast cancer cells is much higher than that of normal breast cells. Based on the same principle, Mandal and co-workers used viscosity as a tool to determine the location of emissive species within the CD matrix.37
Few papers have been devoted to describing solvent effects on the photoluminescence of AuNCs. Typically, Chen and co-workers were the pioneer group who investigated atomically precise Au8NCs formed by the etching of gold nanocrystals with biomolecules like deoxyribonucleic acid (DNA).42 Then they interrogated the fluorescence of these Au8NCs in different organic solvents, including chloroform, tetrahydrofuran and N,N-dimethylformamide (DMF). They concluded that the surface properties of Au8NCs play a major role in these solvent effects. Subsequently, Yi et al. explore the ligand- and solvent-dependent electronic relaxation dynamics of certain phenylethane-thiol-stabilised atomically precise monolayer-protected cluster-type AuNCs.43 They found that the electron relaxation dynamics in these clusters are solvent independent and they determined that the electronic–vibrational coupling in these systems is significant.
Recently, many authors have used solvatochromism as an efficient tool for unravelling the fluorescence mechanisms of CDs. In most cases, they suggest that the fluorescence emission of CDs changes with the solvent. These reports unanimously identified the effect of hydrogen bonding of the solvent on the fluorescence of CDs.44–49
Many research groups reported the heavy atom effect on AuNCs. For instance, Durgadas et al. explored the heavy atom effect of copper(II) ions (Cu2+) on BSA-capped AuNCs.65 Among such research work, mercury(II) ion (Hg2+) and silver(I) ion (Ag+) induced quenching of protein-templated AuNCs is very interesting, because Hg2+ and Ag+ can interact with AuNCs via the sulfur atoms of the ligand.11,66 Moreover, the metallophilic d10–d10 interaction of Hg2+ or Ag+ with Au+ at the surface of AuNCs also plays an important role in their quenching mechanism. By realising the importance of the heavy atom effect on sensor design, Sony's group has tried the fluorescence quenching of 3,4-dihydroxy-L-phenylalanine (L-DOPA)-protected AuNCs with paramagnetic transition metal ions of the 3d series.67 As evidence of the heavy atom effect by halide ions on AuNCs, Sony's group has explored iodide-ion-induced quenching on BSA-capped AuNCs and used the affinity between iodide ions and amino acids for demonstrating an on–off–on mode sensor for cysteine and homocysteine.68 Motivated by these results, Sony's group extended iodide-ion-induced quenching to a CD platform and proposed an iodide-ion-quenched CD as an on–off–off mode sensor for tyrosine.69
The heavy atom effect appears to be a good tool with which to explore the fluorescence mechanism of CDs. In particular, the Kumbhakar group performed fluorescence quenching experiments on CDs with iodide ions to establish the self-assembly nature of CDs in solution.70 Subsequently, Sony's group demonstrated the heavy atom effect of differently doped CDs with halide ions.71 In addition, there have been numerous reports of metal ion quenching on CDs.72 In contrast, detailed investigations of the heavy atom effect on quantum dots are scarce. Typically, Masteri-Farahani and Khademabbasi explored the sodium-halide-ion-induced heavy atom effect on mercaptoacetic-acid-capped CdS quantum dots.73
Most importantly, doping with suitable non-toxic metal cations of copper, silver and manganese (transition metal ion series) can create intermediate energy levels between the discrete energy levels of quantum dots and cause enhanced quantum yield, improved lifetime, a large Stokes shift and new fluorescence bands.74 [See the review article by Wu and Yan for details].
Doped or alloyed ultra-small luminescent AuNCs have unique optical and catalytic properties.75 Interestingly, platinum- or palladium-doped AuNCs were found to be more stable than homo-AuNCs. In contrast, silver- or copper-doped AuNCs were less stable. However, silver doping is a widely adopted technique to improve the quantum yield of AuNCs.76
Heteroatom doping with nitrogen, sulfur, phosphorous, boron, and metal ions of copper, manganese, iron, zinc, terbium, and gadolinium has been extensively investigated in the CD matrix.18 Oxygen-rich surface functional groups like –COOH or –OH are common in all types of CDs.77 These functional groups (known as surface states) have an influence on the emission from CDs.78 In this way, heteroatom doping has great potential for fluorescence tuning. In particular, the atomic size of nitrogen and carbon are comparable, so nitrogen doping in CD is a widely studied doping technique. Yu's group investigated sulfur and nitrogen co-doped CDs synthesised from citric acid and L-cysteine, and developed a model to understand the fluorescence mechanism of heteroatom-doped CDs (see Fig. 7).33 They claimed that pristine CDs with oxygen-rich surface functional groups exhibited an array of energy levels matching various surface states (oxygen states). The surface states produced a broad UV-visible absorption band and excitation-dependent fluorescence. The heteroatom doping created a new form of surface state known as the nitrogen state. The excited electrons trapped in these nitrogen states induce high radiative recombination. If the density of the nitrogen states is proportional to that of the oxygen states, doped CDs will give wide and excitation-dependent fluorescence. Several authors have reported on the tuning of nitrogen content on CDs for obtaining a desired fluorescence shift from the blue or green to the red or near infra-red region.20 In particular, Xiong's group reported on the synthesis of NCD from urea and phenylenediamine and the separation of NCD fractions via silica column chromatography.79 The separated fractions of the NCDs exhibit excitation-independent fluorescence varying from the blue to the red region. They attribute the red shift in emission to a decrease in bandgap with increased content of oxygen species in the surface state. In a recent report, Zhang et al. synthesised CDs from o-phenylenediamine and demonstrated simultaneous red fluorescence (at 620 nm) and two-photon absorption of near-infrared (NIR)-induced red fluorescence (630 nm and 680 nm) simply by protonating their NCDs.80 They found that a molecular fluorophore named 2,3-diaminophe-nazine (known as the molecular state) formed on oxidation of the precursor played a significant part in the fluorescence of these doped CDs.
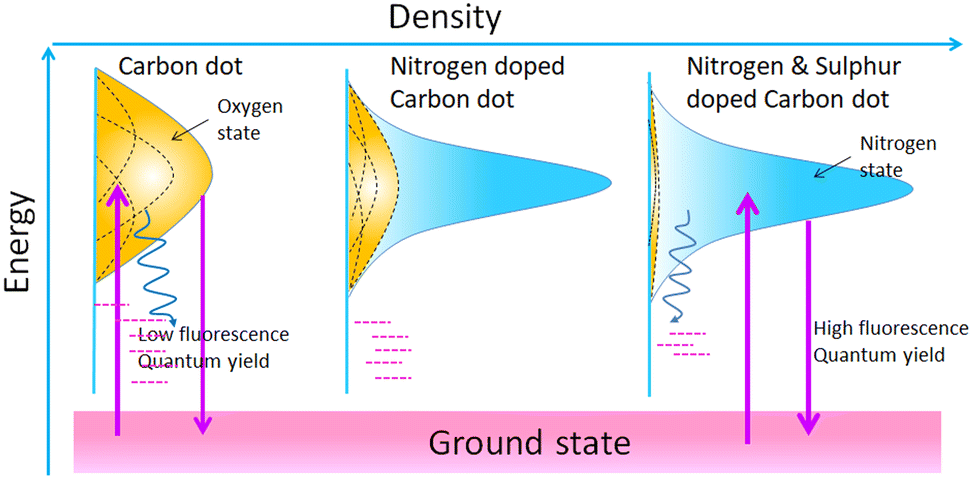 | ||
| Fig. 7 Scheme representing the improved fluorescence quantum yield of carbon dots on doping with nitrogen and sulfur. The upward violet arrow indicates electronic excitation from the ground state. These excited electrons get trapped at oxygen-derived surface states and are returned to the ground state via non-radiative routes (curved blue arrow). In the presence of nitrogen states, the rate of radiative transition (downward violet arrow) from the excited state to the ground state is increased. | ||
2. Luminescent ultra-small nanomaterials
The extremely small size regime of ultra-small nanoparticles induces many unique properties, such as high surface to volume ratio, fluorescence, catalytic activity as well as chirality. In addition, fluorescent AuNCs and CDs are widely known for their biocompatibility.12,81 Due to these unique features, ultra-small nanoparticles have attracted widespread research interest for a wide landscape of applications ranging from energy devices and catalysts to fluorescent sensors. This growing interest was established with the award of the 2023 Nobel Prize in Chemistry to Moungi G. Bawendi along with Louis E. Brus and Aleksey Yekimov “for the discovery and development of quantum dots.”822.1. Quantum dots
Fluorescent quantum dots are ultra-small nanoparticles of diameter 1 to 6 nm.83 Quantum dots include semiconductor nanoparticles from Group IV (silicon or germanium) as well as alloyed semiconductor nanoparticles with elemental combinations from Groups II–VI (CdE or ZnE, E = S/Se/Te), IV–VI (PbE), III–V (InP) and I–III–VI (CuInS2, CuInSe2).8 Among these alloyed quantum dots, CdSe- or CdTe-based core and core–shell quantum dots have received a lot of research attention for analytical applications due to their strong quantum confinement effect and high fluorescence quantum yield.16 Even though quantum dots were discovered in 1981,84 their synthesis was a challenging task until 1993 when Bawendi and coworkers proposed a classical hot injection method for cadmium-based quantum dots from a precursor solution of dimethyl cadmium and trioctylphosphine chalcogenide or hexamethyldisilathiane in a high-boiling-point coordinating solvent (trioctylphosphine oxide).85 However, the biocompatibility of quantum dots became an issue and a lot of research work concentrated on alternative cadmium precursors. Then quantum dot synthesis employing CdClO4, cadmium oxide,86 cadmium carbonate and cadmium acetate87 was demonstrated.88 Instead of toxic phosphine derivatives, oleic acid and octyl decyl amine have been used.88,89 Nowadays, quantum dots can be prepared in organic solvents or aqueous solutions.16,88 Alternatively, approaches based on artificial neural networks attempt to predict the photoluminescence emission spectra of CdSe quantum dots from different reaction conditions (e.g.: precursor composition, choice of ligand, reaction temperature, time) from a combined quantum dot synthesis data set from the literature.90Surface defects on quantum dots can adversely affect the quantum yield of quantum dots because an excited electron in the conduction band of the quantum dot can be nonradiatively transferred to these surface defects created by oxygen vacancies, trap states or defects.91 Photoblinking (a random transition from an on to an off state) is another problem which hinders the wide application of quantum dots in single-molecule experiments.92 The blinking behaviour of a single quantum dot is thought to be caused by the non-radiative recombination of electron–hole pair excitons in the off state.93 The duration of the off state follows Lévy statistics and is marked by observable and long non-emissive periods.94 So, there have been reports on the construction of non-blinking giant quantum dots by expanding the shell thickness of core–shell quantum dots up to a diameter of 13–15 nm.92 Similarly, high-quality quantum dots can be synthesised only in the organic phase. Such quantum dots have limited use in bioengineering.93 To overcome these challenges, ligand exchange or surface coating with suitable hydrophilic and biocompatible ligands (e.g.: silica, amino acids, proteins, mercaptocarboxylic acids) are adopted for modifying the quantum dot surface and tuning the material performance for desired bio-related applications.88,91,95 Brus and Efros published a recent review narrating the story of quantum dots from the past to the modern era.96
The photostability of quantum dots is a persistent challenge in nanochemistry due to the increased chances of oxidation, aggregation, and the creation of surface defects on the prolonged storage of quantum dots.88 Zinc-based binary quantum dots and ternary quantum dots could be a remedy for the toxicity issue in association with cadmium-based quantum dots. Even so, there is a strong demand for biocompatible counterparts to quantum dots.8
2.2. Gold nanoclusters
AuNCs are ultra-small gold nanoparticles of diameter 1–3 nm.97 AuNCs show a broad UV-visible absorbance spectrum and molecule-like bright fluorescence over the visible to near-infrared region due to quantum confinement of conduction band electrons to the Fermi wavelength size regime of gold.66 These AuNCs were first discovered in the gas phase.16 Detailed investigation of their unique properties and application for ultra-sensitive detection, bio-imaging and catalysis were hindered until researchers succeeded in synthesising these promising luminescent ultra-small materials in organic and aqueous phases. At present, they are generally prepared either by the etching of larger gold nanostructures or the reduction of a suitable gold salt in the presence of a stabilising agent like small thiolate or carboxylate ligands, proteins and polymers.8 The as-obtained atomically precise AuNCs are stabilised in the pockets of proteins, polymers or small ligands.16The fluorescence emission from AuNCs is determined by several factors like Au0 core size, the Au+ content of the surface shell over the inner core, surface ligands and the valence state of the AuNCs.10 Approaches based on machine learning evaluate the correlation between the physical properties of AuNCs and various reaction condition parameters by analysing a selected finite number from previous literature.98–100 However, optimisation of all variables and reaction parameters can be puzzling, owing to restricted knowledge about efficient combinations in the vast chemical space.101 Many thiol-capped AuNCs exhibit a large Stokes shift and a long microsecond lifetime.14 The unique behaviour of these thiol-capped AuNCs is correlated with the ligand-to-metal charge transfer (LMCT) interactions between sulfur atoms and the gold centre.14 Besides, the Au0@Au+–thiolate core–shell structure of these thiol-capped AuNCs holds oligomeric interlocked Au+-ligand motifs in the exterior shell over the inner Au0 core (Fig. 8). The aggregation-induced emission (AIE) of the oligomeric Au+–thiolate complex on the surface of the Au0 core makes a major contribution towards the long lifetime and large Stokes shift of their strong luminescence.28 More specifically, this model claimed that the process behind the aggregated Au+–thiolate-motif-induced phosphorescence is an LMCT or ligand-to-metal–metal charge transfer (LMMCT), which produces radiative recombination of excitons via a metal-centered triplet state (see Fig. 9).102 Easy access to the triplet state is facilitated by improved spin–orbit coupling in the presence of a heavy inner Au0 core. Yet, the emission mechanism behind the AuNCs is not completely understood. Moreover, the fluorescence quantum yield of many monolayer-protected AuNCs is low. Therefore, researchers are driven by curiosity to explore AIE-type AuNCs in detail to achieve AuNCs with good quantum yield as a substitute for organic dyes or typical quantum dots for practical applications, even though precursors for AuNCs are rare and costly. Thus, there is a consistent demand for other biocompatible quantum dots from cheap and abundant precursor molecules.
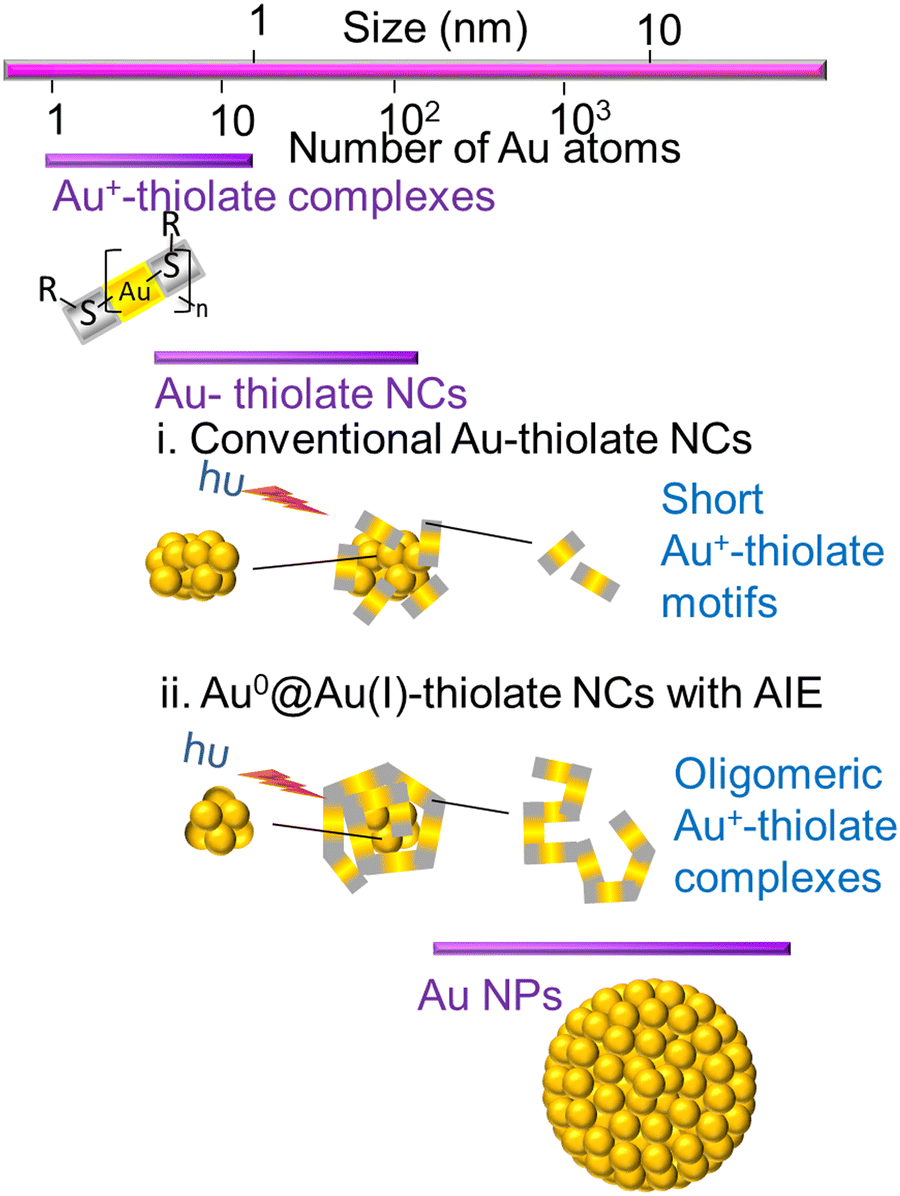 | ||
| Fig. 8 Scheme representing the structures of Au+–thiolate complexes, conventional Au–thiolate nanoclusters with a shell of short Au+–thiolate motifs over an inner Au0 core and Au–thiolate nanoclusters exhibiting aggregation-induced emission (AIE) of an oligomeric Au+–thiolate complex over an inner Au0 core. The structure of gold nanoparticles (AuNPS) with a larger Au0 core is also given for comparison. | ||
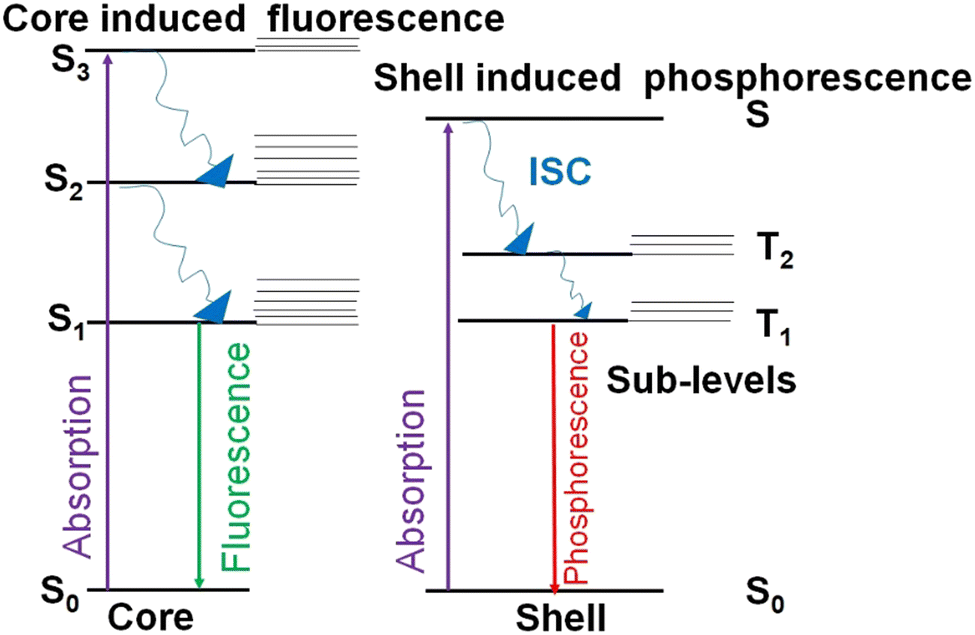 | ||
| Fig. 9 Diagram showing radiative and nonradiative electronic transitions within aggregation-induced emission (AIE)-type AuNCs. The phosphorescence is generated by the AIE of the oligomeric Au+–thiolate complex on the surface shell. The fluorescence arises because of the Au0 core. Sn and Tn represent singlet state and triplet state, respectively. ISC stands for inter-system crossing. | ||
2.3. Carbon dots
Fluorescent CDs are quasi-spherical nanoparticles with a diameter less than 10 nm which consist of a crystalline or amorphous sp2 carbon core embedded in an sp3 carbon matrix (Fig. 10).12 CDs are proposed as a better substitute for classical fluorescent quantum dots because of their superior qualities like biocompatibility, chemical inertness, water-solubility, easy functionalization and low cost of synthesis.18 The discovery of fluorescent CDs in 2004 was serendipitous while attempting the separation and purification of single-walled carbon nanotubes prepared through an arc discharge method.103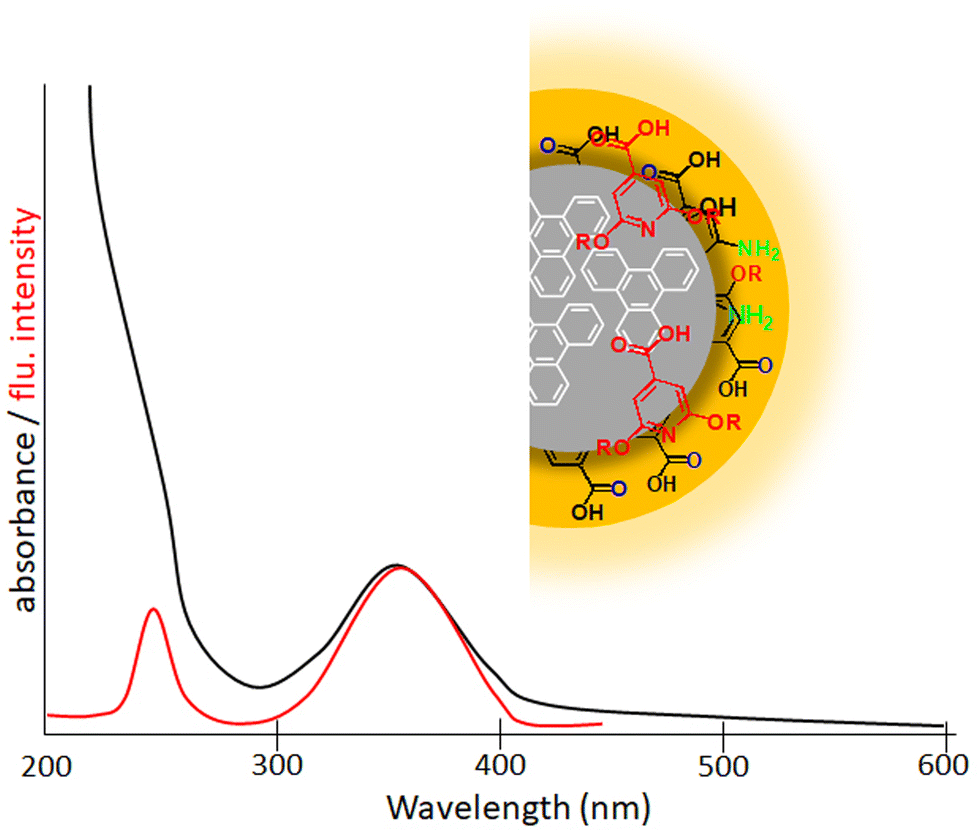 | ||
| Fig. 10 Scheme representing the structure of a carbon nanodot. The inner carbon core of a carbon nanodot is composed of numerous conjugated π-domains. The surface functional groups connected to this inner core are termed the surface state. The fluorescent molecule (red molecular entities) connected to the surface or interior of the carbon core are known as the molecular state. A representation of a typical excitation spectrum (red line) and absorption spectrum (black line) of carbon dots is also given. | ||
Subsequently, the discovery of a reliable synthetic methodology for CDs has become an interesting research topic. Sun and colleagues synthesised CDs via the laser ablation of carbonaceous material and subsequent surface functionalization of the obtained non-fluorescent nanoparticles with amine-terminated polyethylene glycol.35 This group suggested the name ‘carbon quantum dots’ because they expected that the multiple excitation-dependent emission of the obtained CDs was evidence of quantum confinement and size effects. Next, the synthesis of CDs via electrochemical oxidation of graphite or multi-walled carbon nanotubes attracted tremendous attention because it was identified as an easy and cheap method to yield CDs in high quantity.18,104 However, these top-down approaches demand several complex, time-consuming and expensive post-synthetic treatments like surface functionalization. To overcome the limitations of top-down methods, bottom-up methods based on templates, the hydrothermal, microwave or ultrasound assisted decomposition of small molecules like glucose, citric acid, urea, or phenylenediamine80 were widely adopted to synthesise CDs.79,105–107 Some groups attempted machine learning (e.g.: artificial neural network) assisted CD synthesis.108
Kasprzyk and coworkers isolated fluorescent molecules including several citrazinic acid derivatives from the reaction product formed on the decomposition of organic molecules.109,110 So substantial attention has been paid to a theory based on the molecular fluorescence of CDs (Fig. 10).37,111,112 Although, researchers were very curious as to why the excitation spectrum of CDs does not coincide with the absorption spectrum. Further, single-particle spectroscopic studies reveal that individual particles do not exhibit the same spectral or lifetime heterogeneity as their ensemble. To answer these contradictions, Demchenko et al. proposed an ‘H-like emissive aggregate model’ for CDs by considering the presence of surface-exposed fluorophores (Fig. 11).49,70,113–115 The theory of ‘J and H molecular aggregates’ was originally framed by Kasha and co-workers.30,116 The positive Coulomb coupling (parallel arrangement) between component fluorophores produced weakly emissive H-aggregates (abbreviated ‘H for hypsochromic’), which are distinguished by a hypsochromic (blue) shift in the absorption/excitation spectrum, a marked red shift in suppressed fluorescence, and an increase in the rate of phosphorescence through intersystem crossing. Blue-shifted fluorescence and bathochromic shift (red shift) in the absorption/excitation spectrum are the hallmarks of superradiant J-aggregates, also known as Sheibe aggregates (J for E. E. Jelly, who discovered this form of aggregate in 1936). Yet, it is difficult to draw far-reaching conclusions on this issue and this latest J- and H-aggregate concept requires more cautious and careful investigation to achieve reliability of the emissive aggregate structure, especially for CDs from other precursor molecules. Besides, there are literature reports considering molecular fluorophores in CDs as being the consequence of impurities due to the use of inadequate purification techniques.117 Concurrently, multiple fluorescence emission bands from certain CDs are observed at a single excitation wavelength.118 These multiple emission bands are interpreted as individual contributions from the quantum confinement effect, surface defects and molecular fluorescence (Fig. 12). In this context, the absence of a unified emission mechanism for CDs has hindered their fluorescence tuning to the desired wavelength region and complete fulfilment of their potential applications like bio-sensing and bioimaging.64,70
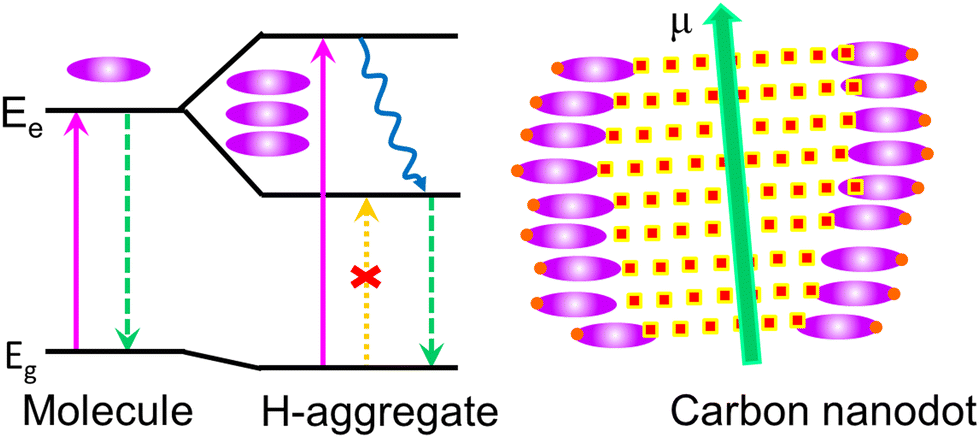 | ||
| Fig. 11 The proposed ‘H-like emissive aggregate model’ for carbon dots. The H-like aggregates are formed by side-by-side arrangement of component fluorophores (represented by oval-shaped structures), which results in the splitting of excited-state energy levels into two. Among both these excited-state energy levels, excitation to higher excited level is the only allowed transition. However, there is excited electron non-radiative relaxation (curved arrow) to the lower excited level, and emission occurs from this lower excited level. This causes a large Stokes shift. The carbon dots are carbonised nanoparticles with numerous surface-exposed fluorophores assembled as H-aggregates. | ||
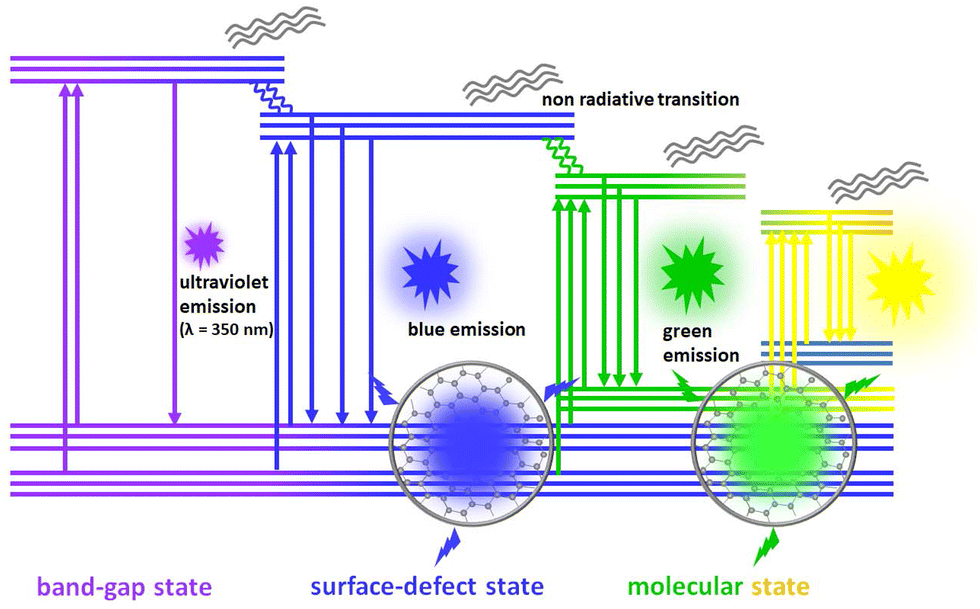 | ||
| Fig. 12 The fluorescence emission mechanism in multiemission carbon dots is described as individual contributions from the quantum size effect, surface state and molecular state. | ||
3. Fluorescence quenching
A wide variety of substances, including metal ions, molecules and nanomaterials can cause fluorescence quenching (a decrease in fluorescence intensity) of ultra-small nanoparticles. The quenching process requires intimate contact between fluorescent ultra-small nanoparticles and quenchers. Consequently, quenching measurements can reveal the accessibility of fluorescent centres to quenchers. Thus, the occurrence of quenching depends on the quenching mechanism and the structure of the ultra-small nanoparticles. So, a detailed investigation of the fluorescence quenching of ultra-small nanoparticles provides a hint about the structural aspects of these materials. Four fundamental types of fluorescence quenching have been identified and form the main topic of discussion in this section (Fig. 13).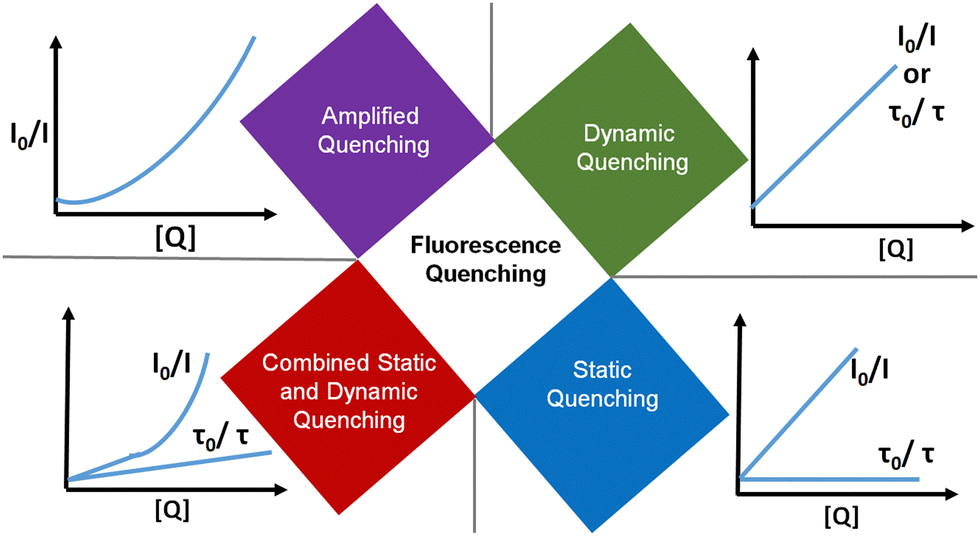 | ||
| Fig. 13 The four fundamental types of fluorescence quenching are: dynamic quenching, static quenching, combined static and dynamic quenching, and amplified quenching. The representative kinetic curves are given to the side. | ||
3.1. Dynamic quenching
Dynamic quenching of fluorescence is described by the Stern–Völmer equation: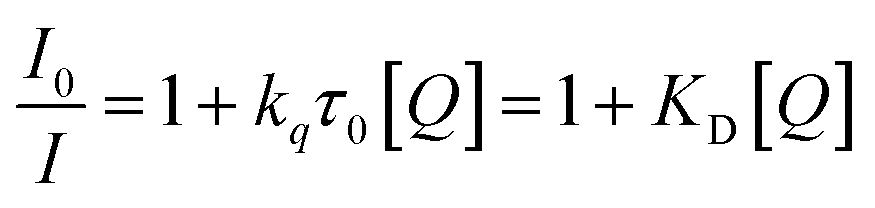
In this equation, I0 and I are the fluorescence intensities of a fluorescent material in the absence and presence of a quencher, respectively, kq is the bimolecular quenching constant, τ0 is the lifetime of a fluorescent material in the absence of a quencher, and KD is the Stern–Völmer quenching constant. A linear plot of I0/I versus concentration of a quencher give an intercept of one in the y-axis and a slope equal to KD. For dynamic quenching, 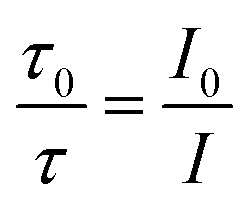 , where τ0 and τ are the fluorescence lifetime in the absence and presence of a quencher. Dynamic quenching affects only the excited state of the fluorescent material and has no effect on the absorption spectrum of the fluorescent material. The rate of dynamic quenching increases with temperature and decreases with viscosity because these parameters can influence the collision rate.
This type of quenching mechanism is observed for many ultra-small nanoparticles. Notably, the fluorescence quenching of homocysteine-capped CdTe quantum dots by Cu2+ ions illustrates this mechanism.119 To prove its dynamic quenching mechanism, quenching experiments at different temperatures (293 K, 298 K, 303 K) were conducted and a proportional rise in Stern–Völmer quenching constant was observed. This is due to enhanced collisions and dynamic quenching effect with a rise in temperature. Similarly, Ungor and colleagues conducted temperature-dependent fluorescence quenching experiments on λ-globulin-immunoprotein-stabilised red-emitting AuNCs by using L-kynurenine (a tryptophan metabolite) as a quencher.120 They also observed evidence of dynamic quenching in this system. In another case, Zhang et al. reported the dynamic quenching of DNA-stabilised AuNCs with added glutathione.121 They confirmed the quenching mechanism using UV-visible absorption spectroscopy. These authors found a similar null effect in the absorbance spectrum of AuNCs after the addition of glutathione and concluded that it was an example of dynamic quenching. Furthermore, water molecules can cause the dynamic quenching of a CD dispersion in an organic solvent and this work was reported by Zheng and group members. They clarified the mechanism using time-resolved fluorescence spectroscopy and UV-visible absorption spectroscopy.122 They noticed that the UV-visible absorption spectra of CDs and a CD–water system are superimposed on one another. This indicates dynamic quenching. In addition, they confirmed the dynamic quenching mechanism by observing the variation in the fluorescence lifetime of the fluorophore in the presence and absence of water molecules.
3.2. Static quenching
The kinetics of static quenching can be represented as: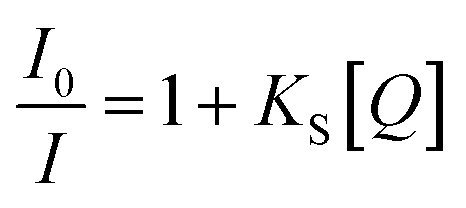
In this equation, KS is the association constant. The measurement of fluorescence lifetime is the most appropriate method to distinguish static and dynamic quenching, because 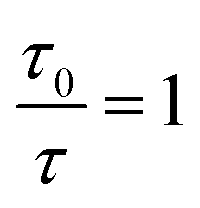 for static quenching. The static quenching mechanism is the formation of a non-fluorescent ground-state complex between the fluorescent material and a quencher and it shows significant changes in the absorption spectrum of the fluorescent material.
The fluorescence quenching of a CdS quantum dot/N-methylpolypyrrole hybrid by picric acid is one static quenching experiment in the literature.123 In this case, the static quenching mechanism is confirmed by observing the formation of a new absorption peak upon the addition of picric acid to this fluorescent material. Subsequently Ma et al. reported the static quenching of orange fluorescence of CDs by Ag+ ions.124 This group also found a notable difference between the absorption spectrum of the CDs before and after the addition of Ag+ ions. However, the fluorescence lifetime of the CDs was 2.42 and 2.43 ns before and after the addition of Ag+ ions. Then, Santhosh et al. demonstrated the static quenching of human-serum-albumin-stabilised AuNCs with bilirubin.125 This research group also underlined that the fluorescence lifetime of a fluorescence material remains unchanged on static quenching.
3.3. Combined static and dynamic quenching
An upward-curving Stern–Völmer plot is strong evidence for combined static and dynamic quenching. The kinetics for this quenching process can be described as: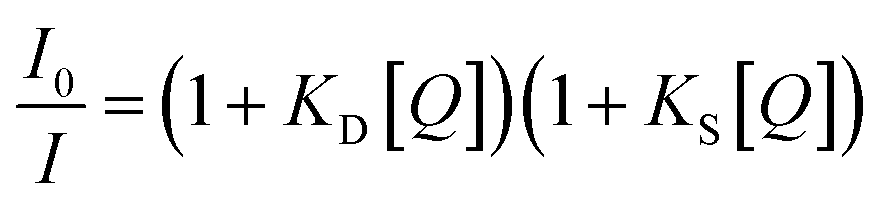
This equation is second order in [Q], which accounts for the upward-curving Stern–Völmer plot. More specifically, this type of quenching is observed on the interaction of CdTe quantum dots with protamine sulfate.126 These authors noted a drastic increase in the slope of the Stern–Völmer plot with an increase in the temperature of the quenching experiments. This observation indicates dynamic quenching, but they did not find a corresponding decrease in the fluorescence lifetime proportional to the changes in fluorescence intensity. Hence, they monitored the zeta potential values of the quantum dots, which indicated a significant increase from −19.3 mV to +19.8 mV after the addition of protamine sulfate. The TEM image demonstrates aggregation in the quenching process. As a result, the authors proposed a combined static and dynamic quenching mechanism. Similarly, Anand et al. reported that the Stern–Völmer plot for the quenching of L-cysteine-functionalised CdS quantum dots with tetracycline displays a positive deviation and is concave to the y-axis.127 Further, they observed a considerable decrease in the fluorescence lifetime on quenching. Then a linear plot of 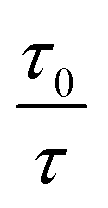 versus concentration of tetracycline gives a slope equal to KD. From their fluorescence quenching data, they calculated the value of KS using the standard method and found that KD > KS. Dynamic quenching predominates over static quenching in this case. Subsequently, Lin and co-workers demonstrated the combined static and dynamic quenching of PAMAM-dendrimer-entrapped Au8NCs by a paramagnetic nitroxide radical.128 Similarly, this type of quenching mechanism was used by Gagoi and Khan for designing a CD-based fluorescence immunosensor for cardiac Troponin T.129 This work illustrates FRET from CDs to a molybdenum disulfide nanosheet. However, plots of
 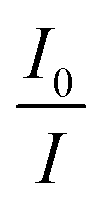 versus concentration of the molybdenum disulfide nanosheet and
  versus the concentration of molybdenum disulfide nanosheet do not coincide. This suggests the minor involvement of a static quenching mechanism. Moreover, the plot of
  versus quencher concentration displays an upward curvature.
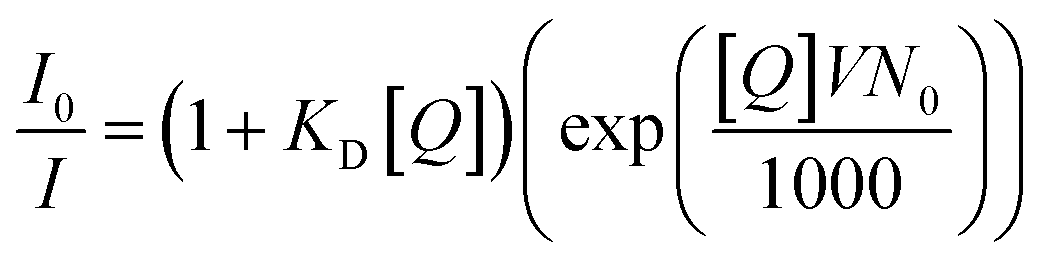
3.4. Amplified quenching (or quenching sphere of action)
Amplified quenching is identified as evidence of aggregation, strong complex formation between the quencher and fluorescent material, as well as long-distance migration of a singlet exciton to the quencher trap state. Amplified quenching is achieved when the Stern–Völmer equation follows an exponential function,where V is the volume of the sphere and N0 is Avogadro's number.1 Importantly, fluorescence quenching of certain oleic-acid-capped CdSe quantum dots with nitroaromatic explosives follows this mechanism.130 Interestingly, Giri and co-workers found that the fluorescence quenching of graphene quantum dots with single-walled carbon nanotubes followed an exponential Stern–Völmer plot.131 Anjali Devi et al. demonstrated an amplified fluorescence quenching effect on citric-acid–urea-derived CDs by transition metal ions (e.g.: Fe3+, Ru3+, Cr6+) in polar solvents (DMSO and water).115
4. Quantitative parameters of luminescent sensors
The quality and performance of luminescence sensors are validated using different detection parameters.4.1. Stern–Völmer quenching constant
The Stern–Völmer quenching constant (KSV) is the product of kq (the bimolecular quenching constant) and τ0 (the lifetime of the fluorescent material in the absence of a quencher). The Stern–Völmer constant is widely adopted for describing the quenching of many ultra-small nanoparticles.4.2. Limit of detection and quantification
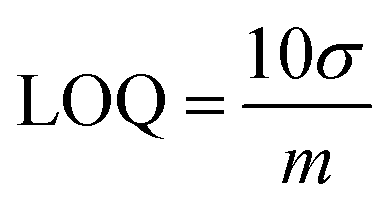
The limit of detection (LOD) is also called the lower limit of detection.132 It is the smallest amount of analyte that can be reliably measured with a given analytical method.7where σ is the standard deviation of a low-concentration sample and m is the slope of the calibration curve.
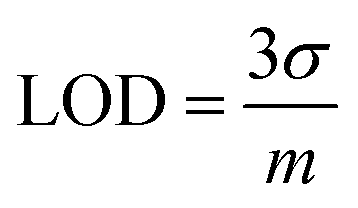
The instrument detection limit is calculated by replicate (n ≥ 7) measurements of an aliquot from one sample. The method detection limit will be greater than the instrument detection limit. The method detection limit is calculated by preparing different individual samples and analysing each at a one time.132
Standard deviation is the degree of noise (random variation) in the blank or a small signal. When the signal is three-fold larger than noise, it is detectable. But it is not enough for accurate measurements. A signal which is ten-fold larger than noise is termed the limit of quantification (LOQ). LOQ is the smallest amount of analyte that can be accurately measured with a given analytical method:7,132
5. Underlying principles of luminescent ultra-small nanoparticle sensors
A survey of the literature on ultra-small nanoparticle sensors reveals that chemical interaction of the analyte with sensors occurs and this event will be transmitted to the observer as quantitative changes in the fluorescence signal. Several chemical interactions and fluorescence quenching mechanisms were responsible for changes in fluorescence intensity and the emission wavelength of ultra-small nanoparticles has the potential to be used as an indicator for analytes.5.1. Non-covalent interactions
The non-covalent interaction between ultra-small nanoparticles and analyte molecules is very common. Here, we illustrate a small collection of examples discussing various non-covalent interactions in the literature (Fig. 14).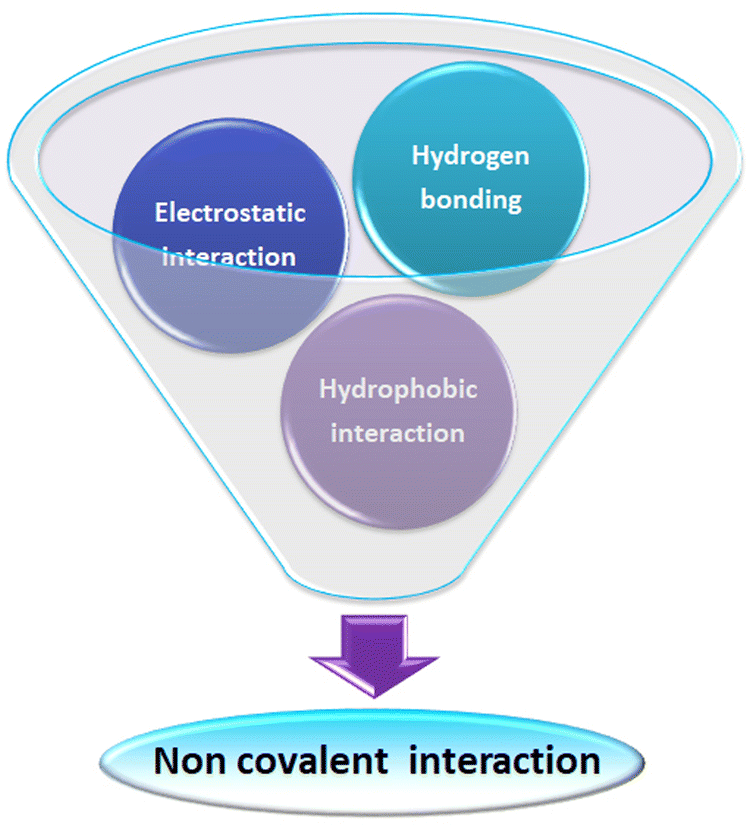 | ||
| Fig. 14 Scheme representing various non-covalent interactions operating between ultra-small nanoparticles and analytes during the sensing process. | ||
Chen and co-workers demonstrate hydrogen bonding and electrostatic interaction between dopamine and (3-aminopropyl)trimethoxysilane-capped silicon nanoparticles.141 Similarly, Ma et al. reported on electrostatic and hydrogen bonding interactions between heparin and silicon nanoparticles prepared from 3-aminopropyltriethoxysilane and L-ascorbic acid.142
Sciortino et al. reported that citric-acid–urea-co-derived CDs show a strong response towards the hydrogen bonding interactions of the dispersing solvent.46 They proposed these CDs as an example of a solvent polarity indicator. Subsequently, Anjali Devi et al. reported the hydrogen-bonding-directed J/H-aggregate-like nature of citric-acid–urea-based CDs in polar solvents.49
Heintzelman and co-workers investigated the fluorescence of particular phosphine-protected AuNCs {i.e., [Au11(BINAP)4X2]+ where X = Cl, Br} in different solvents like dichloromethane, methanol, or ethanol. They observed that hydrogen bonding between halogen in the surface of the AuNCs and the dispersing solvent is crucial in intense photoluminescence and produced a 2-fold reduction in vibration-mediated non-radiative pathways. They noted the quenching of these AuNCs in a solvent which has no favourable hydrogen bonding.143
5.2. Mechanism of luminescence sensing
This section is devoted to outlining various fluorescence quenching mechanisms reported in the literature for designing selective, sensitive and fast-response fluorescence detection strategies using ultra-small nanoparticles (Fig. 15). These mechanisms are not mutually exclusive, so that several reports interrogate whether fluorescence quenching occurs via combinations of these mechanisms.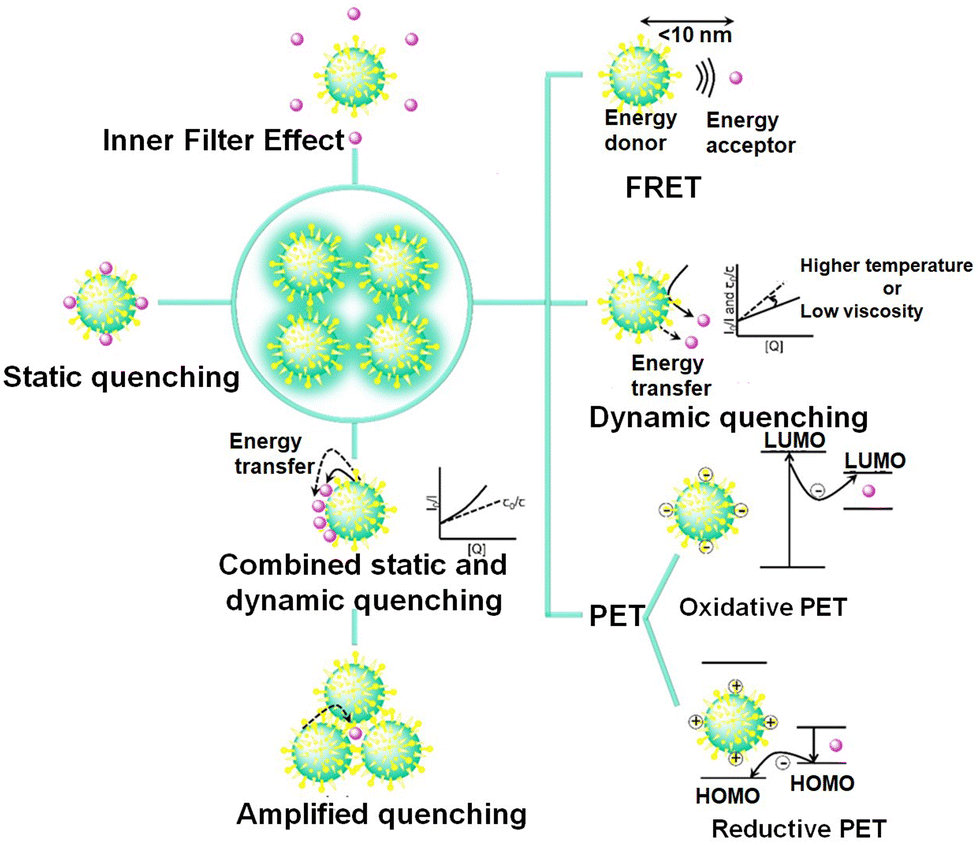 | ||
| Fig. 15 The fluorescence quenching mechanisms used for designing fluorescence detection strategies with ultra-small nanoparticles. | ||
5.2.1.1. Quantum dots. In many FRET sensors, quantum dots act as a donor fluorescent material. Importantly, Miao et al. reported a FRET-based aptasensor for chloramphenicol, which works on the energy transfer from CdSe quantum dots to DNA-labelled iron-oxide-linked silica-coated gold nanoparticles (AuNPs). This method has a linear range of 0.001–10 ng mL−1 with a detection limit of 0.0002 ng mL−1.144 Similarly, Chang et al. used FRET between glucosamine-coated manganese-doped ZnS quantum dots and mercaptophenyl-boronic-acid-capped AuNPs for the detection of glycoproteins like immunoglobulin G, transferrin, α1-acid glycoprotein and horseradish peroxidase.145 FRET-based sensors are efficient enough to accomplish accurate bioanalysis. Subsequently, many authors reported FRET sensors for gene detection. For instance, Shamsipur et al. designed a FRET nanosensor for a BCR/ABL fusion gene in patients with chronic myelogenous leukemia.146 They used 18-mer-oligonucleotide-conjugated CdTe quantum dots as a donor and methylene blue as an acceptor. The hybridisation of DNA on the quantum dot surface to target the BCR/ABL fusion gene ensures the proximity of methylene blue and quantum dots and this proximity enables FRET. This FRET nanosensor provides fluorescence enhancement of methylene blue on photoexcitation of the quantum dots as the signal for quantitative detection. In many other cases, quantum dots act as an acceptor in a FRET sensor. For instance, Borghei et al. used FRET from DNA-conjugated silver nanoclusters to thioglycolic-acid-capped CdTe quantum dots for detecting the BRCA1 gene in human breast cancer cells (MCF-7).147
5.2.1.2. CDs. There have been numerous efforts to design FRET sensors working on the fluorescence of CDs. For instance, Shu et al. tried the ratiometric fluorescence imaging of intracellular zinc in MCF-7 cells using FRET between citric-acid–polyethyleniimine-co-derived CDs and fluorescein.148 Ge et al. designed a FRET-based strategy for analysing the antibiotic molecule, D-penicillamine.149 This strategy is based on energy transfer from citric-acid–urea-derived CDs to pH-mediated aggregates of AuNPs. Cheng et al. reported a FRET-based aptasensor for adenosine triphosphate (ATP) using CDs as donor and graphene oxide as acceptor.150 Similarly, a graphene-oxide-CD FRET system was used for the detection of Mucin-1 protein.151 Subsequently, Qaddare et al. proposed a CD and AuNP based FRET-aptasensor for homogeneous HIV-1 gene detection.152 They used a nanocomposite consisting of AuNPs and graphene oxide as acceptor in FRET to achieve amplification of the signal. Chawre et al. constructed a FRET assembly composed of CDs and gold nanorods for the detection of H2O2, glucose, glutathione, and acetylcholinesterase.153
5.2.1.3. AuNCs. AuNPs are widely accepted as efficient quenchers for FRET sensors. There have been several reports regarding the tuning of the structure and shape of AuNPs to achieve a desired absorption property in a suitable wavelength region. For instance, Qin et al. designed a FRET system working in the near-infrared region for the turn-on fluorescence sensing of Glutathione-S-transferase. In this case, AuNCs act as a donor and gold nanorods act as an acceptor.154
5.2.2.1. Quantum dots. Specifically, Jose et al. employed PET-mediated fluorescence quenching of mercaptosuccinic-acid-capped CdTe/CdS quantum dots for the detection of pralidoxime.155 In this case, the oxidation and reduction potentials of the quantum dots were 1.22 V and −1.19 V, respectively. Consequently, the HOMO and LUMO energy levels of the quantum dots were at −5.83 eV and −3.69 eV. The LUMO of pralidoxime is at −4.09 eV. From these values, it is very evident that the LUMO of pralidoxime lies within the HOMO–LUMO energy gap of the quantum dots and this facilitates electron transfer from the LUMO of the quantum dots to the LUMO of the quencher molecule. Huang et al. reported the PET-based off–on mode detection of a ruthenium anticancer drug and calf thymus DNA using CdTe quantum dots.156
5.2.2.2. CDs. The PET mechanism is also common in CDs. The pioneering report on PET-mediated quenching on CDs came from Wang et al. in 2009, who performed fluorescence quenching experiments on CDs with nitroaromatics.56 Subsequently, Qu et al. demonstrated the PET-mediated fluorescence quenching of dopamine-derived CDs with Fe3+ ions.58 Then, many authors assigned the fluorescence quenching of CDs with Fe3+ ions as an illustration of the PET mechanism.157
5.2.2.3. AuNCs. Interestingly, Huang et al. reported the oxidative PET-mediated fluorescence quenching of dithiothreitol–carboxylated-chitosan-co-modified AuNCs with doxorubicin.158 Qu's group and Yun's group demonstrated the dopamine-induced fluorescence quenching of BSA-stabilised AuNCs via a PET mechanism.59,159 Yun's group found that dopamine can transfer a proton to BSA-stabilised AuNCs to form dopaquinone and the florescence of AuNCs was quenched via reductive PET in the presence of dopaquinone.
5.2.3.1. Quantum dots. Khezri et al. designed an IFE-based fluorescence sensor for arginine using L-cysteine-capped CdS quantum dots and gold nanoparticle quenchers.161 Arginine (pI 10.8) has a positive charge and citrate-capped gold nanoparticles have a negative charge at the working pH of the sensor (pH 9.6). The introduction of arginine causes aggregation of the gold nanoparticles to give corresponding colorimetric signals. Meanwhile, IFE on the quantum dots by gold nanoparticles gets broken, which in turn switches on quantitative off–on mode fluorescence signals.
5.2.3.2. AuNCs. IFE-based AuNC sensors have also been widely reported. For instance, Chang et al. used poly(vinylpyrroidone)-protected gold nanoparticles as absorbers of the excitation beam of BSA-capped AuNCs.162 These authors employed in situ syntheses of poly(vinylpyrroidone)-protected gold nanoparticles by the direct mixing of an HAuCl4 solution and poly(vinylpyrroidone) in the presence of hydrogen peroxide (H2O2) as a catalyst. They employed this method for the detection of H2O2 and cholesterol.
5.2.3.3. CDs. A remarkable report on IFE with CDs is the fluorescence quenching of citrate-based CDs with Cr6+ ions.163 Similarly, Sun et al. showed IFE with CDs using vitamin B12 as an absorber.164 Xu and co-workers designed a machine-learning-assisted florescence sensor array based on two different CDs to recognize four variants of tetracycline via an IFE sensing mechanism.165
5.2.6.1. AuNCs. Notably, Xie's group investigated the fluorescence of glutathione-capped AuNCs and found evidence of AIE in these materials.28 They detected the Au0@Au+–thiolate complex structure of glutathione-capped AuNCs. They stated that these structures are formed by aggregation of an Au+–thiolate complex over an Au0 core. Chang et al. also found a similar aggregated structure in L-cysteine-capped AuNCs.169 In another pioneering report, Huang et al. showed AIE enhancement of glutathione-capped AuNCs with human serum albumin.170 Similarly, You et al. demonstrated the AIE enhancement of glutathione-capped AuNCs by peptides like AG73 peptide and glycine-arginine repeat peptide.171 Fu and co-workers reported poly(allylamine hydrochloride)-mediated AIE in (D-/L-)-penicillamine-stabilised AuNCs.172
5.2.6.2. CDs. Interestingly, Gigoi et al. reported AIE enhancement behaviour of CDs while diluting CD dispersions in tetrahydrofuran/water medium with water. Further, they witnessed the fluorescence enhancement of CDs in the presence of cholesterol.173
5.2.6.3. Quantum dots. Similarly, Mou et al. demonstrated the AIE property of Cu–In–S ternary quantum dots while changing the solvent from water to 90% (by volume) DMSO.174 Parthan et al. tried to explore magnetic graphene quantum dots and their AIE enhancement effect for designing a turn-on sensor for As3+ ions.175
6. Self-assembly nature in AuNCs and CDs
6.1. AuNCs
The first report on AIE-type AuNCs came from the Xie group in 2012.14,28,102 They synthesised a series of Au0@Au+–thiolate core–shell nanoclusters with intense luminescence due to the presence of oligomeric aggregates of Au+-SR motifs in the surface shell.28,176 Strategies to enhance the luminescence from these AIE-type AuNCs are as follows: (1) creating elongated or interlocked Au+–ligand oligomeric structures in the exterior shell of the AuNCs; (2) increasing the amount of Au+ leads to stronger aurophilic interactions;177 (3) enhancing Au–ligand bonding to facilitate LMCT or LMMCT; (4) enhancing the stiffness of the protective shell by surface engineering,178 (5) achieving tight inter-cluster stacking by self-assembly or crystallisation.28,179,180 This charge transfer mechanism is substantiated by its long average lifetime in microsecond units. The luminescence decay spectra of thiol-capped AuNCs follows a bi- or tri-exponential fit, which can be resolved into a long microsecond component (phosphorescence) and short nanosecond components (delayed fluorescence181,182 and prompt fluorescence).102 The luminescence from this family of AuNCs can be varied from the visible to the NIR regions simply by increasing the self-assembly or length of the Au+–ligand motifs on the surface shell.102 On the other hand, reductions in the self-assembly pattern or length of Au+–ligand motifs can shift the cluster luminescence from AIE-type phosphorescence to Au0 core-directed fluorescence (Fig. 9).102,1836.2. CDs
One of the main topics of contemporary debates is where the CD fluorescence originates. The amount and arrangement of atoms that make up the core and surface of the CD ensemble must be heterogeneous even after extensive purification, and this influences their features, including optical properties. By the spectroscopic analysis of CDs at the single-particle level and ensemble-averaged level, Demchenko et al. deduced the ‘H-aggregate model’ where CDs are visualised as particles that hold surface-exposed fluorophores and can self-assemble to excitonic H-type aggregates very similar to conventional molecular fluorophore aggregates.113 Further, Kumbhakar's group assigned the huge excitation-dependent/independent emission spectra of citric-acid-derived CDs to multiple discrete electronic states of different aggregates. In this regard, the surface functional groups can determine the pattern and degree of aggregation.70,114 Subsequently, Anjali Devi et al. validated this H-aggregate theory for CD fluorescence by conducting spectroscopic analysis in solvents of different polarity or viscosity.49 They observed evidence for J-type aggregates, H-type aggregates, and higher-order assemblies controlled by dipole–dipole, hydrogen bonding, and charge transfer interactions. Then, an amplified fluorescence quenching experiment on citric-acid-derived CDs with transition metal ions reveals that pyridinic nitrogen bases play a pivotal role in the construction of J-like emissive aggregates.115 Likewise, oxygen-rich surface functional groups are involved in H-like aggregates. The most intense emission, in this case, is provided by the J-like assembly of H aggregates. The heterogeneous aggregate structure in solution is substantiated by the fluorescence decay spectra of citric-acid-derived CDs, following a multi-exponential fit that can be resolved into nanosecond components. These results demand further detailed and cautious investigation on the aggregate chemistry of CDs originating from other precursors.7. Conclusions and perspectives
Recent studies have highlighted the unique features, facile synthesis, and surface modification of ultra-small nanoparticles, fuelling their popularity. These materials offer significant technological benefits over traditional fluorophores, leading to several potential applications, ranging from sensors to catalysts and energy devices. Nevertheless, despite these advantageous features, ultra-small nanomaterial sensors face issues concerning their large-scale fabrication and commercialisation. (See Table 1 for some patented ultra-small nanoparticle sensors.) There is anxiety regarding the safety of ultra-small nanoparticle constituents as well as their assay reproducibility.| Sl no. | Title | Organisation | Ultra-small nanoparticle and its amendments | Analyte | Mechanism of sensing/detection strategy | Point of care device | Patent No. |
|---|---|---|---|---|---|---|---|
| 1. | Method and compositions for biosensing | University of North Carolina at Charlotte, USA | Metal-doped core–shell quantum dots (Groups II–VI/Groups III–V) | Analyte (eg: nucleic acid) | Fluorescence turn-on/turn-off | — | US2020240992A1 |
| 2. | Biocompatible quantum dot sensor | Veinot Jonathan, Robidillo Christopher Jayt | Green fluorescent protein and silicon quantum dots | Analyte | Fluorescence turn-off | — | US2022050099A1 |
| 3 | Gold/quantum dot nanoprobe for detecting active ricin in complex matrix and use thereof | Beijing Center for Disease Prevention and Control | Gold nanoparticle quenched quantum dots | Active recin | Fluorescence turn-on | — | WO2020147735A1 |
| 4 | Method for the detection of silica nanoparticles and/or graphene nanoplates | Fondazione st Italiano Technologia; Inail Instituto Naz per Lassicurazione Contro Gli Infortuni Sul Lavoro; Italy | Carbon dots | Silica nanoparticle/graphene nanoplates | Fluorescence turn-off | — | WO2022219461A1 |
| 5 | Nanocomposite fluorescent probe for visibly detecting quercetin and preparation method thereof | Qingdao University, China | Carbon dots/rhodamine 6G | Quercetin | Fluorescence turn-off | Filter paper | WO2020186503A1 |
| 6 | Detection kit and method of detecting abused drugs | National Taiwan University, Taiwan | Carbon dots from D-phenylalanine | Nimetazepam, flunitrazepam, clonazepam, nitrazepam, and nitro-substituted benzodiazepine | Fluorescence turn-on | Detection kit | US11360082B2 |
| 7 | Fluorescence test paper for detecting mercury ions and detection method using the same | Jiangsu University, China | Carbon dots and copper nanoclusters | Mercury ions | Fluorescence ratiometric sensor | Test paper | US11378519B2 |
| 8 | Carbon quantum dots with improved optical properties | Juame I University, Spain | Carbon dots (boronic acid functionalised) | Monosaccharide, (eg: glucose) | Fluorescence sensor (turn-off) | — | WO2020254550A1 |
| 9 | Gold nanoclusters, dopamine biosensors including them, and methods for diagnosing neurological diseases using the same | Industry Academic Cooperation Foundation of Yonsei University, Korea | Glutathione stabilised gold nanocluster (functionalised with benzyl chlorformate and aminobenzoboroxole) | Dopamine, glycoproteins | Fluorescence sensor (turn-on) | — | US20230341420A1 |
| 10 | Device for visual detection of bilirubin | Indian Institute of Technology, Guwahati, India | Cu2+ ion quenched chitosan stabilised gold nanocluster | Bilirubin | Fluorescence sensor (turn-on) | Polymer membrane strip | US11268967 |
It is necessary to implement proper standard synthetic protocols for CDs and AuNCs, ensuring consistent size, shape, composition, and surface modification to facilitate better immobilisation, enhanced sensitivity, and specific interactions. The relationship between structure and optical properties in these new materials is unclear. The formation of excited states that affect absorption and fluorescence emission spectra is not fully understood. There is a significant drive to identify a unified emission mechanism hidden behind these nano-materials to achieve reliable control over their material performance. Remarkably, the excitation-dependent emission of CDs remained an active debate topic before the research community. In this aspect, an emissive aggregate model for fluorescence is still a growing area of research not only for CDs but also for AuNCs.
With the advancement in machine learning technology, many ultra-small luminescent sensors are being applied in portable, artificial-intelligence-based smart devices.184 However, such on-site devices suffer from issues of biofouling and limited recyclability, which restrict their usage in regular real-time monitoring.185 Existing research should be directed to transfer overall analyte detection strategies from the benchtop in the laboratory to simple smart on-site devices to develop lab-independent, decentralized, personalised analytical techniques that are economic, quick, high output, and mobile. Smart and innovative devices can also be made available which can be easily linked to smartphones and tablets. Future research will shed more light on their limitations and shortcomings.
Conflicts of interest
The author(s) declare no competing financial interest.Acknowledgements
The authors gratefully acknowledge the encouragement, generous support, and facilities from the Professor & Head of the host institutions. The authors are grateful to Ms R. R. Anjana for her assistance in developing pictorial representations in the manuscript. J. S. Anjali Devi acknowledges the Department of Science and Technology, Govt. of India for the DST-INSPIRE Fellowship (IF 150393).References
- J. R. Lakowicz, Principles of Fluorescence Spectroscopy, Springer US, 2013 Search PubMed.
- M. G. Lagorio, G. B. Cordon and A. Iriel, Photochem. Photobiol. Sci., 2015, 14, 1538–1559 CrossRef CAS PubMed.
- Granite, Fluorescence, Phosphorescence and Photoluminescence Differences, https://www.edinst.com/blog/photoluminescence-differences/, (accessed 14 February 2024).
- W. J. Peveler and W. R. Algar, ACS Chem. Biol., 2018, 13, 1752–1766 CrossRef CAS PubMed.
- Z. Yang, J. Cao, Y. He, J. H. Yang, T. Kim, X. Peng and J. S. Kim, Chem. Soc. Rev., 2014, 43, 4563–4601 RSC.
- X. Sun, Y. Wang and Y. Lei, Chem. Soc. Rev., 2015, 44, 8019–8061 RSC.
- T. L. Mako, J. M. Racicot and M. Levine, Chem. Rev., 2019, 119, 322–477 CrossRef CAS.
- Z. Li, Q. Sun, Y. Zhu, B. Tan, Z. P. Xu and S. X. Dou, J. Mater. Chem. B, 2014, 2, 2793–2818 RSC.
- S. Li, J. Wei, Q. Yao, X. Song, J. Xie and H. Yang, Chem. Soc. Rev., 2023, 52, 1672–1696 RSC.
- Y. Huang, L. Fuksman and J. Zheng, Dalton Trans., 2018, 47, 6267–6273 RSC.
- L. Zhang and E. Wang, Nano Today, 2014, 9, 132–157 CrossRef CAS.
- S. Y. Lim, W. Shen and Z. Gao, Chem. Soc. Rev., 2015, 44, 362–381 RSC.
- C. I. M. Santos, I. F. A. Mariz, S. N. Pinto, G. Gonçalves, I. Bdikin, P. A. A. P. Marques, M. G. P. M. S. Neves, J. M. G. Martinho and E. M. S. Maçôas, Nanoscale, 2018, 10, 12505–12514 RSC.
- N. Goswami, Q. Yao, Z. Luo, J. Li, T. Chen and J. Xie, J. Phys. Chem. Lett., 2016, 7, 962–975 CrossRef CAS.
- X. Michalet, F. F. Pinaud, L. A. Bentolila, J. M. Tsay, S. Doose, J. J. Li, G. Sundaresan, A. M. Wu, S. S. Gambhir and S. Weiss, Science, 2005, 307, 538 CrossRef CAS.
- V. Biju, Chem. Soc. Rev., 2014, 43, 744–764 RSC.
- M. G. Bawendi, M. L. Steigerwald and L. E. Brus, Annu. Rev. Phys. Chem., 1990, 41, 477–496 CrossRef CAS.
- Q. Xu, T. Kuang, Y. Liu, L. Cai, X. Peng, T. Sreenivasan Sreeprasad, P. Zhao, Z. Yu and N. Li, J. Mater. Chem. B, 2016, 4, 7204–7219 RSC.
- H. Li, X. He, Z. Kang, H. Huang, Y. Liu, J. Liu, S. Lian, C. H. A. Tsang, X. Yang and S.-T. Lee, Angew. Chem., Int. Ed., 2010, 49, 4430–4434 CrossRef CAS.
- K. Jiang, S. Sun, L. Zhang, Y. Lu, A. Wu, C. Cai and H. Lin, Angew. Chem., Int. Ed., 2015, 54, 5360–5363 CrossRef CAS.
- Z. Gan, H. Xu and Y. Hao, Nanoscale, 2016, 8, 7794–7807 RSC.
- G. Eda, Y.-Y. Lin, C. Mattevi, H. Yamaguchi, H.-A. Chen, I.-S. Chen, C.-W. Chen and M. Chhowalla, Adv. Mater., 2010, 22, 505–509 CrossRef CAS PubMed.
- M. S. Mathew, A. Baksi, T. Pradeep and K. Joseph, Biosens. Bioelectron., 2016, 81, 68–74 CrossRef CAS.
- J. Zheng, J. T. Petty and R. M. Dickson, J. Am. Chem. Soc., 2003, 125, 7780–7781 CrossRef CAS.
- J. Zheng, C. Zhang and R. M. Dickson, Phys. Rev. Lett., 2004, 93, 077402 CrossRef PubMed.
- H. Kawasaki, K. Hamaguchi, I. Osaka and R. Arakawa, Adv. Funct. Mater., 2011, 21, 3508–3515 CrossRef CAS.
- Y. Yu, Z. Luo, C. S. Teo, Y. N. Tan and J. Xie, Chem. Commun., 2013, 49, 9740–9742 RSC.
- Z. Luo, X. Yuan, Y. Yu, Q. Zhang, D. T. Leong, J. Y. Lee and J. Xie, J. Am. Chem. Soc., 2012, 134, 16662–16670 CrossRef CAS PubMed.
- M. Zhu, C. M. Aikens, F. J. Hollander, G. C. Schatz and R. Jin, J. Am. Chem. Soc., 2008, 130, 5883–5885 CrossRef CAS.
- A. P. Demchenko, V. I. Tomin and P.-T. Chou, Chem. Rev., 2017, 117, 13353–13381 CrossRef CAS PubMed.
- J. Xie, Y. Zheng and J. Y. Ying, J. Am. Chem. Soc., 2009, 131, 888–889 CrossRef CAS.
- J. Annie Ho, H.-C. Chang and W.-T. Su, Anal. Chem., 2012, 84, 3246–3253 CrossRef CAS.
- Y. Dong, H. Pang, H. B. Yang, C. Guo, J. Shao, Y. Chi, C. M. Li and T. Yu, Angew. Chem., Int. Ed., 2013, 52, 7800–7804 CrossRef CAS PubMed.
- X. Li, S. Zhang, S. A. Kulinich, Y. Liu and H. Zeng, Sci. Rep., 2014, 4, 4976 CrossRef CAS.
- Y.-P. Sun, B. Zhou, Y. Lin, W. Wang, K. A. S. Fernando, P. Pathak, M. J. Meziani, B. A. Harruff, X. Wang, H. Wang, P. G. Luo, H. Yang, M. E. Kose, B. Chen, L. M. Veca and S.-Y. Xie, J. Am. Chem. Soc., 2006, 128, 7756–7757 CrossRef CAS.
- S. Chattoraj and K. Bhattacharyya, J. Phys. Chem. C, 2014, 118, 22339–22346 CrossRef CAS.
- A. Das, D. Roy, C. K. De and P. K. Mandal, Phys. Chem. Chem. Phys., 2018, 20, 2251–2259 RSC.
- X. Wen, A. Sitt, P. Yu, Y.-R. Toh and J. Tang, Phys. Chem. Chem. Phys., 2012, 14, 3505–3512 RSC.
- P. Yu, X. Wen, Y.-R. Toh and J. Tang, J. Phys. Chem. C, 2012, 116, 6567–6571 CrossRef CAS.
- P. Yu, X. Wen, Y.-R. Toh and J. Tang, J. Phys. Chem. C, 2012, 116, 25552–25557 CrossRef CAS.
- C. A. Leatherdale and M. G. Bawendi, Phys. Rev. B: Condens. Matter Mater. Phys., 2001, 63, 165315 CrossRef.
- R. Zhou, M. Shi, X. Chen, M. Wang and H. Chen, Chem. – Eur. J., 2009, 15, 4944–4951 CrossRef CAS.
- C. Yi, H. Zheng, P. J. Herbert, Y. Chen, R. Jin and K. L. Knappenberger, J. Phys. Chem. C, 2017, 121, 24894–24902 CrossRef CAS.
- N. Basu and D. Mandal, J. Phys. Chem. C, 2018, 122, 18732–18741 CrossRef CAS.
- C. J. Reckmeier, Y. Wang, R. Zboril and A. L. Rogach, J. Phys. Chem. C, 2016, 120, 10591–10604 CrossRef CAS.
- A. Sciortino, E. Marino, B. van Dam, P. Schall, M. Cannas and F. Messina, J. Phys. Chem. Lett., 2016, 7, 3419–3423 CrossRef CAS.
- S. Mukherjee, E. Prasad and A. Chadha, Phys. Chem. Chem. Phys., 2017, 19, 7288–7296 RSC.
- T. Zhang, J. Zhu, Y. Zhai, H. Wang, X. Bai, B. Dong, H. Wang and H. Song, Nanoscale, 2017, 9, 13042–13051 RSC.
- J. S. Anjali Devi, R. S. Aparna, R. R. Anjana, J. Nebu, S. M. Anju and S. George, J. Phys. Chem. A, 2019, 123, 7420–7429 CrossRef CAS PubMed.
- M. J. Ruedas-Rama and E. A. H. Hall, Anal. Chem., 2008, 80, 8260–8268 CrossRef CAS.
- Y. Lou, Y. Zhao, J. Chen and J.-J. Zhu, J. Mater. Chem. C, 2014, 2, 595–613 RSC.
- S. J. Clarke, C. A. Hollmann, Z. Zhang, D. Suffern, S. E. Bradforth, N. M. Dimitrijevic, W. G. Minarik and J. L. Nadeau, Nat. Mater., 2006, 5, 409–417 CrossRef CAS.
- K. Abha, I. S. Sumithra, S. Suji, R. R. Anjana, J. S. Anjali Devi, J. Nebu, G. M. Lekha, R. S. Aparna and S. George, Anal. Bioanal. Chem., 2020, 412, 5671–5681 CrossRef CAS PubMed.
- K. Abha, J. Nebu, J. S. Anjali Devi, R. S. Aparna, R. R. Anjana, A. O. Aswathy and S. George, Sens. Actuators, B, 2019, 282, 300–308 CrossRef CAS.
- K. Palaniappan, S. A. Hackney and J. Liu, Chem. Commun., 2004, 2704–2705 RSC.
- X. Wang, L. Cao, F. Lu, M. J. Meziani, H. Li, G. Qi, B. Zhou, B. A. Harruff, F. Kermarrec and Y.-P. Sun, Chem. Commun., 2009, 3774–3776 RSC.
- J. Gong, X. Lu and X. An, RSC Adv., 2015, 5, 8533–8536 RSC.
- K. Qu, J. Wang, J. Ren and X. Qu, Chem. – Eur. J., 2013, 19, 7243–7249 CrossRef CAS.
- Y. Tao, Y. Lin, J. Ren and X. Qu, Biosens. Bioelectron., 2013, 42, 41–46 CrossRef CAS.
- M. Tomasulo, I. Yildiz and F. M. Raymo, J. Phys. Chem. B, 2006, 110, 3853–3855 CrossRef CAS PubMed.
- Y. Bao, C. Zhong, D. M. Vu, J. P. Temirov, R. B. Dyer and J. S. Martinez, J. Phys. Chem. C, 2007, 111, 12194–12198 CrossRef CAS.
- Y. Guo, Z. Wang, H. Shao and X. Jiang, Carbon, 2013, 52, 583–589 CrossRef CAS.
- W. Kong, H. Wu, Z. Ye, R. Li, T. Xu and B. Zhang, J. Lumin., 2014, 148, 238–242 CrossRef CAS.
- S. Dutta Choudhury, J. M. Chethodil, P. M. Gharat and P. K. Praseetha, J. Phys. Chem. Lett., 2017, 8, 1389–1395 CrossRef CAS PubMed.
- C. V. Durgadas, C. P. Sharma and K. Sreenivasan, Analyst, 2011, 136, 933–940 RSC.
- L.-Y. Chen, C.-W. Wang, Z. Yuan and H.-T. Chang, Anal. Chem., 2015, 87, 216–229 CrossRef CAS.
- J. S. Anjali Devi, S. Salini, A. H. Anulekshmi, G. L. Praveen and G. Sony, Sens. Actuators, B, 2017, 246, 943–951 CrossRef CAS.
- J. Nebu, J. S. Anjali Devi, R. S. Aparna, B. Aswathy, G. M. Lekha and G. Sony, Anal. Bioanal. Chem., 2019, 411, 997–1007 CrossRef CAS PubMed.
- J. Nebu, K. S. Anu, J. S. Anjali Devi, R. S. Aparna, A. O. Aswathy, G. M. Lekha and G. Sony, Microchem. J., 2019, 146, 12–19 CrossRef CAS.
- A. Sharma, T. Gadly, S. Neogy, S. K. Ghosh and M. Kumbhakar, J. Phys. Chem. Lett., 2017, 8, 1044–1052 CrossRef CAS.
- A. O. Aswathy, S. M. Anju, J. Jayakrishna, N. S. Vijila, J. S. Anjali Devi, B. Anjitha and S. George, J. Fluoresc., 2020, 30, 1337–1344 CrossRef CAS.
- Y. Dong, J. Cai, X. You and Y. Chi, Analyst, 2015, 140, 7468–7486 RSC.
- M. Masteri-Farahani and K. Khademabbasi, J. Lumin., 2018, 204, 130–134 CrossRef CAS.
- P. Wu and X.-P. Yan, Chem. Soc. Rev., 2013, 42, 5489–5521 RSC.
- R. Jin and K. Nobusada, Nano Res., 2014, 7, 285–300 CrossRef CAS.
- Q. Zhou, Y. Lin, M. Xu, Z. Gao, H. Yang and D. Tang, Anal. Chem., 2016, 88, 8886–8892 CrossRef CAS.
- Z. Gan, H. Xu and Y. Hao, Nanoscale, 2016, 8, 7794–7807 RSC.
- L. Bao, C. Liu, Z. Zhang and D. Pang, Adv. Mater., 2015, 27, 1663–1667 CrossRef CAS.
- H. Ding, S.-B. Yu, J.-S. Wei and H.-M. Xiong, ACS Nano, 2016, 10, 484–491 CrossRef CAS PubMed.
- Q. Zhang, R. Wang, B. Feng, X. Zhong and K. (Ken) Ostrikov, Nat. Commun., 2021, 12, 6856 CrossRef CAS.
- Y. Tao, M. Li, J. Ren and X. Qu, Chem. Soc. Rev., 2015, 44, 8636–8663 RSC.
- The Nobel Prize in Chemistry 2023, https://www.nobelprize.org/prizes/chemistry/2023/summary/, (accessed 7 February 2024).
- U. Resch-Genger, M. Grabolle, S. Cavaliere-Jaricot, R. Nitschke and T. Nann, Nat. Methods, 2008, 5, 763 CrossRef CAS PubMed.
- A. Onushchenko and A. Ekimov, JETP Lett., 1981, 34, 345 Search PubMed.
- C. B. Murray, D. J. Norris and M. G. Bawendi, J. Am. Chem. Soc., 1993, 115, 8706–8715 CrossRef CAS.
- Z. A. Peng and X. Peng, J. Am. Chem. Soc., 2001, 123, 183–184 CrossRef CAS.
- L. Qu, Z. A. Peng and X. Peng, Nano Lett., 2001, 1, 333–337 CrossRef CAS.
- H. R. Chandan and R. G. Balakrishna, Sens. Actuators, B, 2018, 258, 1191–1214 CrossRef CAS.
- J. Jasieniak, C. Bullen, J. van Embden and P. Mulvaney, J. Phys. Chem. B, 2005, 109, 20665–20668 CrossRef CAS.
- Y. Orimoto, K. Watanabe, K. Yamashita, M. Uehara, H. Nakamura, T. Furuya and H. Maeda, J. Phys. Chem. C, 2012, 116, 17885–17896 CrossRef CAS.
- J. Zhou, Y. Liu, J. Tang and W. Tang, Mater. Today, 2017, 20, 360–376 CrossRef CAS.
- B. Mahler, P. Spinicelli, S. Buil, X. Quelin, J.-P. Hermier and B. Dubertret, Nat. Mater., 2008, 7, 659–664 CrossRef CAS.
- Isnaeni, K. H. Kim, D. L. Nguyen, H. Lim, P. T. Nga and Y.-H. Cho, Appl. Phys. Lett., 2011, 98, 012109 CrossRef.
- X. Brokmann, J.-P. Hermier, G. Messin, P. Desbiolles, J.-P. Bouchaud and M. Dahan, Phys. Rev. Lett., 2003, 90, 120601 CrossRef CAS.
- P. Reiss, J. Bleuse and A. Pron, Nano Lett., 2002, 2, 781–784 CrossRef CAS.
- A. L. Efros and L. E. Brus, ACS Nano, 2021, 15, 6192–6210 CrossRef CAS PubMed.
- R. Jin, C. Zeng, M. Zhou and Y. Chen, Chem. Rev., 2016, 116, 10346–10413 CrossRef CAS PubMed.
- Y. Gu, S. Tang, X. Liu, X. Liang, Q. Zhu, H. Wu, X. Yang, W. Jin, H. Chen, C. Liu, Y. Zhu and J. Ma, J. Mater. Chem. A, 2024, 12, 4460–4472 RSC.
- J. Li, T. Chen, K. Lim, L. Chen, S. A. Khan, J. Xie and X. Wang, Adv. Intell. Syst., 2019, 1, 1900029 CrossRef.
- T. Chen, J. Li, P. Cai, Q. Yao, Z. Ren, Y. Zhu, S. Khan, J. Xie and X. Wang, Nano Res., 2023, 16, 4188–4196 CrossRef CAS.
- O. Voznyy, L. Levina, J. Z. Fan, M. Askerka, A. Jain, M.-J. Choi, O. Ouellette, P. Todorović, L. K. Sagar and E. H. Sargent, ACS Nano, 2019, 13, 11122–11128 CrossRef CAS.
- Z. Wu, Q. Yao, O. J. H. Chai, N. Ding, W. Xu, S. Zang and J. Xie, Angew. Chem., 2020, 132, 10020–10025 CrossRef.
- X. Xu, R. Ray, Y. Gu, H. J. Ploehn, L. Gearheart, K. Raker and W. A. Scrivens, J. Am. Chem. Soc., 2004, 126, 12736–12737 CrossRef CAS.
- J. Zhou, C. Booker, R. Li, X. Zhou, T.-K. Sham, X. Sun and Z. Ding, J. Am. Chem. Soc., 2007, 129, 744–745 CrossRef CAS PubMed.
- Z. Ma, H. Ming, H. Huang, Y. Liu and Z. Kang, New J. Chem., 2012, 36, 861–864 RSC.
- S. Qu, X. Wang, Q. Lu, X. Liu and L. Wang, Angew. Chem., Int. Ed., 2012, 51, 12215–12218 CrossRef CAS.
- K. Holá, M. Sudolská, S. Kalytchuk, D. Nachtigallová, A. L. Rogach, M. Otyepka and R. Zbořil, ACS Nano, 2017, 11, 12402–12410 CrossRef.
- R. D. Senanayake, X. Yao, C. E. Froehlich, M. S. Cahill, T. R. Sheldon, M. McIntire, C. L. Haynes and R. Hernandez, J. Chem. Inf. Model., 2022, 62, 5918–5928 CrossRef CAS.
- W. Kasprzyk, S. Bednarz and D. Bogdał, Chem. Commun., 2013, 49, 6445 RSC.
- W. Kasprzyk, T. Świergosz, S. Bednarz, K. Walas, N. V. Bashmakova and D. Bogdał, Nanoscale, 2018, 10, 13889–13894 RSC.
- J. Schneider, C. J. Reckmeier, Y. Xiong, M. von Seckendorff, A. S. Susha, P. Kasák and A. L. Rogach, J. Phys. Chem. C, 2017, 121, 2014–2022 CrossRef CAS.
- A. Das, V. Gude, D. Roy, T. Chatterjee, C. K. De and P. K. Mandal, J. Phys. Chem. C, 2017, 121, 9634–9641 CrossRef CAS.
- A. P. Demchenko and M. O. Dekaliuk, Nanoscale, 2016, 8, 14057–14069 RSC.
- A. Sharma, T. Gadly, A. Gupta, A. Ballal, S. K. Ghosh and M. Kumbhakar, J. Phys. Chem. Lett., 2016, 7, 3695–3702 CrossRef CAS PubMed.
- J. S. Anjali Devi, R. S. Aparna, R. R. Anjana, N. S. Vijila, J. Jayakrishna and S. George, Photochem. Photobiol. Sci., 2020, 19, 207–216 CrossRef CAS.
- N. J. Hestand and F. C. Spano, Chem. Rev., 2018, 118, 7069–7163 CrossRef CAS.
- J. B. Essner, J. A. Kist, L. Polo-Parada and G. A. Baker, Chem. Mater., 2018, 30, 1878–1887 CrossRef CAS.
- P. Zhu, K. Tan, Q. Chen, J. Xiong and L. Gao, Chem. Mater., 2019, 31, 4732–4742 CrossRef CAS.
- L. Hao, Y. Shen, X. Chen, X. Yang, Q. Du, Y. Bian, L. Chen, K. Tang, R. Zhang, Y. Zheng and S. Gu, Microchem. J., 2019, 148, 684–690 CrossRef CAS.
- D. Ungor, K. Horváth, I. Dékány and E. Csapó, Sens. Actuators, B, 2019, 288, 728–733 CrossRef CAS.
- Z. Zhang, T. Liu, S. Wang, J. Ma, T. Zhou, F. Wang, X. Wang and G. Zhang, J. Photochem. Photobiol., A, 2019, 370, 89–93 CrossRef CAS.
- J. Wei, Y. Yuan, H. Li, D. Hao, C. Sun, G. Zheng and R. Wang, New J. Chem., 2018, 42, 18787–18793 RSC.
- F. Abbasi, A. Akbarinejad and N. Alizadeh, Spectrochim. Acta, Part A, 2019, 216, 230–235 CrossRef CAS.
- Y. Ma, W. Lv, Y. Chen, M. Na, J. Liu, Y. Han, S. Ma and X. Chen, New J. Chem., 2019, 43, 5070–5076 RSC.
- M. Santhosh, S. R. Chinnadayyala, A. Kakoti and P. Goswami, Biosens. Bioelectron., 2014, 59, 370–376 CrossRef CAS PubMed.
- F. Xue, L. Liu, Y. Mi, H. Han and J. Liang, RSC Adv., 2016, 6, 10215–10220 RSC.
- S. K. Anand, U. Sivasankaran, A. R. Jose and K. G. Kumar, Spectrochim. Acta, Part A, 2019, 213, 410–415 CrossRef CAS PubMed.
- C.-P. Liu, T.-H. Wu, C.-Y. Liu, H.-J. Cheng and S.-Y. Lin, J. Mater. Chem. B, 2015, 3, 191–197 RSC.
- S. Gogoi and R. Khan, Phys. Chem. Chem. Phys., 2018, 20, 16501–16509 RSC.
- G. H. Shi, Z. B. Shang, Y. Wang, W. J. Jin and T. C. Zhang, Spectrochim. Acta, Part A, 2008, 70, 247–252 CrossRef PubMed.
- R. Das, G. Rajender and P. K. Giri, Phys. Chem. Chem. Phys., 2018, 20, 4527–4537 RSC.
- D. C. Harris, Quantitative chemical analysis, Macmillan, 2010 Search PubMed.
- R. Freeman, T. Finder, L. Bahshi and I. Willner, Nano Lett., 2009, 9, 2073–2076 CrossRef CAS PubMed.
- C. Tang, J. Zhou, Z. Qian, Y. Ma, Y. Huang and H. Feng, J. Mater. Chem. B, 2017, 5, 1971–1979 RSC.
- A. Cayuela, M. Laura Soriano and M. Valcárcel, Analyst, 2016, 141, 2682–2687 RSC.
- S. Mondal and P. Purkayastha, J. Phys. Chem. C, 2016, 120, 14365–14371 CrossRef CAS.
- M. Luo, Y. Hua, Y. Liang, J. Han, D. Liu, W. Zhao and P. Wang, Biosens. Bioelectron., 2017, 98, 195–201 CrossRef CAS PubMed.
- Z. Saberi, B. Rezaei and A. A. Ensafi, Microchim. Acta, 2019, 186, 273 CrossRef PubMed.
- E. Vaishnavi and R. Renganathan, Analyst, 2014, 139, 225–234 RSC.
- K. Pyo, M. F. Matus, S. Malola, E. Hulkko, J. Alaranta, T. Lahtinen, H. Häkkinen and M. Pettersson, Nanoscale Adv., 2022, 4, 4579–4588 RSC.
- X. Zhang, X. Chen, S. Kai, H.-Y. Wang, J. Yang, F.-G. Wu and Z. Chen, Anal. Chem., 2015, 87, 3360–3365 CrossRef CAS PubMed.
- S. Ma, Y. Chen, J. Feng, J. Liu, X. Zuo and X. Chen, Anal. Chem., 2016, 88, 10474–10481 CrossRef CAS PubMed.
- D. J. Heintzelman, S. A. Nelson and K. L. Knappenberger, J. Phys. Chem. Lett., 2024, 15, 2951–2956 CrossRef CAS PubMed.
- Y. Miao, N. Gan, T. Li, Y. Cao, F. Hu and Y. Chen, Sens. Actuators, B, 2016, 222, 1066–1072 CrossRef CAS.
- L. Chang, X. He, L. Chen and Y. Zhang, Sens. Actuators, B, 2017, 250, 17–23 CrossRef CAS.
- M. Shamsipur, V. Nasirian, A. Barati, K. Mansouri, A. Vaisi-Raygani and S. Kashanian, Anal. Chim. Acta, 2017, 966, 62–70 CrossRef CAS PubMed.
- Y.-S. Borghei, M. Hosseini, M. R. Ganjali and S. Hosseinkhani, J. Pharm. Biomed. Anal., 2018, 152, 81–88 CrossRef CAS PubMed.
- Y. Shu, N. Zheng, A.-Q. Zheng, T.-T. Guo, Y.-L. Yu and J.-H. Wang, Anal. Chem., 2019, 91, 4157–4163 CrossRef CAS PubMed.
- H. Ge, K. Zhang, H. Yu, J. Yue, L. Yu, X. Chen, T. Hou, K. A. Alamry, H. M. Marwani and S. Wang, J. Fluoresc., 2018, 28, 1405–1412 CrossRef CAS PubMed.
- X. Cheng, Y. Cen, G. Xu, F. Wei, M. Shi, X. Xu, M. Sohail and Q. Hu, Microchim. Acta, 2018, 185, 144 CrossRef PubMed.
- Y. Ding, J. Ling, H. Wang, J. Zou, K. Wang, X. Xiao and M. Yang, Anal. Methods, 2015, 7, 7792–7798 RSC.
- S. H. Qaddare and A. Salimi, Biosens. Bioelectron., 2017, 89, 773–780 CrossRef CAS PubMed.
- Y. Chawre, M. L. Satnami, A. B. Kujur, K. K. Ghosh, R. Nagwanshi, I. Karbhal, S. Pervez and M. K. Deb, ACS Appl. Nano Mater., 2023, 6, 8046–8058 CrossRef CAS.
- L. Qin, X. He, L. Chen and Y. Zhang, ACS Appl. Mater. Interfaces, 2015, 7, 5965–5971 CrossRef CAS PubMed.
- A. R. Jose, A. E. Vikraman and K. Girish Kumar, New J. Chem., 2017, 41, 10828–10834 RSC.
- S. Huang, F. Zhu, H. Qiu, Q. Xiao, Q. Zhou, W. Su and B. Hu, Colloids Surf., B, 2014, 117, 240–247 CrossRef CAS PubMed.
- X. Yue, W. Zhu, S. Ma, S. Yu, Y. Zhang, J. Wang, Y. Wang, D. Zhang and J. Wang, J. Agric. Food Chem., 2016, 64, 706–713 CrossRef CAS PubMed.
- K.-Y. Huang, H.-X. He, S.-B. He, X.-P. Zhang, H.-P. Peng, Z. Lin, H.-H. Deng, X.-H. Xia and W. Chen, Sens. Actuators, B, 2019, 296, 126656 CrossRef CAS.
- S. Govindaraju, S. R. Ankireddy, B. Viswanath, J. Kim and K. Yun, Sci. Rep., 2017, 7, 40298 CrossRef CAS PubMed.
- S. Chen, Y.-L. Yu and J.-H. Wang, Anal. Chim. Acta, 2018, 999, 13–26 CrossRef CAS PubMed.
- S. Khezri, M. Bahram and N. Samadi, Anal. Methods, 2017, 9, 6513–6524 RSC.
- H.-C. Chang and J. A. Ho, Anal. Chem., 2015, 87, 10362–10367 CrossRef CAS PubMed.
- M. Zheng, Z. Xie, D. Qu, D. Li, P. Du, X. Jing and Z. Sun, ACS Appl. Mater. Interfaces, 2013, 5, 13242–13247 CrossRef CAS.
- X. Y. Sun, M. J. Yuan, B. Liu and J. S. Shen, RSC Adv., 2018, 8, 19786–19790 RSC.
- Z. Xu, Z. Wang, M. Liu, B. Yan, X. Ren and Z. Gao, Spectrochim. Acta, Part A, 2020, 232, 118147 CrossRef CAS PubMed.
- X. Liu, X. Hu, Z. Xie, P. Chen, X. Sun, J. Yan and S. Zhou, Anal. Methods, 2016, 8, 3236–3241 RSC.
- K. Chaiendoo, S. Ittisanronnachai, V. Promarak and W. Ngeontae, Carbon, 2019, 146, 728–735 CrossRef CAS.
- Z. Qian, J. Ma, X. Shan, H. Feng, L. Shao and J. Chen, Chem. – Eur. J., 2014, 20, 2254–2263 CrossRef CAS PubMed.
- H.-Y. Chang, Y.-T. Tseng, Z. Yuan, H.-L. Chou, C.-H. Chen, B.-J. Hwang, M.-C. Tsai, H.-T. Chang and C.-C. Huang, Phys. Chem. Chem. Phys., 2017, 19, 12085–12093 RSC.
- Z. Huang, M. Wang, Z. Guo, H. Wang, H. Dong and W. Yang, ACS Omega, 2018, 3, 12763–12769 CrossRef CAS.
- J.-G. You and W.-L. Tseng, Anal. Chim. Acta, 2019, 1078, 101–111 CrossRef CAS PubMed.
- J. Fu, Y. Miao, D. Zhang, Y. Zhang, L. Meng, X. Ni, J. Shen and W. Qi, Langmuir, 2023, 39, 13316–13324 CrossRef CAS.
- N. Gogoi, D. S. Agarwal, A. Sehgal, D. Chowdhury and R. Sakhuja, ACS Omega, 2017, 2, 3816–3827 CrossRef CAS.
- M. Mou, Y. Wu, Q. Niu, Y. Wang, Z. Yan and S. Liao, Chem. Commun., 2017, 53, 3357–3360 RSC.
- S. Pathan, M. Jalal, S. Prasad and S. Bose, J. Mater. Chem. A, 2019, 7, 8510–8520 RSC.
- Y. Yu, Z. Luo, D. M. Chevrier, D. T. Leong, P. Zhang, D. Jiang and J. Xie, J. Am. Chem. Soc., 2014, 136, 1246–1249 CrossRef CAS PubMed.
- Z. Wu, Y. Du, J. Liu, Q. Yao, T. Chen, Y. Cao, H. Zhang and J. Xie, Angew. Chem., Int. Ed., 2019, 58, 8139–8144 CrossRef CAS.
- K. Pyo, V. D. Thanthirige, K. Kwak, P. Pandurangan, G. Ramakrishna and D. Lee, J. Am. Chem. Soc., 2015, 137, 8244–8250 CrossRef CAS PubMed.
- T. Chen, S. Yang, J. Chai, Y. Song, J. Fan, B. Rao, H. Sheng, H. Yu and M. Zhu, Sci. Adv., 2017, 3, e1700956 CrossRef PubMed.
- Z. Wu, Q. Yao, S. Zang and J. Xie, ACS Mater. Lett., 2019, 1, 237–248 CrossRef CAS.
- X. Wen, P. Yu, Y.-R. Toh, A.-C. Hsu, Y.-C. Lee and J. Tang, J. Phys. Chem. C, 2012, 116, 19032–19038 CrossRef CAS.
- Z. Liu, L. Luo, J. Kong, E. Kahng, M. Zhou and R. Jin, Nanoscale, 2024, 16, 7419–7426 RSC.
- M. Sugiuchi, J. Maeba, N. Okubo, M. Iwamura, K. Nozaki and K. Konishi, J. Am. Chem. Soc., 2017, 139, 17731–17734 CrossRef CAS.
- S. Wei, B. wang, H. Zhang, C. Wang, S. Cui, X. Yin, C. Jiang and G. Sun, Chem. Eng. J., 2023, 466, 143103 CrossRef CAS.
- Y. Fan, X. Wang, T. Funk, I. Rashid, B. Herman, N. Bompoti, M. S. Mahmud, M. Chrysochoou, M. Yang, T. M. Vadas, Y. Lei and B. Li, Environ. Sci. Technol., 2022, 56, 13546–13564 CrossRef CAS PubMed.
Footnote |
| † Electronic supplementary information (ESI) available. See DOI: https://doi.org/10.1039/d4nh00107a |
| This journal is © The Royal Society of Chemistry 2024 |