 Open Access Article
Creative Commons Attribution 3.0 Unported Licence
Identification of lysosomotropism using explainable machine learning and morphological profiling cell painting data†
Aishvarya
Tandon
 a,
Anna
Santura
b,
Herbert
Waldmann
 *a,
Axel
Pahl
 *a and
Paul
Czodrowski
 *b
*b
aDepartment of Chemical Biology, Max-Planck-Institute of Molecular Physiology, Otto-Hahn-Str. 11, Dortmund, Germany. E-mail: herbert.waldmann@mpi-dortmund.mpg.de; axel.pahl@mpi-dortmund.mpg.de
bDepartment of Chemistry, Johannes Gutenberg University Mainz, Mainz, Germany. E-mail: czodpaul@uni-mainz.de
First published on 24th May 2024
Abstract
Lysosomotropism is a phenomenon of diverse pharmaceutical interests because it is a property of compounds with diverse chemical structures and primary targets. While it is primarily reported to be caused by compounds having suitable lipophilicity and basicity values, not all compounds that fulfill such criteria are in fact lysosomotropic. Here, we use morphological profiling by means of the cell painting assay (CPA) as a reliable surrogate to identify lysosomotropism. We noticed that only 35% of the compound subset with matching physicochemical properties show the lysosomotropic phenotype. Based on a matched molecular pair analysis (MMPA), no key substructures driving lysosomotropism could be identified. However, using explainable machine learning (XML), we were able to highlight that higher lipophilicity, basicity, molecular weight, and lower topological polar surface area are among the important properties that induce lysosomotropism in the compounds of this subset.
1 Introduction
The lysosome plays a crucial role in the cellular degradation of biopolymers and in processes, such as apoptosis, autophagy, and cell signaling. Lipophilic small molecules and drugs that carry a basic moiety can accumulate in the lysosome, by passing the lysosomal membrane in their neutral form, getting trapped in the compartment due to protonation at the lower pH (Fig. 1). The pathophysiological consequences of this phenomenon termed lysosomotropism are not yet fully understood, but impairment of lysosomal functionality can be linked to phospholipidosis and disturbed cholesterol homeostasis.1–3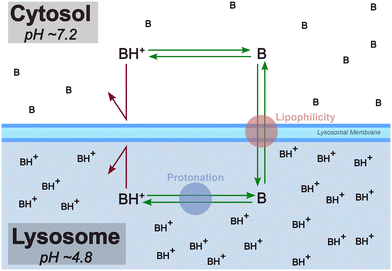 | ||
| Fig. 1 Lysosomotropism is primarily believed to be driven by lipophilicity and protonation state of the compound. In this diagram, “B” is a lysosomotropic compound and “BH+” is its protonated state. Illustration inspired by Kuzu et al. (2017).4 | ||
Recently lysosomotropism has especially drawn attention in multiple drug repurposing studies targeting severe acute respiratory syndrome coronavirus 2 (SARS-CoV-2). This stems from the crucial involvement of cathepsin L, a lysosomal protease, in cleaving the SARS-CoV-2 spike protein and facilitating virus entry into host cells. By the accumulation of lysosomotropic drugs in the lysosome, the compartment's pH rises, rendering proteolytic enzymes inactive and impeding viral replication.5–7
Consequently, well-established lysosomotropic drugs, e.g. chloroquine and hydroxychloroquine, were initially promising drug repurposing candidates against SARS-CoV-2. However, these drugs failed to demonstrate significant clinical benefits.6,8–13
In a more general sense, lysosomotropism is also a phenomenon of various drugs. It occurs for structurally different compound classes, modes of actions and targets, and is independent of species and cell-type.3,14 For instance, lysosomotropic properties have been observed in anticancer compounds (tamoxifen, doxorubicin, daunorubicin, mitoxantrone), tyrosine kinase inhibitors (imatinib, dasatinib, sunitinib, sorefenib), β-blockers (propranolol), antihistamines (promethazine, astemizole, dimebon, desloratadine), and selective serotonin reuptake inhibitors (sertraline, paroxetine, fluoxetine, fluvoxamine).4,15–17
Given such broad range of interests, several groups have contributed towards the measurement, quantification and prediction of lysosomotropism, see e.g. Nadanaciva et al. (2011), Ufuk et al. (2017), Schmitt et al. (2018) and Norinder et al. (2019).15,18–20 Highlighting the importance of identifying lysosomotropism early in the development process, Hu et al. (2023) recently developed and published models on phospholipidosis, a process related to lysosomotropism, using compound literature data. They also validated their results using a live-cell imaging assay.21
Compounds with a calculated log![[thin space (1/6-em)]](https://www.rsc.org/images/entities/char_2009.gif) P (clog
P (clog![[thin space (1/6-em)]](https://www.rsc.org/images/entities/char_2009.gif) P) value greater than 2 and a basic pKa (bpKa) value between 6.5 and 11, representing lipophilicity and basicity, respectively, are likely to be lysosomotropic.15 Here, we will refer to this cross-section of properties as the physicochemical window (“PhysChem window”). While lysosomotropism at first seems to be primarily driven by lipophilicity and protonation state of compounds, it has been established that not all molecules which have the suitable physicochemical properties are in fact lysosomotropic.15,22
P) value greater than 2 and a basic pKa (bpKa) value between 6.5 and 11, representing lipophilicity and basicity, respectively, are likely to be lysosomotropic.15 Here, we will refer to this cross-section of properties as the physicochemical window (“PhysChem window”). While lysosomotropism at first seems to be primarily driven by lipophilicity and protonation state of compounds, it has been established that not all molecules which have the suitable physicochemical properties are in fact lysosomotropic.15,22
The cell painting assay (CPA) is an unbiased, image-based phenotypic assay where morphological profiles consisting of hundreds of features are generated from the images of compound-treated and control cells.23 One typical use case of the CPA is the formation of target hypotheses for test compounds with unknown biological activity. Here profiles of test compounds are compared to those of reference compounds with annotated targets or pathways. However, many compounds with lysosomotropic properties induce a distinct phenotype in the CPA which is independent of their target activity.3 We have observed that comparing morphological profiles of test compounds to that of a known lysosomotropic agent – smoothened agonist (SAG), is a reliable surrogate for determining lysosomotropism.
Machine learning (ML) methods have become an integral part of drug discovery. Some prominent methods are QSAR, prediction of chemical reactions and retrosynthesis, and the generation of novel chemical structures.24,25 Programming packages such as LIME and SHAP offer “explainability” of a model, enabling the interpretation of its predictions.26,27 The transparency about a model's predictions inspires confidence in researchers to trust them, which is why these packages are gaining popularity and application in drug discovery.28–30 Similarly, input features found important by a bioactivity prediction model can be determined using such packages, and this information can be used to develop a hypothesis of the underlying mechanism of the bioactivity.
Herein, we investigate the lysosomotropism observed by the CPA using matched molecular pair analysis (MMPA) and explainable machine learning (XML) to understand which physicochemical descriptor and/or chemical substructures affect lysosomotropism in compounds with feasible basicity and lipophilic values.
With the MMPA, we aim to identify key substructures which are responsible for transformation of a lysosomotropic compound to a non-lysosomotropic compound, and vice versa. Similarly, by interpreting tree-based machine learning (ML) models with molecular fingerprints we addressed the identification of important substructures whose presence affects lysosomotropism. Finally, by interpreting ML models with molecular descriptors as input, the determination of physicochemical parameters which affect lysosomotropism is attempted.
2 Results
2.1 Determination of lysosomotropism
The cell painting assay (CPA) is a morphological profiling assay where six dyes are used to selectively stain different cell organelles and compartments, followed by high-content imaging and analysis, generating morphological fingerprints with hundreds of features.23,31 CPA is an unbiased assay, that can identify biological activity without requiring a prior target hypothesis, and is therefore particularly well-suited for the screening of new chemical entities of unknown activity. Comparison of the CP profile of a hit molecule with the profiles of reference compounds whose modes of actions and targets are known can then provide target hypotheses, potentially enabling target identification.32–37In our implementation of post-imaging analysis following the feature calculation by the open-source software CellProfiler, 579 Z-scores of morphological features are deduced per compound. The Z-score of a morphological feature represents the difference between a morphological feature and its relative DMSO control. A compound's morphological profile (or simply its CP profile) is thereby a list of its Z-scores.34
Our processed CP data represents a total of 13![[thin space (1/6-em)]](https://www.rsc.org/images/entities/char_2009.gif) 450 compounds. In this data, 3114 are reference compounds, whose biological activities are annotated, and 10
450 compounds. In this data, 3114 are reference compounds, whose biological activities are annotated, and 10![[thin space (1/6-em)]](https://www.rsc.org/images/entities/char_2009.gif) 336 are internal research compounds. The internal research compounds primarily consist of natural products-inspired compounds and pseudo-natural products.38,39 2065 compounds are present in the PhysChem window, and thereby are relevant to this study.
336 are internal research compounds. The internal research compounds primarily consist of natural products-inspired compounds and pseudo-natural products.38,39 2065 compounds are present in the PhysChem window, and thereby are relevant to this study.
Induction, a measure of bioactivity, is the percentage of significantly altered features. Compounds with the induction value greater than or equal to 5 are considered bioactive.34 In the PhysChem window, 1196 compounds are bioactive, while 869 are not.
The CPA is a routine in-house screening assay at the Compound Management and Screening Center, Dortmund, and is used in identifying numerous biological clusters and pathways, among them lysosomotropism. The similarities between CP profiles can be measured by Pearson's similarity. The CP profiles are considered similar if their Pearson's similarity values are greater than 75%. Schneidewind et al. (2021) identified a biocluster in the CPA data whose mode of action is likely due to disturbed cholesterol homeostasis caused by lysosomotropism.3
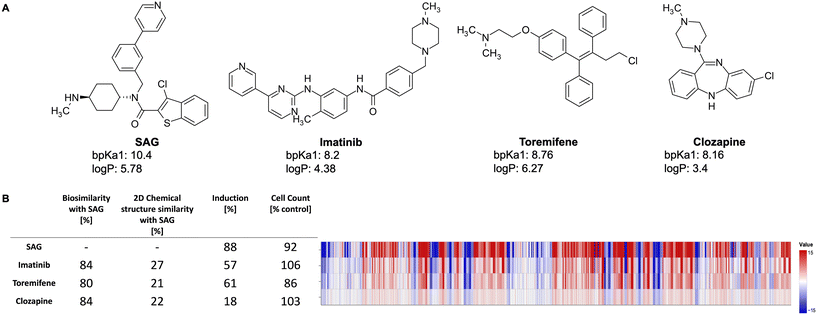
Smoothened agonist (SAG), a well-established lysosomotropic compound, is present as a reference compound in the dataset and can be found in the reported biocluster. Because of its pronounced profile in the CPA, SAG was used as the reference compound for defining the lysosomotropic phenotype. This similarity score, termed as the lyso score, ranges from 0 (indicating no biosimilarity) to 100 (indicating full biosimilarity). Compounds with a lyso score above or equal to 75 were annotated as lysosomotropic given the high biosimilarity of their profile to the profile determined for SAG, the rest were labelled as non-lysosomotropic. Out of the 2065 compounds present in the PhysChem window, 1327 were labelled as non-lysosomotropic and the remaining 738 as lysosomotropic.
Fig. 2 exemplarily shows three lysosomotropic reference compounds – imatinib, toremifene, and clozapine – and their CP profiles in comparison to SAG. The morphological profiles of these three compounds and that of SAG are very similar, although these compounds have different primary targets and chemical structures. Imatinib, a tyrosine kinase inhibitor, is primarily used to treat chronic myeloid leukemia,40 whereas toremifene, a selective non-steroidal estrogen receptor modulator, is administered to treat breast cancer.41 Clozapine is an anti-psychotic drug used in the treatment of severely ill patients with schizophrenia. While clozapine's mode of action is unknown, it is proposed to be an antagonist of dopamine and serotonin receptors.42
2.2 Matched molecular pair analysis (MMPA)
Furthermore, it is anticipated that the effect of a substituent on the respective physicochemical/biological property can be generalized, i.e. that its contribution is transferable across compound series.48
Given that the method captures the implicit knowledge contained in the chemical dataset in a systematic and automated manner, the emergence of the rules is fully explainable (as it is easy to trace back to the underlying compound pairs), resembles the intuitive way of a chemist's thinking, and lacks the “black box” character, which is frequently raised as a point of critique concerning machine learning or other in silico methods utilized for (Q)SAR analysis.45,46
The MMP concept has been widely employed.43–51 However, to the best of our knowledge, the application of this approach to a CP data set and with a view to lysosomotropism has not been reported to date.
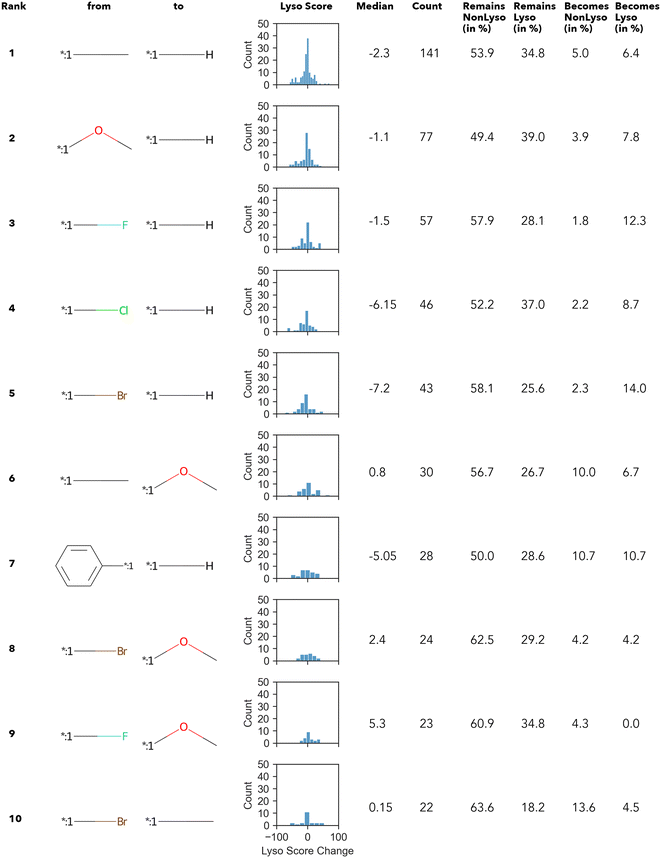
Altogether, 4441 unique transformations have been found regardless of the lysosomotropism classification. However, >99% of them occur less than 7 times (Fig. S1) (ESI†). Similar numbers, as well as the Zipfian-shaped distribution of counts (number of occurrence), have already been described by Hussain and Rea (2010),51 among others.
In summary, only 27 transformations occur ten times or more – of which the top 10 transformations with the highest numbers are shown in Fig. 3. Unsurprisingly, most of the “high-count” transformations found either resemble “simple” terminal group substitutions, where only a single atom is replaced, or functional group substitutions.
The Δ value is calculated by subtracting the lyso score of the “from” compound from that of “to” compound. In other words, if the Δ lyso score distribution is shifted to the right, the transformation is accompanied by an increase in lysosomotropism. However, in none of the “high-count” conversions shown in Fig. 3, the change in lyso score incidental to the transformations is in one direction only. The MMPA performed in this work intimates that there does not appear to be a dominant structural feature in the compound library under investigation that determines lysosomotropism.
2.3 Explainable machine learning
We used RDKit to generate one- and two-dimensional molecular descriptors of the compounds.56 Around 200 molecular descriptors can be generated by the RDKit. However, since we were aiming for explainability, we manually selected the descriptors which are intuitive, such as NumHAcceptors, TPSA, FractionCSP3, fr_nitro, etc. Some examples of unintuitive descriptors, which were removed, are PEOE_VSA7, VSA_EState8, SMR_VSA6, etc.
In total, 107 intuitive molecular descriptors were selected. These select descriptors are listed in the Table S1.† log![[thin space (1/6-em)]](https://www.rsc.org/images/entities/char_2009.gif) P and bpKa calculated by ChemAxon cxcalc, were also used additionally for one of the models.
P and bpKa calculated by ChemAxon cxcalc, were also used additionally for one of the models.
We prepared XGBoost binary classifiers as described below. Except for the scale_pos_weight hyperparameter, which was used to provide the weights of “Non-Lysosomotropic” and “Lysosomotropic” classes to control the class imbalance, default hyperparameters were used for training. The performances of the models trained with the default hyperparameters and with the optimized hyperparameters by the package Optuna59 were found similar, and thereby the default hyperparameters were used. All the models were trained on the internal data. Stratified 5-fold cross-validation with the balanced accuracy and the Cohen's kappa score as model performance metrics, was used to validate the models. The libraries present in the Scikit learn package were used for these calculations.60
Due to the numerical nature of the descriptors, TreeExplainer could be used directly on the models trained on the molecular descriptors and various SHAP plots can be employed to study the descriptors and their importance on a data set. However, molecular fingerprints are binary in nature and especially in the case of Morgan fingerprints, multiple substructures can be encoded in the same bit. Thus, highlighting bits as important is unintuitive unless the substructures they encode are known. We used X-FP, a Python library, to compute the substructures of the bits which Morgan fingerprints encodes. We then used X-FP's functionality to calculate feature importance by SHAP TreeExplainer and visualized these important bits and the substructures they encoded.64
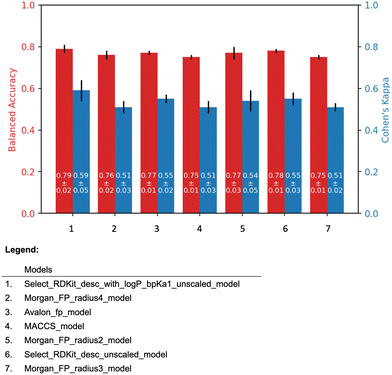 | ||
| Fig. 4 The 5-fold cross validation results of the all models. The black line on top of the bars indicates the standard deviation. | ||
The molecular descriptor model, “Select_RDKit_desc_with_logP_bpKa1_unscaled model”, and the molecular fingerprint model, “Morgan_FP_radius2_model” were selected as the representatives of their respective model types. For convenience, these models are referred to as the “Descriptor model” and the “Fingerprint model”, respectively.
The descriptor model has the average balanced accuracy of 0.79 with the standard deviation of 0.02, and the average Cohen's kappa score of 0.59 with the standard deviation of 0.05. Similarly, the fingerprint model has the average balanced accuracy of 0.77 with the standard deviation of 0.03, and the average Cohen's kappa score of 0.54 with the standard deviation of 0.05.
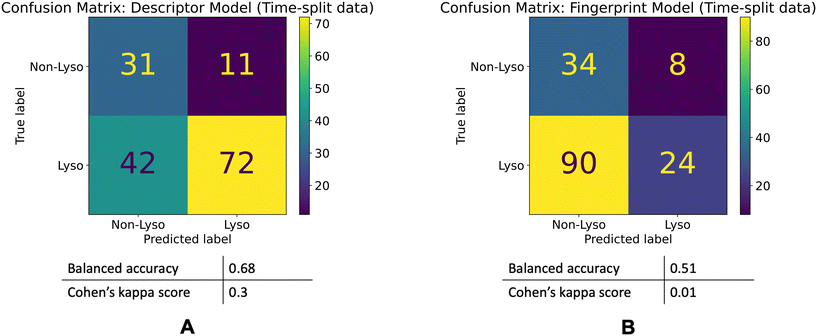
The descriptor model's balanced accuracy is 0.68 while its Cohen's kappa score is 0.3. The Fingerprint model's balanced accuracy is 0.51 and its Cohen's kappa is 0.01. The confusion matrices of these models' performances are shown in the Fig. 5.
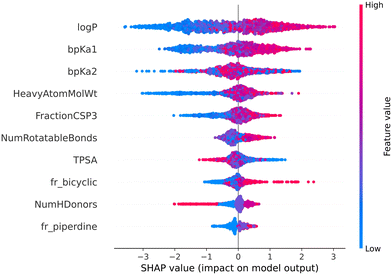
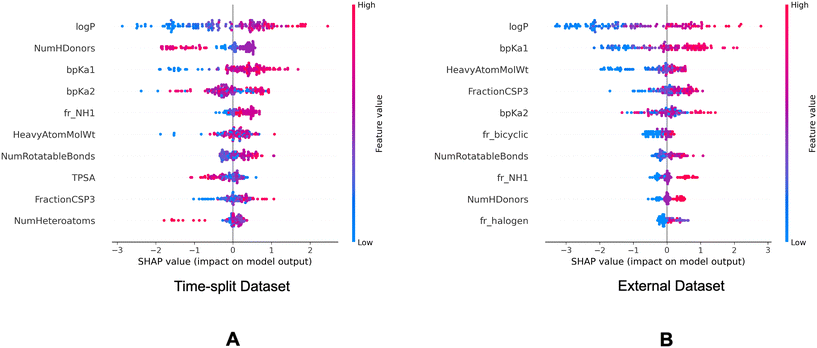
The color gradient from blue to red indicates the value of a feature from lower to higher. In our case, positive Shapley value correspond to the lysosomotropic class, and negative Shapley values to the non-lysosomotropic class.
Fig. 7 and 8 are the SHAP summary plots for the descriptor model on the training dataset and the validation datasets, respectively. These plots show the descriptors which are found important in each of the SHAP analysis.
SHAP dependence plots are scatter plots between a feature and their Shapley values. The dependence plots of top 10 features of the descriptor model for all the three datasets are present in the ESI† (Fig. S2–S4).
In the SHAP analysis of the training dataset, log![[thin space (1/6-em)]](https://www.rsc.org/images/entities/char_2009.gif) P and bpKa1 are found as the most important descriptors. It can be observed in Fig. 7 that the higher log
P and bpKa1 are found as the most important descriptors. It can be observed in Fig. 7 that the higher log![[thin space (1/6-em)]](https://www.rsc.org/images/entities/char_2009.gif) P and bpKa1 values contribute the model output towards the lysosomotropic class, and vice versa. Similar observations are noted in both of the SHAP analysis of the validations sets, the only exception being that the bpKa1 is the third most important descriptor in the time-split dataset.
P and bpKa1 values contribute the model output towards the lysosomotropic class, and vice versa. Similar observations are noted in both of the SHAP analysis of the validations sets, the only exception being that the bpKa1 is the third most important descriptor in the time-split dataset.
Descriptor fr_NH1 which describes the number of secondary amines, is found important in the SHAP analysis of the validations sets. Here, it is noted that the higher number of secondary amines have positive Shapley values indicating that they contribute model outputs to the lysosomotropic class.
Higher topological polar surface area (TPSA) is associated with poor cell membrane permeability. The inverse relationship between the TPSA values and their corresponding Shapley value indicates that the model outputs are driven towards non-lysosomotropic class when the TPSA of the compounds is higher. This can be justified if it is hypothesized that the non-lysosomotropic compounds have poor lysosome and/or cell membrane permeability.
Descriptor HeavyAtomMolWt calculates the average molecular weight of compounds while ignoring the hydrogen atoms. Across all three datasets, especially in the training and the external datasets, it can be observed that lower heavy atom molecular weights have negative Shapley values. Interestingly, the magnitude of negative Shapley values is higher than the positive Shapley values, indicating that the model finds lower molecular weights more important in classifying compounds as non-lysosomotropic.
The X-FP reports of the SHAP analysis of the fingerprint model of different datasets are present in the ESI.† Bit 2049, primarily encoding the sp3-hybridized carbon atom, is found important across all three datasets. When this bit is switched on – indicating the presence of the substructure encoded, the Shapley values are positive. This means that the presence of this substructure contributes the model prediction to the lysosomotropic class. Similarly, bit 3959, mainly encoding a secondary carbon across all the datasets, is found important in the training set and the external set. Positive Shapley value when this bit is switched on shows that presence of this substructure affects model predictions towards the lysosomotropic class.
Another bit encoding sp3 hybridized carbon is bit 1028 which encodes a carbon atom in the aliphatic ring. This bit is found important in the training dataset and the external dataset. Here too, presence of such substructure favors model predictions towards the lysosomotropic class. Interestingly, FractionCSP3 is a descriptor which describes the fractions of sp3 hybridized carbons present in a compound, and this descriptor is found important in the SHAP analysis of the descriptor model of all the datasets. Thus, both of the models find the sp3 hybridized carbon substructures important and the therefore suggests predictions towards the lysosomotropic class in the presence of such substructures.
Bit 2715, depending on its neighboring groups, might be encoding a secondary amine. This bit is important across all the three datasets. Bit 3200 encoding an aliphatic nitrogen atom is important across all three datasets. For both of these cases, presence of these substructures would impact the model output towards the lysosomotropic class. This is in line with the finding that basic pKa is consistently found as relevant descriptor in the SHAP analysis which is mostly driven by amine moieties.
The exemplar top bits and their substructures are shown in Table 1.
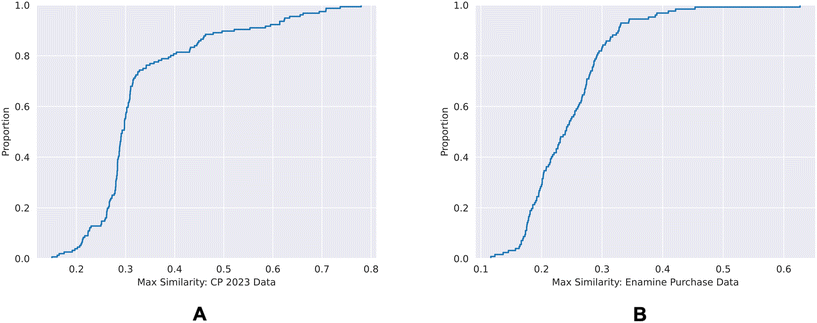 | ||
| Fig. 9 ECDF plots of the maximum chemical structure similarities of time-split dataset (A) and the external dataset (B) with the training dataset. | ||
80% of the time-split dataset show a maximum Tanimoto similarity of less than 0.4 to the training set, whereas for the external dataset it is 0.3. This shows that the chemical spaces of both of the validation sets are diverse in comparison to the training set.
We also performed principal component analysis (PCA) of the input descriptors of the combined datasets. However, only 19% explained variance ratio was observed in the first three principal components.
3 Discussion
3.1 Lysosomotropic compounds tend to have higher log![[thin space (1/6-em)]](https://www.rsc.org/images/entities/h3_char_2009.gif) P
P
Even though log![[thin space (1/6-em)]](https://www.rsc.org/images/entities/char_2009.gif) P was one of the two criteria for defining the PhysChem window used here, is the top descriptor in all 3 SHAP analyses of the descriptor model performed on the 3 data sets (training, time-split, and the external validation). All of these analyses show a common trend that higher log
P was one of the two criteria for defining the PhysChem window used here, is the top descriptor in all 3 SHAP analyses of the descriptor model performed on the 3 data sets (training, time-split, and the external validation). All of these analyses show a common trend that higher log![[thin space (1/6-em)]](https://www.rsc.org/images/entities/char_2009.gif) P values tend to have higher SHAP values and vice versa. Such relation can be interpreted such that with the higher log
P values tend to have higher SHAP values and vice versa. Such relation can be interpreted such that with the higher log![[thin space (1/6-em)]](https://www.rsc.org/images/entities/char_2009.gif) P values, the model favors the lysosomotropic class, and similarly with the lower log
P values, the model favors the lysosomotropic class, and similarly with the lower log![[thin space (1/6-em)]](https://www.rsc.org/images/entities/char_2009.gif) P values, the model instead favors the non-lysosomotropic class.
P values, the model instead favors the non-lysosomotropic class.
This relation between log![[thin space (1/6-em)]](https://www.rsc.org/images/entities/char_2009.gif) P values and lysosomotropism can also be noticed in the violin plot of the original lysosomotropic class distribution versus the log
P values and lysosomotropism can also be noticed in the violin plot of the original lysosomotropic class distribution versus the log![[thin space (1/6-em)]](https://www.rsc.org/images/entities/char_2009.gif) P values (Fig. 10). Here, across all the three datasets, the lysosomotropic compounds tend to have higher log
P values (Fig. 10). Here, across all the three datasets, the lysosomotropic compounds tend to have higher log![[thin space (1/6-em)]](https://www.rsc.org/images/entities/char_2009.gif) P values compared to the non-lysosomotropic ones.
P values compared to the non-lysosomotropic ones.
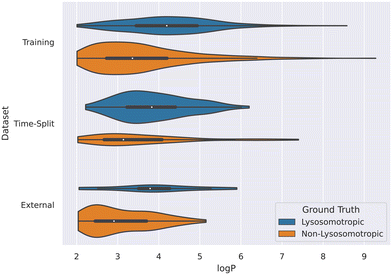 | ||
Fig. 10 Violin plot of log![[thin space (1/6-em)]](https://www.rsc.org/images/entities/char_2009.gif) P values across all datasets. The lysosomotropic classes are based on the cutoff of the compounds' lyso score. The violins are scaled based on the number of observations. P values across all datasets. The lysosomotropic classes are based on the cutoff of the compounds' lyso score. The violins are scaled based on the number of observations. | ||
3.2 Non-lysosomotropic compounds tend to have lower molecular weights
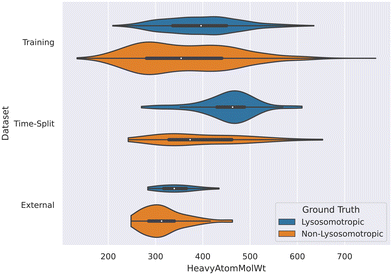
The descriptor HeavyAtomMolWt was found important in the SHAP analyses of all the datasets and it was noted that the lower molecular weights have negative Shapley values. This means such compounds are more likely to predicted non-lysosomotropic.This relationship between molecular weight and non-lysosomotropism can be observed in the violin plot of the original lysosomotropic class distribution versus the molecular weight of the compounds (Fig. 11).
3.3 sp3-hybridized carbon atoms are found important
Different fingerprint bits encoding different sp3-hybridized carbon substructures are found important across all datasets by the fingerprint model. Furthermore, the descriptor FractionCSP3 is found important by the descriptor model for all the datasets. The presence of sp3-hybridized carbon substructures is noted to impact the model output towards the lysosomotropic class, and vice versa, in all of the cases.3.4 Basic moieties are found important
It is consistently found by the descriptor-based SHAP analysis as well as by the X-FP analysis that basic moieties are driving a compound to be lysosomotropic. Though we restricted our selected compounds to be within a certain PhysChem window (log![[thin space (1/6-em)]](https://www.rsc.org/images/entities/char_2009.gif) P > 2, bpKa between 6.2 and 11), this lead to a restriction of the entire data towards basic moieties. However, the XML still might not have been capable of identifying this bias, but they correctly identified the fact that basic moieties are relevant for lysosomotropism.
P > 2, bpKa between 6.2 and 11), this lead to a restriction of the entire data towards basic moieties. However, the XML still might not have been capable of identifying this bias, but they correctly identified the fact that basic moieties are relevant for lysosomotropism.
3.5 Key substructures
No key substructures which induce either lysosomotropism or non-lysosomotropism were found here. In the MMPA, we do not identify any dominant chemical substructures which determine lysosomotropism in our data. Similarly, while examining the fingerprint model with X-FP, the important bits usually encode sp3-hybridized carbon substructures and basic nitrogen substructures. We hypothesise that these substructures influence lysosomotropism by affecting the overall physicochemical properties of the compounds instead of causing specific chemical structurebased activity.Many important bits encode substructures of the Morgan fingerprint radius of 0. This means that these substructures are single atoms, and thereby too unspecific to hypothesize any chemical structure-based activity.
3.6 The model performance
The descriptor model significantly outperforms the fingerprint model. Possible reasons for this initially unexpected drop in performance of the fingerprint model could be as follows.First, as highlighted in the previous section, due to the absence of any key substructures inducing lysosomotropism, the substructures found important by the fingerprint model might not be specific enough to differentiate between lysosomotropic and non-lysosomotropic compounds. Furthermore, if lysosomotropism is mainly driven by log![[thin space (1/6-em)]](https://www.rsc.org/images/entities/char_2009.gif) P and bpKa, then it will hard to find any substructure motifs that drive a log
P and bpKa, then it will hard to find any substructure motifs that drive a log![[thin space (1/6-em)]](https://www.rsc.org/images/entities/char_2009.gif) P/bpKa change which in turn modulates lysosomotropism. This is due to the fact the very same (small, because it only considers the neighbors up to two bonds apart) substructure detected by a fingerprint can have very different log
P/bpKa change which in turn modulates lysosomotropism. This is due to the fact the very same (small, because it only considers the neighbors up to two bonds apart) substructure detected by a fingerprint can have very different log![[thin space (1/6-em)]](https://www.rsc.org/images/entities/char_2009.gif) P/bpKa values based on their decoration.
P/bpKa values based on their decoration.
The chemical diversity of the training and the test sets form a challenge to the performance of the fingerprint model. This is especially pronounced when the presence or absence of the individual substructure (encoded as a bit in the fingerprint) has an impact on the biological readout, is influenced by the neighboring groups, the position in the molecule or by the stereochemistry, which is ignored by the fingerprints employed here.
The reasonable performance of the descriptor model compared to the fingerprint model further supports the notion that the lysosomotropism is primarily caused by physicochemical properties of a compound.
3.7 Concentration dependency of lysosomotropism
While investigating concentration dependency of lysosomotropism was not the focus of this work, we observed that not all the compounds show lysosomotropism even when tested at higher compound concentrations.Out of 1369 non-lysosomotropic compounds present in the combined training set and time-split set, 682 of them were also tested at higher compound concentrations of either 30 μM and 50 μM in the CPA in addition to the standard 10 μM compound concentration. While approximately 40% of such compounds (277 compounds) show lysosomotropism at higher concentration, the remaining 405 compounds remain non-lysosomotropic. Moreover, out of these 405 compounds which stay non-lysosomotropic at both standard and higher concentrations, 255 of them are bioactive (induction >5).
Nadanaciva et al. also reported that the two non-lysosomotropic compounds present in the PhysChem window in their analysis, especially risperidone, did not show lysosomotropism even at the highest tested concentration of 150 μM.15
Further investigation in this area might offer insight on this observation.
3.8 Limitations
It is impractical to determine the log![[thin space (1/6-em)]](https://www.rsc.org/images/entities/char_2009.gif) P values and the bpKa values of the compounds in the wet-lab at a bigger scale, at least in an academic setup. Thus, in our study the values of these descriptors are predicted. These descriptors are influential in the study. First, the compound selection is based on the compounds' presence in the PhysChem window, which is the cross-section of the log
P values and the bpKa values of the compounds in the wet-lab at a bigger scale, at least in an academic setup. Thus, in our study the values of these descriptors are predicted. These descriptors are influential in the study. First, the compound selection is based on the compounds' presence in the PhysChem window, which is the cross-section of the log![[thin space (1/6-em)]](https://www.rsc.org/images/entities/char_2009.gif) P values and the bpKa values. Second, these descriptors were found as the most important descriptors by the descriptor model. Therefore, our analyses might be affected due to the differences in the true and the predicted values of these descriptors.
P values and the bpKa values. Second, these descriptors were found as the most important descriptors by the descriptor model. Therefore, our analyses might be affected due to the differences in the true and the predicted values of these descriptors.
While our internal data is a compilation of diverse compounds over many years, it cannot cover the full chemical space. Our models are trained on this finite data and the hypotheses derived from these results are therefore limited to this representation.
The lyso score of 75 or above, indicating biosimilarity, is a hard cut-off value to determine the lysosomotropic class of the compounds. The compounds around this cut-off value will be biosimilar, however, their lysosomotropic classes will be different. This could affect our analyses.
Lastly, the SHAP analyses do not show causation for the ground truth, rather they show what features were found important by a model in a dataset. Since our models' performances are limited, the SHAP analyses are also not definitive.
3.9 Conclusions
We used the morphological profiling data from the in-house cell painting assay (CPA) to identify lysosomotropism in small molecules. We applied the lyso score to quantitatively score lysosomotropism. We confirm that mere presence of a compound in the well-established cross-section window of log![[thin space (1/6-em)]](https://www.rsc.org/images/entities/char_2009.gif) P and bpKa values does not suffice it to be a lysosomotropic compound. By performing a MMPA, we were not able to detect key substructures that can be made responsible for a lysosomotropic effect.
P and bpKa values does not suffice it to be a lysosomotropic compound. By performing a MMPA, we were not able to detect key substructures that can be made responsible for a lysosomotropic effect.
Our ML models were trained on the internal dataset and tested on diverse validation sets. This ensured that these models' predictions and, by extension, the interpretable analyses done on them are general and not specific to the training set. These models revealed that the lysosomotropic effect is favored when the compounds have high lipophilicity, basicity, high number of basic amines and high number of sp3-hybridized carbons, and low TPSA.
3.10 LysoPredictor web app
A user-friendly web application to predict lysosomotropism by small compounds is available on the CzodrowskiLab website.65 This web application uses the descriptor model in the backend to make predictions.4 Materials and methods
4.1 Data selection for MMPA, and model training and validation
The CPA protocol can be found in the methods section of Pahl et al. (2023).66 In total, roughly 13![[thin space (1/6-em)]](https://www.rsc.org/images/entities/char_2009.gif) 000 compounds were measured in the cell painting assay out of which roughly 450 compounds are known lysosomotropic active as reported in literature. These compounds are used as reference system for comparison of the cell painting profiles of the remaining compounds. Out the overall 13
000 compounds were measured in the cell painting assay out of which roughly 450 compounds are known lysosomotropic active as reported in literature. These compounds are used as reference system for comparison of the cell painting profiles of the remaining compounds. Out the overall 13![[thin space (1/6-em)]](https://www.rsc.org/images/entities/char_2009.gif) 000 tested compounds, 738 compounds are inside the PhysChem window and lysosomotropic. But there are 1327 compounds are inside the PhysChem which are not lysosomotropic. A filtering strategy was employed on the internal CP data set till 2022. 10 μM compound concentration was selected. Toxic compounds and those flagged with purity alerts were excluded. Compounds with heavy atom count exceeding 50 were removed. Compounds whose calculated log
000 tested compounds, 738 compounds are inside the PhysChem window and lysosomotropic. But there are 1327 compounds are inside the PhysChem which are not lysosomotropic. A filtering strategy was employed on the internal CP data set till 2022. 10 μM compound concentration was selected. Toxic compounds and those flagged with purity alerts were excluded. Compounds with heavy atom count exceeding 50 were removed. Compounds whose calculated log![[thin space (1/6-em)]](https://www.rsc.org/images/entities/char_2009.gif) P and bpKa1 values were empty were removed. Final selection was then made on the compounds present in the PhysChem window – log
P and bpKa1 values were empty were removed. Final selection was then made on the compounds present in the PhysChem window – log![[thin space (1/6-em)]](https://www.rsc.org/images/entities/char_2009.gif) P value greater than 2 and bpKa1 value greater than 6.2 and less than 11. apKa1 and apKa2 were removed since they were redundant in the context of this study. In total, 2065 compounds were available for MMPA, and model training and cross validation.
P value greater than 2 and bpKa1 value greater than 6.2 and less than 11. apKa1 and apKa2 were removed since they were redundant in the context of this study. In total, 2065 compounds were available for MMPA, and model training and cross validation.
The bpKa1 limit of 6.5 from literature was lowered to 6.2 to enable the inclusion of a larger group of lysosomotropic compounds (53 compounds) present in the bpKa1 range between 6.5 and 6.2.
Same steps were repeated to obtain compounds for the time-split validation set on the 2023 dataset.
Details about selected compounds from the time-split validation and the training data can be found here: ref. 34, 37, 39, 67 and 68.
The corresponding code for the filtering strategy is available on GitHub.69
4.2 The mmpdb algorithm
The mmpdb algorithm (version 2) published by Dalke et al. (2018),45 which is freely available from the RDKit repository, was employed with default parameters. The program takes a set of SMILES of the compounds under analysis as input and outputs SMIRKS describing the molecular transformation for each MMP identified.51 In brief, it consists of a three-step-procedure: firstly, the compounds in the data set are decomposed into fragments following a well-defined protocol to derive all possible constant and variable parts, secondly all fragments are indexed and systematically compared to identify common substructures.46,51 Lastly, the transformation rules are derived by evaluating all the MMPs with the same transformation (same variable A and B) at a specific environment radius and aggregation of the associated property changes.704.3 Explainable machine learning
![[thin space (1/6-em)]](https://www.rsc.org/images/entities/char_2009.gif) P and bpKa, were calculated by the RDKit. Log
P and bpKa, were calculated by the RDKit. Log![[thin space (1/6-em)]](https://www.rsc.org/images/entities/char_2009.gif) P and bpKa were calculated by ChemAxon Marvin cxcalc version 22.22.0 (https://www.chemaxon.com).
P and bpKa were calculated by ChemAxon Marvin cxcalc version 22.22.0 (https://www.chemaxon.com).
All the molecular fingerprints were generated by the RDKit. The Morgan fingerprints were calculated as bit vectors and the option to save the bit info was enabled to perform the SHAP analysis of the substructures using X-FP.
For each compound present in a query dataset, chemical structure similarity against all of the compounds in the training dataset was calculated. The compound present in the training data which is structurally most similar to the query compound would therefore give the highest similarity score, and this score would be the query compound's maximum similarity score against the training dataset.
By plotting the maximum similarity scores of all the compounds of the query dataset as an ECDF plot, the percentage similarity to the training dataset can be observed.
![[thin space (1/6-em)]](https://www.rsc.org/images/entities/char_2009.gif) P and bpKa were calculated by ChemAxon Marvin cxcalc version 22.22.0 (https://www.chemaxon.com) – the compounds present outside the PhysChem window were removed. To remove promiscuous compounds from the data in the following step, filtering proposed by Novartis Institutes of BioMedical Research (NIBR), which includes filters for the PAINS filter families A and B, was performed.72,73
P and bpKa were calculated by ChemAxon Marvin cxcalc version 22.22.0 (https://www.chemaxon.com) – the compounds present outside the PhysChem window were removed. To remove promiscuous compounds from the data in the following step, filtering proposed by Novartis Institutes of BioMedical Research (NIBR), which includes filters for the PAINS filter families A and B, was performed.72,73
The purchased compounds have at least a purity of 90 percent, measured by liquid chromatography–mass spectrometry (LC–MS). More details can be found in the ESI.†
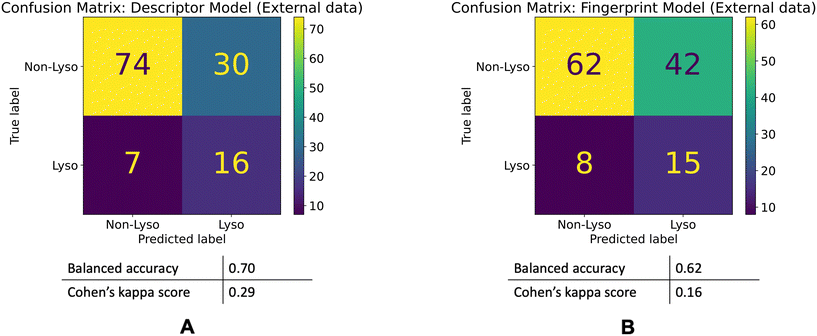
Maximum similarity calculation was performed against the internal MPI dataset and diverse compounds were short-listed. The original lysosomotropic class ratio present in the training dataset (65% non-lysosomotropic and 35% lysosomotropic) was aimed to be maintained, therefore, 127 compounds where 81 as non-lysosomotropic and 46 as lysosomotropic compounds predicted by the descriptor model were short-listed and ordered. For these 127 compounds, the fingerprint model classified 70 as non-lysosomotropic and 57 as lysosomotropic.
List of abbreviations
| bpKa | Basic pKa |
clog![[thin space (1/6-em)]](https://www.rsc.org/images/entities/char_2009.gif) P P | Calculated log![[thin space (1/6-em)]](https://www.rsc.org/images/entities/char_2009.gif) P P |
| CP | Cell painting |
| CPA | Cell painting assay |
| LC–MS | Liquid chromatography-mass spectrometry |
log![[thin space (1/6-em)]](https://www.rsc.org/images/entities/char_2009.gif) P P | Octanol/water-partition coefficient |
| LTR | LysoTracker Red DND-99 |
| ML | Machine learning |
| MMP | Matched molecular pair |
| MMPA | Matched molecular pair analysis |
| PCA | Principal component analysis |
| QSAR | Quantitative structure activity relationship |
| SAG | Smoothened agonist |
| SAR | Structure activity relationship |
| SARS-CoV-2 | Severe acute respiratory syndrome coronavirus 2 |
| SHAP | Shapley additive explanations |
| SMILES | Simplified molecular input line entry system |
| SPR | Structure property relationship |
| TPSA | Topological polar surface area |
| XGBoost | Extreme gradient boosting |
| XML | Explainable machine learning |
Conflicts of interest
The authors declare no conflicts of interest.Acknowledgements
We thank Dr. Slava Ziegler for proofreading the manuscript and for valuable discussion, and Vinith Kowrithasan for front- and backend development, and maintenance of the LysoPredictor web-app. Open Access funding provided by the Max Planck Society.References
- C. de Duve, T. de Barsy, B. Poole, A. Trouet, P. Tulkens and F. van Hoof, Lysosomotropic Agents, Biochem. Pharmacol., 1974, 23, 2495–2531 CrossRef CAS PubMed.
- S. Pisonero-Vaquero and D. L. Medina, Lysosomotropic Drugs: Pharmacological Tools to Study Lysosomal Function, Curr. Drug Metab., 2017, 18, 1147–1158 CrossRef CAS PubMed.
- T. Schneidewind, A. Brause, B. Schölermann, S. Sievers, A. Pahl, M. G. Sankar, M. Winzker, P. Janning, K. Kumar, S. Ziegler and H. Waldmann, Combined morphological and proteome profiling reveals target-independent impairment of cholesterol homeostasis, Cell Chem. Biol., 2021, 28, 1780–1794.e5 CrossRef CAS PubMed.
- O. F. Kuzu, M. Toprak, M. A. Noory and G. P. Robertson, Effect of lysosomotropic molecules on cellular homeostasis, Pharmacol. Res., 2017, 117, 177–184 CrossRef CAS PubMed.
- M. Blaess, L. Kaiser, M. Sauer, R. Csuk and H.-P. Deigner, COVID-19/SARS-CoV-2 Infection: Lysosomes and Lysosomotropism Implicate New Treatment Strategies and Personal Risks, Int. J. Mol. Sci., 2020, 21, 4953 CrossRef CAS PubMed.
- M. J. Vincent, E. Bergeron, S. Benjannet, B. R. Erickson, P. E. Rollin, T. G. Ksiazek, N. G. Seidah and S. T. Nichol, Chloroquine is a potent inhibitor of SARS coronavirus infection and spread, Virol. J., 2005, 2, 1–10 CrossRef PubMed.
- U. Norinder, A. Tuck, K. Norgren and V. M. Kos, Existing highly accumulating lysosomotropic drugs with potential for repurposing to target COVID-19, Biomed. Pharmacother., 2020, 130, 110582 CrossRef CAS PubMed.
- E. Keyaerts, L. Vijgen, P. Maes, J. Neyts and M. V. Ranst, In vitro inhibition of severe acute respiratory syndrome coronavirus by chloroquine, Biochem. Biophys. Res. Commun., 2004, 323, 264–268 CrossRef CAS PubMed.
- C. A. Devaux, J. M. Rolain, P. Colson and D. Raoult, New insights on the antiviral effects of chloroquine against coronavirus: what to expect for COVID-19?, Int. J. Antimicrob. Agents, 2020, 55, 105938 CrossRef CAS PubMed.
- T. A. Tummino, V. V. Rezelj, B. Fischer, A. Fischer, M. J. O'Meara, B. Monel, T. Vallet, K. M. White, Z. Zhang, A. Alon, H. Schadt, H. R. O’Donnell, J. Lyu, R. Rosales, B. L. McGovern, R. Rathnasinghe, S. Jangra, M. Schotsaert, J.-R. Galarneau, N. J. Krogan, L. Urban, K. M. Shokat, A. C. Kruse, A. García-Sastre, O. Schwartz, F. Moretti, M. Vignuzzi, F. Pognan and B. K. Shoichet, Drug-induced phospholipidosis confounds drug repurposing for SARS-CoV-2, Science, 2021, 373, 541–547 CrossRef CAS PubMed.
- A. M. Henao-Restrepo, H. Pan, R. Peto, M. P. Preziosi and V. Sathiyamoorthy, et al. Remdesivir and three other drugs for hospitalised patients with COVID-19: final results of the WHO Solidarity randomised trial and updated meta-analyses, Lancet, 2022, 399, 1941–1953 CrossRef PubMed.
- Chloroquine or Hydroxychloroquine and/or Azithromycin National Institutes of Health (NIH) COVID-19 Treatment Guidelines. Accessed: 2023-02-25.
- Table. Chloroquine or Hydroxychloroquine and/or Azithromycin: Selected Clinical Data National Institutes of Health (NIH) COVID-19 Treatment Guidelines. Accessed: 2023-02-25.
- F. Marceau, M. T. Bawolak, R. Lodge, J. Bouthillier, A. Gagné-Henley, R. C. Gaudreault and G. Morissette, Cation trapping by cellular acidic compartments: Beyond the concept of lysosomotropic drugs, Toxicol. Appl. Pharmacol., 2012, 259(1), 1–12 CrossRef CAS PubMed.
- S. Nadanaciva, S. Lu, D. F. Gebhard, B. A. Jessen, W. D. Pennie and Y. Will, A high content screening assay for identifying lysosomotropic compounds, Toxicol. In Vitro, 2011, 25, 715–723 CrossRef CAS PubMed.
- B. Zhitomirsky and Y. G. Assaraf, Lysosomal sequestration of hydrophobic weak base chemotherapeutics triggers lysosomal biogenesis and lysosome-dependent cancer multidrug resistance, Onco Targets Ther, 2015, 6, 1143–1156 Search PubMed.
- S. Lu, T. Sung, N. Lin, R. T. Abraham and B. A. Jessen, Lysosomal adaptation: How cells respond to lysosomotropic compounds, PLoS One, 2017, 12, 1–22 Search PubMed.
- A. Ufuk, F. Assmus, L. Francis, J. Plumb, V. Damian, M. Gertz, J. B. Houston and A. Galetin, In Vitro and in Silico Tools To Assess Extent of Cellular Uptake and Lysosomal Sequestration of Respiratory Drugs in Human Alveolar Macrophages, Mol. Pharmaceutics, 2017, 14, 1033–1046 CrossRef CAS PubMed.
- M. V. Schmitt, P. Lienau, G. Fricker and A. Reichel, Quantitation of Lysosomal Trapping of Basic Lipophilic Compounds Using In Vitro Assays and In Silico Predictions Based on the Determination of the Full pH Profile of the Endo−/Lysosomal System in Rat Hepatocytes, Drug Metab. Dispos., 2019, 47, 49–57 CrossRef CAS PubMed.
- U. Norinder and V. M. Kos, QSAR models for predicting five levels of cellular accumulation of lysosomotropic macrocycles, Int. J. Mol. Sci., 2019, 20, 1–13 Search PubMed.
- H. Hu, A. Tjaden, S. Knapp, A. A. Antolin and S. Müller, A machine learning and live-cell imaging tool kit uncovers small molecules induced phospholipidosis, Cell Chem. Biol., 2023, 1–18 Search PubMed.
- S. Ohkuma and B. Poole, Cytoplasmic vacuolation of mouse peritoneal macrophages and the uptake into lysosomes of weakly basic substances, J. Cell Biol., 1981, 90, 656–664 CrossRef CAS PubMed.
- M.-A. Bray, S. Singh, H. Han, C. T. Davis, B. Borgeson, C. Hartland, M. Kost-Alimova, S. M. Gustafsdottir, C. C. Gibson and A. E. Carpenter, Cell Painting, a high-content image-based assay for morphological profiling using multiplexed fluorescent dyes, Nat. Protoc., 2016, 11, 1757–1774 CrossRef CAS PubMed.
- H. Chen, O. Engkvist, Y. Wang, M. Olivecrona and T. Blaschke, The rise of deep learning in drug discovery, Drug Discovery Today, 2018, 23, 1241–1250 CrossRef PubMed.
- P. Schneider, W. P. Walters, A. T. Plowright, N. Sieroka, J. Listgarten, R. A. Goodnow, J. Fisher, J. M. Jansen, J. S. Duca and T. S. Rush, et al. Rethinking drug design in the Artificial Intelligence Era, Nat. Rev. Drug Discovery, 2019, 19, 353–364 CrossRef PubMed.
- M. T. Ribeiro, S. Singh and C. Guestrin, Proc. 22nd ACM SIGKDD Int. Conf. on Knowledge Discovery and Data Mining, 2016, pp. 1135–1144 Search PubMed.
- S. M. Lundberg and S. I. Lee, A unified approach to interpreting model predictions, Advances in Neural Information Processing Systems, 2017, pp. 4766–4775 Search PubMed.
- R. Rodríguez-Pérez and J. Bajorath, Interpretation of compound activity predictions from complex machine learning models using local approximations and shapley values, J. Med. Chem., 2020, 63, 8761–8777 CrossRef PubMed.
- J. Jiménez-Luna, M. Skalic, N. Weskamp and G. Schneider, Coloring Molecules with Explainable Artificial Intelligence for Preclinical Relevance Assessment, J. Chem. Inf. Model., 2021, 61, 1083–1094 CrossRef PubMed.
- T. Harren, H. Matter, G. Hessler, M. Rarey and C. Grebner, Interpretation of Structure–Activity Relationships in Real-World Drug Design Data Sets Using Explainable Artificial Intelligence, J. Chem. Inf. Model., 2022, 62, 447–462 CrossRef CAS PubMed.
- S. M. Gustafsdottir, V. Ljosa, K. L. Sokolnicki, J. A. Wilson, D. Walpita, M. M. Kemp, K. P. Seiler, H. A. Carrel, T. R. Golub, S. L. Schreiber, P. A. Clemons, A. E. Carpenter and A. F. Shamji, Multiplex Cytological Profiling Assay to Measure Diverse Cellular States, PLoS One, 2013, 8, e80999 CrossRef PubMed.
- J.-M. Gally, A. Pahl and H. Waldmann, Identifying bioactivity of pseudo-natural products using the Cell Painting assay, ARKIVOC, 2020, 2021, 89–104 Search PubMed.
- B. Schölermann, J. Bonowski, M. Grigalunas, A. Burhop, Y. Xie, J. G. F. Hoock, J. Liu, M. Dow, A. Nelson, C. Nowak, A. Pahl, S. Sievers and S. Ziegler, Identification of Dihydroorotate Dehydrogenase Inhibitors Using the Cell Painting Assay, ChemBioChem, 2022, 23(22), e202200475 CrossRef PubMed.
- A. Christoforow, J. Wilke, A. Binici, A. Pahl, C. Ostermann, S. Sievers and H. Waldmann, Design, Synthesis, and Phenotypic Profiling of Pyrano-Furo-Pyridone Pseudo Natural Products, Angew. Chem., Int. Ed., 2019, 58, 14715–14723 CrossRef CAS PubMed.
- T. Schneidewind, A. Brause, A. Pahl, A. Burhop, T. Mejuch, S. Sievers, H. Waldmann and S. Ziegler, Morphological Profiling Identifies a Common Mode of Action for Small Molecules with Different Targets, ChemBioChem, 2020, 21, 3197–3207 CrossRef CAS PubMed.
- L. Laraia, et al., Image-Based Morphological Profiling Identifies a Lysosomotropic, Iron-Sequestering Autophagy Inhibitor, Angew. Chem., Int. Ed., 2020, 59, 5721–5729 CrossRef CAS PubMed.
- D. J. Foley, S. Zinken, D. Corkery, L. Laraia, A. Pahl, Y.-W. Wu and H. Waldmann, Phenotyping Reveals Targets of a Pseudo-Natural-Product Autophagy Inhibitor, Angew. Chem., Int. Ed., 2020, 59, 12470–12476 CrossRef CAS PubMed.
- K. Kumar and H. Waldmann, Synthesis of Natural Product Inspired Compound Collections, Angew. Chem., Int. Ed., 2009, 48, 3224–3242 CrossRef CAS PubMed.
- M. Grigalunas, A. Burhop, S. Zinken, A. Pahl, J.-M. Gally, N. Wild, Y. Mantel, S. Sievers, D. J. Foley, R. Scheel, C. Strohmann, A. P. Antonchick and H. Waldmann, Natural product fragment combination to performance-diverse pseudo-natural products, Nat. Commun., 2021, 12, 1883 CrossRef CAS PubMed.
- Imatinib DrugBank. Accessed: 2023-03-07.
- Toremifene DrugBank. Accessed: 2023-03-07.
- Clozapine DrugBank. Accessed: 2023-03-07.
- P. W. Kenney and J. Sadowski, Structure Modification in Chemical Databases, Wiley-VCH, 2004, p. 493 Search PubMed.
- G. Papadatos, M. Alkarouri, V. J. Gillet, P. Willett, V. Kadirkamanathan, C. N. Luscombe, G. Bravi, N. J. Richmond, S. D. Pickett, J. Hussain, J. M. Pritchard, A. W. Cooper and S. J. MacDonald, Lead Optimization Using Matched Molecular Pairs: Inclusion of Contextual Information for Enhanced Prediction of hERG Inhibition, Solubility, and Lipophilicity, J. Chem. Inf. Model., 2010, 50, 1872–1886 CrossRef CAS PubMed.
- A. Dalke, J. Hert and C. Kramer, Mmpdb: An Open-Source Matched Molecular Pair Platform for Large Multiproperty Data Sets, J. Chem. Inf. Model., 2018, 58, 902–910 CrossRef CAS PubMed.
- A. M. Wassermann, D. Dimova, P. Iyer and J. Bajorath, Advances in Computational Medicinal Chemistry: Matched Molecular Pair Analysis, Drug Dev. Res., 2012, 73, 518–527 CrossRef CAS.
- A. G. Dossetter, E. J. Griffen and A. G. Leach, Matched Molecular Pair Analysis in Drug Discovery, Drug Discovery Today, 2013, 18, 724–731 CrossRef CAS PubMed.
- C. Tyrchan and E. Evertsson, Matched Molecular Pair Analysis in Short: Algorithms, Applications and Limitations, Comput. Struct. Biotechnol. J., 2017, 15, 86–90 CrossRef CAS PubMed.
- E. Griffen, A. G. Leach, G. R. Robb and D. J. Warner, Matched molecular pairs as a medicinal chemistry tool, J. Med. Chem., 2011, 54, 7739–7750 CrossRef CAS PubMed.
- M. Awale, J. Hert, L. Guasch, S. Riniker and C. Kramer, The Playbooks of Medicinal Chemistry Design Moves, J. Chem. Inf. Model., 2021, 61, 729–742 CrossRef CAS PubMed.
- J. Hussain and C. Rea, Computationally efficient algorithm to identify matched molecular pairs (MMPs) in large data sets, J. Chem. Inf. Model., 2010, 50, 339–348 CrossRef CAS PubMed.
- D. Rogers and M. Hahn, Extended-Connectivity Fingerprints, J. Chem. Inf. Model., 2010, 50, 742–754 CrossRef CAS PubMed.
- H. L. Morgan, The Generation of a Unique Machine Description for Chemical Structures-A Technique Developed at Chemical Abstracts Service, J. Chem. Doc., 1965, 5, 107–113 CrossRef CAS.
- P. Gedeck, B. Rohde and C. Bartels, QSAR – How Good Is It in Practice? Comparison of Descriptor Sets on an Unbiased Cross Section of Corporate Data Sets, J. Chem. Inf. Model., 2006, 46, 1924–1936 CrossRef CAS PubMed.
- R. Todeschini and V. Consonni, Molecular Descriptors for Cheminformatics, Wiley-VCH, 2009 Search PubMed.
- rdkit/rdkit: 2022_09_5 (Q3 2022) Release, 2023.
- M. Bramer, Principles of Data Mining, Springer, London, 2013, pp. 121–136 Search PubMed.
- T. Chen and C. Guestrin, Proc. 22nd ACM SIGKDD Int. Conf. on Knowledge Discovery and Data Mining, 2016, pp. 785–794 Search PubMed.
- T. Akiba, S. Sano, T. Yanase, T. Ohta and M. Koyama, Proc. 25th ACM SIGKDD Conf., 2019 Search PubMed.
- L. Buitinck, G. Louppe, M. Blondel, F. Pedregosa, A. Mueller, O. Grisel, V. Niculae, P. Prettenhofer, A. Gramfort, J. Grobler, R. Layton, J. VanderPlas, A. Joly, B. Holt and G. Varoquaux, ECML PKDD Workshop: Languages for Data Mining and Machine Learning, 2013, pp. 108–122 Search PubMed.
- L. S. Shapley, Contributions to the Theory of Games (AM-28), Princeton University Press, 1953, vol. 2, pp. 307–318 Search PubMed.
- C. Humer, H. Heberle, F. Montanari, T. Wolf, F. Huber, R. Henderson, J. Heinrich and M. Streit, ChemInformatics Model Explorer (CIME): exploratory analysis of chemical model explanations, J. Cheminf., 2022, 14, 1–14 Search PubMed.
- S. M. Lundberg, G. Erion, H. Chen, A. DeGrave, J. M. Prutkin, B. Nair, R. Katz, J. Himmelfarb, N. Bansal and S. I. Lee, From local explanations to global understanding with explainable AI for trees, Nat. Mach. Intell., 2020, 2, 56–67 CrossRef PubMed.
- A. Tandon and M. Baltruschat, X-FP: eXplainable FingerPrints X-FP GitHub repository. Accessed: 2023-11-30.
- Lysosomotropism Predictor WebApp CzodrowskiLab Homepage. Accessed: 2023-10-24.
- A. Pahl, B. Schölermann, P. Lampe, M. Rusch, M. Dow, C. Hedberg, A. Nelson, S. Sievers, H. Waldmann and S. Ziegler, Morphological subprofile analysis for bioactivity annotation of small molecules, Cell Chem. Biol., 2023, 1–35 Search PubMed.
- S. Zimmermann, M. Akbarzadeh, F. Otte, C. Strohmann, M. G. Sankar, S. Ziegler, A. Pahl, S. Sievers and K. Kumar, A Scaffold-Diversity Synthesis of Biologically Intriguing Cyclic Sulfonamides, Chem. – Eur. J., 2019, 25, 15498–15503 CrossRef CAS PubMed.
- J. Liu, G. S. Cremosnik, F. Otte, A. Pahl, S. Sievers, C. Strohmann and H. Waldmann, Design, Synthesis, and Biological Evaluation of Chemically and Biologically Diverse Pyrroquinoline Pseudo Natural Products, Angew. Chem., Int. Ed., 2021, 60, 4648–4656 CrossRef CAS PubMed.
- Lysosomotropic Project GitHub Repo CzodrowskiLab Lyso Project Open GitHub repository. Accessed: 2023-11-30.
- M. Awale, S. Riniker and C. Kramer, Matched Molecular Series Analysis for ADME Property Prediction, J. Chem. Inf. Model., 2020, 60, 2903–2914 CrossRef CAS PubMed.
- A. Pahl, Jupy Tools, version 1.0.0, 2022 Search PubMed.
- N. Schneider and A. Schuffenhauer, NIBR Substructure Filters Python Script RDKit Contrib NIBRSubstructureFilters GitHub repository. Accessed: 2023-11-30.
- A. Schuffenhauer, et al. Evolution of Novartis' Small Molecule Screening Deck Design, J. Med. Chem., 2020, 63, 14425–14447 CrossRef CAS PubMed.
Footnote |
| † Electronic supplementary information (ESI) available. See DOI: https://doi.org/10.1039/d4md00107a |
| This journal is © The Royal Society of Chemistry 2024 |

