 Open Access Article
Creative Commons Attribution 3.0 Unported Licence
Multi-doped ceria-based composite as a promising low-temperature electrolyte with enhanced ionic conductivity for steam electrolysis†
Yuheng
Liu
a,
Ming
Xu
b,
Yunlong
Zhao
 b and
Bahman
Amini Horri
 *a
*a
aSchool of Chemistry and Chemical Engineering, Faculty of Engineering & Physical Sciences, University of Surrey, GU2 7XH, Guildford, Surrey, UK. E-mail: b.aminihorri@surrey.ac.uk
bAdvanced Technology Institute, Faculty of Engineering & Physical Sciences, University of Surrey, GU2 7XH, Guildford, Surrey, UK
First published on 28th April 2023
Abstract
Steam electrolysis is one of the most efficient approaches for producing green hydrogen. This method is based on the application of solid oxide electrolysis cells (SOECs) fabricated from functional ceramic composites for water splitting at high temperatures. Gadolinium doped ceria (GDC) is a promising electrolyte material for the fabrication of SOECs. However, the effective sintering temperature for GDC composites is usually above 1250 °C, which makes it impossible to use conventional supporting materials like ferritic steel for stack fabrication. In this work, for the first time, we have developed a lithium–bismuth–copper co-doped GDC composite capable of sintering at ∼750 °C. The physicochemical and electrochemical characteristics of the co-doped GDC electrolyte were systematically analysed using thermogravimetric analysis (TG/DTA), Raman spectroscopy, SEM/EDX, XRD, EIS, XPS and dilatometry analysis. The fabricated electrolyte pellets sintered at 750 °C for 6 hours in an inert atmosphere (argon) showed high densification, obtaining 96.70% relative density. Also, the electrical conductivity obtained for the synthesised composite Ce0.712Gd0.178Li0.05Bi0.05Cu0.01O1.801 (sintered at 950 °C for 6 h) was 29.6 mS cm−1 at 750 °C with activation energy as low as 0.13 eV. The result of this study helps to understand better the properties of co-doped electrolyte materials for the fabrication of more efficient steam electrolysers for environmentally-friendly hydrogen generation.
Design, System, ApplicationGadolinium-doped ceria (GDC) is one of the most common types of polycrystalline solid-state electrolytes for the fabrication of solid-oxide electrolysers and fuel cells operating at intermediate temperatures (500–700 °C). In this work, for the first time, we have developed a lithium–bismuth–copper co-doped GDC composite (Ce0.712Gd0.178Li0.05Bi0.05Cu0.01O1.801) capable of sintering at ∼750 °C. Such a super-low sintering temperature with high ionic conductivity (29.6 mS cm−1 measured at 750 °C) makes it possible to apply conventional ferritic stainless steel supporting materials for the fabrication of metal-supported steam electrolysers. The physicochemical and electrochemical characteristics of the co-doped GDC electrolyte were systematically analysed using thermogravimetric analysis (TG/DTA), Raman spectroscopy, SEM/EDX, XRD, EIS, XPS and dilatometry analysis. The fabricated electrolyte pellets sintered at 750 °C for 6 hours in an inert atmosphere (argon) showed high densification properties (96.70% relative density) and low activation energy (0.13 eV). The result of this study helps to understand better the properties of co-doped electrolyte materials for the fabrication of more efficient steam electrolysers for environmentally friendly hydrogen generation. Steam electrolysis is one of the most efficient approaches for producing green hydrogen. |
Introduction
Solid oxide electrolysis cells (SOECs) are eco-friendly hydrogen energy generation equipment that directly utilises electrical energy to produce hydrogen and other chemical products with high energy efficiency.1 Compared with proton-exchange membrane electrolysers (PEM) and alkaline electrolysers (AEM), the SOEC system shows the highest hydrogen production rate and system exergy efficiency.2,3 Due to environmental concerns and supply limits associated with fossil fuels, SOECs have recently gained considerable attention on a global scale.4 Over the past 10 to 15 years, the SOEC technology has generated significant research and advancement.5 According to steam electrolysis current–voltage curves, the initial performance of SOECs has improved by more than a factor of 2.5 during the last 15 years.6,7 The durability and degradation of SOECs also showed obvious progress.8,9 According to the estimation of Hauch's group, the SOEC technology is now mature enough for industrial scale-up, and this scale-up is currently proceeding quickly.1SOECs are fabricated in various structural designs (electrolyte-supported, ceramic electrode-supported and metal-supported). Ceramic supports are applied in electrolyte-supported cells and ceramic electrode-supported cells. Metal-supported cells employ low-cost supporting metals and alloys.10 Compared with other structural designs, metal-supported cells show several advantages. The basic idea of metal-supported cells is to support the smallest ceramic electrode/electrolyte layers with durable, low-cost metal layers made of stainless steel.11 The expensive ceramic electrochemically active layers are only as thick as required for effective electrochemical operation, lowering the cell fabrication cost and maintaining robustness. Conventional cells face changes in the physical and mechanical properties of the metal–ceramic composite electrode caused by redox cycling, which highly decreases the performance of cells.12 In contrast, the metal-supported design offers more robust cell polarisation behaviour and improves electrochemical performance.
However, the major challenge of metal-supported cells is the sintering temperature of the electrolyte. Ceramic electrolytes require a high sintering temperature (>1000 °C) to achieve approximately full density (≥95%) to provide high ionic conductivity with no gas crossover between the electrodes. While yttria-stabilised zirconia (YSZ) and gadolinium-doped ceria (GDC) served as the most common types of solid-state electrolytes for SOECs, GDC offers a significantly better ionic conductivity at lower operating temperatures.13,14 GDC is considered an ideal intermediate-temperature (500–700 °C) solid electrolyte for prospective commercial applications.15–17 However, the average sintering temperature for GDC composites is usually above 1250 °C, which makes it impossible to use conventional ferritic stainless steel supporting materials for stack fabrication. The high operating temperature applied during the fabrication steps (e.g., sintering of the electrolyte layer) can damage the metal support structure and decrease its mechanical strength.18
Reducing the sintering temperature of electrolytes is a crucial requirement for designing metal-supported SOECs with improved thermochemical stability at high temperatures. The reduced thermal energy associated with such a low sintering temperature can also effectively contribute toward reducing the overall cost of cell manufacturing.
It is well-known that the initial connections between the GDC particles cause the creation of particle necks, followed by densification and grain growth, during the sintering process.19 Mass transport processes mainly occur at the surface and grain boundaries at lower temperatures, i.e., during the initial stage of the sintering process. Thus, the number of interactions between the particles, which strongly relies on the initial particle and pore size of the GDC powder, is crucial. However, during both the intermediate and final stages of sintering, the densification can be significantly altered by the pining effects of porosity.20 According to Herring's study, nanopowders reduce temperature sintering, as smaller particle size allows densification to occur primarily via grain-boundary diffusion instead of lattice diffusion.21 The grain-boundary diffusion can be described via the flux of atoms along a grain boundary; it can be given as:22
| J = MC∇μ |
Various methods for applying sintering aids have been reported, in which the whole sintering progress is processed in an air atmosphere.23 In the prediction and evaluation of Nicholas's group, doping Cu, Co, Fe, Mn, Li, and Zn into GDC can decrease sintering temperature, and 3 mol% lithium-doped GDC can be sintered at 800 °C to 99% density.22 They indicated that doping with Li (lithium) as a single dopant could decrease the sintering temperature, gaining a final density of 95% at ∼950 °C. Chen et al. applied Li2O as a sintering aid for lab-synthesised GDC using LiNO3 as a Li source.24 According to their results, 5 mol% lithium-doped GDC with a relative density of 99.3% was achieved at a sintering temperature of 900 °C and showed a maximum shrinkage rate (−0.18) at 800 °C. Kim found that the sintering temperature of GDC was decreased from 1400 °C to 1100 °C when CuO was added as a sintering aid at levels exceeding 0.25 mol%.25 Yoon's group synthesised Bi nano-doped GDC by direct sol–gel combustion, and the sintering temperature was reduced to about 1200 °C.26 The composed sintering aid containing Li, Cu and Zn for GDC was investigated by Nicollet's group.27 According to their results, the sintering temperature went down to 930 °C for Zn, Cu, and Li addition. Lithium (Li)-, bismuth (Bi)-, and copper (Cu)-based composites have already been reported in the literature to reduce the sintering temperature of solid oxide electrolytes.22,24–27 These research studies have effectively prepared highly dense oxide electrolytes with satisfactory ionic conductivity results at relatively low sintering temperatures.
However, most of the electrolytes produced from previous studies were sintered in an air atmosphere.28–32 Moreover, very few studies have illustrated the results of sintering behaviour and electrochemical performance for doping ceria-based composites sintered in an inert atmosphere.33 Co-doping the common solid oxide composites with aliovalent transition metal cations is a new approach to improve the densification properties and ionic conductivity of the resulting polycrystalline electrolytes.34 Considering the protection for the metal support in the fabrication process, the study of sintering behaviour in an inert atmosphere for doping ceria-based composites is necessary. Also, the physicochemical and electrochemical properties for multi-doped ceria-based composites were rarely reported. Synergistic effects and mutual effects between multi-doping elements still lack detailed explanations and understanding of the associated mechanism, which this study aims to address.
In this work, for the first time, we have developed a lithium–bismuth–copper co-doped GDC composite capable of sintering at 750 °C in an inert atmosphere. The sintering temperature of commercial GDC was optimised by the doping of Li, Bi, and Cu. Li, Bi, and Cu-doped GDC sintered at 750 °C for 6 h achieved 96.70% relative density. A novel preparation method instead of ball milling was designed and applied for commercial GDC. The homogeneous powders of Li, Bi, Cu-doped GDC and Li, Bi-doped GDC were successfully prepared. The effects of high ratio (10%) Li and Bi doping in commercial GDC were observed. Synergistic effects and mutual effects of Li, Bi, and Cu-doping were investigated. The physicochemical characteristics of the multi-doped GDC electrolyte were analysed using thermogravimetric analysis (TG/DTA), Raman spectroscopy, field emission scanning electron microscopy (FESEM)/energy dispersive spectroscopy (EDX), and X-ray diffraction (XRD). The sintering behaviours of the calcined powders were evaluated using thermodilatometry measurements, and the electrochemical performance of multi-doped ceria-based composite sintered pellets was studied using electrochemical impedance spectroscopy (EIS) tests.
Experimental section
Reagents
GDC powder (nanopowder, containing 20 mol% gadolinium as a dopant), lithium nitrate (LiNO3, 99.99%), copper nitrate (Cu(NO3)2·3H2O, 99.99%), bismuth nitrate (Bi(NO3)3·5H2O, 99.99%), polyvinylpyrrolidone (PVP, average mol wt 40![[thin space (1/6-em)]](https://www.rsc.org/images/entities/char_2009.gif) 000), and 2-propanol (≥99.5%) were purchased from Sigma Aldrich (Merck) and used as precursors without further purification. All the chemicals and solvents, including 2-propanol used in this study, were of analytical grade purchased from Sigma Aldrich and used without further purification.
000), and 2-propanol (≥99.5%) were purchased from Sigma Aldrich (Merck) and used as precursors without further purification. All the chemicals and solvents, including 2-propanol used in this study, were of analytical grade purchased from Sigma Aldrich and used without further purification.
Synthesis method
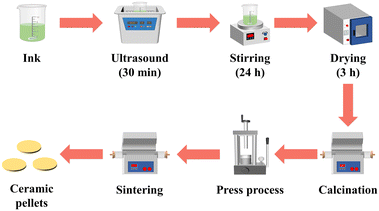
A fabrication method without ball-milling was applied to fabricate doped GDC ceramic pellets, shown in Fig. 1. The methodologies involved in preparation for low-temperature-sintered doped GDC include drying, calcination, pressing and sintering.Preparation of mixed ceramic powder
Commercial ceramic powder, nitrate and PVP were firstly dispersed in IPA to form the inks. For the Li, Bi-doped GDC (5LB), the proportions of GDC, lithium nitrate and bismuth nitrate were 90 mol%, 5 mol% and 5 mol%. For the Li, Bi, and Cu-doped GDC, the proportions of GDC, lithium nitrate, bismuth nitrate and copper nitrate were 90 mol%, 5 mol%, 5 mol% and 1 mol%. The electrolyte compositions are presented in Table 1. 3 g GDC, metal nitrates, 0.0361 g PVP and 7 mL IPA were used to prepare stable homogeneous inks via 30 min ultrasound and 24 h stirring at room temperature. The prepared ink was dried at 80 °C for 3 h to obtain ceramic powder.| Sample | Additive | Composition |
|---|---|---|
| 5LB1C | 5 mol%Li, 5 mol%Bi and 1 mol%Cu | Ce0.712Gd0.178Li0.05Bi0.05Cu0.01O1.801 |
| 5LB | 5 mol%Li, 5 mol%Bi | Ce0.76Gd0.19 Li0.03Bi0.02O1.85 |
Preparation of calcined ceramic powder
The prepared ink was dried at 80 °C for 3 h to obtain ceramic powder. The ceramic powder was calcined at 550 °C for 2 h in an air atmosphere to remove the carbon and organic components.Preparation of calcined ceramic pellets
As shown in Table 2, several button-shape disks with a thickness of 0.3–0.5 mm were fabricated by pressing a given amount of the calcined electrolyte powders (Table 1) using a manual hydraulic press (2–10 MPa pressure) with uniaxial dies (∅ = 3–15 mm). The fabricated electrolyte substrates were sintered at 750, 850 and 950 °C for 6 h under a flowing argon atmosphere in a tube furnace.| Sample | Conditions of sintering (°C) |
|---|---|
| The sintering temperature average error: ±1 °C. | |
| 5LB-1 | 950 (6 h) |
| 5LB-2 | 850 (6 h) |
| 5LB-3 | 750 (6 h) |
| 5LB1C-1 | 950 (6 h) |
| 5LB1C-2 | 850 (6 h) |
| 5LB1C-3 | 750 (6 h) |
Characterisation
Physicochemical characterisation
The crystallite information of the samples was studied using an X-ray powder diffractometer (PANalytical X'Pert3; Cu-Kα radiation, λ = 1.5406 Å, 40 kV and 30 mA) in the range 20° ≤ 2θ ≤ 90° with a scanning rate of 1.3° min−1.The morphologies of the samples were observed via a field-emission scanning electron microscope (FESEM, JEOL 7100F; 15 kV, 8 A) equipped with an EDX detector (Oxford Instruments). Before the FESEM testing, the samples were attached to aluminium stubs using conductive carbon glue (TED PELLA, INC-16035 SDS), followed by sputter coating with a 10 mm layer of gold. TGA-DSC was carried out using a TA Instruments SDT-Q600 instrument (room temperature to 1000 °C at 5 °C min−1 in atmospheric air). The synthesised samples were analysed by Raman spectroscopy in the range of 200–3000 cm−1via a Thermo DXR2 spectrometer (excitation wavelength 532 nm, 8 mm optical objective 50×). An Agilent Cary 640 FTIR spectrometer was applied to detect the infrared spectra of the samples in the range of 500–4000 cm−1 at 4 cm−1 resolution (32 scans). A push-rod vertical dilatometer (NETZSCH, DIL 402C) was also used to measure the linear shrinkage behaviour (room temperature to 1000 °C, with a heating rate of 2 °C min−1 in atmospheric air). The apparent densities of the sintered ceramic pellets were measured using a gas pycnometer (AccuPyc II – 1345, Micromeritics).
Electrochemical characterisation
A potentiostat–galvanostat electrochemical workstation (Interface 1010E, Gamry, USA) was used to characterise the electrochemical impedance spectroscopy of the sintered ceramic pellets in the frequency range from 0.1 Hz to 2 MHz, at an AC voltage amplitude of 10 mV, and at temperatures ranging from 450 °C to 750 °C in an air atmosphere.Results and discussion
Thermogravimetric analysis
Fig. 2 shows the thermogravimetric analysis (TGA-DSC) profiles of the 5LB1C and 5LB samples in air. As shown in Fig. 2(a), the complete decomposition of the 5LB1C powder takes place in three steps. The first step, starting from room temperature up to 130 °C, could be attributed to the dehydration of the sample with loss of the adsorbed water and other volatile compounds trapped in the solid polycrystalline structure, with a weight-loss of ∼3.97%. The second weight-loss quantity (∼8.25%) is observed in the range of 130–310 °C, which could be due to the thermal decomposition of the associated organic constituents of the sample and the partial decomposition of nitrate salt traces (Li, Bi, Cu).35–37 It is denoted that this step is associated with exothermic peaks appearing in the range of 130–310 °C, due to the combustion of the nitrate salts and the PVP residue. As can be seen in Fig. 2(a), extra peaks (140–160 °C) appear in the DSC curve for the 5LB1C powder, which can be explained by the decomposition of an additional phase included in this sample, i.e., the copper nitrate. This stage is followed by a more intense decrease of weight loss (∼2.67%) within the temperature range between 310 and 600 °C that could correspond to the further decomposition of the residual organic materials and continuing decomposition and oxidation of the nitrate salt traces (i.e., decomposition of Li, Bi, and Cu salts and the formation of metal oxides Li2O, Bi2O3, and CuO, respectively). The pure PVP sample shows complete decomposition between 310 and 600 °C, according to the previous literature.38–40 The weight-loss process is stopped at ∼600 °C, which corresponds to the full decomposition of lithium nitrate (500–600 °C),36 bismuth nitrate (500–550 °C)35 and copper nitrate (500–550 °C), respectively.37 A similar trend of weight-loss behaviour is observed in Fig. 2(b) for the 5LB sample, which has been synthesised by the same method. The weight loss associated with the first step (20–160 °C) was ∼5.63% for this sample., while it experienced ∼6.67% of weight loss in the second step (at 160 to 310 °C), which likewise could be due to the thermal decomposition of sample's organic components (Li and Bi nitrates). In the next decomposition step (310 and 600 °C), a weight loss of 4.04% was observed. The total weight loss associated with the individual 5LB1C and 5LB samples was ∼14.89% and ∼16.34%, respectively. The TGA result was used to determine the calcination temperature of the electrolyte composite powders that was selected to be 550 °C in order to minimise the effects of the decomposition of nitrate salts and organic components.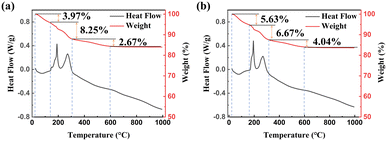 | ||
| Fig. 2 TGA-DSC profiles of (a) 5LB1C powder without calcination and (b) 5LB powder without calcination. | ||
Thermal expansion analysis
The linear shrinkage behaviour of the calcined powders was studied in the range from room temperature to 1200 °C. Fig. 3 shows the linear sintering shrinkage and the sintering rate of calcined powder, respectively. The calcined 5LB1C powder and calcined 5LB powder started to shrink at ∼550 °C and ∼500 °C, respectively. Both the GDC-based composites showed a single-step densification behaviour with the maximum shrinkage rate at 710 °C and 700 °C, according to the shrinkage rate curves. The linear shrinkage profile in Fig. 3(a) shows that there was a small shrinking peak from 800 °C to 1100 °C after the main shrinking peak (550–800 °C). This could be due to the tiny evaporation of Li, Bi and Cu species from the polycrystalline solid composite.41–46Fig. 3(b) shows a similar small shrinking peak from 800 °C to 1080 °C that could be similarly associated with the evaporation of Li and Bi species. A decrease in the shrinkage rate exhibited at ∼1080 °C for the calcined 5LB sample could also be due to the increased rate of evaporation for Li and Bi at the elevated temperatures.47 Also, at the end of the shrinkage process for the calcined 5LB1C sample, an obvious drop is observed (∼1100 °C). The larger drop in the shrinkage rate curve from 1100 °C to 1200 °C for the calcined 5LB1C powder could be explained by the more substantial evaporation effect of Cu beyond 1050 °C compared with Li and Bi.27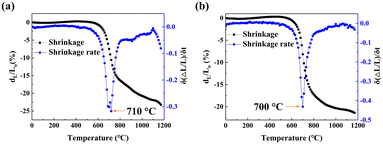 | ||
| Fig. 3 The linear shrinkage and the shrinkage rate of calcined 5LB1C powder (a) and calcined 5LB powder (b). | ||
The results showed that multi-element substitution has a synergistic impact on Ce sites. As shown in Fig. 3, adding balanced loading fractions of Li and Bi (i.e., at 5 mol%) can significantly decrease the maximum shrinkage rate of the resulting GDC composite to 700 °C, with the zero-shrinkage rate being reached at ∼1080 °C. The addition of copper (sample 5LB), however, slightly increased the maximum shrinkage rate of 5LB1C to 710 °C, with a zero-shrinkage rate obtained at ∼1100 °C. Therefore, the temperature range selected for sintering the electrolyte composite powders was set from 750 °C to 900 °C based on the dilatometer shrinkage analysis results. It is also evident that increasing the Li and Bi doping ratio can decrease the sintering temperature and improve the densification behaviour of the resulting electrolytes, which is in good agreement with the results obtained in the literature.47
Structural characteristics
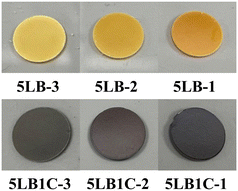
The prepared ceramic pellets are shown in Fig. 4. As can be seen, the colour of both samples became darker by increasing the sintering temperature. The change of colour in the samples could be due to the change of constituents. Increasing the sintering temperature enhances the evaporation rate of the compositional elements such as Li, Bi and Cu (please see the XRD elemental analysis below). The typical colours of Li2O and Bi2O3 samples are white and yellow, respectively. Therefore the change of colour in the 5LB sample could be attributed to the decrease of Li at the surface, which corresponds to the results of XPS characterisation. The standard colours of Cu and CuO are red-orange and black, respectively. Considering the colour change of the 5LB1C samples, this could be due to the decrease of Li and Cu and the increase of CuO at the surface of the samples, which is in accordance with the XPS characterisation results.The XRD patterns of the sintered ceramic pellets are presented in Fig. 5. The crystal structure of GDC is calcium fluoride (CaF2), with the space group Fm![[3 with combining macron]](https://www.rsc.org/images/entities/char_0033_0304.gif) m (no. 225). According to the reference card (ICDD data, reference code: 01-075-0162), the standard XRD patterns illustrated the presence of the (111), (200), (220), (311), (222), (400) and (331) planes of the face-centred cubic (FCC) fluorite type structure.48 As can be seen, all the sintered ceramic pellets showed good purity, and the peaks obtained fitted well onto the reference card. In addition, the profile indicated the formation of a single crystalline phase with a cubic fluorite structure (like that of pure CeO2), with no heterogeneous or non-soluble secondary phases in the electrolyte polycrystalline structure. The absence of the additional or shifted peaks in the XRD patterns can confirm obtaining a GDC electrolyte composite with excellent structural homogeneity with no (or insignificant) impurities. According to Fig. 5(a), the commercial GDC powder showed broad peaks, which could be due to its smaller particle size (nano-size grains).49 The lower crystallinity of the commercial GDC powder with broader peaks indicated smaller crystal sizes.
m (no. 225). According to the reference card (ICDD data, reference code: 01-075-0162), the standard XRD patterns illustrated the presence of the (111), (200), (220), (311), (222), (400) and (331) planes of the face-centred cubic (FCC) fluorite type structure.48 As can be seen, all the sintered ceramic pellets showed good purity, and the peaks obtained fitted well onto the reference card. In addition, the profile indicated the formation of a single crystalline phase with a cubic fluorite structure (like that of pure CeO2), with no heterogeneous or non-soluble secondary phases in the electrolyte polycrystalline structure. The absence of the additional or shifted peaks in the XRD patterns can confirm obtaining a GDC electrolyte composite with excellent structural homogeneity with no (or insignificant) impurities. According to Fig. 5(a), the commercial GDC powder showed broad peaks, which could be due to its smaller particle size (nano-size grains).49 The lower crystallinity of the commercial GDC powder with broader peaks indicated smaller crystal sizes.
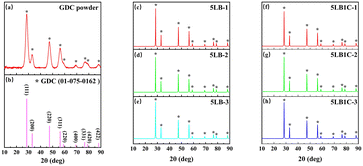 | ||
| Fig. 5 XRD patterns of the standard GDC reference card (a), commercial GDC powder (b), 5LB-1 (c), 5LB-2 (d), 5LB-3 (e), 5LB1C-1 (f), 5LB1C-2 (g) and 5LB1C-3 (h). | ||
Table S1† lists the doped GDC samples' lattice constants estimated using Bragg's equation (eqn (S1)†). Compared with pure GDC, all doped GDC samples showed distortions. Single Bi-doped GDC showed decreased lattice parameters with the promotion of the doping ratio.26 The decrease in the lattice parameters with the promotion of the doping ratio also happened in single Li-doped GDC samples.50 For the 5LB samples, increasing the sintering temperature leads to a decrease in the lattice parameter. This can be explained by applying a higher sintering temperature, which could result in more Li ions and Bi ions being doped into GDC rather than remaining in the grain boundary.26,50
The tertiary doping of the Ce4+ ions (0.097 nm) with the Li+ ions (0.092 nm), Bi3+ ions (0.117 nm), and Cu2+ ions (0.073 nm) in an 8-fold coordination leads to distortion, which could have different lattice parameters. The lattice parameters for 5LB1C-3, 5LB1C-2, and 5LB1C-1 were 5.430 Å, 5.431 Å and 5.423 Å. The lattice parameters of 5LB1C showed similar values at 750 °C and 850 °C. As shown in Table S1,† the samples sintered at the highest temperature (i.e., 950 °C), resulted in a lower lattice parameter, confirming that more Li ions, Bi ions and Cu ions were doped into GDC leading to the decrease of lattice parameters.26,50,51
According to the Scherrer equation (eqn (S2)†), the particle sizes of the samples were obtained, as shown in Table S1.† More literature data illustrated that higher sintering temperatures can increase the particle size of GDC.25,52 This tendency of increasing particle size matched the 5LB samples. For the 5LB samples, the particle size increased from 29.04 nm to 35.87 nm when the sintering temperature was raised from 750 °C to 950 °C. Also, the 5LB1C samples showed a continuous increase in particle size when the sintering temperature was raised from 750 °C to 950 °C.
Morphological characteristics
Fig. 6 shows the morphologies of the 5LB1C and 5LB samples at different sintering temperatures. Fig. 6(a) shows that the GDC grains are surrounded by small crystalline GDC at 750 °C for 5LB1C. Also, the dense crystalline GDC filled the gaps and pores in the grain boundaries, which meant that the densification of GDC was enhanced even at 750 °C by doping Li, Bi and Cu. According to particle size analysis (analysed using a Nano measurer), the average particle sizes of the 5LB1C-1, 5LB1C-2 and 5LB1C-3 samples were 54.69, 74.71, and 110.54 nm. The average particle sizes on the surface of the samples increased with the increase of the sintering temperature. For the 5LB samples, the average particle sizes were 53.84, 69.15, and 98.37 nm after sintering at 750 °C, 850 °C, and 950 °C. The 5LB1C samples had larger grain sizes than the 5LB samples at the same sintering temperature. This can confirm that adding copper could enhance the grain growth in the sintering process. The results are aligned with the increasing tendency of particle size as shown in the XRD results. The smaller particle sizes estimated by the Scherrer equation (eqn (S2)†) in the XRD results could be due to the errors of the peak broadening induced by stress and amorphous forms.53,54 By increasing the sintering temperature, both the 5LB1C and 5LB samples showed improved crystallinity behaviour, particularly the 5LB1C-1 sample with a more apparent crystalline morphology.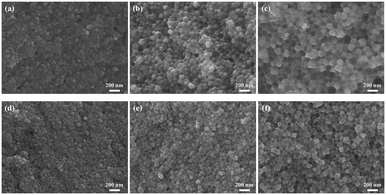 | ||
| Fig. 6 Cross-sectional SEM images of 5LB1C-3 (a), 5LB1C-2 (b), 5LB1C-1 (c), 5LB-3 (d), 5LB-2 (e), 5LB-1 (f). | ||
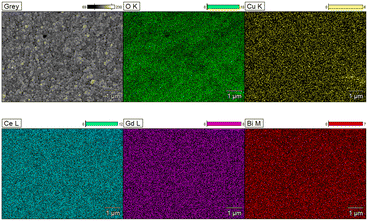
Fig. 7 presents the EDX mapping results illustrating the elemental distribution at the cross-section of the 5LB1C-1 sample. As can be seen, the Bi and Cu elements are uniformly distributed into the GDC crystalline structure, which can cross-confirm the XRD analysis results. Also, a good dispersion of the Gd element is observed after the doping of Li, Bi and Cu in the resulting electrolyte composite. There were no aggregations of Li, Bi, Cu or Gd.
Table 3 shows the ratio of the elements for the 5LB1C and 5LB samples excluding Li. The Au in the samples was sourced from the Au layer by sputter coating. The carbon was mainly from the surrounding contamination. The little amount of carbon detected could come from the carbonisation of IPA and PVP. It could be seen that the ratio of Bi was kept in similar values in the 5LB1C samples when the sintering temperature increased. In the commercial powder, the proportion of Ce and Gd should be 4![[thin space (1/6-em)]](https://www.rsc.org/images/entities/char_2009.gif) :
:![[thin space (1/6-em)]](https://www.rsc.org/images/entities/char_2009.gif) 1. As can be seen, the proportions of Ce and Gd in the 5LB1C and 5LB samples are similar to those of the commercial GDC powder.
1. As can be seen, the proportions of Ce and Gd in the 5LB1C and 5LB samples are similar to those of the commercial GDC powder.
| Samples | C-K | O-K | Cu-K | Ce-L | Gd-L | Au-M | Bi-M |
|---|---|---|---|---|---|---|---|
| 5LB1C-3 | 3.8 ± 0.2 | 27.9 ± 0.3 | 0.8 ± 0.5 | 42.2 ± 0.4 | 12.7 ± 0.6 | 10.3 ± 0.1 | 2.3 ± 0.1 |
| 5LB1C-2 | 2.1 ± 0.1 | 36.0 ± 0.3 | 0.5 ± 0.4 | 41.4 ± 0.4 | 11.9 ± 0.5 | 5.8 ± 0.1 | 2.3 ± 0.1 |
| 5LB1C-1 | 2.8 ± 0.1 | 49.3 ± 0.4 | 0.4 ± 0.3 | 31.5 ± 0.3 | 9.3 ± 0.4 | 4.6 ± 0.1 | 2.2 ± 0.1 |
| 5LB-3 | 2.7 ± 0.1 | 30.7 ± 0.4 | 0 ± 0 | 42.2 ± 0.4 | 12.4 ± 0.6 | 9.6 ± 0.1 | 2.5 ± 0.1 |
| 5LB-2 | 2.3 ± 0.1 | 30.6 ± 0.3 | 0 ± 0 | 43.5 ± 0.4 | 12.7 ± 0.6 | 8.7 ± 0.1 | 2.2 ± 0.1 |
| 5LB-1 | 2.7 ± 0.2 | 28.1 ± 0.5 | 0 ± 0 | 44.9 ± 0.4 | 12.8 ± 0.6 | 9.3 ± 0.1 | 2.2 ± 0.1 |
Relative density
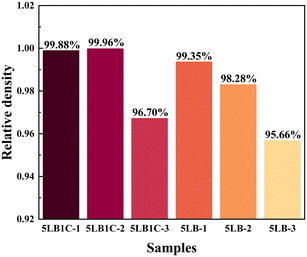
The densities, theoretical densities, and relative densities of the sintered pellets are shown in Fig. 8. The 5LB1C samples show 99.88%, 99.96% and 96.70% relative density at 950, 850 and 750 °C. The 5LB samples show 99.35%, 98.28% and 95.66% relative density at 950, 850 and 750 °C. The 5LB1C samples obtained the highest relative density at 850 °C, and the 5LB samples obtained the highest relative density at 950 °C. Both the 5LB1C and 5LB samples achieved full density (>95%) at 750 °C. It is also evident that the 5LB1C samples comparably achieved a higher relative density than the 5LB samples. This indicates that the addition of copper can potentially accelerate the process of densification at the same temperature.Elemental and composition analysis
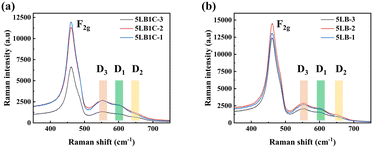
The influence of Li, Bi-doping, and Li, Bi, Cu-doping on the GDC structure and the creation of new defective sites were studied by Raman spectroscopy analysis (Fig. 9). Referring to this figure, the multiple peaks around two areas of 400–500 and 500–700 cm−1 correspond to bulk ceria vibrational modes and surface defects. The most obvious sharp peak is observed at about 460 cm−1 which corresponds to the F2g mode of the fluorite phase in all spectra.55,56 This is a common characteristic of the fluorite lattice structure typical of ceria-based oxides.57–59 The 5LB1C-3 sample shows a relatively weaker F2g peak compared to that of 5LB1C-2 and 5LB1C-1, indicating a lower level of crystallinity obtained with this sample during sintering at 750 °C.In a shifting and broadening range from 500 to 700 cm−1, new defect-induced bands can be identified. The signal at ∼550 cm−1 is assigned to defect spaces formed by extrinsic oxygen vacancies.60 The extrinsic oxygen vacancies usually appear with the presence of Ce3+ or other aliovalent cations.61,62 This vibrational feature has been labelled “D3” in Fig. 9. Another signal referred to as “D1” could be observed at ∼600 cm−1, which is attributed to the Frenkel defects, in which an oxygen atom has moved into an octahedral interstitial position generating a vacancy.63,64 This signal can also be related to the defect spaces including a dopant cation without any O2− vacancy.65,66 A relatively weaker peak was detected between 630 and 650 cm−1, labelled “D2”, which can be formed due to the extrinsic defect band, generated by the dopant addition.56 The extrinsic defects are believed to be linked to the presence of MO8 units without oxygen vacancies, where M is a foreign positive ion in its structure.56,67
For the 5LB1C and 5LB samples, it could be seen that the strengths of the D1, D2, and D3 peaks have increased with increasing sintering temperature from 750 to 850 °C. This can confirm the enhanced level of oxygen vacancies and extrinsic defects in the samples after sintering.
The sintered samples were analysed further with XPS analysis to understand their oxidation states and electrical properties better (Fig. 10). As shown in Fig. 10a, the binding energies of Li 1s for pure Li and pure Li2O are 55.35 and 55.60 eV, respectively, which are in good agreement with the literature data.68,69 The peak observed at ∼55.38 eV for 5LB-3 indicates the presence of a metallic Li phase on the surface of the ceramic pellet after sintering the 5LB sample at 750 °C.70–72 This can be explained by the unique vaporisation mechanism of Li during the sintering process at a relatively low sintering temperature in an inert atmosphere (argon flow), which has been frequently reported in the preparation of ceramic materials.24,73 For the Li-doped GDC sample, the generation of the Li2O phase can also be cross-confirmed referring to its relatively higher sintering temperature (>900 °C) as shown in Fig. 3.24 In our study, all samples were sintered at inert gas, and there was no oxygen source to oxidise the Li vapour from the Li2O at the surface. The sintering temperature applied for the 5LB-3 sample was not high enough (850 °C) to trigger the thermal reduction of the doped Li2O phase into its metallic phase. In the case of the second sample (5LB2), with a sintering temperature of 850 °C, no obvious peak was observed at ∼55.38 eV. The peak at ∼55.78 eV belongs to Li–O (Li2O). The increased binding energy here can be due to the strong interaction with other cations.74,75 This implies that the metallic Li phase could be fully evaporated, leaving a small amount of Li–O (Li2O) phase remaining at the surface. Considering the increased binding energy, Li–O (Li2O) may also exist in the grain boundaries, and thus it cannot be readily evaporated due to its strong interaction at the interface. For the case with a sintering temperature of 950 °C, no Li 1s signal was detected. It is also noticeable that the Li 1s became weak and finally disappeared as the sintering temperature increased from 750 to 950 °C. This can be due to the reduced amount of the Li phase during the sintering process for the 5LB samples. For the 5LB1C samples, only one peak at ∼55.78 eV is detected with no obvious peaks observed for the 5LB1C-2 and 5LB1C-1 samples. This can be explained by the presence of copper in its structure which can boost the evaporation of Li. The tiny signals of Li detected in the 5LB1C-2 and 5LB1C-1 samples could be due to the diminutive residual Li–O (Li2O).50,76,77
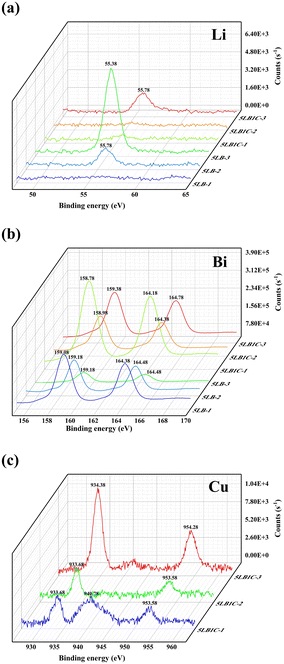 | ||
| Fig. 10 Li (a) and Bi (b) of XPS elemental spectra for 5LB1C and 5LB samples; Cu (c) of XPS elemental spectra for 5LB1C samples. | ||
Fig. 10b presents the XPS elemental spectra of Bi 4f. The binding energies of Bi 4f7/2 and Bi 4f5/2 are 157.1 and ∼162.4 eV, respectively, for the elemental Bi, and ∼159.1 and ∼164.4 eV, respectively, in the case of Bi–O in Bi2O3.78–81 Comparing these numbers with the locations of the peak observed for the 5LB1C and 5LB samples (Fig. 10b), the corresponding peaks could be attributed to Bi–O. Furthermore, the Bi 4f peaks associated with this oxide state have well-separated spin–orbit components (6 eV) detected at ∼159 eV, with the symmetrical peaks indicating the absence of a reduced metal state.26 For 5LB1C and 5LB, the positions of Bi peaks decreased with increasing sintering temperature. All samples showed clear Bi–O peaks, which evidenced the stable doping of the Bi phase at the surface of the electrolyte composites.
The XPS spectra of the samples containing Cu are shown in Fig. 10(c). The peaks with binding energies of 933 and 953 eV, respectively, are attributed to the 2p3/2 and 2p5/2 excitations of metallic Cu0, while those detected at ∼940 eV belong to Cu2+ in CuO.82–84 Referring to Fig. 10c, only the Cu0 peaks can be observed in 5LB1C-3 and 5LB1C-2, while these peaks became even weaker by increasing the sintering temperature from 750 to 850 °C. This can be explained by the promotion of the evaporation effect for the Cu-containing samples by increasing the sintering temperature. In the case of sample 5LB1C-1 sintered at 950 °C, the Cu2+ peak belongs to the CuO phase doped into the GDC crystal structure. Compared to the Li phase, the evaporation rate of Cu is slower, so the CuO phase would still be detectable after sintering the 5LB1C-1 sample at 950 °C. The absence of the Cu2+ peak in 5LB1C-2 and 5LB1C-3 could be due to the thick layer of GDC formed by evaporated Cu which can cover the surface of CuO in the composite structure.
Electrochemical impedance analysis
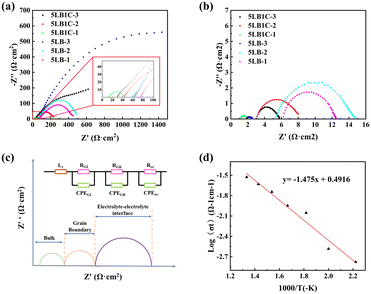
Fig. 11(a) and (b) show the electrochemical characteristics of the 5LB1C and 5LB samples. 5LB-3 showed a relatively high total ionic resistance at 450 °C, but its resistance decreased sharply at 750 °C, which could be due to the high loading fraction of Li in this sample. According to the XPS results, 5LB-3 showed also a relatively high amount of Li compared with 5LB-2 and 5LB-1 (Fig. 10). At lower sintering temperatures, Li2O may exist as Li–Gd–Ce–O precipitation phases at the grain boundary region. The ionic radii with approximately similar ionic sizes for Li, Gd, and Ce (i.e., 0.092, 0.1053, and 0.097 nm, respectively) could result in the doping of Li+ into CeO2 or Gd2O3 with the formation of negative charges as and
and  . Both of these negative charges could potentially neutralise the positive charges in the grain boundary core (e.g., by substituting the excess oxygen vacancies), hence decreasing the overall conductivity of the resulting solid state electrolyte.85
Compared with 5LB-3, the grain boundary resistance significantly decreases in the Li, Bi and Cu-doped GDC electrolytes in 5LB1C-1, indicating an improvement in the electrochemical properties. Through a naked-eye inspection of the Nyquist plots shown in Fig. 11, it can be seen that the 5LB1C-1 sample provides the highest total conductivity. This indicates that the total resistance of the electrolyte composite could be reduced by adding copper when it is sintered at 950 °C. The addition of Cu could also contribute to increasing the defects in the GDC backbone and hence help to improve the overall conductivity of the resulting electrolyte composite.25
The 5LB1C-1 Nyquist plots were modelled using an equivalent electrical circuit to fit the impedance data. The Nyquist plots and their associated fitted models for 5LB1C-1 at 450–750 °C are presented in Fig. S1 (see the ESI†). The applied equivalent circuit was composed of three-sub circuits in series, each including a resistor (R) and constant phase elements (CPE) connected in parallel as shown in Fig. 11c. In the equivalent circuit, L1 is the apparent inductor; RGI stands for the resistance of the grain bulk/interior; RGB is the resistance of the grain boundary; Ree is the resistance of the electrolyte–electrode interface (current collector). In general, the three contributions cannot always be distinguished during the experiments due to the relaxation characteristics of the various materials and the measured operating temperatures.
Table 4 summarises the corresponding resistance and electrical conductivity values calculated by fitting the equivalent circuit impedance data. The EIS curve fitting results showed that the RGI and RGB could be obtained directly. The electrical conductivity equation (eqn (S4), in the ESI†) was used to quantify the electrical conductivity of the samples. Based on the Arrhenius conductivity model (eqn (S5)†), the least squares curve fitting method was applied to obtain the total conductivity vs. operating temperature, as shown in Fig. 11(d).
| Temperature (°C) | R GI (Ω cm2) | σ GI (S cm−1) | R GB (Ω cm2) | σ GB (S cm−1) | σ t (S cm−1) |
|---|---|---|---|---|---|
| 450 | 22.35 | 1.70 × 10⁻³ | 17.14 | 2.21 × 10⁻³ | 1.66 × 10⁻³ |
| 550 | 6.40 | 5.93 × 10⁻³ | 1.08 | 3.51 × 10⁻² | 8.80 × 10⁻³ |
| 650 | 2.93 | 1.29 × 10⁻² | 0.73 | 5.21 × 10⁻² | 1.79 × 10⁻² |
| 750 | 1.81 | 2.09 × 10⁻² | 0.41 | 9.24 × 10⁻² | 2.96 × 10⁻² |
As shown in Table 4, the total ionic conductivity values increased with increasing operating temperature, which is consistent with the polycrystalline solid electrolytes' temperature-dependent conductivity behaviour.86 The ionic transport inside the lattice is usually correlated with the bulk conductivity values.23 The value of the grain-boundary conductivity indicates the effect of microstructural characteristics on the ionic transport in the electrolyte.87 For 5LB1C-1, the presence of bulk and grain boundary curves is hard to identify by the naked eye, but the entire cell resistance could still be calculated from the high-frequency range of the Nyquist plot. At low temperatures (below 550 °C), a significant decrease in overall conductivity is apparent. It can be found that the bulk conductivity and grain-boundary conductivity for 5LB1C-1 are promoted with increasing temperature. The total conductivity values of pure GDC sintered at 950 °C were 1.31 × 10⁻⁴ (450 °C), 8.68 × 10⁻⁴ (550 °C), 2.67 × 10⁻³ (650 °C), and 6.49 × 10⁻³ (750 °C).47 Compared with pure GDC, 5LB1C-1 showed an obvious promotion in total conductivity.
Fig. 11(d) shows the Arrhenius plot of the 5LB1C-1 sample, where the straight lines are the least squares fits of the total conductivity data with the linearized form of the Arrhenius equation (eqn (S5)†). For the curve, data were collected from the 5LB1C pellets sintered at 950 °C for 6 h. The bulk and the grain-boundary conductivity dominate the total conductivity in all temperature range. Results obtained from equivalent circuits show a quasi-linear dependence on temperature. This is because the existence of the grain boundary arc in the intermediate frequency area of the Nyquist plot causes the conduction mechanism to change for all samples at a transition temperature of 450 °C. According to the slope and Arrhenius equation (eqn (S5)†), the activation energy is calculated. The activation energy is the energy which is essential to begin the reaction and thus determines the overall reaction state.88 The maximum electrical conductivity obtained for the 5LB1C-1 sample was 2.96 × 10⁻² at 750 °C with an activation energy of 0.13 eV. The activation energy of pure GDC sintered at 950 °C was 0.83 eV.47 The high activation energy could be due to the additional grain boundary resistance, which has been reported in other ceria-based materials.89,90 Considering the low total conductivities of pure GDC (sintered at 950 °C), the results of activation energies fit well with the values of total conductivity. Compared with pure GDC (sintered at 950 °C), it showed a considerable improvement in activation energy for 5LB1C-1.
Conclusions
A multi-doped ceria-based electrolyte composite with a sintering temperature as low as 750 °C was successfully prepared in this work. The preparation method was based on adding controlled amounts of Li, Bi, and Cu dopants to modify the electrical and sintering properties of the commercial GDC solid-oxide electrolytes. The physicochemical and electrochemical characteristics of the resulting co-doped GDC electrolyte were systematically analysed. The impact of copper as an addition to co-doped GDC electrolytes was explored, and the influences of sintering temperature on ionic conductivity were reported. After sintering, the surface analysis of ceramic pellets for doping elements was investigated. The modified Li–Bi–Cu-doped GDC electrolyte sintered at 750 °C for 6 h achieved 96.70% relative density, which is one of the lowest sintering temperatures reported for the modified GDC composite. The maximum electrical conductivity obtained for the Ce0.712Gd0.178Li0.05Bi0.05Cu0.01O1.801 sample (sintered at 950 °C for 6 h) was 29.6 mS cm−1 at 750 °C with an activation energy of 0.13 eV. The results of this study help understand better the properties of co-doped electrolyte materials for the fabrication of more efficient steam electrolysers for environmentally friendly hydrogen generation.Author contributions
Yuheng Liu: methodology, investigation, data curation, formal analysis, visualisation, writing – original draft. Ming Xu: investigation, formal analysis. Yunlong Zhao: supervision, writing – review & editing. Bahman Amini Horri: conceptualisation, investigation, methodology, project administration, resources, supervision, writing – review & editing.Conflicts of interest
There are no conflicts to declare.Acknowledgements
This work was supported by the China Scholarship Council (CSC) scholarship, the Department of Chemical and Process Engineering (CPE) at the University of Surrey, and the Advanced Technology Institute (ATI) at the University of Surrey. The authors also thank Ben Gibbons, Thomas Chamberlain and El-Hassan, Yusuf (all of CPE) for their technical and experimental support.Notes and references
- A. Hauch, R. Kungas, P. Blennow, A. B. Hansen, J. B. Hansen, B. V. Mathiesen and M. B. Mogensen, Science, 2020, 370, 6513 CrossRef PubMed.
- M. M. Nejadian, P. Ahmadi and E. Houshfar, Fuel, 2023, 336, 126835 CrossRef.
- M. Fallah Vostakola, H. Ozcan, R. S. El-Emam and B. Amini Horri, Energies, 2023, 16, 3327 CrossRef CAS.
- Y. Zheng, J. Wang, B. Yu, W. Zhang, J. Chen, J. Qiao and J. Zhang, Chem. Soc. Rev., 2017, 46, 1427–1463 RSC.
- J. T. S. Irvine, D. Neagu, M. C. Verbraeken, C. Chatzichristodoulou, C. Graves and M. B. Mogensen, Nat. Energy, 2016, 1, 15014 CrossRef CAS.
- X. Tong, S. Ovtar, K. Brodersen, P. V. Hendriksen and M. Chen, J. Power Sources, 2020, 451, 227742 CrossRef CAS.
- A. Hauch, S. H. Jensen, S. Ramousse and M. Mogensen, J. Electrochem. Soc., 2006, 153, A1741 CrossRef CAS.
- A. Hauch, K. Brodersen, M. Chen, C. Graves, S. H. Jensen, P. S. Jørgensen, P. V. Hendriksen, M. B. Mogensen, S. Ovtar and X. Sun, ECS Trans., 2017, 75, 3 CrossRef CAS.
- J. Schefold, A. Brisse and H. Poepke, Int. J. Hydrogen Energy, 2017, 42, 13415–13426 CrossRef CAS.
- M. Fallah Vostakola and B. Amini Horri, Energies, 2021, 14, 1280 CrossRef.
- H. Kurokawa, G. Y. Lau, C. P. Jacobson, L. C. De Jonghe and S. J. Visco, J. Mater. Process. Technol., 2007, 182, 469–476 CrossRef CAS.
- D. Sarantaridis, R. Chater and A. Atkinson, J. Electrochem. Soc., 2008, 155, B467 CrossRef CAS.
- Y. Zheng, Z. Chen and J. Zhang, Electrochem. Energy Rev., 2021, 4, 508–517 CrossRef CAS.
- M. Ni, M. Leung and D. Leung, Int. J. Hydrogen Energy, 2008, 33, 2337–2354 CrossRef CAS.
- K. Neuhaus, R. Dolle and H.-D. Wiemhöfer, J. Electrochem. Soc., 2018, 165, F533 CrossRef CAS.
- X. D. Zhou, W. Huebner, I. Kosacki and H. U. Anderson, J. Am. Ceram. Soc., 2002, 85, 1757–1762 CrossRef CAS.
- M. Choolaei, E. Jakubczyk and B. Amini Horri, Electrochim. Acta, 2023, 445, 142057 CrossRef CAS.
- D. J. Young, High temperature oxidation and corrosion of metals, Elsevier, 2008 Search PubMed.
- K. Lu, N. J. Manjooran, R.-i. Murakam and G. Pickrell, Advances in Synthesis, Processing, and Applications of Nanostructures, John Wiley & Sons, 2012 Search PubMed.
- V. Esposito, S. P. V. Foghmoes and S. Ramousse, J. Eur. Ceram. Soc., 2014, 34, 2371–2379 CrossRef.
- C. Herring, J. Appl. Phys., 1950, 21, 301–303 CrossRef CAS.
- J. Nicholas and L. Dejonghe, Solid State Ionics, 2007, 178, 1187–1194 CrossRef CAS.
- N. Ghaemi, R. C. T. Slade and B. Amini Horri, Ceram. Int., 2021, 47, 20009–20018 CrossRef CAS.
- T. Zhu, Y. Lin, Z. Yang, D. Su, S. Ma, M. Han and F. Chen, J. Power Sources, 2014, 261, 255–263 CrossRef CAS.
- H.-J. Choi, Y.-H. Na, M. Kwak, T. W. Kim, D.-W. Seo, S.-K. Woo and S.-D. Kim, Ceram. Int., 2017, 43, 13653–13660 CrossRef CAS.
- G. Accardo, D. Frattini, H. C. Ham, J. H. Han and S. P. Yoon, Ceram. Int., 2018, 44, 3800–3809 CrossRef CAS.
- C. Nicollet, J. Waxin, T. Dupeyron, A. Flura, J.-M. Heintz, J. P. Ouweltjes, P. Piccardo, A. Rougier, J.-C. Grenier and J.-M. Bassat, J. Power Sources, 2017, 372, 157–165 CrossRef CAS.
- A. Azzolini, J. Downs and V. M. Sglavo, J. Eur. Ceram. Soc., 2015, 35, 2119–2127 CrossRef CAS.
- J. P. F. Grilo, D. A. Macedo, R. M. Nascimento and F. M. B. Marques, Electrochim. Acta, 2019, 318, 977–988 CrossRef CAS.
- H.-C. Lee, J.-A. Lee, J.-H. Lee, Y.-W. Heo and J.-J. Kim, Ceram. Int., 2017, 43, 11792–11798 CrossRef CAS.
- L. Spiridigliozzi, G. Dell'Agli, G. Accardo, S. P. Yoon and D. Frattini, Ceram. Int., 2019, 45, 4570–4580 CrossRef CAS.
- G. Accardo, G. Dell'Agli, L. Spiridigliozzi, S. P. Yoon and D. Frattini, Int. J. Hydrogen Energy, 2020, 45, 19707–19719 CrossRef CAS.
- A. Alemayehu, M. Biesuz, K. Y. Javan, A. Tkach, P. M. Vilarinho, V. M. Sglavo and V. Tyrpekl, J. Eur. Ceram. Soc., 2023, 4837–4843 CrossRef CAS.
- J. Li, Q. Cai and B. A. Horri, Chem. – Eur. J., 2023, e202300021 CrossRef CAS PubMed.
- I. Van Driessche, R. Mouton and S. Hoste, Mater. Res. Bull., 1996, 31, 979–992 CrossRef CAS.
- M. L. Ruiz, I. D. Lick, M. I. Ponzi, E. R. Castellón, A. Jiménez-López and E. N. Ponzi, Thermochim. Acta, 2010, 499, 21–26 CrossRef CAS.
- A. Kumar, E. Wolf and A. Mukasyan, AIChE J., 2011, 57, 3473–3479 CrossRef CAS.
- Y. K. Du, P. Yang, Z. G. Mou, N. P. Hua and L. Jiang, J. Appl. Polym. Sci., 2006, 99, 23–26 CrossRef CAS.
- I. Savva, A. S. Kalogirou, M. Achilleos, E. Vasile, P. A. Koutentis and T. Krasia-Christoforou, Molecules, 2016, 21, 1218 CrossRef PubMed.
- K. Zhu, G. Wang, S. Zhang, Y. Du, Y. Lu, R. Na, Y. Mu and Y. Zhang, RSC Adv., 2017, 7, 30564–30572 RSC.
- J.-A. Lee, Y.-E. Lee, H.-C. Lee, Y.-W. Heo, J.-H. Lee and J.-J. Kim, Ceram. Int., 2016, 42, 11170–11176 CrossRef CAS.
- Z. Yang, Y. Yang, Y. Chen, Y. Liu, T. Zhu, M. Han and F. Chen, J. Power Sources, 2015, 297, 271–275 CrossRef CAS.
- A. A. Solovyev, I. V. Ionov, V. A. Semenov, A. V. Shipilova and S. V. Rabotkin, J. Phys.: Conf. Ser., 2019, 1393, 012140 CrossRef CAS.
- A. Sanson, P. Mangifesta, E. Roncari, S. Fiameni, S. Barison and M. Fabrizio, Proceedings 8th European Fuel Cell Forum, 2008 Search PubMed.
- V. Gil, C. Moure, P. Duran and J. Tartaj, Solid State Ionics, 2007, 178, 359–365 CrossRef CAS.
- V. Gil, J. Tartaj, C. Moure and P. Duran, J. Eur. Ceram. Soc., 2007, 27, 801–805 CrossRef CAS.
- G. Accardo, E. Audasso and S. P. Yoon, J. Alloys Compd., 2022, 898, 162880 CrossRef CAS.
- B. Arndt, H. Noei, T. F. Keller, P. Müller, V. Vonk, A. Nenning, A. K. Opitz, J. Fleig, U. Rütt and A. Stierle, Thin Solid Films, 2016, 603, 56–61 CrossRef CAS.
- M. Choolaei, Q. Cai, R. C. T. Slade and B. Amini Horri, Ceram. Int., 2018, 44, 13286–13292 CrossRef CAS.
- G. Accardo, G. S. Kim, H. C. Ham and S. P. Yoon, Int. J. Hydrogen Energy, 2019, 44, 12138–12150 CrossRef CAS.
- C. G. M. Lima, T. H. Santos, J. P. F. Grilo, R. P. S. Dutra, R. M. Nascimento, S. Rajesh, F. C. Fonseca and D. A. Macedo, Ceram. Int., 2015, 41, 4161–4168 CrossRef CAS.
- V. Gil, J. Tartaj, C. Moure and P. Duran, Ceram. Int., 2007, 33, 471–475 CrossRef CAS.
- A. W. Burton, K. Ong, T. Rea and I. Y. Chan, Microporous Mesoporous Mater., 2009, 117, 75–90 CrossRef CAS.
- J. S. J. Hargreaves, Catal., Struct. React., 2016, 2, 33–37 CAS.
- S. Agarwal, X. Zhu, E. Hensen, L. Lefferts and B. Mojet, J. Phys. Chem. C, 2014, 118, 4131–4142 CrossRef CAS.
- M. Dosa, M. Piumetti, S. Bensaid, T. Andana, C. Novara, F. Giorgis, D. Fino and N. Russo, Catal. Lett., 2018, 148, 298–311 CrossRef CAS.
- C. Andriopoulou, A. Trimpalis, K. C. Petallidou, A. Sgoura, A. M. Efstathiou and S. Boghosian, J. Phys. Chem. C, 2017, 121, 7931–7943 CrossRef CAS.
- S. Chen, L. Li, W. Hu, X. Huang, Q. Li, Y. Xu, Y. Zuo and G. Li, ACS Appl. Mater. Interfaces, 2015, 7, 22999–23007 CrossRef CAS PubMed.
- Z.-Y. Pu, X.-S. Liu, A.-P. Jia, Y.-L. Xie, J.-Q. Lu and M.-F. Luo, J. Phys. Chem. C, 2008, 112, 15045–15051 CrossRef CAS.
- S. Acharya, V. Gaikwad, V. Sathe and S. Kulkarni, Appl. Phys. Lett., 2014, 104, 113508 CrossRef.
- S. Acharya, V. Gaikwad, S. D'Souza and S. Barman, Solid State Ionics, 2014, 260, 21–29 CrossRef CAS.
- T. Vinodkumar, B. G. Rao and B. M. Reddy, Catal. Today, 2015, 253, 57–64 CrossRef CAS.
- Y. Lee, G. He, A. J. Akey, R. Si, M. Flytzani-Stephanopoulos and I. P. Herman, J. Am. Chem. Soc., 2011, 133, 12952–12955 CrossRef CAS PubMed.
- Z. Wu, M. Li, J. Howe, H. M. Meyer III and S. H. Overbury, Langmuir, 2010, 26, 16595–16606 CrossRef CAS PubMed.
- T. Taniguchi, T. Watanabe, N. Sugiyama, A. Subramani, H. Wagata, N. Matsushita and M. Yoshimura, J. Phys. Chem. C, 2009, 113, 19789–19793 CrossRef CAS.
- A. Nakajima, A. Yoshihara and M. Ishigame, Phys. Rev. B: Condens. Matter Mater. Phys., 1994, 50, 13297 CrossRef CAS PubMed.
- L. Li, F. Chen, J.-Q. Lu and M.-F. Luo, J. Phys. Chem. A, 2011, 115, 7972–7977 CrossRef CAS PubMed.
- J. Contour, A. Salesse, M. Froment, M. Garreau, J. Thevenin and D. Warin, J. Microsc. Spectrosc. Electron., 1979, 4, 483–491 CAS.
- M. Shek, J. Hrbek, T. Sham and G.-Q. Xu, Surf. Sci., 1990, 234, 324–334 CrossRef CAS.
- S. Oswald, Appl. Surf. Sci., 2015, 351, 492–503 CrossRef CAS.
- S. Xia, X. Zhang, C. Liang, Y. Yu and W. Liu, Energy Stor. Mater., 2020, 24, 329–335 Search PubMed.
- K. Rana, G. Kucukayan-Dogu, H. S. Sen, C. Boothroyd, O. Gulseren and E. Bengu, J. Phys. Chem. C, 2012, 116, 11364–11369 CrossRef CAS.
- K. Waetzig, A. Rost, U. Langklotz, B. Matthey and J. Schilm, J. Eur. Ceram. Soc., 2016, 36, 1995–2001 CrossRef CAS.
- T. Šalkus, E. Kazakevičius, A. Kežionis, V. Kazlauskienė, J. Miškinis, A. Dindune, Z. Kanepe, J. Ronis, M. Dudek, M. Bućko, J. R. Dygas, W. Bogusz and A. F. Orliukas, Ionics, 2010, 16, 631–637 CrossRef.
- J. Cao, L. Li and Z. Gui, J. Mater. Chem., 2001, 11, 1198–1200 RSC.
- H. M. Wang, M. C. Simmonds and J. M. Rodenburg, Mater. Chem. Phys., 2003, 77, 802–807 CrossRef CAS.
- Q.-H. Wu, A. Thißen and W. Jaegermann, Surf. Sci., 2005, 578, 203–212 CrossRef CAS.
- V. S. Dharmadhikari, S. Sainkar, S. Badrinarayan and A. Goswami, J. Electron Spectrosc. Relat. Phenom., 1982, 25, 181–189 CrossRef CAS.
- P. Ding, Y. Du and Z. Xu, Chem. Res. Chin. Univ., 2004, 20, 717–721 Search PubMed.
- W. E. Morgan, W. J. Stec and J. R. Van Wazer, Inorg. Chem., 1973, 12, 953–955 CrossRef CAS.
- S.-P. Photoemission, Springer Series in Solid-State Sciences, 1995, vol. 82 Search PubMed.
- G. V. Bazuev, A. P. Tyutyunnik, M. V. Kuznetsov and R. P. Samigullina, Eur. J. Inorg. Chem., 2016, 2016, 5340–5346 CrossRef CAS.
- A. Losev, K. Rostov and G. Tyuliev, Surf. Sci., 1989, 213, 564–579 CrossRef CAS.
- M. Al-Kuhaili, Vacuum, 2008, 82, 623–629 CrossRef CAS.
- X. Guo and R. Waser, Prog. Mater. Sci., 2006, 51, 151–210 CrossRef CAS.
- J. Fergus, R. Hui, X. Li, D. P. Wilkinson and J. Zhang, Solid oxide fuel cells: materials properties and performance, CRC press, 2016 Search PubMed.
- V. T. D. S., P. R. Padala and R. U. A., RSC Adv., 2015, 5, 88675–88685 RSC.
- X. Zhang, L. Wang, M. Espinoza, T. Li and M. Andersson, Int. J. Energy Res., 2021, 45, 12980–12995 CrossRef CAS.
- D. Ding, B. Liu, M. Gong, X. Liu and C. Xia, Electrochim. Acta, 2010, 55, 4529–4535 CrossRef CAS.
- C. Tian and S.-W. Chan, Solid State Ionics, 2000, 134, 89–102 CrossRef CAS.
Footnote |
| † Electronic supplementary information (ESI) available. See DOI: https://doi.org/10.1039/d3me00011g |
| This journal is © The Royal Society of Chemistry 2023 |

