Newly synthesized 6-substituted piperazine/phenyl-9-cyclopentyl containing purine nucleobase analogs act as potent anticancer agents and induce apoptosis via inhibiting Src in hepatocellular carcinoma cells†
Ebru
Bilget Guven‡
 ab,
Irem
Durmaz Sahin‡
cd,
Duygu
Altiparmak
a,
Burak
Servili
 e,
Sebnem
Essiz
 be,
Rengul
Cetin-Atalay
fg and
Meral
Tuncbilek
*a
aDepartment of Pharmaceutical Chemistry, Faculty of Pharmacy, Ankara University, 06560, Yenimahalle, Ankara, Turkey. E-mail: tuncbile@pharmacy.ankara.edu.tr
bDepartment of Molecular Biology and Genetics, Faculty of Engineering and Natural Sciences, Kadir Has University, 34083, Cibali-Fatih, Istanbul, Turkey
cDepartment of Molecular Biology and Genetics, Faculty of Science, Bilkent University, 06800, Bilkent, Ankara, Turkey
dSchool of Medicine, Koc University, 34450, Sarıyer, İstanbul, Turkey
eGraduate School of Science and Engineering, Bioinformatics and Genetics Program, Kadir Has University, Fatih 34083, Istanbul, Turkey
fCancer System Biology Laboratory, CanSyL, Graduate School of Informatics, Middle East Technical University, 06800, Ankara, Turkey
gSection of Pulmonary and Critical Care Medicine, The University of Chicago, Chicago, IL 60637, USA
First published on 10th November 2023
Abstract
Newly synthesized 6-substituted piperazine/phenyl-9-cyclopentyl-containing purine nucleobase analogs were tested for their in vitro anticancer activity against human cancer cells. Compounds 15, 17–24, 49, and 56 with IC50 values less than 10 μM were selected for further examination on an enlarged panel of liver cancer cell lines. Experiments revealed that compound 19 utilizes its high cytotoxic potential (IC50 < 5 μM) to induce apoptosis in vitro. Compound 19 displayed a KINOMEscan selectivity score S35 of 0.02 and S10 of 0.01 and demonstrated a significant selectivity against anaplastic lymphoma kinase (ALK) and Bruton's tyrosine kinase (BTK) over other kinases. Compounds 19, 21, 22, 23, and 56 complexed with ALK, BTK, and (discoidin domain-containing receptor 2) DDR2 were analyzed structurally for binding site interactions and binding affinities via molecular docking and molecular dynamics simulations. Compounds 19 and 56 displayed similar interactions with the activation loop of the kinases, while only compound 19 reached toward the multiple subsites of the active site. Cell cycle and signaling pathway analyses exhibited that compound 19 decreases phosho-Src, phospho-Rb, cyclin E, and cdk2 levels in liver cancer cells, eventually inducing apoptosis.
1. Introduction
Cancer cells are mostly known for their unlimited cell proliferation potential and owe this competence to the intricate adaptation of the metabolic pathways in which they are involved. All these rearrangements eventually aim to increase not only the energy but also the synthesis of fundamental substrates – both required for an accelerated proliferation rate.1,2 Cancer cells foster the de novo biosynthesis of purines, the building blocks of nucleic acids, as a precisely reasonable strategy to prosper and spread; therefore, purine analogs offer a formidable pharmacological strategy as an anticancer agent.3,4Despite their toxicities, purine analogs are resourceful therapeutic agents, emphasizing that their selectivity should be improved.3 Purine analogs are structurally alike and share a straightforward mechanism of action that eventually induces apoptosis.5 Interestingly, these antimetabolites display a distinguished difference in their biochemical activities and therefore have an expansive potential to constitute a class of therapeutic agents against various diseases.5,6 Even one atom change in the structure of purine analogs can result in a very different clinical activity, as seen in the two FDA-approved drugs, clofarabine and cladribine.5,7
Hepatocellular carcinoma (HCC) is the dominant type of primary liver cancer which is known to be the third leading cause of cancer death worldwide in 2020 and found to be the cancer type with the second-lowest survival rate (18%) for all stages combined.8,9 Heterogeneity of the HCC mainly depends on rearranged metabolic pathways, which can offer strategies in drug discovery if it is known how these intricately modified pathways give rise to HCC tumor growth.10 Although there are FDA-approved tyrosine kinase inhibitors as first- and second-line treatment options for advanced HCC patients, they all have limited effects on the survival rates of the patients.11 Purine metabolism, which has been recently shown to foster HCC tumor development, is unfortunately not known evidently, but it is already appreciated that purine analogs are promising antimetabolites to suppress HCC tumor growth.12
The proto-oncogene, c-Src, is a tyrosine kinase that plays a pivotal role in the signal transduction pathways controlling cancer cell growth and proliferation. Increased c-Src kinase activity is a common phenomenon demonstrated in various human tumors.13,14 c-Src kinase activation triggers the cyclin E–Cdk2 complex to propel the cells in the S-phase through hyper-phosphorylation of retinoblastoma protein, Rb, which assists the transcription factor E2F to get released from Rb and leads the cell cycle progress. Inactivation of c-Src induces apoptosis in liver cancer cells but not in primary hepatocytes. Thus, c-Src should be considered a promising target in anticancer drug discovery.15,16 Anaplastic lymphoma kinase (ALK) is a receptor tyrosine kinase that initiates a signaling pathway after receiving the extracellular signal. Depending on the mutation ALK contains, a different signaling pathway becomes activated in tumor cells, and c-Src is one of the possible downstream effectors of ALK.17 Bruton's tyrosine kinase (BTK) is also known to function as an upstream activator of c-Src and, moreover, is determined to be in interaction with ALK.18,19
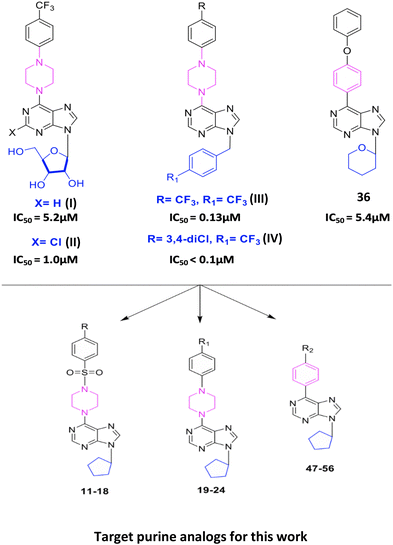
In our previous studies, we have reported important cytotoxic activities of 9-(β-D-ribofuranosyl//4-trifluoromethylbenzyl/4-chlorobenzyl//tetrahydropyran)-6-(4-trifluoromethyl phenylpiperazine/4-phenoxyphenyl)purine analogs (I), (II), (III), (IV), and 36 (Fig. 1).20–23 In the present work, we report the synthesis of new derivatives of purines (I), (II), (III), (IV), and 36 as 9-cyclopentyl-purines (11–24 and 47–56) and evaluate their cytotoxic effects against human epithelial cancer cells: liver (Huh7), colon (HCT116), and breast (MCF7) (Tables 2 and 3). With the potent analogs 15, (17–24), (49), and (56), further screening was done against hepatocellular carcinoma (HCC) cell lines Huh7, Hep3B, HepG2, PLC, Mahlavu, FOCUS, Snu475, Snu182, Snu387, Snu398, Snu423, and Snu449 (Table 4). This analysis sheds light on the pathway leading liver cancer cells to apoptosis. Moreover, the possible protein kinase inhibition potential of these newly synthesized purine analogs has been investigated, and it was shown that these compounds might be promising intracellular kinase inhibitors. In order to identify any existing direct interaction with the human kinome, KINOMEscan™ profiling was applied. It is a high-throughput approach based on active site-directed competition binding of the sample to be tested and a selected human kinase list. The KINOMEscan™ analysis evidently demonstrates that among the novel purine analogs, compound 19 selectively interacts with ALK and BTK, while compound 56 interacts with DDR2 (discoidin domain-containing receptor 2). These compounds are examined for binding affinity scores to target kinases by two different molecular docking softwares. The docking poses are further tested with 10 nanosecond molecular dynamics simulations. Molecular interactions of compounds 19 and 56 in the binding site display distinct contacts with the activation loop of the kinases. We have also demonstrated that c-Src inactivation plays a central role in inducing apoptosis for the cancer cells treated with these newly synthesized purine analogs.
2. Results and discussion
The synthesis of 6-(4-substituted phenyl sulfonyl piperazine)-9-cyclopentyl purine analogs (11–18) was performed starting from 6-chloropurin (1). The nucleophilic substitution of 1 to cyclopentyl bromide afforded the intermediate purine (2) under basic conditions.24 Treatment of the piperazine structure with (4-substituted phenyl)sulfonyl chlorides in CH2Cl2 gave the corresponding sulfonylated piperazine derivatives (3–10). Compounds 11–18 were obtained by amination of chlorine of (2) with the synthesized piperazines (3–10) in the presence of a base.We wondered if removing the sulfonyl group on the piperazine ring could impact the compound's activity. Therefore, we synthesized 6-(4-substituted phenyl piperazine)-9-cyclopentyl purine derivatives (19–24) from compound 2. Thus, purines substituted with phenyl piperazines at position C-6 (19–24) were prepared with the nucleophilic aromatic substitution reaction of 2 with the appropriate piperazines using triethylamine in ethanol (Scheme 1).
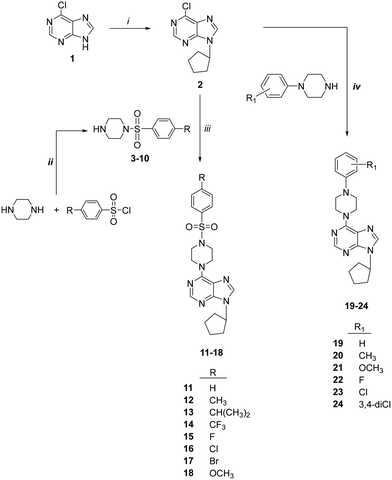 | ||
| Scheme 1 Synthesis of compounds 11–24. Reagents: (i) cyclopentyl bromide, K2CO3, DMSO; (ii) CH2Cl2; (iii) Et3N, EtOH; (iv) 4-substituted piperazines, Et3N, EtOH. | ||
The synthesis of 6-(4-substituted phenyl)-9-cyclopentyl purine analogs 47–56 from 6-chloropurine (1) was performed in four steps (Scheme 2). The N-9 position tetrahydropyran-2-yl (THP) derivative 26 was obtained by the carbocation reaction of compound 1 with 3,4-dihydro-2H-pyran using p-TSA as a catalyst. 6-(Substituted phenyl) purines, 27–36, were prepared by Suzuki coupling reaction. This coupling reaction produced compounds 27–36 from 4-substituted phenyl boronic acids in toluene catalyzed by Pd (PPh3)4. The deprotection of the THP group with Dowex 50 X8 (H+) in methanol afforded 6-(4-substituted phenyl) purine 37–46 derivatives. Finally, the target compounds 47–56 were successfully obtained via N-9 alkylation of 37–46 with cyclopentyl bromide in the presence of sodium hydride.
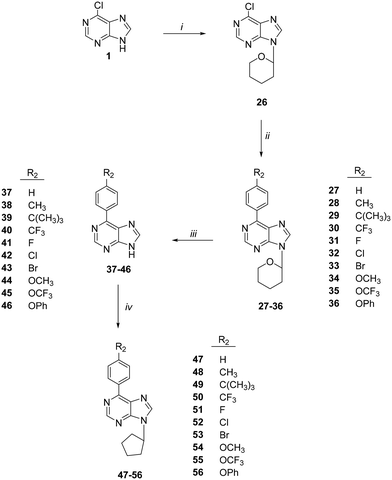 | ||
| Scheme 2 Synthesis of compounds 47–56. Reagents: (i) cyclopentyl bromide, K2CO3, DMSO; (ii) CH2Cl2; (iii) Et3N, EtOH; (iv) 4-substituted piperazines, Et3N, EtOH. | ||
The structures of all compounds were confirmed by 1H, 13C NMR mass spectral data, and elemental analysis.
The in vitro cytotoxic activities of the newly synthesized compounds (11–24) and (47–56) were initially evaluated against human liver (Huh7), colon (HCT116), and breast (MCF7) cancer cell lines using NCI-sulforhodamine B (SRB) colorimetric assay. Time-dependent IC50 values for each compound were calculated in comparison with 5-fluorouracil (5-FU), cladribine, fludarabine, and pentostatine as reference anticancer agents. The results are summarized in Tables 1–3.
| Cancer cell lines, IC50a μM | ||||
|---|---|---|---|---|
| Compound | R | Huh7 | HCT116 | MCF7 |
| a IC50 values were calculated from the cell growth inhibition curves obtained from the treatments done with increasing concentrations of each molecule (40 μM, 20 μM, 10 μM, 5 μM, and 2.5 μM) for 72 h. Experiments are done in duplicate. NI: no inhibition. | ||||
| 11 | H | 13.1 ± 5.1 | 12 ± 4.7 | 11.2 ± 3.7 |
| 12 | CH3 | 49 ± 11.3 | 196.6 ± 45.6 | 170.9 ± 39.3 |
| 13 | CH(CH3)3 | 14.7 ± 2.4 | 11.5 ± 0.9 | 17.2 ± 2.1 |
| 14 | CF3 | 12.3 ± 2.5 | 32.4 ± 9.5 | 12.7 ± 3.3 |
| 15 | F | 9 ± 2.2 | 12 ± 1.5 | 5.2 ± 1.9 |
| 16 | Cl | 34.4 ± 5.7 | 44.8 ± 9.5 | 10.5 ± 1.0 |
| 17 | Br | 8 ± 1.2 | 8.4 ± 1.5 | 6.5 ± 0.8 |
| 18 | OCH3 | 7.1 ± 2.0 | 10.4 ± 1.4 | 8.6 ± 3.5 |
| 5-FU | 30.7 ± 2.0 | 6.0 ± 0.2 | 3.5 ± 0.8 | |
| Cladribine | 1.3 ± 0.4 | <0.1 | 2 ± 2.0 | |
| Fludarabine | 29.9 ± 20.0 | 8.3 ± 3.0 | 15.2 ± 0.1 | |
| Pentostatine | NI | NI | NI | |
| Cancer cell lines, IC50a μM | ||||
|---|---|---|---|---|
| Compound | R1 | Huh7 | HCT116 | MCF7 |
| a IC50 values were calculated from the cell growth inhibition curves obtained from the treatments which were done with increasing concentrations of each molecule (40 μM, 20 μM, 10 μM, 5 μM, and 2.5 μM) for 72 h. Experiments were done in duplicate. NI: no inhibition. | ||||
| 19 | H | 1 ± 0.2 | 2.1 ± 0.3 | 0.1 ± 0.1 |
| 20 | CH3 | 1.4 ± 0.1 | 1.9 ± 0.6 | 6.4 ± 1.9 |
| 21 | OCH3 | 3.8 ± 0.1 | 5 ± 2.1 | 1 ± 0.7 |
| 22 | F | 1.6 ± 0.3 | 1.6 ± 0.5 | 9.1 ± 2.3 |
| 23 | Cl | 0.1 ± 0.1 | 0.6 ± 0.3 | 4.1 ± 1.1 |
| 24 | 3,4-DiCl | 0.04 ± 0.01 | 0.04 ± 0.03 | 0.16 ± 0.1 |
| 5-FU | 30.7 ± 2.0 | 6.0 ± 0.2 | 3.5 ± 0.8 | |
| Cladribine | 1.3 ± 0.4 | <0.1 | 2 ± 2.0 | |
| Fludarabine | 29.9 ± 20.0 | 8.3 ± 3.0 | 15.2 ± 0.1 | |
| Pentostatine | NI | NI | NI | |
| Cancer cell lines, IC50a μM | ||||
|---|---|---|---|---|
| Compound | R2 | Huh7 | HCT116 | MCF7 |
| a IC50 values were calculated from the cell growth inhibition curves obtained from the treatments which were done with increasing concentrations of each molecule (40 μM, 20 μM, 10 μM, 5 μM, and 2.5 μM) for 72 h. Experiments were done in duplicate. NI: no inhibition. | ||||
| 47 | H | 12.8 ± 3.1 | 13.9 ± 2.9 | 15.7 ± 1.2 |
| 48 | CH3 | 23.8 ± 7.2 | 22.4 ± 1.7 | 17.7 ± 3.1 |
| 49 | C(CH3)3 | 6.3 ± 1.1 | 6.6 ± 0.4 | 12.6 ± 1.1 |
| 50 | CF3 | 29.8 ± 1.9 | 6 ± 1.3 | 20.3 ± 4.2 |
| 51 | F | 6.7 ± 0.9 | 6.1 ± 0.9 | 15.6 ± 2.7 |
| 52 | Cl | 15.6 ± 3.5 | NI | NI |
| 53 | Br | 16 ± 2.1 | NI | 56.1 ± 8.2 |
| 54 | OCH3 | 10.6 ± 0.9 | 39 ± 7.4 | 19.5 ± 2.3 |
| 55 | OCF3 | 15.1 ± 1.3 | 26.3 ± 8.8 | 24 ± 1.5 |
| 56 | OPh | 1.2 ± 0.3 | 0.8 ± 0.1 | 2.8 ± 0.3 |
| 5-FU | 30.7 ± 2.0 | 6.0 ± 0.2 | 3.5 ± 0.8 | |
| Cladribine | 1.3 ± 0.4 | <0.1 | 2 ± 2.0 | |
| Fludarabine | 29.9 ± 20.0 | 8.3 ± 3.0 | 15.2 ± 0.1 | |
| Pentostatine | NI | NI | NI | |
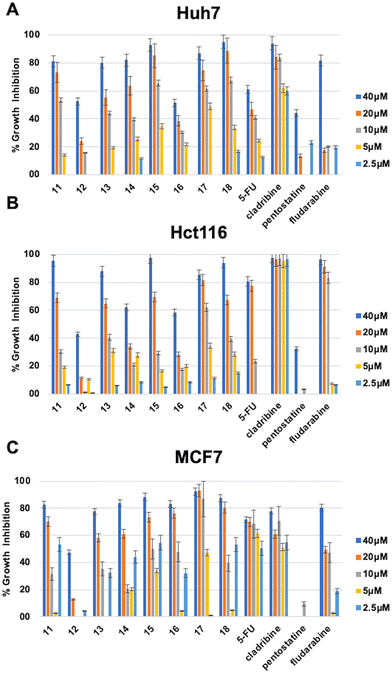
The investigation of 6-(4-substituted phenyl sulfonyl piperazine)-9-cyclopentyl purine derivatives (11–18) for their cytotoxic activities revealed that compounds bearing F (15), Br (17), and OCH3 (18), as a substitution at the phenyl ring, had IC50 values of 9 μM, 8 μM, and 7.1 μM respectively on the Huh7 cancer cell line which is much lower when compared to well-known agents 5-FU (IC50: 30.7 μM) and fludarabine (IC50: 29.9 μM). Compounds 11, 13, and 14 (with IC50 values in the range of 12.3–14.7 μM) were also more cytotoxic than 5-FU and fludarabine on Huh7 liver cancer cells. On the other hand, compound 17 (IC50: 8.4 μM), which contains 4-Br–Ph substitution, showed comparable activities with fludarabine (IC50: 8.3 μM) on the HCT116 colon cancer cell line. Compounds 15, 17, and 18 (IC50: 5.2 μM, 6.5 μM, and 8.6 μM respectively) were also more cytotoxic than fludarabine (IC50: 15.2 μM) on the MCF7 breast cancer cell line (Table 1, Fig. 2).
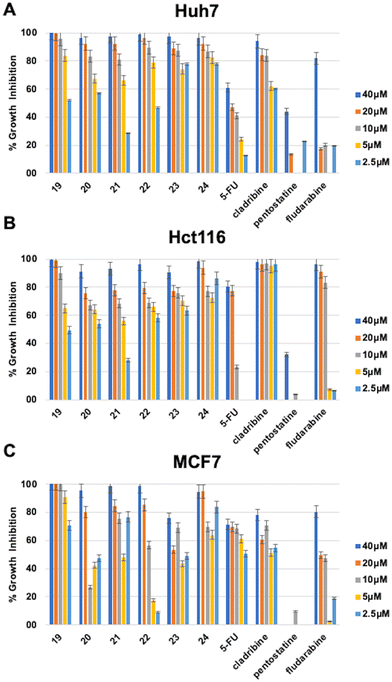
The 6-(4-substituted phenyl piperazine)-9-cyclopentyl purine analogs (19–24) bearing 4-CF3–Ph, 4-Cl–Ph, 4-(3,4-diCl)–Ph substitution at their piperazine ring (23, 24) showed high bioactivities (IC50: 0.1 μM, 0.1 μM, and 0.04 μM respectively) on the Huh7 liver cancer cell line providing highly promising results. These compounds also showed higher bioactivities than known cytotoxic agents 5-FU, cladribine, fludarabine, and pentostatine. In addition, four other compounds from this group of derivatives, 19, 20, 21, and 22, came forward with their druggable (<5 μM) IC50 values in the range of 1.0–3.8 μM. The compound with the highest cytotoxic activity in this group was compound 24 (IC50: 0.04 μM). The compounds with a non-substituted phenyl group at the piperazine ring, compound 19 (IC50: 0.1 μM) and compounds 21 (IC50: 1 μM) and 24 (IC50: 0.16 μM) showed higher cytotoxic activities than other known agents (5-FU, cladribine, fludarabine, and pentostatine) (Table 2, Fig. 3).
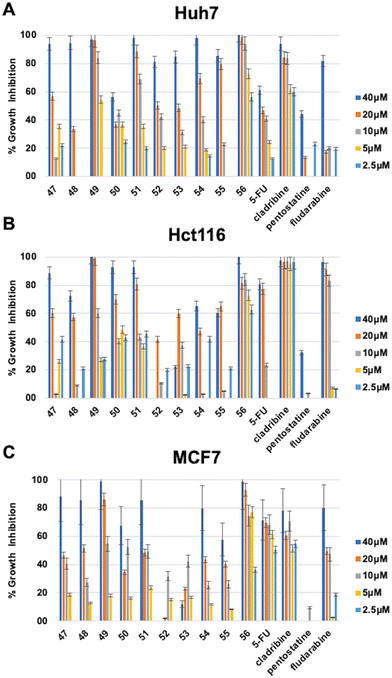
Among the 6-(4-substituted phenyl)-9-cyclopentyl purine analogs (47–56), the most active compound 56, which has a 4-OPh–Ph group at the sixth position of the purine ring, was shown to have druggable (<5 μM) IC50 values in the range of 0.8–2.8 μM against all three cancer cell lines (Huh7, HCT116, and MCF7) which makes compound 56 much more potent compared to 5-FU, fludarabine, and pentostatine. Besides, compound 49, which contains 4-C(CH3)3–Ph substitution, also displayed higher cytotoxic activity (IC50: 6.3 μM) than known anticancer agents 5-FU, fludarabine, and pentostatine (Table 3, Fig. 4).
The compounds 15, (17–24), 49, and 56 with IC50 values less than 10 μM were selected to be further examined on an enlarged panel of liver cancer cell lines that are Huh7, Hep3B, HepG2, PLC, Mahlavu, FOCUS, Snu475, Snu182, Snu387, Snu398, Snu423, and Snu449. Among the 6-(4-substituted phenyl piperazine)-9-cyclopentyl purine analogs 24 and 6-(4-substituted phenyl)-9-cyclopentyl purine analog 56 displayed remarkable cytotoxicity superior to well-known anticancer agents cladribine and fludarabine on Huh7, HepG2, and Hep3B cell lines. On the other hand, among the same group, compounds 19, 22, 24, 49, and 56 had significantly better cytotoxicities compared to cladribine and fludarabine on the PLC cell line. Compounds 19, 24, and 56 showed high cytotoxic activities on Mahlavu, FOCUS, and Snu475 cell lines as well (Table 4).
| HCC cell line, IC50a μM | ||||||
|---|---|---|---|---|---|---|
| Compound | Huh7 | Hep3B | HepG2 | PLC | Mahlavu | FOCUS |
| 15 | 9 ± 1.3 | 6.1 ± 2.5 | 4.8 ± 1.9 | 15.4 ± 5.7 | 11.4 ± 2.5 | 12.6 ± 3.5 |
| 17 | 9.1 ± 1.7 | 4.3 ± 1.0 | 6.3 ± 0.2 | 9.2 ± 1.1 | 20.5 ± 3.2 | 15.9 ± 5.1 |
| 18 | 17 ± 0.8 | 71.8 ± 14.8 | 2.7 ± 0.4 | 84.6 ± 31.1 | 9 ± 1.2 | 10.1 ± 2.7 |
| 19 | 3 ± 0.4 | <0.1 | 2.4 ± 1.5 | 4 ± 0.5 | 0.2 ± 0.1 | 0.6 ± 0.3 |
| 20 | 2.9 ± 0.4 | 3.1 ± 0.7 | 0.9 ± 0.5 | 20.7 ± 2.3 | 4.2 ± 1.3 | 5 ± 1.1 |
| 21 | 1.3 ± 1.3 | 0.3 ± 0.1 | 0.3 ± 0.1 | 9.3 ± 1.4 | 0.6 ± 1.2 | 2.6 ± 1.4 |
| 22 | 1.5 ± 0.1 | 4.3 ± 0.2 | 0.5 ± 0.2 | 6 ± 1.8 | 7 ± 0.1 | 1.5 ± 0.7 |
| 23 | 1.7 ± 0.9 | 0.4 ± 0.2 | 0.01 ± 0.01 | 19.3 ± 3.5 | 4 ± 2.0 | 2 ± 0.3 |
| 24 | 0.4 ± 0.2 | 0.03 ± 0.01 | 0.02 ± 0.01 | 7 ± 2.7 | 0.1 ± 0.1 | 0.5 ± 0.3 |
| 49 | 8.1 ± 2.3 | 6.7 ± 1.7 | 2.7 ± 0.2 | 3.4 ± 0.4 | 4 ± 0.4 | 2 ± 0.6 |
| 56 | 0.7 ± 0.2 | 0.1 ± 0.1 | 0.002 ± 0.001 | 6.5 ± 0.9 | 0.1 ± 0.01 | 0.5 ± 0.2 |
| Cladribine | 0.6 ± 0.2 | 0.1 ± 0.1 | 0.4 ± 0.1 | 9.1 ± 1.6 | <0.1 | <0.1 |
| Fludarabine | 24.4 ± 5.4 | 27.8 ± 3.3 | 17 ± 1.8 | 41.7 ± 5.3 | 14.2 ± 0.9 | 13.7 ± 1.6 |
| HCC cell line, IC50a μM | ||||||
|---|---|---|---|---|---|---|
| Compound | Snu475 | Snu182 | Snu387 | Snu398 | Snu423 | Snu449 |
| a IC50 values were calculated from the cell growth inhibition curves obtained from the treatments, which were done with increasing concentrations of each molecule (40 μM, 20 μM, 10 μM, 5 μM, and 2.5 μM) for 72 h. Experiments were done in triplicate. NI: no inhibition. | ||||||
| 15 | 21.6 ± 4.4 | 47.9 ± 7.3 | 11.1 ± 2.5 | 8 ± 1.7 | 9.5 ± 2.2 | 16.3 ± 5.5 |
| 17 | 9 ± 2.7 | 60.6 ± 9.4 | 15.9 ± 2.1 | 4 ± 0.9 | 10.5 ± 2.1 | 8.5 ± 2.1 |
| 18 | 57.5 ± 13.1 | NI | 15.8 ± 1.7 | 6.9 ± 2.2 | 6.8 ± 0.9 | 20 ± 3.9 |
| 19 | 5.8 ± 1.1 | 6 ± 1.5 | 13 ± 1.8 | 1.2 ± 0.1 | 11 ± 1.7 | 2 ± 0.3 |
| 20 | 17.7 ± 3.8 | 61 ± 10.4 | 88 ± 13.2 | 1.9 ± 0.5 | 17.5 ± 2.3 | 17 ± 2.7 |
| 21 | 13 ± 0.4 | 13 ± 3.9 | 38 ± 12.7 | 0.3 ± 0.1 | 15 ± 3.3 | 2 ± 0.9 |
| 22 | 7 ± 1.2 | 41 ± 8.4 | 26 ± 7.4 | 1 ± 0.4 | 16 ± 1.5 | 3.3 ± 1.1 |
| 23 | 12.3 ± 3.4 | 12.2 ± 1.3 | 2 ± 0.9 | 1.8 ± 1.0 | 4 ± 0.5 | 6.9 ± 2.1 |
| 24 | 2.5 ± 1.1 | 65 ± 10.3 | 20 ± 3.7 | 0.2 ± 0.1 | 9.9 ± 0.7 | <0.1 |
| 49 | 12.3 ± 2.5 | 12.2 ± 1.4 | 2 ± 0.5 | 1.8 ± 0.2 | 4 ± 1.2 | 6.9 ± 0.7 |
| 56 | 2.5 ± 0.8 | 65 ± 10.4 | 20 ± 3.7 | 0.2 ± 0.1 | 9.9 ± 0.9 | <0.1 |
| Cladribine | 2.5 ± 1.1 | 23.3 ± 7.2 | 7.1 ± 2.9 | <0.1 | 6.7 ± 1.1 | 37.3 ± 8.2 |
| Fludarabine | 41.5 ± 4.3 | 37.2 ± 2.1 | 33.8 ± 8.6 | 0.2 ± 0.1 | 32.6 ± 4.6 | 25.1 ± 4.7 |
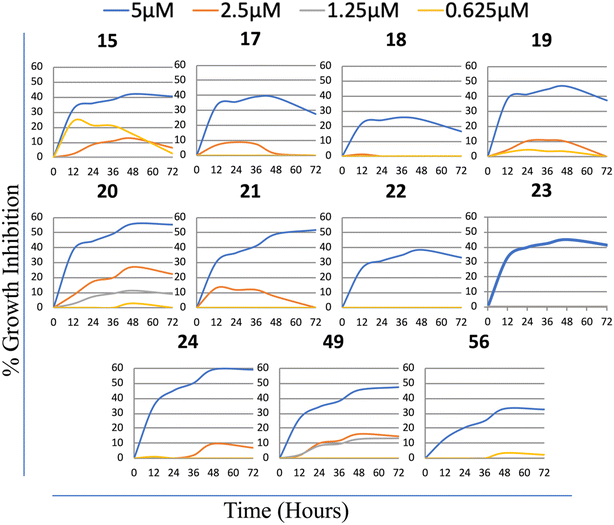
Consequently, these results suggested that cytotoxic activity increases remarkably when a directly substituted phenyl group replaces the phenyl sulfonyl substitution to the 4th position of the piperazine ring. Among all the synthesized molecules, the most active group corresponds to the group with substituted phenyl piperazine (19–24). Moreover, the most active compounds accommodated electrons attracting 4-CF3, Cl, and 3,4-diCl substitutes in the phenyl ring. Finally, 4-OPh in the compounds with direct phenyl substitution at the 6th position of the purine ring increased cytotoxic activity. Furthermore, the bioactivities of the compounds analyzed on the enlarged panel of liver cancer cell lines, compounds 15, (17–24), 49, and 56 were further confirmed in real-time via a real-time cell electronic sensing (RT-CES) system (Fig. 5). The results obtained confirmed that five of the derivatives in this group, compounds 19, 21, 22, 23, and 56, have promising cytotoxic potential against liver cancer cells; therefore, these newly synthesized purine analogs were selected to be further investigated for their mechanism of action on cancer cells.
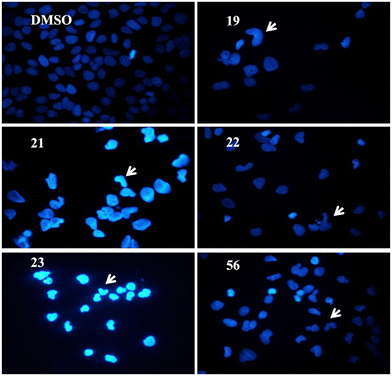
Human liver cancer cells were treated with 5 μM of the selected compounds 19, 21, 22, 23, and 56 for 72 h. Hoechst-dye-stained cells' nuclei were observed under a fluorescence microscope. As seen in Fig. 6, the cell morphologies of the treated cells compared to DMSO-negative controls were distinctive. Treatment with the compounds resulted in condensed nuclei with a horseshoe-like structure indicating apoptotic induction.
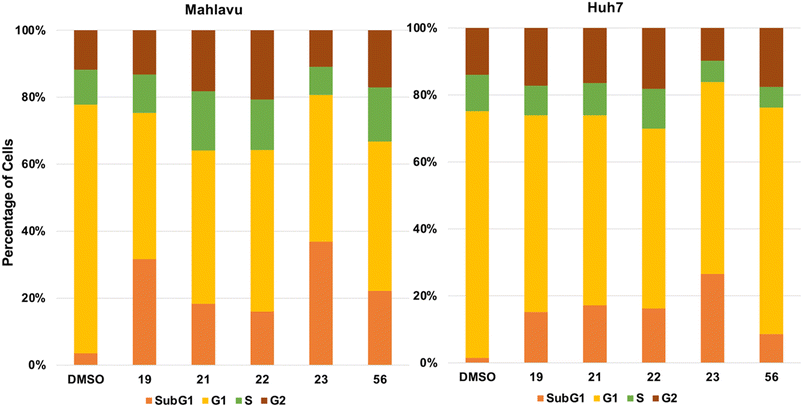
Cell cycle analysis was performed to elucidate further the effect of compounds 19, 21, 22, 23, and 56 on the liver cancer cells. Huh7 and Mahlavu liver cancer cells were treated with 5 μM of the compounds. The DNA content of the cells was stained with propidium iodide (PI) and analyzed through a flow cytometer. Analysis of the results suggested a significant increase in the SubG1 phase of the cells treated with the research compounds. These results also suggest the induction of apoptosis in the presence of selected compounds (Fig. 7).
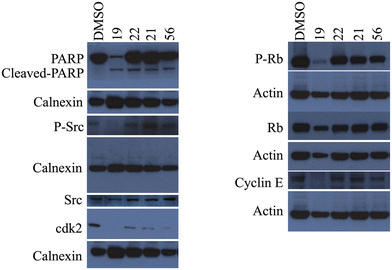
Considering that the results of the cell cycle analysis support the previous observation of the morphological changes, which suggested the induction of apoptosis in cancer cells treated with compounds 19, 21, 22, 23, and 56, we first investigated the cleavage of the apoptosis marker poly ADP-ribosyl polymerase PARP-1 protein with western blot analysis. Huh7 liver cancer cells were treated with 5 μM of these selected compounds for 72 h and then analyzed with western blot to characterize the cell death type. The obtained large apoptotic fragment (89 kDa) pointed out that all four compounds induced PARP-1 cleavage, confirming the induction of the programmed cell death mechanism in liver cancer cells (Fig. 8).
The literature showed that a group of novel purine derivatives could inhibit c-Src kinase.25 Therefore, the activity levels of c-Src kinases were first investigated to find the mechanism of action of our novel nucleobase and nucleoside analogs. For this purpose, Huh7 cells were treated with 5 μM of the six compounds for 72 h and then analyzed with western blot using specific antibodies for c-Src kinase and its active phosphorylated form. Our data demonstrated that treatment with compounds 19 and 23 resulted in a significant decrease in the levels of phospho-Src, meaning that these purine analogs inhibit the activation of Src protein (Fig. 8). Moreover, the downstream elements of the Src pathway were also investigated.26 We observed that compound 19 decreased the expression of the phospho-Rb levels, which means that the Rb protein is activated in these samples. Likewise, the expression levels of cyclin E and cdk2 were also decreased in cancer cells treated with compound 19 compared to its corresponding DMSO control (Fig. 8).
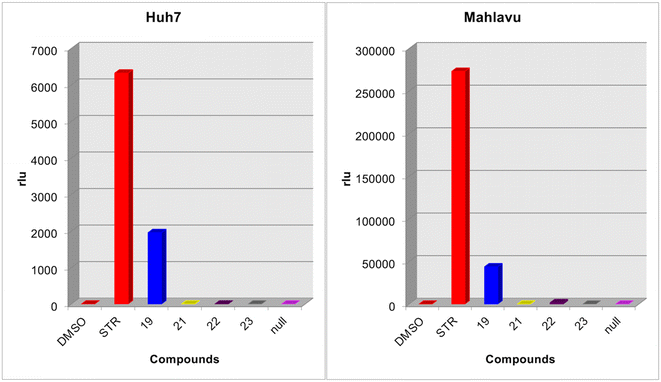
The newly synthesized nucleobase and nucleoside analogs were suspected of having kinase inhibitory activity based on similar previous findings in the literature. Therefore, we performed a kinase assay with these molecules. Human liver cancer (Huh7 and Mahlavu) cells were treated with 5 μM of these compounds for 72 h. Afterward, the effect of the compounds on ATP levels was detected using the Lonza Kinase Glo Plus luminescence kit. Multikinase inhibitor staurospourine was used as the positive control of the assay.
Results revealed that all the compounds except 19 did not affect the intracellular ATP levels indicating that they do not have any kinase inhibitory effects (Fig. 9). However, compound 19 showed a considerable increase in luminescence, indicating high ATP levels, which indirectly may suggest that compound 19 might be inhibiting intracellular kinases.
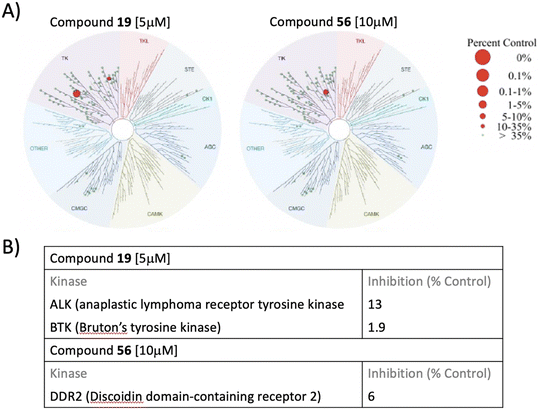
The reasonable suspicion for compound 19 to be a putative kinase inhibitor stimulated us to figure out any possible direct interaction of the newly synthesized purine analogs with the human kinome. KINOMEscan™ profiling, a high-throughput approach based on active site-directed competition binding of the sample to be tested and the selected list of human kinases, was preferred to investigate any direct interaction, if existing, of compound 19 with the human kinome. KINOMEscan™ profiling service reported that the 6-(4-substituted phenyl piperazine)-9-cyclopentyl purine analog, compound 19, interacted with anaplastic lymphoma kinase (ALK) and Bruton's tyrosine kinase (BTK) while compound 56 interacts with DDR2 (discoidin domain-containing receptor 2). Selectivity scores S35 of 0.02 and S10 of 0.01 were reported for compound 19, while the selectivity scores S35 of 0.01 and S10 of 0.01 were reported for compound 56 (Fig. 10).
The results obtained from KINOMEscan™ were further explored with in silico techniques to understand the structural interactions of the test compounds with suggested kinases. Mainly, test compounds 19, 21, 22, 23, and 56 were docked to ALK, BTK, and DDR2 together with the reference molecules, cladribine, fludarabine, 5-FU, pentostatin, and STR. The binding affinities are displayed in Table 5, together with the PDB codes used for the target kinases which are 5P9J,275FTO,28 and 7AYM.29 The docking poses from AutoDock Vina were cross-checked with the results of SwissDock. Docked poses generated by AutoDock Vina were all in agreement with the poses generated by SwissDock, and one representative result, the docking poses of compound 19 from SwissDock and AutoDock Vina with BTK, ALK, and DDR2, is displayed in Fig. S1.† In the Table S1,† the binding affinity scores from SwissDock is also displayed along with AutoDock Vina scores. This cross-checking step is essential in demonstrating the accuracy of the molecular docking results.
Considering the binding energy values given in Table 5, all the test compounds, 19 to 56, give better binding energies than the reference molecules, which are known to be non-kinase inhibitors. This agrees with the results of KINOMEscan™. Namely, the purine analogs filtered and selected through multiple steps in this study are effective inhibitor candidates for BTK, ALK, and DDR2 proteins. The affinities of the best-docked compounds ranged between −7.4 kcal mol−1 and −10.3 kcal mol−1 (Table 5). One other significant result observed in Table 5, our purine analog molecules all displayed similar or better binding energies than STR, a well-known, broad-spectrum kinase inhibitor.30,31
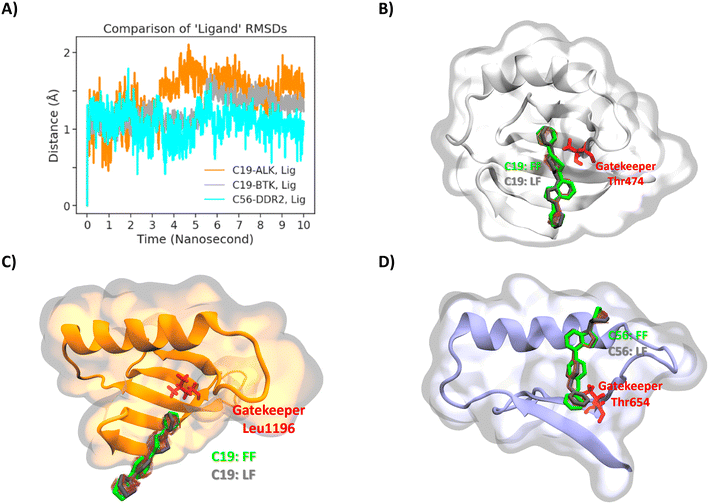
Although compounds 19 and 56 displayed good binding affinities in general, to understand the structural features and interactions of the target molecules, we studied the compounds' binding poses. Before studying the binding pockets and its interactions, one final step has been taken for ensuring the binding poses obtained from the molecular docking step. Namely 10 ns solvated molecular dynamics simulations were carried with compound 19 docked at BTK, compound 19 docked at ALK, and compound 56 docked at DDR2. Fig. 11A displays all-atom RMSD values of the compounds in the binding pocket. RMSD values are all around 1.5 to 2 Ångstroms while the RMSD of compound 56 in DDR2 stayed even as low as 1 Ångstrom. Furthermore the change in the binding poses at the end of simulation is compared with the initial poses visually in Fig. 11B–D. As it is clear from the figure (initial pose shown in green and final pose in gray), the docking pose remained very similar to the initial position. After ensuring the binding pose with two different docking softwares and all-atom MD simulations, the poses obtained are analyzed further.
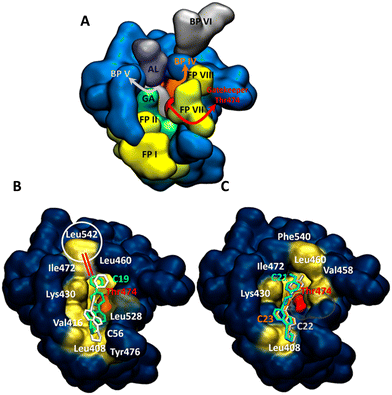
Since the kinase inhibitors are thoroughly studied and well categorized according to how they access different regions of the binding site, the known structural features of kinase binding sites should be summarized before going into the details of the binding site interactions.32 The binding pockets of kinases are divided into the front cleft, back cleft, and gate area, which has a gatekeeper region regulating substrate access to the active site of the kinase (different regions are displayed with different colors in Fig. 12A). For instance, Type I½ inhibitors, such as lapatinib and lenvatinib, can pass the gatekeeper and access the back pocket of kinases, while Type II inhibitors occupy the front pocket and gate area but cannot reach the back pocket, such as axitinib and dabrafenib.33 A critical activation loop also moves away from the ATP-binding site and forms a beta-hairpin conformation for substrate binding.32
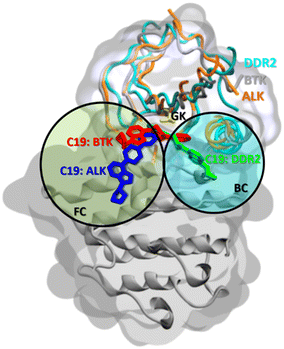
The compounds in this study all targeted three main subsites on BTK, the front and back cleft, as well as the gate area around the ATP-binding site. This makes them like Type I½ inhibitors (Fig. 12B and C). However, the main difference between compounds 21, 22, and 23 (Fig. 12C) and compounds 19 and 56 (Fig. 12B) is around a hydrophobic interaction with an amino acid of the activation loop (Leu542). Table S1† summarizes the important interactions between the target molecules and the kinase-binding site residues. Although compounds 21, 22, and 23 reached the back pocket of the BTK active site, no interaction with the activation loop was observed (Fig. 12C). Only compounds 19 and 56 interacted with this loop (Fig. 12B), mainly resulting in a possible lock-down of the activation loop to move away from the ATP-binding site. This is an important site where a conformational change in the activation loop leads to the formation of a β-hairpin for substrate binding in a functioning state of the enzyme.32,34
When ALK and DDR2 interactions are considered, compounds 19, 21, 22, 23, and 56 compounds were docked on the main front pocket of the ALK and DDR2 active sites. Again, in Fig. 13, the pose of compound 19 was displayed with three different target kinases superimposed. In ALK, the molecule reached the front pocket and gate area but could not reach the back pocket, and in DDR2, it entered from the back pocket and the gate area. Only in BTK it extended over the front and back pockets, and the gatekeeper residue L1196. Again, compound 19 displayed the most extended blockage in the binding site; thus, observing the best inhibition results with compound 19 in the previous sections is rational.
3. Experimental
3.1 Chemistry
Melting points were recorded with a capillary melting point apparatus (Electrothermal 9100) and were uncorrected. NMR spectra were recorded on a VARIAN Mercury 400 FT-NMR spectrometer (400 for 1H, 100.6 MHz for 13C). TMS was used as an internal standard for the 1H and 13C NMR spectra; δ values are given in ppm and J values are in Hz. Mass spectra were taken on a Waters Micromass ZQ by using the (ESI+) method. Elemental analyses (C, H, N) were determined on a Leco CHNS 932 instrument and values within ±0.4% of the theoretical values were obtained. Column chromatography was accomplished on silica gel 60 (0.040–0.063 mm particle size). The chemical reagents used in synthesis were purchased from E. Merck, Fluka, Sigma, and Aldrich. Compounds 3–10,35–3826, 27, 29–33,2334,3936, 37,2338,4039–43,2344,39 and 46 (ref. 23) were prepared according to the literature methods.![[thin space (1/6-em)]](https://www.rsc.org/images/entities/char_2009.gif) :
:![[thin space (1/6-em)]](https://www.rsc.org/images/entities/char_2009.gif) 1).
1).
6-[4-(Phenyl sulfonyl)piperazine-1-yl]-9-cyclopentyl-9H-purine (11). Yield 61.9%; mp 152–155 °C. 1H NMR (CDCl3) δ 1.74–2.00 (m, 6H), 2.20–2.32 (m, 2H), 3.16 (t, 4H), 4.45 (br s, 4H), 4.88–4.98 (m, 1H), 7.52 (t, 2H), 7.58 (t, 1H), 7.75 (s, 1H), 7.78 (d, 2H), 8.32 (s, 1H). 13C NMR (CDCl3) δ 23.77, 32.67, 44.36, 46.18, 55.74, 120.23, 127.77, 129.13, 132.99, 135.36, 136.82, 151.11, 151.94, 153.35. MS (ESI+) m/z: 413.2 (100%) (M + H)+. Anal. calcd for C20H24N6O2S·0.3CH3COOC2H5·0.01H2O: C, 58.01; H, 6.02; N, 19.15; S, 7.29. Found C, 58.46; H, 6.07; N, 18.77; S, 7.22.
6-[4-(4-Methylphenylsulfonyl)piperazine-1-yl]-9-cyclopentyl-9H-purine (12). Yield 75.5%; mp 181–183 °C. 1H NMR (CDCl3) δ 1.74–2.0 (m, 6H), 2.20–2.31 (m, 2H), 2.39 (s, 3H), 3.13 (t, 4H), 4.43 (br s, 4H), 4.87–4.98 (m, 1H), 7.30 (d, 2H, Jo = 8 Hz), 7.64 (d, 2H, Jo = 8.4 Hz), 7.77 (s, 1H), 8.31 (s, 1H). 13C NMR (CDCl3) δ 21.50, 23.78, 32.69, 44.57, 46.18, 55.85, 120.14, 127.83, 129.75, 132.27, 136.94, 143.91, 150.88, 151.51, 152.88. MS (ESI+) m/z: 427.1 (100%) (M + H)+. Anal. calcd for C21H26N6O2S: C, 59.13; H, 6.14; N, 19.70; S, 7.52. Found C, 59.12; H, 6.33; N, 19.36; S, 7.56.
6-[4-(4-Isopropylphenylsulfonyl)piperazine-1-yl]-9-cyclopentyl-9H-purine (13). Yield 76.6%; mp 165–168 °C. 1H NMR (CDCl3) δ 1.24 (d, 3H), 1.29 (d, 3H), 1.72–1.98 (m, 6H), 2.20–2.31 (m, 2H), 2.90–3.03 (m, 1H), 3.07–3.20 (t, 5H), 4.44 (br s, 4H), 4.87–4.96 (m, 1H), 7.35 (d, 2H, Jo = 8 Hz), 7.67 (d, 2H, Jo = 8.4 Hz), 7.78 (s, 1H), 8.32 (s, 1H). 13C NMR (CDCl3) δ 23.57, 23.60, 23.76, 32.65, 34.13, 44.35, 46.18, 55.72, 120.21, 127.19, 127.96, 132.63, 136.77, 151.11, 151.95, 153.36, 154.47. MS (ESI+) m/z: 455.3 (100%) (M + H)+. Anal. calcd for C23H30N6O2S: C, 60.77; H, 6.65; N, 18.49; S, 7.05. Found C, 60.68; H, 6.44; N, 18.35; S, 7.12.
6-[4-[4-(Trifluoromethyl)phenylsulfonyl]piperazine-1-yl]-9-cyclopentyl-9H-purine (14). Yield 85.6%; mp 205–208 °C. 1H NMR (CDCl3) δ 1.74–1.98 (m, 6H), 2.20–2.30 (m, 2H), 3.18 (t, 4H), 4.46 (br s, 4H), 4.88–4.96 (m, 1H), 7.79 (d, 3H), 7.89 (d, 2H, Jo = 7.6 Hz), 8.32 (s, 1H). 13C NMR (CDCl3) δ 23.77, 32.67, 44.34, 46.13, 55.77, 120.26, 123.11 (q, J = 271.2 Hz), 126.32 (q, J = 3.8 Hz), 128.23, 134.71 (q, J = 32.7 Hz), 136.92, 139.17, 151.16, 151.94, 153.27. MS (ESI+) m/z: 481.2 (100%) (M + H)+. Anal. calcd for C21H25F3N6O2S: C, 52.49; H, 4.82; N, 17.49; S, 6.67. Found C, 52.31; H, 4.53; N, 17.27; S, 6.74.
6-[4-(4-Fluorophenylsulfonyl)piperazine-1-yl]-9-cyclopentyl-9H-purine (15). Yield 96.4%; mp 154–157 °C. 1H NMR (CDCl3) δ 1.74–2.0 (m, 6H), 2.20–2.30 (m, 2H), 3.14 (t, 4H), 4.45 (br s, 4H), 4.89–4.97 (m, 1H), 7.19 (t, 2H), 7.76–7.79 (m, 3H), 8.32 (s, 1H). 13C NMR (CDCl3) δ 23.77, 32.67, 44.34, 46.15, 55.75, 116.44 (d, J = 22.5 Hz), 120.25, 130.50 (d, J = 9.6 Hz), 131.42, 136.87, 151.13, 151.95, 153.31, 165.32 (d, J = 253.9 Hz). MS (ESI+) m/z: 431.1 (100%) (M + H)+. Anal. calcd for C20H23FN6O2S: C, 55.80; H, 5.39; N, 19.52; S, 7.45. Found C, 55.84; H, 5.38; N, 19.08; S, 7.44.
6-[4-(4-Chlorophenylsulfonyl)piperazine-1-yl]-9-cyclopentyl-9H-purine (16). Yield 53.9%; mp 171–175 °C. 1H NMR (CDCl3) δ 1.75–2.0 (m, 6H), 2.20–2.32 (m, 2H), 3.15 (t, 4H), 4.46 (br s, 4H), 4.88–4.99 (m, 1H), 7.49 (d, 2H, Jo = 8.4 Hz), 7.69 (d, 2H, Jo = 8 Hz), 7.78 (s, 1H), 8.33 (s, 1H). 13C NMR (CDCl3) δ 23.77, 32.66, 44.33, 46.12, 55.75, 120.26, 129.14, 129.45, 133.92, 136.86, 139.64, 151.14, 151.93, 153.30. MS (ESI+) m/z: 447.2 (100%) (M + H)+. Anal. calcd for C20H23ClN6O2S·0.3H2O: C, 53.10; H, 5.26; N, 18.58; S, 7.09. Found C, 53.23; H, 5.25; N, 18.21; S, 7.34.
6-[4-(4-Bromophenylsulfonyl)piperazine-1-yl]-9-cyclopentyl-9H-purine (17). Yield 94.9%; mp 176–179 °C. 1H NMR (CDCl3) δ 1.74–1.99 (m, 6H), 2.20–2.31 (m, 2H), 3.14 (t, 4H), 4.45 (br s, 4H), 4.89–4.97 (m, 1H), 7.63 (q, 4H), 7.79 (s, 1H), 8.33 (s, 1H). 13C NMR (CDCl3) δ 23.77, 32.66, 44.35, 46.12, 55.75, 120.26, 128.14, 129.22, 132.44, 134.44, 136.86, 151.15, 151.94, 153.30. MS (ESI+) m/z: 491.2 (98%) (M+), 493.2 (100%) (M + 2)+. Anal. calcd for C20H23BrN6O2S·0.13C6H14: C, 49.66; H, 4.97; N, 16.72; S, 6.38. Found C, 49.43; H, 5.01; N, 16.33; S, 6.46.
6-[4-(4-Methoxyphenylsulfonyl)piperazine-1-yl]-9-cyclopentyl-9H-purine (18). Yield 91.8%; mp 137–140 °C. 1H NMR (CDCl3) δ 1.73–1.99 (m, 6H), 2.21–2.31 (m, 2H), 3.13 (t, 4H), 3.84 (s, 3H), 4.44 (br s, 4H), 4.89–4.96 (m, 1H), 6.96 (d, 2H, Jo = 8.8 Hz), 7.69 (d, 2H, Jo = 8.8 Hz), 7.78 (s, 1H), 8.32 (s, 1H). 13C NMR (CDCl3) δ 23.76, 32.66, 44.32, 46.19, 55.58, 55.72, 114.27, 120.21, 126.80, 129.91, 136.76, 151.09, 151.95, 153.34, 163.14. MS (ESI+) m/z: 443.3 (100%) (M + H)+. Anal. calcd for C21H26N6O3S: C, 57.0; H, 5.92; N, 18.99; S, 7.25. Found C, 56.77; H, 5.84; N, 18.8; S, 7.35.
![[thin space (1/6-em)]](https://www.rsc.org/images/entities/char_2009.gif) :
:![[thin space (1/6-em)]](https://www.rsc.org/images/entities/char_2009.gif) 1).
1).
6-(4-Phenylpiperazine-1-yl)-9-cyclopentyl-9H-purine (19). Yield 88%; mp 99–102 °C. 1H NMR (CDCl3) δ 1.76–2.03 (m, 6H), 2.24–2.35 (m, 2H), 3.35 (t, 4H), 4.52 (br s, 4H), 4.92–5.01 (m, 1H), 6.80–7.06 (m, 4H), 7.31 (t, 1H), 7.84 (s, 1H), 8.41 (s, 1H). 13C NMR (CDCl3) δ 23.80, 32.70, 45.04, 49.60, 55.68, 116.48, 120.22, 120.35, 129.19, 136.52, 151.06, 151.26, 152.12, 153.83. MS (ESI+) m/z: 349.4 (100%) (M + H)+. Anal. calcd for C20H24N6.0.3H2O: C, 67.88; H, 7.01; N, 23.75. Found C, 67.72; H, 7.02; N, 23.58.
6-[4-(4-Methylphenyl)piperazine-1-yl]-9-cyclopentyl-9H-purine (20). Yield 95.9%; mp 142.146 °C. 1H NMR (CDCl3) δ 1.78–2.03 (m, 6H), 2.29 (s, 1H), 2.24–2.35 (m, 2H), 3.29 (t, 4H), 4.51 (br s, 4H), 4.92–5.0 (m, 1H), 6.93 (d, 2H), 7.12 (d, 1H), 7.82 (s, 1H), 8.39 (s, 1H). 13C NMR (CDCl3) δ 20.43, 23.79, 32.70, 45.06, 50.19, 55.66, 116.87, 120.34, 129.71, 129.82, 136.47, 149.18, 151.05, 152.11, 153.82. MS (ESI+) m/z: 363.4 (100%) (M + H)+. Anal. calcd for C21H26N6·0.1H2O: C, 69.24; H, 7.25; N, 23.07. Found C, 69.10; H, 6.85; N,22.98.
6-[4-(4-Methoxyphenyl)piperazine-1-yl]-9-cyclopentyl-9H-purine (21). Yield 85.1%; mp 107–110 °C. 1H NMR (CDCl3) δ 1.75–2.04 (m, 6H), 2.2–2.34 (m, 2H), 3.23 (t, 4H), 3.78 (s, 3H), 4.49 (br s, 4H), 4.41–5.0 (m, 1H), 6.87 (d, 2H), 6.92–7.02 (br m, 2H), 7.82 (s, 1H), 8.39 (s, 1H). 13C NMR (CDCl3) δ 23.79, 32.70, 45.19, 51.13, 55.54, 55.66, 114.49, 118.72, 120.34, 136.47, 145.62, 151.05, 152.11, 153.83, 154.19. MS (ESI+) m/z: 379.4 (100%) (M + H)+. Anal. calcd for C21H26N6O: C, 66.64; H, 6.92; N, 22.21. Found C, 66.73; H, 7.11; N, 21.83.
6-[4-(4-Fluorophenyl)piperazine-1-yl]-9-cyclopentyl-9H-purine (22). Yield 95.1%; mp 106.5–109 °C. 1H NMR (CDCl3) δ 1.77–2.03 (m, 6H), 2.25–2.36 (m, 2H), 3.26 (t, 4H), 4.52 (br s, 4H), 4.94–5.02 (m, 1H), 6.92–7.04 (m, 4H), 7.84 (s, 1H), 8.41 (s, 1H). 13C NMR (CDCl3) δ 23.79, 32.70, 45.06, 50.63, 55.68, 115.62 (d, J = 22.4 Hz), 118.35 (d, J = 7.7 Hz), 120.36, 136.55, 147.95, 151.08, 152.10, 153.81, 157.46 (d, J = 237.9 Hz). MS (ESI+) m/z: 367.4 (100%) (M + H)+. Anal. calcd for C20H23FN6. 0.05H2O: C, 65.39; H, 6.34; N, 22.88. Found C, 65.14; H, 5.97; N, 22.76.
6-[4-(4-Chlorophenyl)piperazine-1-yl]-9-cyclopentyl-9H-purine (23). Yield 97.5%; mp 142–144 °C. 1H NMR (CDCl3) δ 1.75–2.04 (m, 6H), 2.22–2.34 (m, 2H), 3.42 (t, 4H), 4.48 (br s, 4H), 4.91–4.99 (m, 1H), 6.98 (d, 2H), 7.51 (d, 2H), 7.82 (s, 1H), 8.39 (s, 1H). 13C NMR (CDCl3) δ 23.79, 32.72, 44.88, 49.57, 55.69, 117.66, 120.34, 125.08, 129.05, 136.61, 149.86, 151.06, 152.09, 153.75. MS (ESI+) m/z: 383.3 (100%) (M + H)+, 385.9 (15%) (M + H + 2)+. Anal. calcd for C20H23ClN6: C, 62.74; H, 6.05; N, 21.95. Found C, 62.83; H, 6.01; N, 21. 21.66.
6-[4-(3,4-Dichlorophenyl)piperazine-1-yl]-9-cyclopentyl-9H-purine (24). Yield 75.6%; mp 122–125 °C. 1H NMR (CDCl3) δ 1.80–2.04 (m, 6H), 2.30–2.45 (m, 2H), 3.44 (t, 4H), 4.58 (br s, 4H), 5.02–5.16 (m, 1H), 6.81 (d, 1H), 7.02 (s, 1H), 7.34 (d, 1H, Jo = 8.8 Hz), 7.99 (s, 1H), 8.59 (s, 1H). 13C NMR (CDCl3) δ 23.88, 33.01, 47.81, 49.01, 57.23, 115.90, 117.88, 119.20, 123.75, 130.75, 133.09, 139.28, 145.55, 149.46. MS (ESI+) m/z: 417.3 (100%) (M+), 419.3 (82%) (M + 2)+, 421.3 (17%) (M + 4)+. Anal. calcd for C20H22Cl2N6: C, 57.56; H, 5.31; N, 20.14. Found C, 57.67; H, 5.43; N, 20.03.
![[thin space (1/6-em)]](https://www.rsc.org/images/entities/char_2009.gif) :
:![[thin space (1/6-em)]](https://www.rsc.org/images/entities/char_2009.gif) 3).
3).
6-(4-Methylphenyl)-9-(tetrahydro-2H-pyran-2-yl)-9H-purine (28). Yield 23.4%; mp 180–185 °C. 1H NMR (CDCl3) δ 1.66–1.85 (m, 3H), 2.05–2.19 (m, 3H), 2.44 (s, 3H), 3.82 (td, J = 2.8 Hz, J = 11.6 Hz, 1H), 4.21 (d, 1H), 5.85 (dd, J = 2.8 Hz, J = 10 Hz, 1H), 7.37 (d, J = 8.4 Hz, 2H), 8.32 (s, 1H), 8.68 (d, J = 8.4 Hz, 2H), 9.0 (s, 1H). 13C NMR (CDCl3) δ 21.62, 22.83, 24.89, 31.85, 68.89, 81.92, 129.44, 129.73, 130.91, 132.88, 141.44, 141.78, 151.59, 152.40, 155.05. MS (ESI+) m/z: 211.3 (100%) (M + H-THP)+, 295.4 (77%) (M + H)+. Anal. calcd for C17H18N4O: C, 69.37; H, 6.16; N, 19.03. Found C, 69.51; H, 6.47; N, 18.68.
6-(4-Trifluoromethoxyphenyl)-9-(tetrahydro-2H-pyran-2-yl)-9H-purine (35). Yield 23.4%; mp 142–144 °C. 1H NMR (CDCl3) δ 1.66–1.88 (m, 3H), 2.04–2.22 (m, 3H), 3.83 (td,1H), 4.21 (dm, 1H), 5.86 (dd, 1H), 7.40 (d, 2H), 8.35 (s, 1H), 8.87 (d, 2H), 9.03 (s, 1H). 13C NMR (CDCl3) δ 22.79, 24.86, 31.86, 68.93, 82.02, 120.44 (q, J = 256.5 Hz), 120.74, 131.05, 131.50, 134.13, 142.32, 151.18, 151.80, 152.40, 153.35. MS (ESI+) m/z: 281.2 (100%) (M + H-THP)+, 365.2 (80%) (M + H)+. Anal. calcd for C17H15F3N4O2: C, 56.04; H, 4.15; N, 15.38. Found C, 56.33; H, 4.41; N, 15.72.
6-(4-Trifluoromethoxyphenyl)-9H-purine (45). Yield 74.9%; mp 257–259 °C. 1H NMR (DMSO-d6) δ 7.59 (d, 2H, J = 8.8 Hz), 8.68 (s, 1H), 8.95 (d, 2H, J = 8.8 Hz), 8.96 (s, 1H). 13C NMR (DMSO-d6) δ 119.97 (q, J = 255.2 Hz), 120.87, 123.80, 131.22, 134.64, 145.31, 149.92, 150.33, 151.75, 153.78. MS (ESI+) m/z: 281.2 (100%) (M + H)+. Anal. calcd for C12H7F3N4O: C, 51.44; H, 2.52; N, 19.99. Found C, 51.79; H, 2.71; N, 19.66.
![[thin space (1/6-em)]](https://www.rsc.org/images/entities/char_2009.gif) :
:![[thin space (1/6-em)]](https://www.rsc.org/images/entities/char_2009.gif) 2).
2).
6-Phenyl-9-cyclopentyl-9H-purine (47). Yield 30%; mp 92–94.5 °C. 1H NMR (CDCl3) δ 1.80–2.13 (m, 6H), 2.30–2.42 (m, 2H), 5.03–5.09 (m, 1H), 7.51–7.60 (m, 3H), 8.17 (s, 1H), 8.77 (d, 2H), 8.03 (s, 1H). 13C NMR (CDCl3) δ 23.89, 32.65, 56.13, 128.66, 129.73, 130.88, 131.49, 135.79, 142.56, 152.09, 152.53, 154.81. MS (ESI+) m/z: 265.3 (100%) (M + H)+. Anal. calcd for C16H16N4·0.1H2O: C, 72.21; H, 6.13; N, 21.05. Found C, 72.34; H, 5.78; N, 20.76.
6-(4-Methylphenyl)-9-cyclopentyl-9H-purine (48). Yield 53.5%; mp 103–106 °C. 1H NMR (CDCl3) δ 1.78–2.12 (m, 6H), 2.28–2.40 (m, 2H), 2.45 (s, 3H), 5.01–5.09 (m, 1H), 7.37 (d, 2H, Jo = 8.4 Hz), 8.15 (s, 1H), 7.69 (d, 2H, Jo = 8 Hz), 8.99 (s, 1H). 13C NMR (CDCl3) δ 21.61, 23.88, 32.65, 56.08, 129.42, 129.67, 131.27, 133.04, 141.29, 142.29, 152.06, 152.42, 154.85. MS (ESI+) m/z: 279.3 (100%) (M + H)+. Anal. calcd for C17H18N4·0.1C6H14·0.2H2O: C, 72.75; H, 6.88; N, 19.28. Found C, 73.01; H, 6.62; N, 18.90.
6-(4-t-Butylphenyl)-9-cyclopentyl-9H-purine (49). Yield 73.2%; mp 113–115 °C. 1H NMR (CDCl3) δ 1.38 (s, 9H), 1.80–2.13 (m, 6H), 2.30–2.40 (m, 2H), 5.01–5.09 (m, 1H), 7.58 (d, 2H, Jo = 8.4 Hz), 8.15 (s, 1H), 8.68 (d, 2H, Jo = 8.4 Hz), 9.0 (s, 1H). 13C NMR (CDCl3) δ 23.89, 31.21, 32.65, 34.93, 56.08, 125.66, 129.48, 131.37, 132.99, 142.33, 152.11, 152.38, 154.23, 154.95. MS (ESI+) m/z: 321.4 (100%) (M + H)+. Anal. calcd for C20H24N4: C, 74.97; H, 7.55; N, 17.48. Found C, 75.30; H, 7.72; N, 17.32.
6-(4-Trifluoromethylphenyl)-9-cyclopentyl-9H-purine (50). Yield 43%; mp 137–140 °C. 1H NMR (CDCl3) δ 1.81–2.24 (m, 6H), 2.32–2.42 (m, 2H), 5.04–5.11 (m, 1H), 7.81 (d, 2H, Jo = 8 Hz), 8.20 (s, 1H), 8.92 (d, 2H, Jo = 7.6 Hz), 9.05 (s, 1H). 13C NMR (CDCl3) δ 23.90, 32.65, 56.30, 122.69, 125.39, 125.51 (q, J = 3.9 Hz), 130.03, 131.74, 132.28 (q, J = 32.1 Hz), 138.99, 143.23, 152.02, 152.85. MS (ESI+) m/z: 333.3 (100%) (M + H)+. Anal. calcd for C17H15F3N4·0.15CH2Cl2·0.01C6H14: C, 59.75; H, 4.49; N, 16.19. Found C, 60.11; H, 4.14; N, 15.82.
6-(4-Fluorophenyl)-9-cyclopentyl-9H-purine (51). Yield 71.5%; mp 119–122 °C. 1H NMR (CDCl3) δ 1.81–2.12 (m, 6H), 2.32–2.40 (m, 2H), 5.02–5.09 (m, 1H), 7.24 (t, 2H), 8.16 (s, 1H), 8.83–8.87 (m, 2H), 8.99 (s, 1H). 13C NMR (CDCl3) δ 23.89, 32.65, 56.16, 115.69 (d, J = 21.8 Hz), 131.20, 131.93 (d, J = 8.3 Hz), 132.01, 142.57, 152.04, 152.54, 153.56, 164.57 (d, J = 250.1 Hz). MS (ESI+) m/z: 283.3 (100%) (M + H)+. Anal. calcd for C16H15FN4·0.1H2O: C, 67.64; H, 5.39; N, 19.71. Found C, 67.52; H, 5.46; N, 19.41.
6-(4-Chlorophenyl)-9-cyclopentyl-9H-purine (52). Yield 77.2%; mp 159–162 °C. 1H NMR (CDCl3) δ 1.80–2.12 (m, 6H), 2.30–2.40 (m, 2H), 5.02–5.10 (m, 1H), 7.53 (d, 2H, Jo = 8.4 Hz), 8.17 (s, 1H), 8.78 (d, 2H, Jo = 8.8 Hz), 9.0 (s, 1H). 13C NMR (CDCl3) δ 23.88, 32.63, 56.18, 128.86, 131.04, 131.35, 134.27, 137.10, 142.66, 152.02, 152.62, 153.35. MS (ESI+) m/z: 299.3 (100%) (M + H)+, 301.3 (55%) (M + H + 2)+. Anal. calcd for C16H15ClN4: C, 64.32; H, 5.06; N, 18.75. Found C, 64.39; H, 5.14; N, 18.52.
6-(4-Bromophenyl)-9-cyclopentyl-9H-purine (53). Yield 33%; mp 152–155 °C. 1H NMR (CDCl3) δ 1.82–2.12 (m, 6H), 2.31–2.40 (m, 2H), 5.0–5.09 (m, 1H), 7.69 (d, 2H, Jo = 8 Hz), 8.18 (s, 1H), 8.71 (d, 2H, Jo = 8.8 Hz), 9.0 (s, 1H). 13C NMR (CDCl3) δ 23.88, 32.63, 56.19, 125.71, 131.25, 131.36, 131.84, 134.71, 142.69, 152.02, 152.64, 153.41. MS (ESI+) m/z: 343.2 (100%) (M), 345.2 (99%) (M + H + 2). Anal. calcd for C16H15BrN4: C, 55.99; H, 4.41; N, 16.32. Found C, 56.34; H, 4.53; N, 15.93.
6-(4-Methoxyphenyl)-9-cyclopentyl-9H-purine (54). Yield 30.2%; mp 101–104 °C. 1H NMR (CDCl3) δ 1.80–2.13 (m, 6H), 2.29–2.40 (m, 2H), 3.90 (s, 3H), 5.01–5.09 (m, 1H), 7.08 (d, 2H, J = 8.8 Hz), 8.15 (s, 1H), 8.80 (d, 2H, J = 8.8 Hz), 8.97 (s, 1H). 13C NMR (CDCl3) δ 23.89, 32.67, 55.40, 56.04, 114.06, 128.43, 130.91, 131.47, 142.05, 152.04, 152.31, 154.43, 161.93. MS (ESI+) m/z: 295.3 (100%) (M + H)+. Anal. calcd for C17H18N4O·0.2CH2Cl2·0.15C6H14: C, 67.04; H, 6.37; N, 17.28. Found C, 66.90; H, 6.04; N, 17.39.
6-(4-Trifluoromethoxyphenyl)-9-cyclopentyl-9H-purine (55). Yield 75.3%; mp 109–112 °C. 1H NMR (CDCl3) δ 1.81–2.14 (m, 6H), 2.30–2.42 (m, 2H), 5.02–5.10 (m, 1H), 7.39 (d, 2H, Jo = 8 Hz), 8.18 (s, 1H), 8.86 (d, 2H, Jo = 9.2 Hz), 9.02 (s, 1H). 13C NMR (CDCl3) δ 23.88, 32.63, 56.21, 120.44 (q, J = 255.8 Hz), 120.70, 131.42, 134.31, 142.79, 151.09, 152.05, 152.65, 153.13. MS (ESI+) m/z: 349.2 (100%) (M + H). Anal. calcd for C17H15F3N4O·0.1H2O: C, 58.32; H, 4.37; N, 16.0. Found C, 58.28; H, 4.18; N, 15.75.
6-(4-Phenoxyphenyl)-9-cyclopentyl-9H-purine (56). Yield 98.4%; mp 112–114 °C. 1H NMR (CDCl3) δ 1.80–2.13 (m, 6H), 2.31–2.40 (m, 2H), 5.01–5.09 (m, 1H), 7.10 (d, 2H, J = 7.6 Hz), 7.14–7.18 (m, 3H), 7.38 (t, 2H), 8.15 (s, 1H), 8.79 (d, 2H, J = 9.2 Hz), 8.99 (s, 1H). 13C NMR (CDCl3) δ 23.91, 32.66, 56.12, 118.31, 119.63, 123.92, 129.88, 130.61, 131.13, 131.58, 142.31, 152.09, 152.43, 154.15, 156.36, 159.94. MS (ESI+) m/z: 357.3 (100%) (M + H). Anal. calcd for C22H20N4O. 0.1H2O: C, 73.76; H, 5.68; N, 15.64. Found C, 73.62; H, 5.39; N, 15.41.
3.2 Biological evaluation
![[thin space (1/6-em)]](https://www.rsc.org/images/entities/char_2009.gif) 000 cells per well. 24 h later, the growth medium was replaced with a fresh medium containing the compound of interest (5 μM) and its corresponding DMSO control. After 72 h of incubation, cells were washed twice with ice-cold 1× PBS. In order to permeabilize the cells, 100% ice-cold methanol was used for 10 min. Next, samples were washed with ice-cold 1× PBS once and stained with Hoechst 33258 stain (Sigma) for 5 min in the dark. Subsequently, the excess stain was discarded by washing with ddH2O for 10 min on a shaker. Stained cells were then observed under a fluorescence microscope, and the images were captured using the ZEISS AxioCam MRc5 camera.
000 cells per well. 24 h later, the growth medium was replaced with a fresh medium containing the compound of interest (5 μM) and its corresponding DMSO control. After 72 h of incubation, cells were washed twice with ice-cold 1× PBS. In order to permeabilize the cells, 100% ice-cold methanol was used for 10 min. Next, samples were washed with ice-cold 1× PBS once and stained with Hoechst 33258 stain (Sigma) for 5 min in the dark. Subsequently, the excess stain was discarded by washing with ddH2O for 10 min on a shaker. Stained cells were then observed under a fluorescence microscope, and the images were captured using the ZEISS AxioCam MRc5 camera.
![[thin space (1/6-em)]](https://www.rsc.org/images/entities/char_2009.gif) 000–300
000–300![[thin space (1/6-em)]](https://www.rsc.org/images/entities/char_2009.gif) 000 cells per well. 24 h later, the growth medium was aspirated, cells were washed twice with 1× PBS, and a fresh medium containing 1× FBS was placed to achieve starvation conditions to synchronize the cells. After an additional 24 h, a fresh growth medium containing the compound of interest and its corresponding DMSO control was replaced. After 72 h incubation period, cells were collected by trypsinization. The cell suspension was then centrifuged at 2000 rpm for 8 min. The supernatant was discarded, and the cell pellet was re-suspended in 5 ml 1× PBS. The samples were again centrifuged at 2000 rpm for 8 min. Finally, the supernatant was discarded, and 50 μl 1× PBS was added for every 1 × 10⁶ cells. Then 1 ml ice-cold 70% ethanol was added dropwise while vortexing at medium speed, and the samples were kept for at least 3 hours at −20 °C. Then the samples were stained with propidium iodide according to the manufacturer's protocol of the MUSE cell cycle kit (MCH100106, Millipore) and analyzed eventually.
000 cells per well. 24 h later, the growth medium was aspirated, cells were washed twice with 1× PBS, and a fresh medium containing 1× FBS was placed to achieve starvation conditions to synchronize the cells. After an additional 24 h, a fresh growth medium containing the compound of interest and its corresponding DMSO control was replaced. After 72 h incubation period, cells were collected by trypsinization. The cell suspension was then centrifuged at 2000 rpm for 8 min. The supernatant was discarded, and the cell pellet was re-suspended in 5 ml 1× PBS. The samples were again centrifuged at 2000 rpm for 8 min. Finally, the supernatant was discarded, and 50 μl 1× PBS was added for every 1 × 10⁶ cells. Then 1 ml ice-cold 70% ethanol was added dropwise while vortexing at medium speed, and the samples were kept for at least 3 hours at −20 °C. Then the samples were stained with propidium iodide according to the manufacturer's protocol of the MUSE cell cycle kit (MCH100106, Millipore) and analyzed eventually.
![[thin space (1/6-em)]](https://www.rsc.org/images/entities/char_2009.gif) 000 cells per well. 24 h later, the cells were treated with the selected compounds of interest (5 μM) and their corresponding DMSO controls. At the end of the 72 h incubation period, cells were collected with trypsin and incubated in lysis buffer (150 mM NaCl, 50 mM Tris-HCl pH = 7.6, 1% NP40, 0.1% SDS, 1× protease inhibitor cocktail, and 1× PhosStop). Purified proteins were quantified with Bradford and analyzed using antibodies against PARP-1 (Cell Signaling 9532), phospho-Src (Tyr416) (Santa Cruz sc10182), src (Santa Cruz sc19), Rb (Santa Cruz sc102), phospho-Rb (Ser807/811) (Cell Signaling 9308S), and Cdk2 (Santa Cruz sc6248). Calnexin (Sigma, C4731) and actin (Santa Cruz sc1616) were used for equal loading control. Secondary antibodies anti-mouse (Sigma, A0168) and anti-rabbit (Sigma, A6154) were used.
000 cells per well. 24 h later, the cells were treated with the selected compounds of interest (5 μM) and their corresponding DMSO controls. At the end of the 72 h incubation period, cells were collected with trypsin and incubated in lysis buffer (150 mM NaCl, 50 mM Tris-HCl pH = 7.6, 1% NP40, 0.1% SDS, 1× protease inhibitor cocktail, and 1× PhosStop). Purified proteins were quantified with Bradford and analyzed using antibodies against PARP-1 (Cell Signaling 9532), phospho-Src (Tyr416) (Santa Cruz sc10182), src (Santa Cruz sc19), Rb (Santa Cruz sc102), phospho-Rb (Ser807/811) (Cell Signaling 9308S), and Cdk2 (Santa Cruz sc6248). Calnexin (Sigma, C4731) and actin (Santa Cruz sc1616) were used for equal loading control. Secondary antibodies anti-mouse (Sigma, A0168) and anti-rabbit (Sigma, A6154) were used.
![[thin space (1/6-em)]](https://www.rsc.org/images/entities/char_2009.gif) 000–300
000–300![[thin space (1/6-em)]](https://www.rsc.org/images/entities/char_2009.gif) 000 cells per well. Then the cells were treated with the compounds of interest (5 μM) for 72 h. Following the lysis of the samples, a Bradford assay was used to determine the protein amount of each cell lysate. The Kinase Glo Plus luminescent kinase assay (Promega VC3772) kit was used according to the manufacturer's protocol to investigate the effect of the compounds of interest on kinase activity. Staurosporine (STR) (Calbiochem) was used as the positive control, and DMSO as the negative control of the assay.
000 cells per well. Then the cells were treated with the compounds of interest (5 μM) for 72 h. Following the lysis of the samples, a Bradford assay was used to determine the protein amount of each cell lysate. The Kinase Glo Plus luminescent kinase assay (Promega VC3772) kit was used according to the manufacturer's protocol to investigate the effect of the compounds of interest on kinase activity. Staurosporine (STR) (Calbiochem) was used as the positive control, and DMSO as the negative control of the assay.
3.3 Molecular modeling and molecular dynamics simulations
In the modeling step, there are two sets of molecules: small molecules to be tested and kinases as their target proteins. For the small molecule preparation, the three-dimensional (3D) structure of the purine analog compounds is drawn using ChemDraw. As reference molecules, anticancer agents fludarabine, 5-FU, pentostatine, and STR are also added to the small molecule library, and their structures were obtained from the Drugbank.41 X-ray structures of the target kinases were also obtained from the Protein Data Bank.29Molecular docking was performed using Autodock Vina42,43 and the Chimera software44 to optimize the synthesized compound's geometry and investigate the compounds' binding energy. Amber ff14SB and AM1-BCC force fields were applied to add charges in AmberTools.45 The grid box size was set to 20 × 20 × 20 Å. The maximum number of binding modes and the maximum energy difference between modes were set to 20 kcal mol−1 and 10 kcal mol−1, respectively, with an exhaustive global search of 32. After the molecular docking step, the protein–ligand interaction profiler (PLIP)46 and the kinase database KLIFS47 were used to analyze and visualize the interactions between the proteins and the small molecules. Finally, the resulting binding poses of AutoDock Vina are cross-checked with a second docking software, SwissDock.48 In SwissDock, the accuracy mode with the grid box of 20 × 20 × 20 Å around the same center as AutoDock Vina was used with 250 poses for each target. Finally, the best-scored resulting poses are compared with the resulting poses of Autodock Vina.
Additionally, final poses are checked with molecular dynamics simulations for the stability of the poses of the small molecules inside the binding pocket. However, three X-ray structures of the target kinases had some missing loops. Therefore, GalaxyFill49 was used to reconstruct remaining missing loops during MD preparation with CHARMM-GUI.50 The protein systems were solvated in TIP3P water box sufficient in size to have at least 10 Å of water between the solute and the simulation box edges.50–52 The complexes were neutralized with K+ and Cl− (concentration: 0.15 mol L−1 KCl). For each simulation, an equilibration and ensuing 10 ns MD simulation were performed according to the protocol below. Initially, the system with the aqueous solvent environment was relaxed by performing a phase energy minimization over 10![[thin space (1/6-em)]](https://www.rsc.org/images/entities/char_2009.gif) 000 steps. The system that was minimized was subsequently heated from 0 to 310.15 K, with positional restraints (1 kcal mol−1 Å−2) applied to the kinase backbone and compound, lasting 0.25 ns. Then, simulations were run with periodic boundary conditions for 10 ns, at a constant temperature of 310.15 K, and 1 atm pressure (NPT) without any restraints. For the constant temperature control, Langevin dynamics was selected with the SHAKE algorithm for constrained hydrogen atoms. All MD simulations were performed using NAMD53 with the CHARMM36m force field.54 Visual molecular dynamics (VMD)55 was used for root mean square deviation (RMSD) analysis.
000 steps. The system that was minimized was subsequently heated from 0 to 310.15 K, with positional restraints (1 kcal mol−1 Å−2) applied to the kinase backbone and compound, lasting 0.25 ns. Then, simulations were run with periodic boundary conditions for 10 ns, at a constant temperature of 310.15 K, and 1 atm pressure (NPT) without any restraints. For the constant temperature control, Langevin dynamics was selected with the SHAKE algorithm for constrained hydrogen atoms. All MD simulations were performed using NAMD53 with the CHARMM36m force field.54 Visual molecular dynamics (VMD)55 was used for root mean square deviation (RMSD) analysis.
4. Conclusions
In conclusion, nucleobase and nucleoside analogs have been used in cancer treatments for a long time due to their fundamental roles in various cellular processes such as cell growth or proliferation.56 Purine analogs are propitious therapeutic agents which have been frequently investigated as potential protein kinase inhibitors with anticancer activity. The inactivation of an aberrantly active component responsible for tumorigenesis is a promising strategy against cancer cell growth. In this research, purine nucleobase analogs 11–24 and 47–56 were newly synthesized and analyzed primarily on breast (MCF7), colon (HCT116), and liver (Huh7) cancer cells. At this step, 5-fluorouracil (5-FU), pentostatine, fludarabine, and cladribine were used as positive controls. Eleven of the compounds showed significant growth inhibitory effects, and these molecules had IC50 values less than 10 μM. These promising compounds were analyzed against an enlarged HCC panel by SRB, and their cytotoxic effects were then confirmed with the RT-CES system in real time. Afterward, five of these eleven compounds, 19, 21, 22, 23, and 56, were selected for further molecular analysis on liver cancer cells. Hoechst analysis displayed apoptosis-like morphological changes such as horse-shoe structures or condensed nuclei of the cancer cells treated with these selected compounds. Furthermore, FACS analysis revealed SubG1/G1 cell cycle arrest in the presence of these novel nucleobase analogs as supporting data for the induction of apoptosis. In order to confirm apoptosis as the type of cell death triggered by these compounds, the expression of the poly (ADP-ribose) polymerase (PARP-1), a 113 kDa nuclear protein, was checked and found to be cleaved into apoptotic fragments. All the results correlate and verify that these novel purine analogs induce liver cancer cells to apoptosis. In order to clarify the underlying mechanism for this induction, further western blot analyses were performed. Compounds 19 and 23 were found to decrease the phospho-Src levels, briefly inhibiting the active form of Src protein. This inactivation affects the downstream elements cyclin E and cdk-2. Both downstream elements were confirmed to be inhibited in the presence of compounds 19 and 23. Compared to its corresponding DMSO control, compound 19 also decreased the phospho-Rb levels. Consequently, newly synthesized novel urine nucleobase derivatives inhibit Src protein's phosphorylation, thus disrupting cyclin E and cdk2 complex formation. This complex would normally induce phosphorylation of Rb, which eventually inactivates Rb. In other words, the decrease in the phosphorylation of Rb, meaning its activation, was observed in compound 19 treated cells compared to its DMSO control (Fig. 8). The possible kinase inhibition potentials of these compounds were also investigated. Among all these nucleobase analogs, only compound 19 was shown to be a putative kinase inhibitor directly interacting with ALK and BTK. In anticancer drug discovery, both ALK and BTK are attractive targets due to their mutant forms that trigger cell growth and proliferation. Increased c-Src kinase activity is a common downstream effect of ALK and BTK activation. It is also known that BTK is an interaction partner of ALK, and its inhibition lessens the ischemia–reperfusion, causing hepatocellular damage. In this study, one of the newly synthesized purine analogs, compound 19, was examined for its cytotoxic potential against a panel of liver cancer cell lines with IC50 values less than 5 μM and the underlying mechanism that compound 19 utilizes to induce apoptosis in vitro.Moreover, compounds 19, 21, 22, 23, and 56 are studied in silico by molecular docking together with STR and the other reference molecules. The binding affinities of all molecules showed better or similar values to STR with the target kinases. The binding poses are double checked with 10 ns molecular dynamics simulation of protein–compound complexes. In the final poses, compounds 19 and 56 both displayed very similar poses in the binding site of BTK, ALK, and DDR2, and this is a more extended pose compared to compounds 21, 22, and 23. These molecules reach toward the front and back pockets as well as the activation loop. Activation loop interactions would bring inflexibility to the activation loop region. Finally, compound 19, with BTK as its target kinase, displayed the most extended pose of the small molecule inside the active site by extending from the front to the back pocket through the gatekeeper region.
Author contributions
MT and RCA designed the study. EBG, IDS, DA, SE, and BS performed the study. MT, RCA, EBG, IDS, SE and BS analyzed the data. MT, EBG, IDS, SE and BS wrote the paper. All authors read and approved the manuscript.Conflicts of interest
All authors declare that they have no conflict of interest.Acknowledgements
This work was supported by the Scientific and Technological Research Council of Turkey-TUBITAK (SBAG-112S182). The authors gratefully acknowledge the use of the services and facilities of the Koc University Research Center for Translational Medicine (KUTTAM).References
- J. Yin, W. Ren, X. Huang, J. Deng, T. Li and Y. Yin, Front. Immunol., 2018, 9, 1697 CrossRef PubMed.
- A. M. Pedley and S. J. Benkovic, Trends Biochem. Sci., 2017, 42, 141–154 CrossRef CAS PubMed.
- E. Villa, E. S. Ali, U. Sahu and I. Ben-Sahra, Cancers, 2019, 11, 688 CrossRef CAS PubMed.
- C. M. Galmarini, J. R. Mackey and C. Dumontet, Lancet Oncol., 2002, 3, 415–424 CrossRef CAS PubMed.
- W. B. Parker, Chem. Rev., 2009, 109, 2880–2893 CrossRef CAS PubMed.
- M. Legraverend and D. S. Grierson, Bioorg. Med. Chem., 2006, 14, 3987–4006 CrossRef CAS PubMed.
- P. Robak and T. Robak, Cancer Treat. Rev., 2013, 39, 851–861 CrossRef CAS PubMed.
- H. Sung, J. Ferlay, R. L. Siegel, M. Laversanne, I. Soerjomataram, A. Jemal and F. Bray, Ca-Cancer J. Clin., 2021, 71, 209–249 CrossRef PubMed.
- R. L. Siegel, K. D. Miller, H. E. Fuchs and A. Jemal, Ca-Cancer J. Clin., 2022, 72, 7–33 CrossRef PubMed.
- R. Kumari, M. K. Sahu, A. Tripathy, K. Uthansingh and M. Behera, Hepatic Oncol., 2018, 5, HEP08 CrossRef PubMed.
- D. Marino, C. Zichi, M. Audisio, E. Sperti and M. Di Maio, Drugs Context, 2019, 8, 212577 Search PubMed.
- F. Ma, Y. Zhu, X. Liu, Q. Zhou, X. Hong, C. Qu, X. Feng, Y. Zhang, Q. Ding, J. Zhao, J. Hou, M. Zhong, H. Zhuo, L. Zhong, Z. Ye, W. Xie, Y. Liu, Y. Xiong, H. Chen, D. Piao, B. Sun, Z. Gao, Q. Li, Z. Zhang, X. Qiu and Z. Zhang, Hepatology, 2019, 70, 1785–1803 CrossRef CAS PubMed.
- R. B. Irby and T. J. Yeatman, Oncogene, 2000, 19, 5636–5642 CrossRef CAS PubMed.
- T. Masaki, M. Okada, Y. Shiratori, W. Rengifo, K. Matsumoto, S. Maeda, N. Kato, F. Kanai, Y. Komatsu, M. Nishioka and M. Omata, Hepatology, 1998, 27, 1257–1264 CrossRef CAS PubMed.
- I. Fabregat, World J. Gastroenterol., 2009, 15, 513–520 CrossRef CAS PubMed.
- E. N. De Toni, C. Kuntzen, A. L. Gerbes, W. E. Thasler, N. Sonuc, S. R. Mucha, P. Camaj, C. Bruns, B. Göke and S. T. Eichhorst, J. Hepatol., 2007, 46, 682–691 CrossRef CAS PubMed.
- X. Kong, P. Pan, H. Sun, H. Xia, X. Wang, Y. Li and T. Hou, J. Med. Chem., 2019, 62, 10927–10954 CrossRef CAS PubMed.
- T. Li, Y. Deng, Y. Shi, R. Tian, Y. Chen, L. Zou, J. U. Kazi, L. Rönnstrand, B. Feng, S. O. Chan, W. Y. Chan, J. Sun and H. Zhao, Oncogene, 2018, 37, 6180–6194 CrossRef CAS PubMed.
- N. Maurya, R. Gujar, M. Gupta, V. Yadav, S. Verma and P. Sen, J. Immunol., 2014, 193, 3417–3425 CrossRef CAS PubMed.
- M. Tuncbilek, E. Bilget Guven, T. Onder and R. Cetin Atalay, J. Med. Chem., 2012, 55, 3058–3065 CrossRef CAS PubMed.
- M. Tuncbilek, A. Kucukdumlu, E. B. Guven, D. Altiparmak and R. Cetin-Atalay, Bioorg. Med. Chem. Lett., 2018, 28, 235–239 CrossRef CAS PubMed.
- A. Kucukdumlu, M. Tuncbilek, E. B. Guven and R. C. Atalay, Acta Chim. Slov., 2020, 67, 70–82 CrossRef CAS PubMed.
- A. Kucukdumlu, M. Tuncbilek, E. B. Guven and R. C. Atalay, Acta Chim. Slov., 2017, 64, 621–632 CrossRef CAS PubMed.
- M. Tunçbilek, Z. Ateş-Alagöz, N. Altanlar, A. Karayel and S. Özbey, Bioorg. Med. Chem., 2009, 17, 1693–1700 CrossRef PubMed.
- H. Huang, J. Ma, J. Shi, L. Meng, H. Jiang, J. Ding and H. Liu, Bioorg. Med. Chem., 2010, 18, 4615–4624 CrossRef CAS PubMed.
- T. Prathapam, S. Tegen, T. Oskarsson, A. Trumpp and G. S. Martin, Proc. Natl. Acad. Sci. U. S. A., 2006, 103, 2695–2700 CrossRef CAS PubMed.
- A. T. Bender, A. Gardberg, A. Pereira, T. Johnson, Y. Wu, R. Grenningloh, J. Head, F. Morandi, P. Haselmayer and L. Liu-Bujalski, Mol. Pharmacol., 2017, 91, 208–219 CrossRef CAS PubMed.
- M. Menichincheri, E. Ardini, P. Magnaghi, N. Avanzi, P. Banfi, R. Bossi, L. Buffa, G. Canevari, L. Ceriani, M. Colombo, L. Corti, D. Donati, M. Fasolini, E. Felder, C. Fiorelli, F. Fiorentini, A. Galvani, A. Isacchi, A. L. Borgia, C. Marchionni, M. Nesi, C. Orrenius, A. Panzeri, E. Pesenti, L. Rusconi, M. B. Saccardo, E. Vanotti, E. Perrone and P. Orsini, J. Med. Chem., 2016, 59, 3392–3408 CrossRef CAS PubMed.
- H. M. Berman, Nucleic Acids Res., 2000, 28, 235–242 CrossRef CAS PubMed.
- J. N. Zambrano, C. J. Williams, C. B. Williams, L. Hedgepeth, P. Burger, T. Dilday, S. T. Eblen, K. Armeson, E. G. Hill and E. S. Yeh, Oncotarget, 2018, 9, 35962–35973 CrossRef PubMed.
- K. Sasaki, T. Tsukada, I. Adachi and K. Yamaguchi, Biochem. Biophys. Res. Commun., 1995, 214, 1114–1120 CrossRef CAS PubMed.
- P. M.-U. Ung and A. Schlessinger, ACS Chem. Biol., 2015, 10, 269–278 CrossRef CAS PubMed.
- R. Roskoski, Pharmacol. Res., 2016, 103, 26–48 CrossRef CAS PubMed.
- V. Modi and R. L. Dunbrack, Proc. Natl. Acad. Sci. U. S. A., 2019, 116, 6818–6827 CrossRef CAS PubMed.
- R. V. Patel, B. M. Mistry, R. Syed, N. M. Parekh and H. S. Shin, Arch. Pharm., 2019, 352, e1900051 CrossRef PubMed.
- A. H. Channigarayappa, S. Swamy, M. R. Nadigar, V. Chandramohan and S. Govindaiaha, Asian J. Pharm. Pharmacol., 2017, 3, 177–185 CAS.
- G. X. Zhu, P. Le Cheng, M. Goto, N. Zhang, S. L. Morris-Natschke, K. Y. Hsieh, G. Z. Yang, Q. R. Yang, Y. Q. Liu, H. Le Chen, X. S. Zhang and K. H. Lee, Bioorg. Med. Chem. Lett., 2017, 27, 1750–1753 CrossRef CAS PubMed.
- L. Chen, H. Chen, P. Chen, W. Zhang, C. Wu, C. Sun, W. Luo, L. Zheng, Z. Liu and G. Liang, Eur. J. Med. Chem., 2019, 161, 22–38 CrossRef CAS PubMed.
- N. R. Kode and S. Phadtare, Molecules, 2011, 16, 5840–5860 CrossRef CAS PubMed.
- C. A. Fleckenstein and H. Plenio, Chem. – Eur. J., 2008, 14, 4267–4279 CrossRef CAS PubMed.
- D. S. Wishart, Y. D. Feunang, A. C. Guo, E. J. Lo, A. Marcu, J. R. Grant, T. Sajed, D. Johnson, C. Li, Z. Sayeeda, N. Assempour, I. Iynkkaran, Y. Liu, A. Maciejewski, N. Gale, A. Wilson, L. Chin, R. Cummings, D. Le, A. Pon, C. Knox and M. Wilson, Nucleic Acids Res., 2018, 46, D1074–D1082 CrossRef CAS PubMed.
- O. Trott and A. J. Olson, J. Comput. Chem., 2010, 31, 455–461 CrossRef CAS PubMed.
- J. Eberhardt, D. Santos-Martins, A. F. Tillack and S. Forli, J. Chem. Inf. Model., 2021, 61, 3891–3898 CrossRef CAS PubMed.
- E. F. Pettersen, T. D. Goddard, C. C. Huang, G. S. Couch, D. M. Greenblatt, E. C. Meng and T. E. Ferrin, J. Comput. Chem., 2004, 25, 1605–1612 CrossRef CAS PubMed.
- D. A. Case, H. M. Aktulga, K. Belfon, D. S. Cerutti, G. A. Cisneros, V. W. D. Cruzeiro, N. Forouzesh, T. J. Giese, A. W. Götz, H. Gohlke, S. Izadi, K. Kasavajhala, M. C. Kaymak, E. King, T. Kurtzman, T. S. Lee, P. Li, J. Liu, T. Luchko, R. Luo and K. M. Merz Jr., J. Chem. Inf. Model., 2023, 63, 6183–6191 CrossRef CAS PubMed.
- M. F. Adasme, K. L. Linnemann, S. N. Bolz, F. Kaiser, S. Salentin, V. J. Haupt and M. Schroeder, Nucleic Acids Res., 2021, 49, W530–W534 CrossRef CAS PubMed.
- O. P. J. van Linden, A. J. Kooistra, R. Leurs, I. J. P. de Esch and C. de Graaf, J. Med. Chem., 2014, 57, 249–277 CrossRef CAS PubMed.
- A. Grosdidier, V. Zoete and O. Michielin, Nucleic Acids Res., 2011, 39, W270–W277 CrossRef CAS PubMed.
- E. A. Coutsias, C. Seok, M. P. Jacobson and K. A. Dill, J. Comput. Chem., 2004, 25, 510–528 CrossRef CAS PubMed.
- S. Jo, T. Kim, V. G. Iyer and W. Im, J. Comput. Chem., 2008, 29, 1859–1865 CrossRef CAS PubMed.
- J. Lee, X. Cheng, J. M. Swails, M. S. Yeom, P. K. Eastman, J. A. Lemkul, S. Wei, J. Buckner, J. C. Jeong, Y. Qi, S. Jo, V. S. Pande, D. A. Case, C. L. Brooks, A. D. MacKerell, J. B. Klauda and W. Im, J. Chem. Theory Comput., 2016, 12, 405–413 CrossRef CAS PubMed.
- J. Lee, M. Hitzenberger, M. Rieger, N. R. Kern, M. Zacharias and W. Im, J. Chem. Phys., 2020, 153, 035103 CrossRef CAS PubMed.
- J. C. Phillips, R. Braun, W. Wang, J. Gumbart, E. Tajkhorshid, E. Villa, C. Chipot, R. D. Skeel, L. Kalé and K. Schulten, J. Comput. Chem., 2005, 26, 1781–1802 CrossRef CAS PubMed.
- K. Vanommeslaeghe and A. D. MacKerell, Biochim. Biophys. Acta, 2015, 1850, 861–871 CrossRef CAS PubMed.
- W. Humphrey, A. Dalke and K. Schulten, J. Mol. Graphics, 1996, 14, 33–38 CrossRef CAS PubMed.
- P. Karran, Br. Med. Bull., 2007, 79–80, 153–170 Search PubMed.
Footnotes |
| † Electronic supplementary information (ESI) available. See DOI: https://doi.org/10.1039/d3md00440f |
| ‡ These authors contributed equally to this work. |
| This journal is © The Royal Society of Chemistry 2023 |

