DOI:
10.1039/D3FD00005B
(Paper)
Faraday Discuss., 2023,
245, 352-367
Experimental radiative cooling rates of a polycyclic aromatic hydrocarbon cation
Received
10th January 2023
, Accepted 6th February 2023
First published on 6th February 2023
Abstract
Several small Polycyclic Aromatic Hydrocarbons (PAHs) have been identified recently in the Taurus Molecular Cloud (TMC-1) using radio telescope observations. Reproducing the observed abundances of these molecules has been a challenge for astrochemical models. Rapid radiative cooling of PAHs by Recurrent Fluorescence (RF), the emission of optical photons from thermally populated electronically excited states, has been shown to efficiently stabilize small PAHs following ionization, augmenting their resilience in astronomical environments and helping to rationalize their observed high abundances. Here, we use a novel method to experimentally determine the radiative cooling rate of the cation of 1-cyanonaphthalene (C10H7CN, 1-CNN), the neutral species of which has been identified in TMC-1. Laser-induced dissociation rates and kinetic energy release distributions of 1-CNN cations isolated in a cryogenic electrostatic ion-beam storage ring are analysed to track the time evolution of the vibrational energy distribution of the initially hot ion ensemble as it cools. The measured cooling rate is in good agreement with the previously calculated RF rate coefficient. Improved measurements and models of the RF mechanism are needed to interpret astronomical observations and refine predictions of the stabilities of interstellar PAHs.
1 Introduction
In 2021, after decades of inconclusive searches, astronomers identified the first specific Polycyclic Aromatic Hydrocarbon (PAH) molecules in space.1 Using the Greenbank Radio Telescope, McGuire et al. identified two isomers of the small PAH cyanonaphthalene (CNN, C10H7CN) in the Taurus Molecular Cloud (TMC-1). Several other aromatics have been identified using similar methods2 and many more likely await discovery. Meanwhile, JWST promises to provide new insight into the properties and evolution of interstellar PAHs through observations of their infrared emission bands.3,4
At the dawn of this new era, we find challenges to the established understanding of the interstellar organic inventory. Indeed, McGuire et al. themselves could not explain the observed abundance of CNN through their state-of-the-art astrochemical modeling.1 Their model, which performs well for smaller nitriles,5 underestimates the observed abundance of CNN by six orders of magnitude.1
In a recent report,6 we addressed this gap by elucidating the main destruction pathway for one of the two CNN isomers, which are expected to behave similarly and indeed have comparable abundances in TMC-1.1 We found, contrary to the explicit assumption of McGuire et al., that 1-cyanonaphthalene (1-CNN) is efficiently stabilized by rapid radiative cooling following ionization, closing off some of the reaction channels assumed to deplete CNN from TMC-1. Specifically, the model of McGuire et al. includes several charge transfer reactions:
| | | A+ + C10H7CN → A + C10H7CN+ | (1) |
where A = C, H, or He, and where the resulting C
10H
7CN
+ is assumed to disintegrate into linear fragments. We show that the excess energies of these reactions (the difference between the ionization energies of the reactants) is insufficient to induce such thorough fragmentation and will mainly activate the lowest-energy unimolecular dissociation channel:
| | | C10H7CN+ → C10H6+ + HCN + ε, | (2) |
where
ε is the kinetic energy released in the reaction. Owing to efficient radiative stabilization by Recurrent Fluorescence (RF), the emission of optical photons from thermally populated electronically excited states,
7,8 even this low-energy channel is closed for collision with C
+ and at least partially closed for H
+.
6
Crucially, vibronic coupling greatly increases the RF rate. RF, which is common for small PAHs,9–16 has important implications for astrochemistry beyond the case of CNN in TMC-1. Stabilized by RF, small PAHs may be much more abundant in space than hitherto thought, including in more diffuse regions where it has long been held that PAHs must include at least ≈50 carbon atoms to survive in the UV radiation field there.17 Better understanding of the RF mechanism and its competition with destructive reaction pathways can serve to refine candidate lists for astronomical searches for interstellar PAHs.
Recurrent Fluorescence of PAHs excited by UV photons has been suggested as the source of the Extended Red Emission (ERE)18,19 observed in the red rectangle and other reflection nebulae. The ERE is a broad feature whose peak wavelength shifts in different astronomical environments.18 Improved models of RF in PAHs, including vibronic couplings and anharmonic effects, and predicting excitation energy dependent emission spectra, are needed for quantitative comparison to astronomical observations.
In the present contribution, we extend our previous study by measuring the laser-induced dissociation rate and Kinetic Energy Release (KER) distributions of 1-CNN cations isolated in a cryogenic electrostatic ion-beam storage ring. This novel combination of techniques allows us to track the evolution of the internal energy distribution of the ions over four orders of magnitude in time after ionization. The measured cooling rate allows us to experimentally confirm our previously calculated Recurrent Fluorescence rate coefficient. Such laboratory studies are essential to understanding observations in the era of high-resolution astrochemistry.
2 Experiments
All experiments were conducted at the Double ElectroStatic Ion Ring ExpEriment (DESIREE) infrastructure at Stockholm University.20,21 Cryogenic cooling of the storage ring, which is schematically shown in Fig. 1, to a temperature of approximately 13 K results in a residual gas density on the order of ∼104 cm−3, consisting mostly of H2.21 These conditions enable isolation of highly excited ions or reactive ions in a collision free environment for hours.22,23 Electrostatic ion storage devices feature sampling times exceeding 1 s, orders of magnitude longer than conventional mass spectrometers, enabling time-resolved observations of delayed processes such as unimolecular dissociation16 and thermionic electron emission.24 DESIREE has also been used for vibrational energy dependent action spectroscopy of astrophysically relevant ions including PAHs,25,26 substituted PAHs thought to form in interstellar ices,27,28 and carbon cluster anions.29,30
 |
| | Fig. 1 (Left) Structure of 1-cyanonaphthalene (C10H7CN, 1-CNN). (Right) Schematic of DESIREE storage ring. | |
The methods used here have largely been described previously.6,16 Briefly, 1-CNN (Sigma-Aldrich, >96%) was sublimed from powder in a resistively heated oven coupled to an electron cyclotron resonance (ECR) ion source (Pantechnik Monogan) using helium as a support gas. Cations extracted from the source were accelerated to 34 keV kinetic energy. Mass-selected beams of 1-CNN+ (m/z = 153) were stored in the DESIREE ion storage ring illustrated in Fig. 1.
The ion production method is known to produce ensembles of ions with broad vibrational energy distributions similar to Boltzmann distributions with temperatures of a few thousand Kelvin.16 A small fraction of ions are produced with vibrational energies within a window such that their dissociation rate coefficients are low enough that they reach the ring, but high enough so that they may dissociate before they are stabilized by radiative cooling. These ions contribute a rapidly decreasing yield of neutral fragments referred to as spontaneous decay in the first tens of milliseconds of ion storage. The majority of ions remain stored after the disappearance of this spontaneous signal.
Stored ions were overlapped collinearly with light from an Optical Parametric Oscillator (OPO) laser system in the interaction arm of the storage ring (upper straight section in Fig. 1). The OPO was operated at 250 Hz repetition rate and produced pulses of ∼5 ns duration and ∼5 μJ per pulse at 420 nm.
Neutral fragments emitted in the observation arm of the storage ring (lower straight section in Fig. 1), which may occur up to several hundred microseconds after excitation, are unaffected by the electrostatic fields and continue on straight trajectories until they reach an imaging detector system with a triple stack of custom-made microchannel plates with ultra-high dynamic range (Photonis), a phosphor screen anode, and optical lenses projecting the phosphorescence through the DESIREE vacuum chamber windows and onto a CMOS camera (Photon Focus). The δt = 2.0 ms camera exposures were synchronized with the laser pulses, such that the laser-induced neutral yield resulting from each laser shot was collected in a single frame. Frames for a given laser firing time were summed over more than 50![[thin space (1/6-em)]](https://www.rsc.org/images/entities/char_2009.gif) 000 repeat injections of 1-CNN+, each of 400 ms storage duration.
000 repeat injections of 1-CNN+, each of 400 ms storage duration.
For each summed frame, three-dimensional Newton spheres were reconstructed by applying an inverse Abel transform, using the ‘three-point’ algorithm implemented in the PyAbel package31 written in Python. The density distribution is related to the KER distribution by:
| |  | (3) |
where
ε(
r3D) is the KER associated with a radial slice of the Newton sphere of radius
r3D,
mneut and
mcat are the masses of the neutral and cationic reaction products,
EAcc = 34 keV is the beam energy, and
L is the distance traveled by the products from the point of reaction to the detector. For clarity of presentation, the KER distributions in
Fig. 7 are plotted against an
ε scale calculated according to
eqn (3) with
L =
Lmid, where
Lmid = 1.7 m is the distance from the detector to the mid-point of the observation arm. Our analysis accounts for dissociation occurring along the full length of the observation arm by summing contributions to the Newton sphere density distribution in the detector plane from points at distances in the range
Lmid ±
LSS/2, where
LSS = 0.95 m is the length of the straight section seen by the detector (see
Fig. 1). In the present case, the procedure gives a nearly insignificant correction relative to assuming all decays occur at
Lmid.
3 Results
3.1 Dissociation rates
The spontaneous dissociation rate of the source-heated ions R(t) is shown in the upper panel of Fig. 2. A constant background rate due to detector dark noise and collisions with residual gas has been subtracted. Due to the broad distribution g(E, t) of vibrational energies E and the rapid variation of the dissociation rate coefficient kdiss(E) with energy, the dissociation rate R(t) ∝ ∫kdiss(E)g(E, t)dE does not follow simple exponential decay32 but rather has the approximate time dependence33where t is the time after ion formation and kc = 302.9(4) s−1 is the critical rate coefficient at which dissociation and radiative cooling are competitive. The dashed line in the upper panel of Fig. 2 is a fit of eqn (4) to the data. Note that at longer times significant deviation from the exponential quenching behaviour is observed. This effect is discussed in Section 4. The constant r0 in eqn (4) contains the instrumental parameters and is given by:| |  | (5) |
where ηdet = 0.34(3) is the efficiency for detection of HCN (eqn (2)), C = 8.7 m is the circumference of the storage ring, LSS = 0.95 m is the length of the stored beam viewed by the detector, and N(t) is the average number of stored ions remaining in the ring at time t. The latter is determined from the count rate R(t), measured during ion storage, and the terminal ion beam current, measured at the end of each injection–storage cycle using the Faraday cup shown in Fig. 1. The number N(t) of ions stored during in the spontaneous decay measurement, relative to the initial number N(120 μs), is plotted in Fig. 3. The factor γ0(t) is the ensemble average destruction probability:34| | | γ0(t) = ∫g(E, t)(1 − e−kdiss(E)t)dE/∫g(E, t)dE. | (6) |
Put another way, it is the fraction of stored ions with vibrational energies E ≈ Em consistent with lifetimes equal to the observation time, i.e. kdiss(Em) = t−1.32 Simulated vibrational energy distributions g(E, t) and gm(E, t) = g(E, t)(1 − e−kdiss(E)t) are plotted in the upper panel of Fig. 4 for a time t = 120 μs corresponding to the first pass of the ions through the storage ring. Also indicated are the vibrational energies Eavg and Em averaged over the distributions g(E, t) and gm(E, t), respectively.
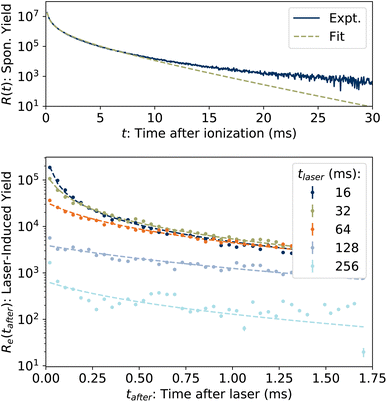 |
| | Fig. 2 (Top) Spontaneous dissociation rate R(t), fit of eqn (4). (Bottom) Examples of laser-induced dissociation rates Re(tafter) with fits of eqn (8). | |
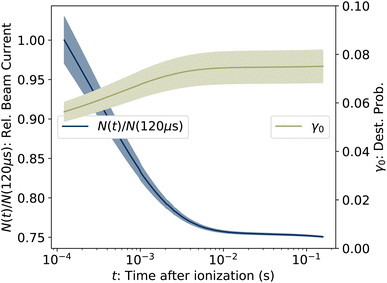 |
| | Fig. 3 (Left axis) Number of ions stored in the measurement of R(t), relative to the value at the first time point at t = 120 μs. (Right axis) Ensemble averaged destruction probability γ0, determined from eqn (5). The shaded areas give the uncertainties. | |
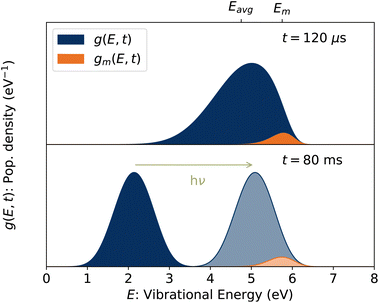 |
| | Fig. 4 (Top) Vibrational energy distribution of the stored ion ensemble, g(E, t), and of the portion of the ensemble with energies E ≈ Em, gm(E, t), at t = 120 μs corresponding to the first pass of the ions through the ring. (Bottom) Vibrational energy distribution at a later time. Following the absorption of a single 420 nm photon, the ions in this example are reheated to the lighter shaded distribution and have the same value of Em as in the upper panel. | |
In the lower panel of Fig. 2, several examples of laser-induced decay rates Re following single-photon absorption are plotted as functions of tafter = t − tlaser, the time after the laser was fired. At early laser firing times tlaser the laser-induced rate Re(tafter) resembles the spontaneous decay rate R(t), while at later times it converges on an exponential decay rate. We assume35 that the portion of the ions which absorb a single photon of energy hν is re-heated such that its internal energy distribution resembles that the full ensemble had at some earlier time tlaser − Δt, i.e.
| | | g(E + hν, tlaser) ∝ g(E, tlaser − Δt) | (7) |
and that the laser-induced decay rate is given by
| |  | (8) |
where
t0 =
tlaser − Δ
t is the time after formation to which the distribution is back-shifted, and
p1 is the probability of absorbing a single photon. The factor
LSS/
C enters
eqn (8) as the laser and ion beams are only overlapped in the outer straight section of the storage ring (see
Fig. 1). The solid lines in the lower panel of
Fig. 2 are fits to
eqn (8) with the parameter
kc fixed to the value extracted from the fit of
eqn (4) to the spontaneous decay rate. However, as
eqn (4) gives a poor fit to
R(
t) at later times, the values of
t0 were determined instead by fitting
Re(
tafter) directly to
R(
t), as illustrated in
Fig. 5. A simultaneous fit to 100 laser-induced decay curves using a single constant value of
p1 = 3.04(3) × 10
−3 in
eqn (8) yielded the results shown in
Fig. 6.
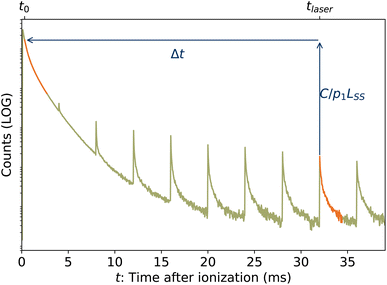 |
| | Fig. 5 Graphical example of method for determining back-shifted times t0 by fitting the laser-induced dissociation rate Re(tafter) to the spontaneous dissociation rate of source-heated ions R(t). In this example, tlaser = 32 ms and t0 = 320 μs. | |
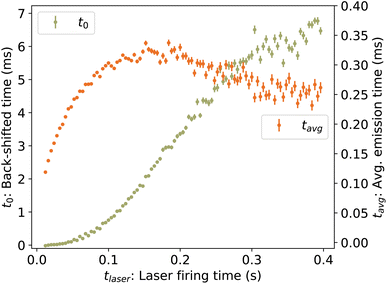 |
| | Fig. 6 (Left axis) Back-shifted times t0 to which the vibrational energy distribution is re-heated following photon absorption at time tlaser, determined from laser-induced decay curves Re(tafter). (Right axis) Average emission times tavg. | |
3.2 Kinetic energy release distributions
Examples of the kinetic energy release distributions Pe(ε) resulting from dissociation of laser-excited 1-CNN+ are shown in Fig. 7. In our previous study of spontaneous dissociation of source-heated 1-CNN+, we found that the KER distributions were well represented by the transition state model of Hansen,36 which includes both tunneling through and reflection from a parabolic barrier:| |  | (9) |
We adopt the parameters from our earlier study,6 which found a rather small reverse barrier height ΔE = 7.6(4) meV and a transition state frequency ℏω = 350(20) cm−1 from simultaneous fits to the KER distributions for spontaneously decaying 1-CNN+ up to 20 ms after ionization. That study also found the dissociation rate coefficient to follow a modified Arrhenius expression:| |  | (10) |
with an activation energy for HCN-loss of Ea = 3.16(4) eV. In the present contribution, all 100 laser-induced KER distributions are simultaneously fit subject to the physical constraint that the integrated distribution be equal to the integral of the count rate:| |  | (11) |
where δt = 2 ms is the integration time of the camera and the value of p1 = 3.04(3) × 10−3 determined from the fit of the laser-induced decay rates was held fixed. The values of T‡ resulting from the fit are plotted in Fig. 8.
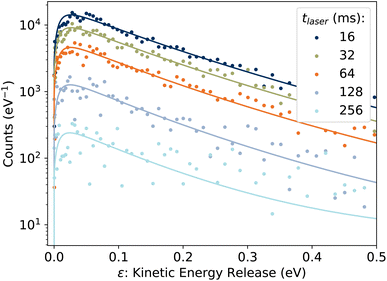 |
| | Fig. 7 Examples of KER distributions Pe(ε) resulting from dissociation of laser-excited 1-CNN+. Solid lines are fits to eqn (9). | |
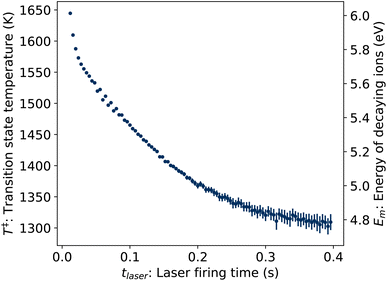 |
| | Fig. 8 Transition state temperatures T‡ (left axis) and corresponding vibrational energies Em (right axis) of ions decaying following photon absorption at time tlaser, determined from KER distributions Pe(ε). | |
To convert the transition state temperatures T‡ to the typical energies Em of dissociation ions, the caloric curve E(T) is first computed assuming Boltzmann statistics:
| |  | (12) |
where
ρ(
E) is the vibrational level density calculated using the Beyer–Swinehart algorithm
37 and vibrational frequencies calculated at the B3LYP/6-31G(d,p) level of Density Functional Theory (DFT) as implemented in Gaussian 16.
38 Finally, the energy
Em of the precursor ion includes a finite heat bath correction due to the energy required to reach the transition state:
39| |  | (13) |
In this energy range, the values of
Em depend linearly on
T‡, as indicated by the second vertical axis in
Fig. 8.
In Fig. 9, the experimentally-determined dissociation rate coefficient kdiss extracted using eqn (11) is plotted against the vibrational energy Em from eqn (13), labeled E to emphasize that this is an intrinsic property not dependent on the internal energy distribution. The values from our previous study of spontaneous dissociation of 1-CNN+ are also reproduced, along with our model dissociation rate coefficient in microcanonical form:
| |  | (14) |
where a nominal value of the pre-exponential factor
Adiss1000K =
kB[1000K]/
h = 2 × 10
13 s
−1 was adopted.
6
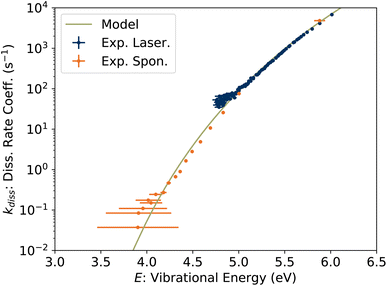 |
| | Fig. 9 Unimolecular dissociation rate coefficient kdiss(E) from KER measurements. | |
3.3 Cooling rate
To determine the cooling rate, we combine the back-shifted times t0 from the decay rates with the corresponding energies Em from the KER distributions. As the images for the KER measurement are integrated over the full decay curve following each laser shot, over which time the energy is changing rapidly, we compute an average emission time tavg = ∫tRe(t)dt/∫Re(t)dt, plotted in Fig. 6. The time associated with each value of Em is thus t0 + tavg. These values, labeled Em(t0) for simplicity, are plotted in Fig. 10.
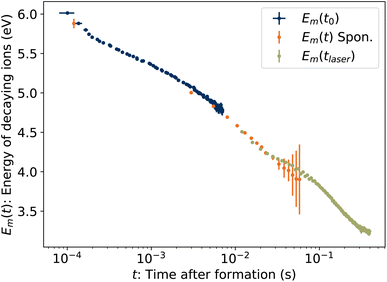 |
| | Fig. 10 Energies Em of ions decaying at time t. Blue symbols Emt0 are the energies from Fig. 8 plotted against the back-shifted time t0 + tavg. The green symbols Em(tlaser) give the energy in eqn (15) as a function of laser firing time. The orange symbols Em(t) are the energies of spontaneously decaying 1-CNN+ determined previously.6 | |
Also plotted in Fig. 10 are values from our previous study of spontaneously dissociating 1-CNN+. The values Em(t) from 2.5–50 ms were recorded during the measurement of the spontaneous decay rate R(t) reproduced in Fig. 2. The same correction for the average emission time during the camera exposure time has been applied. The point at 120 μs is from a separate single-pass measurement.
Finally, the energies of the ions at the times the laser is fired, Em(tlaser), are plotted in Fig. 10. Naively, one might assume Em(tlaser) = Em(t0) − hν. However, as illustrated in Fig. 4, the vibrational energy distribution of the laser-reheated ions is significantly narrower than the original distribution of the hot ions as they cool. The high-energy tail of the reheated distribution, gm(E + hν, tlaser), is thus shifted up by less than if the full original distribution g(E, t0) had simply shifted down by hν. We note that the re-heated distribution g(E + hν, tlaser), unlike the original distribution g(E, t0), is approximately Gaussian and for such a distribution Em = Eavg + Ea. Thus,
| | | Em(tlaser) = E(T‡) + Ea − hν. | (15) |
These values are plotted in
Fig. 10.
The time derivative of Em(t) is the rate at which the high-energy tail of the vibrational energy distribution gm(E, t) moves towards lower energy, be it by depletion of hot ions by dissociation or transposition of population by radiative cooling, and is called the energy shift rate. At any given time, only a small fraction γ0 of the stored ion ensemble is part of the tail and subject to shift. Thus the total energy loss rate, which is directly comparable to the absolute dissociation and radiative cooling rate coefficients, is given by γ−10 dEm/dt and is plotted in Fig. 11. For clarity, points derived from laser firing times tlaser > 300 ms, which have large uncertainties due to the small changes in t0 (see Fig. 6), are excluded from the plot but are included in the further analysis below.
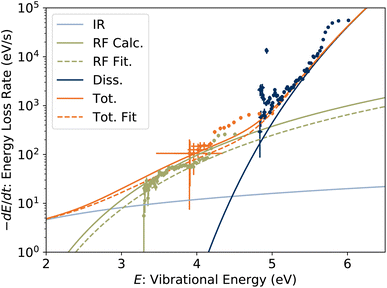 |
| | Fig. 11 Energy loss rate for 1-CNN+. Symbol colours for experimental data correspond to those in Fig. 10. Solid lines are calculated energy loss rates due to dissociation, RF and IR radiative cooling. The dashed lines are a fit to the experimental data taking the oscillator strength f of the RF transition as a free parameter. | |
Included in Fig. 11 are the calculated radiated powers PIR and PRF based on our previous study. Briefly, the IR (vibrational) radiative cooling rate coefficient is computed under the Simple Harmonic Cascade approximation:
| |  | (16) |
where
v is the vibrational quantum number, and
hνs and
As are the transition energy and Einstein coefficient of vibrational mode
s, respectively, calculated at the B3LYP/6-31G(d,p) level of Density Functional Theory (DFT) as implemented in Gaussian 16.
38 The radiated power

. The RF (electronic) cooling rate coefficient is
| |  | (17) |
where the electronic transition energy
hνel = 1.10 eV was computed at the equilibrium geometry of the lowest-lying
Lα excited state using EOM-CCSD/cc-pVDZ calculations performed in CFOUR.
40 The Einstein coefficient is given by
| |  | (18) |
where the oscillator strength
f = 0.011 was calculated using a Franck–Condon–Herzberg–Teller simulation
41 at the ωB97X-D/cc-pVDZ level of DFT. The radiated power is
PRF =
kRFhνel. The energy shift rate due to dissociation is
Pdiss =
kdissE where the dissociation rate coefficient is given in
eqn (14).
The calculated energy loss rates agree well with the experimental values. In the range from 3 to 5 eV, the experimental points are up to two orders of magnitude greater than can be attributed to IR radiative cooling, and agrees well with our modeled PRF. In our previous report, we found that Herzberg–Teller vibronic coupling increases the oscillator strength of the RF transition from 1 × 10⁻⁴ to the value f = 0.011 used in the calculated PRF. If the oscillator strength is taken as a fitting parameter, holding the RF transition energy hνel, PIR and Pdiss constant, we find f = 0.0074(3) to agree best with the experimental data, close to our calculated value. Energy loss rates with this lower oscillator strength are plotted with dashed lines in Fig. 11. Both modeled and fitted curves underpredict the measured loss rate in the range above 4 eV. Excluding the points derived from Em(tlaser) (green symbols) covering the lower energy range from the fit (not shown) gives a somewhat higher f = 0.0161(12). This range of values may suggest a dependence of the vibronic coupling strength, and hence f, the on vibrational energy, which could explain the non-exponential quenching of R(t) (Fig. 2).
4 Conclusions
By direct measurement of the energy loss rates of 1-CNN cations isolated in a cryogenic electrostatic ion-beam storage ring, we have confirmed that 1-CNN+ is rapidly stabilized by recurrent fluorescence in the crucial energy range from 3–5 eV. Given the 8.6 eV ionization energy of 1-CNN, RF closes off some of the collisional destruction channels included in the model of McGuire et al.,1 and completely forestalls photodissociation at photon energies found in molecular clouds.42
The non-exponential quenching of the spontaneous dissociation rate R(t) (Fig. 2) has been observed previously for other PAHs, and has been attributed to sequential fragmentation of ionic products close enough in mass to the precursor to remain stored in the ring.27 An alternative hypothesis is that the simple statistical model of RF (eqn (17)), which was first proposed by Boissel et al.,8 does not fully capture the photophysics of RF in PAHs. Energy dependent oscillator strengths and/or emission wavelengths could lead to competition between dissociation and RF over a broader range of energies and thus non-exponential quenching. In the present results, the measured power radiated through RF is in good agreement with the simple model of Boissel et al., with an oscillator strength lowest optical transition in 1-CNN+ of f = 0.0074(3). This is consistent with our previously calculated value of f = 0.011, nearly two orders of magnitude greater than if Herzberg–Teller vibronic coupling is neglected.6 Improvements to the RF model, including energy-dependent f-values and emission wavelengths, can be expected to improve agreement with laboratory data. Consideration of Herzberg–Teller coupling is essential to modeling the radiative stabilization of isolated PAHs, as well as their optical spectra.
While the radiated power is the key quantity for predicting stability of isolated PAHs in astronomical environments, it does not completely constrain the emission mechanism. For example, more frequent emission of somewhat lower-energy photons would give the same power. Additional experiments of the present type on other PAHs, as well as, crucially, direct-detection measurements of dispersed RF spectra, will enable more quantitative comparison to astronomical observations and models of e.g. the Extended Red Emission.
Author contributions
JENN: investigation, formal analysis, software, writing – review and editing. JNB: conceptualization, data curation, formal analysis, funding acquisition, investigation, project administration, writing – review and editing. HC: funding acquisition, resources, writing – review and editing. SI: investigation, writing – review and editing. MCJ: investigation, writing – review and editing. HTS: funding acquisition, resources, supervision, writing – review and editing. HZ: funding acquisition, resources, supervision, writing – review and editing. BZ: investigation, writing – review and editing. MHS: conceptualization, data curation, formal analysis, funding acquisition, investigation, methodology, project administration, software, supervision, visualization, writing – original draft.
Conflicts of interest
There are no conflicts to declare.
Acknowledgements
This work was supported by Swedish Research Council grant numbers 2016-03675 (MHS), 2018-04092 (HTS), 2019-04379 (HC), 2020-03437 (HZ), Knut and Alice Wallenberg Foundation grant number 2018.0028 (HC, HTS, and HZ), Olle Engkvist Foundation grant number 200-575 (MHS), and Swedish Foundation for International Collaboration in Research and Higher Education (STINT) grant number PT2017-7328 (JNB and MHS). We acknowledge the DESIREE infrastructure for provisioning of facilities and experimental support, and thank the operators and technical staff for their invaluable assistance. The DESIREE infrastructure receives funding from the Swedish Research Council under the grant numbers 2017-00621 and 2021-00155. This article is based upon work from COST Action CA18212 – Molecular Dynamics in the GAS phase (MD-GAS), supported by COST (European Cooperation in Science and Technology).
Notes and references
- B. A. McGuire, R. A. Loomis, A. M. Burkhardt, K. L. K. Lee, C. N. Shingledecker, S. B. Charnley, I. R. Cooke, M. A. Cordiner, E. Herbst, S. Kalenskii, M. A. Siebert, E. R. Willis, C. Xue, A. J. Remijan and M. C. McCarthy, Science, 2021, 371, 1265–1269 CrossRef CAS PubMed.
- J. Cernicharo, M. Agúndez, C. Cabezas, B. Tercero, N. Marcelino, J. R. Pardo and P. de Vicente, Astron. Astrophys., 2021, 649, L15 CrossRef CAS PubMed.
- T. S.-Y. Lai, L. Armus, V. U, T. Díaz-Santos, K. L. Larson, A. Evans, M. A. Malkan, P. Appleton, J. Rich, F. Müller-Sánchez, H. Inami, T. Bohn, J. McKinney, L. Finnerty, D. R. Law, S. T. Linden, A. M. Medling, G. C. Privon, Y. Song, S. Stierwalt, P. P. van der Werf, L. Barcos-Muñoz, J. D. T. Smith, A. Togi, S. Aalto, T. Böker, V. Charmandaris, J. Howell, K. Iwasawa, F. Kemper, J. M. Mazzarella, E. J. Murphy, M. J. I. Brown, C. C. Hayward, J. Marshall, D. Sanders and J. Surace, Astrophys. J., Lett., 2022, 941, L36 CrossRef.
- V. U, T. Lai, M. Bianchin, R. P. Remigio, L. Armus, K. L. Larson, T. Díaz-Santos, A. Evans, S. Stierwalt, D. R. Law, M. A. Malkan, S. Linden, Y. Song, P. P. van der Werf, T. Gao, G. C. Privon, A. M. Medling, L. Barcos-Muñoz, C. C. Hayward, H. Inami, J. Rich, S. Aalto, P. Appleton, T. Bohn, T. Böker, M. J. I. Brown, V. Charmandaris, L. Finnerty, J. Howell, K. Iwasawa, F. Kemper, J. Marshall, J. M. Mazzarella, J. McKinney, F. Muller-Sanchez, E. J. Murphy, D. Sanders and J. Surace, Astrophys. J., Lett., 2022, 940, L5 CrossRef.
- B. A. McGuire, A. M. Burkhardt, S. Kalenskii, C. N. Shingledecker, A. J. Remijan, E. Herbst and M. C. McCarthy, Science, 2018, 359, 202–205 CrossRef CAS PubMed.
- M. H. Stockett, J. N. Bull, H. Cederquist, S. Indrajith, M. Ji, J. E. Navarro Navarrete, H. T. Schmidt, H. Zettergren and B. Zhu, Nat. Commun., 2023, 14, 395 CrossRef CAS PubMed.
- A. Léger, P. Boissel and L. d’Hendecourt, Phys. Rev. Lett., 1988, 60, 921–924 CrossRef PubMed.
- P. Boissel, P. de Parseval, P. Marty and G. Lefèvre, J. Chem. Phys., 1997, 106, 4973–4984 CrossRef CAS.
- S. Martin, J. Bernard, R. Brédy, B. Concina, C. Joblin, M. Ji, C. Ortega and L. Chen, Phys. Rev. Lett., 2013, 110, 063003 CrossRef CAS PubMed.
- M. Ji, G. Montagne, R. Brédy, J. Bernard, L. Chen and S. Martin, Phys. Scr., 2013, T156, 014092 CrossRef.
- S. Martin, M. Ji, J. Bernard, R. Brédy, B. Concina, A. R. Allouche, C. Joblin, C. Ortega, G. Montagne, A. Cassimi, Y. Ngono-Ravache and L. Chen, Phys. Rev. A, 2015, 92, 053425 CrossRef.
- R. Brédy, C. Ortéga, M. Ji, L. Chen, J. Bernard, A. R. Allouche, C. Joblin, A. Cassimi and S. Martin, J. Phys.: Conf. Ser., 2015, 583, 012042 CrossRef.
- M. Ji, J. Bernard, L. Chen, R. Brédy, C. Ortéga, C. Joblin, A. Cassimi and S. Martin, J. Chem. Phys., 2017, 146, 044301 CrossRef CAS PubMed.
- J. Bernard, L. Chen, R. Brédy, M. Ji, C. Ortéga, J. Matsumoto and S. Martin, Nucl. Instrum. Methods Phys. Res., Sect. B, 2017, 408, 21–26 CrossRef CAS.
- M. Saito, H. Kubota, K. Yamasa, K. Suzuki, T. Majima and H. Tsuchida, Phys. Rev. A, 2020, 102, 012820 CrossRef CAS.
- M. H. Stockett, J. N. Bull, J. T. Buntine, E. Carrascosa, M. Ji, N. Kono, H. T. Schmidt and H. Zettergren, J. Chem. Phys., 2020, 153, 154303 CrossRef CAS PubMed.
- A. Li, Nat. Astron., 2020, 4, 339–351 CrossRef.
- A. N. Witt and T. S.-Y. Lai, Astrophys. Space Sci., 2020, 365, 58 CrossRef.
- T. S.-Y. Lai, A. N. Witt, C. Alvarez and J. Cami, Mon. Not. R. Astron. Soc., 2020, 492, 5853–5864 CrossRef CAS.
- R. D. Thomas, H. T. Schmidt, G. Andler, M. Björkhage, M. Blom, L. Brännholm, E. Bäckström, H. Danared, S. Das, N. Haag, P. Halldén, F. Hellberg, A. I. S. Holm, H. A. B. Johansson, A. Källberg, G. Källersjö, M. Larsson, S. Leontein, L. Liljeby, P. Löfgren, B. Malm, S. Mannervik, M. Masuda, D. Misra, A. Orbán, A. Paál, P. Reinhed, K.-G. Rensfelt, S. Rosén, K. Schmidt, F. Seitz, A. Simonsson, J. Weimer, H. Zettergren and H. Cederquist, Rev. Sci. Instrum., 2011, 82, 065112 CrossRef CAS PubMed.
- H. T. Schmidt, R. D. Thomas, M. Gatchell, S. Rosén, P. Reinhed, P. Löfgren, L. Brännholm, M. Blom, M. Björkhage, E. Bäckström, J. D. Alexander, S. Leontein, D. Hanstorp, H. Zettergren, L. Liljeby, A. Källberg, A. Simonsson, F. Hellberg, S. Mannervik, M. Larsson, W. D. Geppert, K. G. Rensfelt, H. Danared, A. Paál, M. Masuda, P. Halldén, G. Andler, M. H. Stockett, T. Chen, G. Källersjö, J. Weimer, K. Hansen, H. Hartman and H. Cederquist, Rev. Sci. Instrum., 2013, 84, 055115 CrossRef CAS PubMed.
- E. Bäckström, D. Hanstorp, O. M. Hole, M. Kaminska, R. F. Nascimento, M. Blom, M. Björkhage, A. Källberg, P. Löfgren, P. Reinhed, S. Rosén, A. Simonsson, R. D. Thomas, S. Mannervik, H. T. Schmidt and H. Cederquist, Phys. Rev. Lett., 2015, 114, 143003 CrossRef PubMed.
- M. Gatchell, J. Ameixa, M. Ji, M. H. Stockett, A. Simonsson, S. Denifl, H. Cederquist, H. T. Schmidt and H. Zettergren, Nat. Commun., 2021, 12, 6646 CrossRef CAS PubMed.
- M. H. Stockett, J. N. Bull, J. T. Buntine, E. Carrascosa, E. K. Anderson, M. Gatchell, M. Kaminska, R. F. Nascimento, H. Cederquist, H. T. Schmidt and H. Zettergren, Eur. Phys. J. D, 2020, 74, 150 CrossRef CAS.
- M. H. Stockett, M. Björkhage, H. Cederquist, H. Schmidt and H. Zettergren, Faraday Discuss., 2019, 217, 126–137 RSC.
- M. H. Stockett, M. Björkhage, H. Cederquist, H. T. Schmidt and Z. Henning, Proc. Int. Astron. Union, 2019, 15, 127–131 CrossRef CAS.
- M. H. Stockett, J. N. Bull, H. Schmidt and H. Zettergren, Phys. Chem. Chem. Phys., 2022, 24, 12002–12010 RSC.
- B. Zhu, J. N. Bull, M. Ji, H. Zettergren and M. H. Stockett, J. Chem. Phys., 2022, 157, 044303 CrossRef CAS PubMed.
- J. N. Bull, M. S. Scholz, E. Carrascosa, M. K. Kristiansson, G. Eklund, N. Punnakayathil, N. de Ruette, H. Zettergren, H. T. Schmidt, H. Cederquist and M. H. Stockett, J. Chem. Phys., 2019, 151, 114304 CrossRef PubMed.
- B. Zhu, J. N. Bull, J. E. Navarro Navarrete, A. F. Schmidt-May, H. Cederquist, H. T. Schmidt, H. Zettergren and M. H. Stockett, J. Chem. Phys., 2022, 157, 174308 CrossRef CAS PubMed.
-
S. Gibson, D. D. Hickstein, R. Yurchak, M. Ryazanov, D. Das and G. Shih, PyAbel: v0.8.4, 2021, DOI:10.5281/zenodo.7438595.
- K. Hansen, J. U. Andersen, P. Hvelplund, S. P. Møller, U. V. Pedersen and V. V. Petrunin, Phys. Rev. Lett., 2001, 87, 123401 CrossRef CAS PubMed.
- J. Andersen, H. Cederquist, J. Forster, B. Huber, P. Hvelplund, J. Jensen, B. Liu, B. Manil, L. Maunoury, S. Brøndsted Nielsen, U. Pedersen, H. Schmidt, S. Tomita and H. Zettergren, Eur. Phys. J. D, 2003, 25, 139–148 CrossRef CAS.
- K. Hansen, Phys. Rev. A, 2020, 102, 052823 CrossRef CAS.
- A. E. K. Sundén, M. Goto, J. Matsumoto, H. Shiromaru, H. Tanuma, T. Azuma, J. U. Andersen, S. E. Canton and K. Hansen, Phys. Rev. Lett., 2009, 103, 143001 CrossRef PubMed.
- K. Hansen, Chem. Phys. Lett., 2018, 693, 66–71 CrossRef CAS.
- T. Beyer and D. F. Swinehart, Commun. ACM, 1973, 16, 379 CrossRef.
-
M. J. Frisch, G. W. Trucks, H. B. Schlegel, G. E. Scuseria, M. A. Robb, J. R. Cheeseman, G. Scalmani, V. Barone, B. Mennucci, G. A. Petersson, H. Nakatsuji, M. Caricato, X. Li, H. P. Hratchian, A. F. Izmaylov, J. Bloino, G. Zheng, J. L. Sonnenberg, M. Hada, M. Ehara, K. Toyota, R. Fukuda, J. Hasegawa, M. Ishida, T. Nakajima, Y. Honda, O. Kitao, H. Nakai, T. Vreven, J. A. Montgomery Jr, J. E. Peralta, F. Ogliaro, M. Bearpark, J. J. Heyd, E. Brothers, K. N. Kudin, V. N. Staroverov, R. Kobayashi, J. Normand, K. Raghavachari, A. Rendell, J. C. Burant, S. S. Iyengar, J. Tomasi, M. Cossi, N. Rega, J. M. Millam, M. Klene, J. E. Knox, J. B. Cross, V. Bakken, C. Adamo, J. Jaramillo, R. Gomperts, R. E. Stratmann, O. Yazyev, A. J. Austin, R. Cammi, C. Pomelli, J. W. Ochterski, R. L. Martin, K. Morokuma, V. G. Zakrzewski, G. A. Voth, P. Salvador, J. J. Dannenberg, S. Dapprich, A. D. Daniels, Ã. Farkas, J. B. Foresman, J. V. Ortiz, J. Cioslowski and D. J. Fox, Gaussian 16 Revision B.01, Gaussian Inc., Wallingford CT, 2016 Search PubMed.
- J. Andersen, E. Bonderup and K. Hansen, J. Chem. Phys., 2001, 114, 6518–6525 CrossRef CAS.
-
J. F. Stanton, J. Gauss, L. Cheng, M. E. Harding, D. A. Matthews and P. G. Szalay, CFOUR, Coupled-Cluster Techniques for Computational Chemistry, a Quantum-Chemical Program Package Search PubMed.
- F. Santoro, A. Lami, R. Improta, J. Bloino and V. Barone, J. Chem. Phys., 2008, 128, 224311 CrossRef PubMed.
- K. I. Öberg, Chem. Rev., 2016, 116, 9631–9663 CrossRef PubMed.
|
| This journal is © The Royal Society of Chemistry 2023 |
Click here to see how this site uses Cookies. View our privacy policy here.  Open Access Article
 b,
Henrik
Cederquist
a,
Suvasthika
Indrajith
a,
MingChao
Ji
 a,
Henning T.
Schmidt
 a,
Henning
Zettergren
 a,
Boxing
Zhu
a and
Mark H.
Stockett
 *a
*a

![[thin space (1/6-em)]](https://www.rsc.org/images/entities/char_2009.gif) 000 repeat injections of 1-CNN+, each of 400 ms storage duration.
000 repeat injections of 1-CNN+, each of 400 ms storage duration.


 . The RF (electronic) cooling rate coefficient is


