Low temperature reforming of methane with CO2 over Pt/CeO2, Ni/CeO2 and Pt–Ni/CeO2 catalysts prepared by a solution-combustion method†
Rubina
Khatun
ab,
Nazia
Siddiqui
ab,
Rohan Singh
Pal
ab,
Sonu
Bhandari
ab,
Tuhin Suvra
Khan
ab,
Shivani
Singh
ab,
Mukesh Kumar
Poddar
a,
Chanchal
Samanta
c and
Rajaram
Bal
 *ab
*ab
aLight Stock Processing Division, CSIR-Indian Institute of Petroleum, Dehradun 248005, India. E-mail: raja@iip.res.in; Fax: +91 135 2660202; Tel: +91 135 2525917
bAcademy of Scientific and Innovative Research (AcSIR), Ghaziabad-201002, India
cBharat Petroleum Corporation Ltd., Greater Noida, Uttar Pradesh 201306, India
First published on 4th October 2023
Abstract
This study investigates the low temperature reforming of methane with CO2 over mono-metallic (Pt/CeO2 and Ni/CeO2) and bi-metallic (Pt–Ni/CeO2) solid solution catalysts prepared by using a one-pot solution-combustion method. Various analytical techniques were employed to analyze the synthesized catalysts in order to correlate their physicochemical properties to their catalytic activity. Solid solution formation was confirmed by the lattice parameter shifting and Rietveld refinement analysis. Solid-solution formation enhanced the defective oxygen species. The TPR and TPDs studies showed that the synergy between Pt and Ni enhanced the active oxygen species and metal–support interaction of the Pt–Ni/CeO2 catalyst, which are beneficial for the higher adsorption of CH4 and CO2. Pt–Ni/CeO2 catalysts have a higher amount of O22−, O2− species and AD/AF2g ratio followed by the NC and PC catalysts, as confirmed by the O2-TPD, XPS and RAMAN analysis. Pt-based catalysts start the DRM reaction at 350 °C, whereas Ni/CeO2 activates at a temperature 100 °C higher than Pt–Ni/CeO2 and Pt/CeO2. At 675 °C, Pt–Ni/CeO2 showed ∼86% conversion of CO2 and CH4 with 100% selectivity of synthesis gas with a H2/CO ratio of ∼1, while Pt/CeO2 and Ni/CeO2 shows ∼46.2 and ∼59.8% conversion, respectively. DFT calculations showed that the Pt–Ni/CeO2 catalyst required lower activation energy than the monometallic catalyst to activate CH4 and CO2. We believe that the synergy between Ni and Pt enhanced the structural and electronic properties of Pt–Ni/CeO2, which is responsible for its excellent performance at low temperature.
1. Introduction
The International Paris agreement in December 2015 was accepted by 195 countries with the aim of reducing greenhouse gas emissions for climate change.1 The aim of this agreement is to keep the global warming temperature below 2 °C and to “continue efforts” to keep it below 1.5 °C by 2100.1,2 The transformation of greenhouse gases like carbon dioxide and methane into valuable products is regarded as a critical step toward mitigating the adverse effects of global warming. In this regard, catalytic dry reforming of methane (CDRM) has received substantial scientific attention as one of the propitious approaches toward reducing the harmful impact of CO2 and CH4 by converting them into syngas (a mixture of CO and H2).3 Syngas is a versatile feedstock that can be converted into several valuable chemicals like methanol, dimethyl ether, synthetic fuels via Fischer–Tropsch synthesis and other long-chain hydrocarbons and oxygenates.3–6 Despite being beneficial from the environmental and economic point of view, CDRM is not considered an industrially fully grown process because of catalyst deactivation by coking and sintering4,6,7 and this primary concern needs to be addressed before the commercialization of CDRM.7,8 As a result, it has been a long-standing challenge for researchers to develop a high-performance and stable catalyst to deal with coke deposition and sintering. This challenge can be met by selecting appropriate active metals (mono and bi), selecting supports, and generating oxygen vacancies by creating lattice defects.9–11DRM is highly endothermic and requires high operating temperatures (600–1000 °C), leading to active metal sintering.12–14 In DRM, coke deposition mainly occurred by decomposition of methane and CO disproportionation.15,16 Another barrier for DRM is the reverse water gas shift reaction (RWGS), which is also endothermic and decreases the H2/CO ratio from the anticipated value for DRM.5,6,17 In the past few years, a large number of noble and transition-based catalysts have been explored for the DRM reaction,12,17 where noble metal-based catalysts showed promising performance against coking and sintering.16 Nevertheless, their scarcity and high cost constrain the use of noble metals. Ni-supported catalysts have received considerable attention among transition metals-based catalysts, and have potential for industrial applications due to cheaper cost.6,14,16 However, the main issue with Ni-based catalysts is their quick deactivation caused by sintering and coke deposition during catalysis.11,14 Several efforts have been carried out to overcome this problem, and bimetallic catalyst systems have sparked a lot of interest in reforming reactions in the past few years due to their tailored electrical and structural properties.9,11,18–21
Addition of a small amount of platinum group noble metal makes it an excellent choice to be used with Ni-based catalysts due to their high dispersive nature and high coke and sintering resistivity.5,12 Hu et al. reported the platinum group metals with the following order for coke resistivity during DRM at 500 °C: Pt ∼ Pd < Ir = Ru < Rh.22 Methane/propane partial oxidation over Pt–Ni supported on CeO2 was studied by Corbo and his group; according to their findings, it is worthwhile to use a Pt–Ni based catalyst supported on CeO2 to take advantage of CeO2 capability. Ni is accountable for improving syngas selectivity in the Pt–Ni bimetallic system, whereas Pt lowers the light-off temperature of methane/propane in order to maintain an attractive catalytic efficiency even at high GHSV.23 Since Pt possesses exceptional anti-coking properties and Ni is highly active and inexpensive, a combination of Pt and Ni may be the choice of catalyst for DRM due to the trade-off between the high cost and stability of the catalyst. A bimetallic Pt–Ni/CeO2 and monometallic (Pt/CeO2, Ni/CeO2) catalyst system was studied by Araiza et al. for DRM. They found that the bimetallic catalyst exhibits superior coke resistivity and catalytic performance up to 24 h compared to the monometallic system.11 Recently, Niu and co-workers reported the Pt–Ni system for DRM and found that the bimetallic system maintained high stability and selectivity by suppressing the RWGS reaction.24
The choice of support is crucial in designing a stable and active catalyst. Due to its unique Ce3+/Ce4+ redox cycle, which inhibits coke formation by continuously removing carbonaceous species through carbon oxides, CeO2 is a potential candidate to take advantage of its remarkable oxygen mobility.12,25–27 Defects chemistry suggested that one oxygen vacancy (Vo) is generated by removing bulk oxygen by reducing every two Ce4+ to Ce3+.28 Extrinsic defects caused by the introduction of smaller cations (e.g., Si4+, Zr4+) and lower valence metal ions (e.g., Sm3+, Ni2+, Pr3+, Gd3+) into the host ceria matrix may result in an increase in oxygen vacancies (Vo) due to lattice distortion.10 These defects and oxygen vacancies (Vo) not only help to prevent coke deposition by enhancing oxygen ion mobility but also contribute to the low temperature activity of the catalyst.12,29,30
In order to create Vo sites, the addition of lower valence metal cations to the ceria matrix also enhances the interaction of the metal with the support by altering the physical and electronic characteristics of the parent oxides.30 Recently, we have reported partial oxidation of CH4 over the defect-rich Pt–Ni/CeO2 solid solution-based catalyst at low temperature. The solid solution enhances metal–support interaction, metal dispersion and oxygen vacancies, which are beneficial for the long-term stability of catalyst.29 Hydrogen production from hydrazine was proven by Kang et al. over a Ni/CeO2 catalyst made by the combustion method. They stated that the catalyst showed good activity and 100% selectivity of H2 at 50 °C, which is attributed to the altered physicochemical properties resulting from the formation of Ni–Ce–O solid solution.31
Low temperature DRM is advantageous from an industrial standpoint due to its low energy consumption. Hence, low temperature DRM is the focus of modern state-of-the-art catalyst design.32,33 This task might be easier if there is a huge amount of mobile oxygen/oxygen vacancies (Vo) and SMSI (strong metal–support interaction) available in the catalyst system. SMSI in catalysts can increase the adsorption of CH4/CO2, promoting low temperature activation of CH4/CO2 during DRM.34 Low temperature DRM over the defect-rich Pt/CeO2 was reported by Shen et al. They found an accelerated catalyst activity for the DRM reaction by the emergence of more facile oxygen mobility over the defects sites.12
The aim of the current study is devoted to developing a stable catalyst for low temperature DRM. Herein, we demonstrate an easy one-pot complex combustion technique using citric acid to synthesize Ni/CeO2, Pt/CeO2 (monometallic), and Pt–Ni/CeO2 (bimetallic) solid solution based catalysts. A detailed discussion about the performance of the catalysts was studied by comparing their electronic and structural properties. This research aims to provide a better understanding of the critical factors that need to be considered while designing an industrial DRM catalyst.
2. Experimental
2.1. Catalyst synthesis
The details of the materials used are given in the ESI† (SI-S1.1). The catalysts were synthesized by modifying our previously reported one-pot solution combustion method by using citric acid monohydrate (CA) as a complexing agent as well as fuel for combustion.29 In a typical preparation method, the desired amount of desired precursors [(Ce(NO3)3·6H2O), (Pt(NH3)4(NO3)2), (Ni(NO3)2·6H2O)] based on catalyst compositions were dissolved in the double distilled water to make a 0.1 M solution of total metal ions followed by the addition of 0.2 g polyvinyl pyrrolidine. The pH of the resultant solution was then adjusted to ∼4 using HNO3 with continuous stirring followed by the addition of 4–5 drops of hydrazine hydrate. After that, a dropwise addition of an aqueous solution of citric acid monohydrate was used for complexation under slow stirring. The molar concentration of citric acid monohydrate and total metal ion was 2![[thin space (1/6-em)]](https://www.rsc.org/images/entities/char_2009.gif) :
:![[thin space (1/6-em)]](https://www.rsc.org/images/entities/char_2009.gif) 1. The obtained solution was kept at 100 °C for 120 min under continuous stirring. Then, 50 ml ethanol was added to the above solution as a dispersant. Then, the resultant solution was heated for another 80 min at 50 °C, followed by evaporation using a rotavapor. After that, the obtained gel was dried on a hot plate at 100 °C until it became a spongy solid. Once the material turns into a spongy solid, the temperature of the hot plate is quickly set to 160 °C for the combustion process. After combustion, the resultant powder was cooled down naturally to ambient temperature and crushed into a fine powder for calcination. Calcination was carried out in a muffle furnace in the presence of air at 750 °C for 4 h. The final synthesized catalysts have been designated as NC (2%Ni/CeO2), PC (0.5%Pt/CeO2) and NPC (2%Ni–0.5%Pt/CeO2).
1. The obtained solution was kept at 100 °C for 120 min under continuous stirring. Then, 50 ml ethanol was added to the above solution as a dispersant. Then, the resultant solution was heated for another 80 min at 50 °C, followed by evaporation using a rotavapor. After that, the obtained gel was dried on a hot plate at 100 °C until it became a spongy solid. Once the material turns into a spongy solid, the temperature of the hot plate is quickly set to 160 °C for the combustion process. After combustion, the resultant powder was cooled down naturally to ambient temperature and crushed into a fine powder for calcination. Calcination was carried out in a muffle furnace in the presence of air at 750 °C for 4 h. The final synthesized catalysts have been designated as NC (2%Ni/CeO2), PC (0.5%Pt/CeO2) and NPC (2%Ni–0.5%Pt/CeO2).
2.2. Catalyst characterization
All the prepared catalysts have been thoroughly characterized before and after catalysis. The catalysts were deeply analyzed by N2-physisorption, TEM, CH4/CO2 TPD, XRD, Rietveld refinement, O2-TPD, XPS, TPR, CO chemisorption, Raman, TGA/DTG, and EPR analysis. The details of characterization techniques and procedures, including DFT method are given in the ESI.†2.3. Reaction setup and activity measurement
All reactions were carried out at atmospheric pressure. A fixed-bed down-flow microreactor equipped with a K-type thermocouple was used for all reactions, as reported in our previous paper.29 A detailed procedure is given in the ESI.†The following equations were used to obtain the conversions (eqn (1) and (2)), product selectivity (eqn (3) and (4)), syngas ratio (eqn (5)), and carbon balance (eqn (6)), respectively. For each experiment, a detailed carbon balance was performed, and the result was between 98 and 102%.
 | (1) |
 | (2) |
 | (3) |
 | (4) |
 | (5) |
 | (6) |
3. Results and discussion
3.1. Catalyst characterization
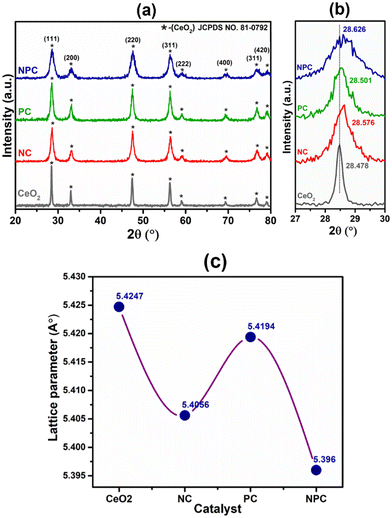
The powder X-ray diffraction patterns of the fresh CeO2 support, NC, PC, and NPC catalysts are displayed in Fig. 1(a). All the synthesized catalysts exhibit characteristic peaks of the face-centered cubic (space group – Fm3m) fluorite phase of CeO2 (JCPDS no. 81-0792).35,36 Besides the diffraction peaks attributed to CeO2, no other diffraction peaks attributed to Ni and Pt were identified in the XRD patterns of the fresh catalysts, which could be attributed to the small particle size, low loading, and highly dispersed Ni and Pt species.37 The broad diffraction patterns of the synthesized catalysts compared to pure CeO2 suggested a smaller crystallite size of the synthesized catalysts when compared to the pure CeO2 support.8 The Scherrer equation was used to determine the crystallite size of all the catalysts (Table S1†). Fig. 1(b) shows the slight shifting towards higher 2θ values corresponding to the (111) plane of CeO2, indicating lattice contraction in the CeO2 lattice, which arises from the replacement of some Ce4+ ions into the ceria lattice by Ni2+ and Pt2+/4+. The difference in ionic radii causes the lattice contraction, indicating the formation of solid solution in NC, PC and NPC catalysts.38,39All of the catalysts showed an obvious decrease in lattice parameters after incorporating the Ni (NC), Pt (PC), and Ni and Pt (NPC) metals into the CeO2 lattice (Fig. 1c).39 The decrease in lattice parameters follows the order: NPC > NC > PC. The NPC catalyst showed the maximum decrease among all the catalysts, suggesting a higher extent of solid solution formation. The crystallite size decreases as the lattice parameter decreases.38,40 Table S1† provides a detailed description of structural features corresponding to the (111) plane of CeO2 for all the catalysts. Fig. S1(a)† displays the powder X-ray diffraction pattern of the spent catalysts, which is identical to that of the fresh catalysts, except for a slight increase in intensity. Furthermore, Fig. S1(b)† displays the 2θ shifting with respect to the (111) plane after 100 h TOS stability. The 2θ shifting corresponding to the (111) plane after 100 h time-on stability remains almost the same as the fresh catalysts.
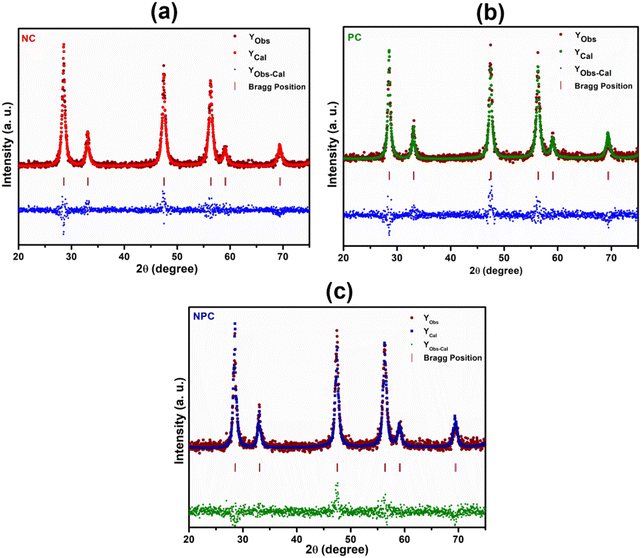
Rietveld refinement of the catalysts was performed to further validate the speculation of solid solution formation, as shown in Fig. 2. The reliability factors of the fit obtained by Rietveld refinement via the PROZSKI program are shown in Table S2.† The obtained low values of goodness-of-fit χ2 = Rwp/Rexp indicate excellent agreement between the refined models and the data.41 A drop in the lattice constant from 5.424 Å for undoped CeO2 to 5.396 Å (NPC), 5.4056 Å (NC) and 5.4194 Å (PC) confirms the insertion of Ni and Pt into the CeO2 lattice.
The TEM images and SAED pattern of the reduced NPC catalyst are shown in Fig. 3(a–c). The layered structure of ceria nanoparticles with their irregular shape and close contact with each other, can be seen in Fig. 3a.29 The particle size histogram (the inset of Fig. 3b) showed an average particle size of ∼2 nm. HR-TEM images (Fig. 3b) showed that the lattice fringes of Ni and Pt are separated with d-spacings of 0.208 and 0.23 nm, which are attributed to the (111) plane of Ni and Pt, respectively. The fast Fourier transform (FFT) of the corresponding particle can be seen in the inset of Fig. 3(b). The TEM images of the reduced NC and PC catalysts are shown in Fig. S2,† which are identical to the NPC catalyst. The lattice fringes of Ni in the NC catalyst and Pt in the PC catalyst are clearly separated by 0.208 and 0.23 nm, which are due to the (111) plane of Ni and Pt, respectively.
 | ||
| Fig. 3 High-resolution TEM images: (a) low magnifications, (b) high magnifications, (c) SAED pattern and (d) EDX pattern of the reduced NPC catalyst. | ||
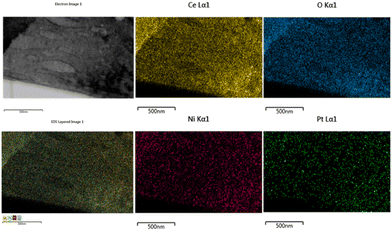
The EDX pattern of the NPC catalyst (Fig. 3d) validated the presence of Ce, Ni, Pt and O without any other impurities. Fig. 4 displays the elemental mapping of the NPC catalyst, which confirmed the homogeneous distribution of the Ce, O, Ni and Pt elements. NC and PC catalysts also showed (Fig. S3†) a homogeneous distribution of the elements. TEM images of all the spent samples after 100 h TOS are provided in Fig. S4,† which are the same for the NPC and PC catalysts, while the NC catalyst exhibited a noticeable coke deposition over the catalyst surface.
The surface area (SA) of the catalysts was estimated before and after catalysis, which is shown in Table S3.† The BET surface area of the spent NPC and PC catalysts showed a minimal decrease, indicating their good thermal stability, while NC catalysts showed a ∼40% decrease in the surface area of the fresh sample. The as-synthesized catalysts were characterized by ICP-AES to estimate the metal content of the catalysts, as shown in Table S3.† The result of ICP-AES shows that the elemental composition in all the catalysts is almost close to the nominal input values. The metal dispersion of all the catalysts was measured by the CO pulse chemisorption study. The PC catalyst showed a higher value of metal dispersion (∼71%) followed by NPC (62.8%) and NC (28.6%). The highly dispersive nature of platinum is accountable for the higher metal dispersion values in PC and NPC catalysts.29,42 We have calculated the particle size by HR-TEM and chemisorption analysis, which is given in Table S4.†
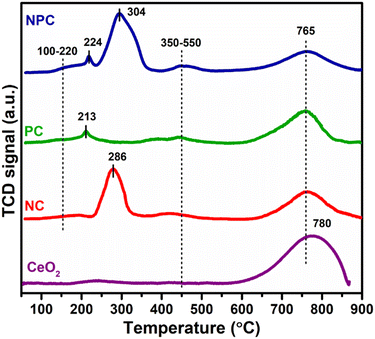
Fig. 5 displays the H2 temperature-programmed reduction patterns of the freshly prepared samples and undoped CeO2 support. In the reduction pattern of undoped CeO2, a shallow peak at 150–260 °C is attributed to the reduction of weakly adsorbed or readily available oxygen species whereas a broad peak at 600–860 °C is attributed to the reduction of bulk oxygen of the CeO2 support.43 The reduction pattern can be divided into two regions, (i) 100–550 °C and (ii) 550–900 °C, attributed to the reduction of surface oxygen species along with NiO and PtOx and bulk oxygen, respectively. In first region, all the catalysts exhibited a broad reduction pattern with some shoulder peaks. The first peak at 100–220 °C is attributed to the reduction of weakly adsorbed oxygen species over the catalyst surface. It has been reported that the incorporation of low-valent metal ions into the parent ceria lattice results in structural defects due to charge and size variation. As a consequence, numerous oxygen vacancies were generated into the ceria lattice because of charge unbalance and lattice distortion. These oxygen vacancies can adsorb the oxygen species easily, leading to the formation of active oxygen species, which can be reduced at low temperature.31,44,45 For NC and PC catalysts, the peak at 286 and 213 °C can be attributed to the reduction of oxygen species generated at the Pt and Ni interface and Pt and Ni oxides having strong metal–support interaction on the catalyst surface.29 These peaks shifted towards the higher side in the case of NPC catalyst, as illustrated in Fig. 5, suggesting the higher metal–support interaction in NPC catalyst. It is reported that the reduction of incorporated metal species into the ceria lattice becomes difficult. Therefore, reduction patterns become broader due to the consumption of H2 by the oxygen species engendered at the Ni/Pt interface along with Pt/Ni oxides.13,29 The shoulder peaks between 350 and 550 °C can be associated with the hydrogen consumption for the surface active oxygen species at the interface of Ce3+/Ce4+.29
Table 1 provides the comparative H2-consumption study between surface oxygen (350–550 °C) and bulk oxygen species (600–860 °C) for all the synthesized catalysts. Pure CeO2 showed the lowest H2-consumption (1.3 μmol g−1) for surface active oxygen species and the highest H2-consumption for bulk oxygen (108.4 μmol g−1). The NPC catalyst showed a higher H2-consumption (13.2 μmol g−1) for surface active oxygen species followed by the NC (8.4 μmol g−1) and PC (5.1 μmol g−1) catalysts. The higher H2-consumption for NPC catalysts might be associated with the higher number of oxygen vacancies, as confirmed by the XRD, Raman and XPS analysis. On the other hand, the trend for H2-consumption for bulk oxygen species showed the reverse order as: PC (63.0 μmol g−1) > NC (51.8 μmol g−1) > NPC (34.0 μmol g−1). The obtained trends for H2-consumption confirm that the NPC catalyst has more surface-active oxygen species and less bulk oxygen species compared to the NC and PC catalysts.
| Catalyst | H2 consumption for surface active oxygen species (350–550 °C) (μmol g−1) | H2 consumption for bulk oxygen species (600–900 °C) (μmol g−1) |
|---|---|---|
| CeO2 | 1.3 | 108.4 |
| NC | 8.4 | 51.8 |
| PC | 5.1 | 63.0 |
| NPC | 13.2 | 34.0 |
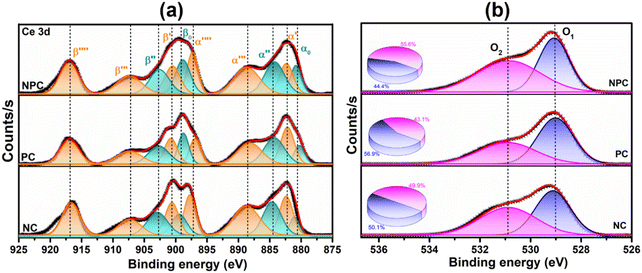
XPS spectra were employed to investigate the electronic speciation and the chemical state of Ce, Ni, Pt, and O within the catalysts, based on information obtained from the values of binding energies. Fig. 6a displays the extended form of Ce 3d XPS spectra, showing the existence of both Ce4+ and Ce3+ on the catalyst surface. The spectra can be deconvoluted into 10 peaks attributed to 3d3/2 and 3d5/2 components.46 The five peaks, α0 (881.3 eV), α′ (883.1 eV), α′′ (885.3 eV), α′′′ (889.2 eV), and α′′′′ (897.8 eV) are attributed to 3d5/2 and the remaining five peaks β0 (899.4 eV), β′ (901.2 eV), β′′ (903.1 eV), β′′′ (907.8 eV), and β′′′′ (917 eV) are attributed to the 3d3/2 region.29,46 The peaks designated as α0, α′′, β, and β′′ are due to the Ce3+ species, whereas the peaks designated as β′, β′′′, β′′′′ α′, α′′′, and α′′′′ are due to the Ce4+ species.47,48 The equation below can be used to calculate the amount of surface Ce3+ (Ce(III)%).46,48
Fig. 6b displays the deconvoluted O 1s XPS spectra of all the prepared catalysts, where two types of surface oxygen can be seen. The peaks at 529.1 (O1) and 531.2 eV (O2) are ascribed to the lattice oxygen and oxygen vacancies (Vo), respectively.8,46,49 The proportion of O2/O2 + O1 can be used to determine the concentration of surface oxygen vacancies, which is determined by using the integrated areas of the corresponding peak. The proportion of O2/O2 + O1 follows the order: NPC (55.6%) > NC (49.9%) > PC (43.1%), which is consistent with the surface Ce3+ concentration. The oxygen species (O2−, O22−) adsorbed on the vacancy sites are highly active in activating CH4/CO2 at low temperature and improving the stability of the catalyst by preventing coke deposition and forming CO.29,50
The Ni 2p and Pt 4f core level XPS spectra in extended form are shown in Fig. 7. The deconvoluted Ni 2p XPS spectra of the NC catalyst (Fig. 7a) confirmed the presence of Ni as Ni0 and Ni2+ having different surrounding environments, where the Ni2+ state is more pronounced. The peak at 853.0 eV is associated with Ni0 and peaks at 855.8 and 858.5 eV are associated with the Ni2+ state having an octahedral (NiOC2+) and tetrahedral (NiT2+) arrangement, respectively.29,45,51 The deconvoluted Pt 4f spectra of the PC catalyst (Fig. 7b) displayed the presence of Pt as in the Pt0 (71.2 and 74.7 eV) and Pt2+ (72.6 and 76.1 eV) state.12,37 The deconvoluted Pt 4f XPS spectra of the bimetallic NPC (Fig. 7d) and monometallic PC catalysts (Fig. 7b) are slightly different, which might be due to the close binding energy value of the Ni 3p (64–70.5 eV) and Pt 4f (70–80 eV) XPS spectra. A similar observation of the bimetallic catalyst was also reported by earlier researchers,52,53 including our own study.54 Additionally, the reduction profile of the NPC catalyst (TPR) does not show any evidence about the alloy formation. HR-TEM and XRD analysis also do not show any evidence about the alloy formation. Moreover, the XPS spectra of Ni in the bimetallic NPC (Fig. 7c) and monometallic NC catalyst (Fig. 7a) do not show any changes. So, the formation of alloy in the bimetallic NPC catalyst can be ruled out. The XPS spectra of Ce, O, Ni and Pt of the spent NPC catalyst are shown in Fig. S5(a–d),† which do not show any noticeable change in the spectra after DRM reaction, indicating the stable nature of the catalyst.
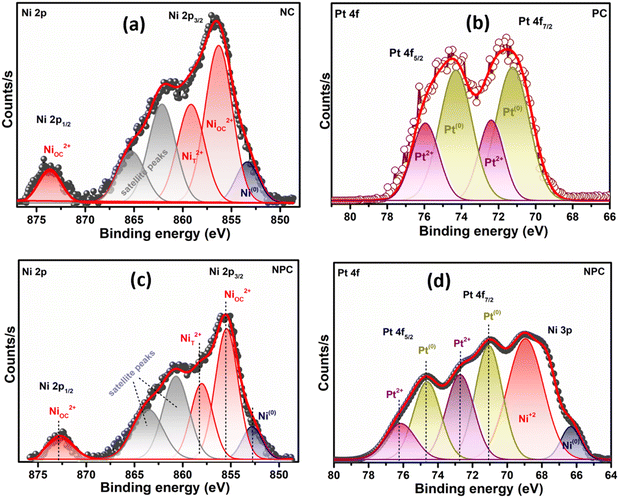 | ||
| Fig. 7 XPS spectra: (a) Ni 2p of the reduced NC catalyst, (b) Pt 4f of the reduced PC catalyst and (c and d) Ni 2p and Pt 4f of the reduced NPC catalyst. | ||
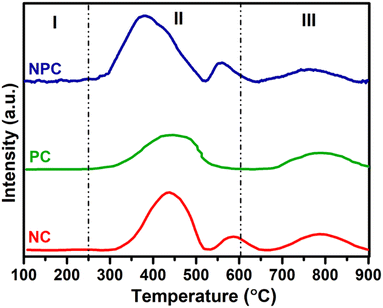
To gain a deep understanding of the characteristics of the oxygen sites, O2-TPD analysis was performed on all of the synthesized samples, as illustrated in Fig. 8. The O2-TPD pattern for all the catalysts can be divided into three parts. According to previous studies, the desorption peaks up to 250 °C (type I) are attributed to the weakly bound surface oxygen species, whereas the range between 250 and 600 °C (type II) is associated with active oxygen species (O2−, O22−) adsorbed on oxygen vacancies and the range above 600 °C (type III) is associated with bulk oxygen (O2−).48,55,56 All the catalysts showed almost similar desorption patterns, where the maximum amount of O2 desorption takes place in the type II region, which is assigned for the active oxygen species formed by the insertion of Pt and Ni ions into the ceria lattice. They are beneficial for boosting the low temperature activation of CH4/CO2 and prevent catalyst deactivation against coking.30 The amount of the desorbed O2 in the type II region follows the order: NPC (29.0 μmol g−1) > NC (18.7 μmol g−1) > PC (12.0 μmol g−1). The amount of desorbed O2 can be calculated by using their integrated areas and the peaks corresponding to each region as illustrated in Table 2. The amount of desorbed O2 in O2-TPD follows the trend of oxygen vacancies calculated by O 1s XPS analysis.
| Catalyst | OII (250–600 °C) | OIII (<600 °C) | Total amount of desorbed O2 |
|---|---|---|---|
| NC | 18.7 | 6.2 | 24.9 |
| PC | 12.0 | 8.5 | 20.5 |
| NPC | 29.0 | 5.5 | 34.5 |
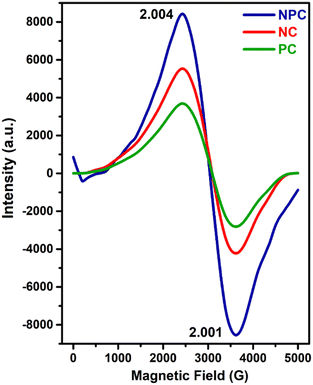
EPR spectroscopy is considered as a powerful tool to characterize any chemical species with unpaired electrons trapped on oxygen vacancies (Vo).57Fig. 9 displays the EPR spectra recorded for all the prepared catalysts. All the samples displayed two distinct axial signals having g values of 2.004 and 2.001 (Fig. 9), which are attributed to the electrophilic superoxide oxygen ions trapped on the oxygen vacancies.9,48,56 The oxygen vacancies can generally trap peroxide (O22−) and superoxide (O2−) oxygen species, but O22− species are EPR silent due to the lack of unpaired electrons.48,58 However, the intensities of the signals are different for all the catalysts. NPC catalysts had a higher intensity followed by NC and PC catalysts. The intensities of EPR spectra exhibit the amount of O2− ions present in the catalyst system, which agrees with the result of O2-TPD and O 1s XPS analysis.
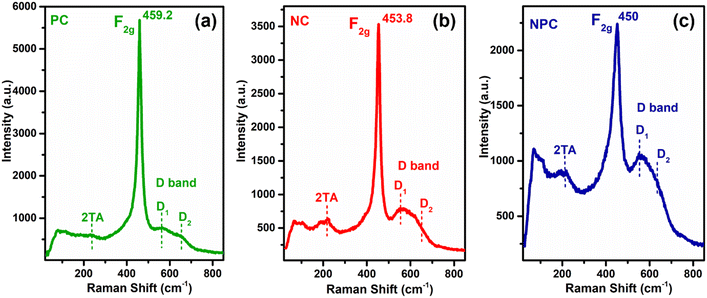
Raman spectroscopy was performed for all the catalysts to collect additional structural information about defects and lattice distortion in oxide catalysts. Fig. 10 displays the Raman spectra of all the catalysts before the reaction. All the catalysts showed a typical F2g band, which is an obvious band of the fcc fluorite CeO2 structure due to the symmetrical stretching of the oxygen atom surrounding the cation of the Ce–O8 unit. This F2g band in undoped CeO2 generally appeared at 462–466 cm−1.29,42,55 A noticeable shift towards a lower frequency tail and peak broadening was observed after incorporation of Ni/Pt into the parent CeO2 lattice (Fig. S6† for pure CeO2). These results may be attributed to the increase in lattice strain and topological defects arising from the incorporation of low valent cations (Ni and Pt) into the ceria lattice.59 This type of shift in the F2g band is more prominent in NPC (450 cm−1) followed by NC (453.8 cm−1) and PC (459.2 cm−1). The intensities of the F2g bands decrease in the order: NPC > NC > PC. The shifting of the F2g band towards the lower side follows a similar trend to a decrease in lattice parameters for all the catalysts. NPC catalysts have a maximum decrease in the lattice parameter and higher shifting towards the lower wavenumber and broadening in the F2g band. After incorporating active metals, all the catalysts exhibited a weak band at ∼220 cm−1 and a noticeable broad band ranging between 500 and 700 cm−1. These bands are associated with the 2TA (second-order transverse acoustic) and defect-induced (D) mode of ceria,10,46 which displayed a defective lattice having oxygen vacancies,10,60 generated by the charge variation after forming a solid solution.37
The defect-induced (D) band can be divided into two components, D1 and D2, as illustrated in Fig. 10. The components at ∼550 and ∼630 cm−1 marked as D1 and D2 are attributed to oxygen vacancies generated by the replacement of Ce4+ by Ni2+/Pt2+ (extrinsic defects) and Ce3+ (intrinsic defects), respectively.57,61 The ratio of the integrated areas of D and F2g bands (AD/AF2g) can be used to quantify the oxygen vacancies within the catalysts. The ratio of AD/AF2g follows the order: NPC (0.58) > NC (0.43) > PC (0.26). The ratio of AD/AF2g is similar to that of the reactive oxygen species estimated by O2-TPD.
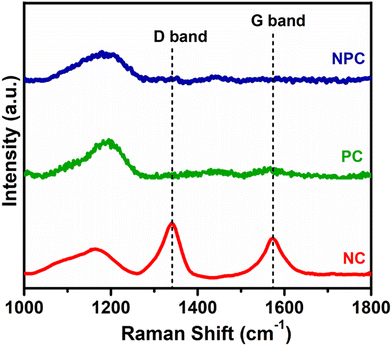
Fig. 11 displays the Raman spectra of the spent catalyst after 100 h of reaction to illustrate the type of coke deposited over the catalyst surface. The Raman spectra of PC and NPC catalysts do not exhibit any bands attributed to coke, while the NC catalyst exhibited both D and G bands, as displayed in Fig. 11. The D band at ∼1341 cm−1 is associated with disordered/amorphous carbon, while the G band at ∼1573 cm−1 is associated with ordered or graphitic carbon.8,57 However, the D band is more intense than the G band, indicating that the deposition of amorphous carbon is more likely on the NC catalyst rather than graphitic carbon.29,62 Moreover, all the catalysts exhibited one broader peak at 1000–1200 cm−1, which is due to the presence of superoxide (O2−) species.56 The presence of O2− ions in all the catalysts was also supported by the room temperature EPR analysis.9,48
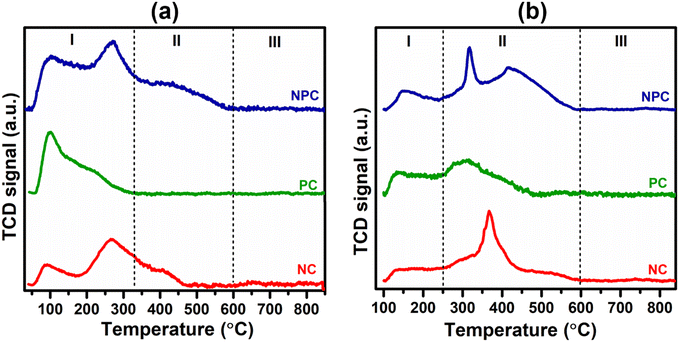
The chemisorption properties of the synthesized samples were examined by CH4/CO2 TPD and are displayed in Fig. 12. The CH4/CO2 pattern can be classified into three regions, which are assigned to the weak (I), moderate (II), and strong (III) adsorption region, respectively.12,16,63 From Fig. 12(a) and (b), it can be seen that the CH4 adsorption is stronger in the weak (I) region, whereas CO2 adsorption is stronger in the moderate region, indicating that there is a different mechanism for CO2 and CH4 activation, respectively.12 The moderate adsorption region of CO2 can be due to the extrinsic defects arising from incorporating Pt and Ni into the ceria lattice. The weak and moderate region of CO2 adsorption can be favourable for the stable DRM reaction as the strong adsorption region may favour coke deposition. The total CH4/CO2 adsorption can be calculated by using their integrated peak areas, as given in Table S5.† The total CH4 adsorption follows the order: NPC (43.3 μmol g−1) > NC (24.1 μmol g−1) > PC (20.5 μmol g−1), which is similar to the trend of the active oxygen species estimated by O2-TPD analysis. On comparing the CH4 adsorption in the weak region between the monometallic catalysts, it was noticed that the PC catalyst has higher CH4 adsorption (20.8 μmol g−1) than the NC catalyst (16.5 μmol g−1), suggesting that the PC catalyst is more active towards CH4 activation than the NC catalyst. The total CO2 adsorption follows the order: NPC (31.6 μmol g−1) > NC (23.7 μmol g−1) > PC (14.2 μmol g−1).
3.2. Catalytic performance
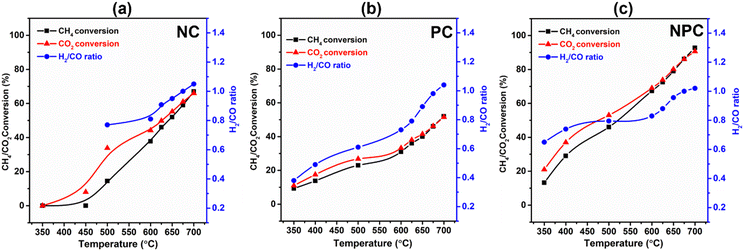
The catalytic performance of the prepared samples was tested for the DRM reaction. Table S6† provides a comparative analysis of the previously published literature and our work. Fig. 13(a–c) shows the temperature effect on the CH4/CO2 conversion and H2/CO ratio over the NC, PC and NPC catalysts, respectively. The conversion of CH4/CO2 increases gradually with increasing temperature, as DRM is endothermic in nature.6,8,12 NPC and PC catalysts can activate CH4/CO2 at 350 °C, while NC catalysts activate CH4 above 450 °C. It is reported that Pt can activate methane at low temperature by lowering the ignition temperature of CH4.23 At low temperature, the CO2 conversion was found to be higher than the CH4 conversion, which may be due to the RWGS and methanation reactions.8 The RWGS reaction decreases the H2/CO ratio from the anticipated value for DRM.16 As the temperature increases, the CH4 and CO2 conversion come close to each other, and at 675 °C, all the catalysts showed almost equal CH4/CO2 conversion, indicating that at this temperature, the effect of RWGS and methane cracking reactions is negligible and the H2/CO ratio becomes one. On further increase in temperature (above 675 °C), the H2/CO ratio increases slightly, which may be due to the methane cracking at higher temperatures (>650–680 °C).6,46The monometallic catalysts (NC and PC) showed a significantly lower conversion of CH4/CO2 than the bimetallic (NPC) catalyst. At 675 °C, the conversion follows the same trend as the AD/AF2g ratio estimated by Raman analysis. The NPC catalyst had a higher conversion of CH4/CO2 (∼86%) followed by NC (∼58.9%) and PC (∼46.2%). If we compare the syngas selectivity of the monometallic catalyst at a temperature (below 650 °C), the NC catalyst shows higher selectivity towards syngas than the PC catalyst. Thus, it was observed that PC catalysts could lower the ignition temperature and NC catalysts had good selectivity towards syngas as reported in the previous literature.23 Hence, NPC catalysts showed the mixed behaviour of NC and PC catalysts having good selectivity as well as activity. The obtained results were also supported with the findings of DFT calculation.
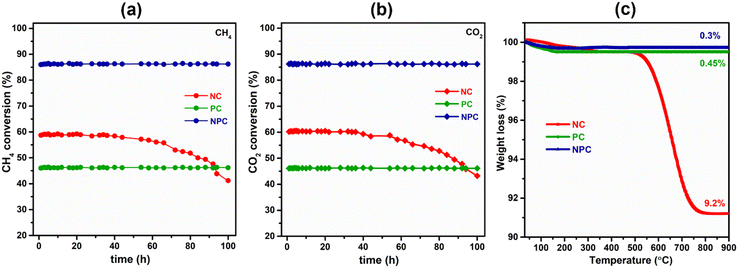
Fig. 14(a) and (b) show the effect of 100 h TOS study over all the synthesized catalysts. The TOS study was carried out at an optimum temperature (675 °C) and GHSV (50![[thin space (1/6-em)]](https://www.rsc.org/images/entities/char_2009.gif) 000 mL h−1 g−1) rate. From Fig. 14(a and b), we can see that the PC and NPC catalysts do not show any deactivation throughout the reaction, whereas the NC catalyst exhibited an ∼23% drop in its initial activity due to the coke deposition and sintering of Ni nanoparticles, as shown in TEM and RAMAN analysis of the spent catalyst.14 On the other hand, in the case of PC and NPC catalysts, the sintering and coke-resistant properties of Pt prevent their deactivation against coking and sintering. Fig. 14(c) shows the weight loss of the spent catalyst (100 h) as a function of temperature. The NC catalyst exhibited about 9.2% weight loss, whereas PC and NPC catalysts showed excellent resistivity towards coke deposition. The stability test (24 h) of the NPC catalyst was also performed by using an undiluted feed (CH4
000 mL h−1 g−1) rate. From Fig. 14(a and b), we can see that the PC and NPC catalysts do not show any deactivation throughout the reaction, whereas the NC catalyst exhibited an ∼23% drop in its initial activity due to the coke deposition and sintering of Ni nanoparticles, as shown in TEM and RAMAN analysis of the spent catalyst.14 On the other hand, in the case of PC and NPC catalysts, the sintering and coke-resistant properties of Pt prevent their deactivation against coking and sintering. Fig. 14(c) shows the weight loss of the spent catalyst (100 h) as a function of temperature. The NC catalyst exhibited about 9.2% weight loss, whereas PC and NPC catalysts showed excellent resistivity towards coke deposition. The stability test (24 h) of the NPC catalyst was also performed by using an undiluted feed (CH4![[thin space (1/6-em)]](https://www.rsc.org/images/entities/char_2009.gif) :
:![[thin space (1/6-em)]](https://www.rsc.org/images/entities/char_2009.gif) CO2 – 1
CO2 – 1![[thin space (1/6-em)]](https://www.rsc.org/images/entities/char_2009.gif) :
:![[thin space (1/6-em)]](https://www.rsc.org/images/entities/char_2009.gif) 1) under optimized conditions (temperature – 675 °C and GHSV – 50
1) under optimized conditions (temperature – 675 °C and GHSV – 50![[thin space (1/6-em)]](https://www.rsc.org/images/entities/char_2009.gif) 000 mL h−1 g−1) and is shown in Fig. S7(a–c).† The catalyst showed about ∼84% conversion of CH4 and CO2 with a H2/CO ratio equal to unity. We do not observe any loss in the activity and inconsistency in H2/CO throughout the 24 h of DRM reaction.
000 mL h−1 g−1) and is shown in Fig. S7(a–c).† The catalyst showed about ∼84% conversion of CH4 and CO2 with a H2/CO ratio equal to unity. We do not observe any loss in the activity and inconsistency in H2/CO throughout the 24 h of DRM reaction.
3.3. DFT results
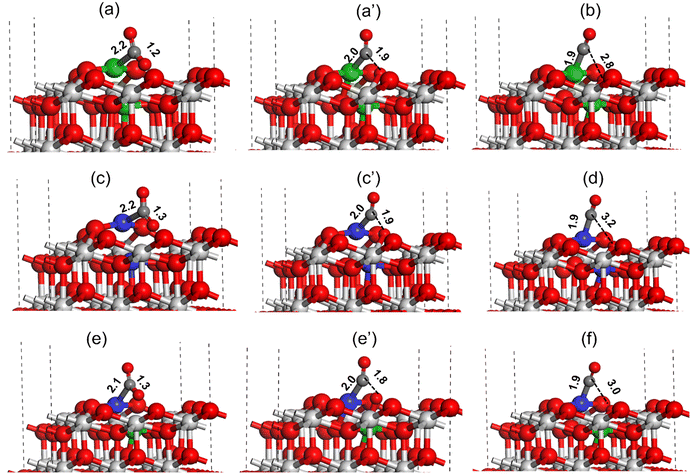
For high activity and selectivity in the DRM reaction, CO2 and CH4 activation are two crucial steps. DFT calculations were performed to understand the CO2 and CH4 activation for all the catalysts using the (111) surface.The CO2 activation at the oxygen vacancy near the catalyst active site is shown in Fig. 15. The CO2 molecule binds strongly at the Ni metal present at the Ni–CeO2(111) catalyst active site forming a Ni–C bond (2.2 Å, Fig. 15(a)). During the CO2 activation the C–O bond pointing toward the oxygen vacancy site increases from 1.2 Å in the adsorbed state to 1.9 Å in the transition state (TS), whereas the Ni–C bond shortens to 2.0 Å as shown in Fig. 15(a) and (a′). In the final state (Fig. 15c), the C–O bond was completely dissociated with the O atom filling the oxygen vacancy and CO adsorbed strongly on the Ni atom with the Ni–C bond measured to be 1.9 Å. The activation barrier for the CO2 dissociation at the Ni–CeO2(111) catalyst active site was calculated to be 32.9 kcal mol−1 (Table 3). Similarly, the CO2 activation was investigated over the Pt–CeO2(111) catalyst surface, as displayed in Fig. 15(c and d). The CO2 molecule binds strongly at the active site of Pt on the Pt–CeO2(111) surface, forming a Pt–C bond (2.2, Fig. 15(a)). During the CO2 activation, the C–O bond was elongated to 1.9 Å (Fig. 15(c′)) in the TS from the initial 1.3 Å (Fig. 15(c)) in the adsorbed state and was finally dissociated (C–O ∼ 3.2 Å, Fig. 15(d)). The Pt–C bond length in the TS and final state was measured to be 2.0 Å (Fig. 15(c′)) and 1.9 Å (Fig. 15(d)), respectively. The CO2 activation barrier over the Pt–CeO2(111) surface was calculated to be 36.5 kcal mol−1, which is 3.6 kcal mol−1 higher than the CO2 activation barrier obtained over the Ni–CeO2(111) surface. Fig. 15(e and f) depict CO2 activation on the bimetallic PtNi–CeO2(111) surface. Similar to monometallic surfaces, over the bimetallic PtNi–CeO2(111) surface, the CO2 molecule adsorbs on the Pt metal site forming a Pt–C bond (2.1 Å, Fig. 15(e)). During the CO2 activation, in the transition state, the C–O bond elongated to 1.8 Å (Fig. 15e′) from the initial 1.3 Å (Fig. 15e) and finally the C–O bond was dissociated (C–O ∼3.0 Å, Fig. 15f) with the O atom transferring to the oxygen vacancy site. The bond lengths of the Pt–C bonds in the TS and final state over the PtNi–CeO2(111) surface were calculated to be 2.0 (Fig. 15e′) and 1.9 (Fig. 15f), respectively. The CO2 activation barrier over the PtNi–CeO2(111) surface was calculated to be 10.1 kcal mol−1 (Table 3), which is 22.8 kcal mol−1 and 25.4 kcal mol−1 lower compared to the activation barrier obtained over the Ni–CeO2(111) and Pt–CeO2(111) surface indicating the synergistic effect of Ni and Pt for the DRM reaction. The DFT calculated CO2 activation barrier trend is: Pt–CeO2(111) > Ni–CeO2(111) ≫ NiPt–CeO2(111), where PtNi–CeO2(111) has lowest and the Pt–CeO2(111) surface has highest activation barrier for CO2 activation.
| Catalyst surface | E a (CO2) (kcal mol−1) | E a (CH4) (kcal mol−1) |
|---|---|---|
| Ni–CeO2(111) | 32.9 | 41.4 |
| Pt–CeO2(111) | 36.5 | 23.5 |
| PtNi–CeO2(111) | 10.1 | 34.2 |
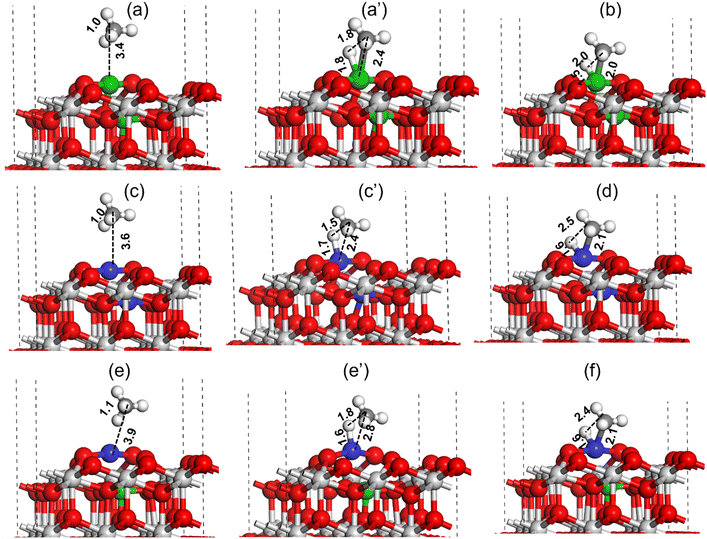
Similar to CO2 activation, the activation of CH4 is also important for the catalyst activity in the DRM reaction. The DFT method was used to investigate the C–H bond activation of CH4 over Pt–CeO2(111), Ni–CeO2(111), and NiPt–CeO2(111) catalyst surfaces, as shown in Fig. 16. For the Ni–CeO2(111) surface, the methane molecule physically adsorbs over the Ni metal site at a distance of 3.4 Å (Fig. 16(a)). During C–H bond activation of methane on the Ni metal site of Ni–CeO2(111) surface, as shown in Fig. 16 (a–c), the C–H bond was elongated from 1.0 Å (reactant state) to 1.8 Å (TS) and finally dissociated to CH3 + H (C–H ∼ 2.0 Å, Fig. 16(c)). Ni–H and Ni–C bond lengths at the transition state were calculated to be 1.8 and 2.4 Å, respectively, as illustrated in Fig. 16a′. The C–H activation barrier of CH4 over the Ni–CeO2(111) surface was measured to be 41.4 kcal mol−1. A similar C–H bond activation calculation performed over the Pt–CeO2(111) surface (Fig. 16(c and d)) revealed a much lower activation barrier of 23.5 kcal mol−1 (Table 3).
In the TS obtained over the Pt–CeO2(111) surface for C–H bond activation of CH4, the C–H, Pt–H and Pt–C bond lengths were measured to be 1.5, 1.7 and 2.4 Å, respectively (Fig. 16c′). The smaller C–H and Pt–H bond lengths indicate the higher stabilization of the TS resulting in lowering of the activation barrier. DFT calculation was also performed for methane C–H bond activation over the NiPt–CeO2(111) surface and is displayed in Fig. 16(e and f). The C–H, Pt–H, and Pt–C bond lengths in the transition state for methane C–H bond activation over the NiPt–CeO2(111) surface were measured to be 1.6 Å, 1.8 Å, and 2.8 Å, respectively. The methane C–H bond activation barrier over the PtNi–CeO2(111) surface was measured to be 34.2 kcal mol−1, which is 10.7 kcal mol−1 higher compared to the activation barrier obtained over the Pt–CeO2(111) surface but 7.2 kcal mol−1 lower than the activation barrier obtained over the Ni–CeO2(111) surface. The DFT calculated C–H bond activation barrier trend of methane is: Ni–CeO2(111) > PtNi–CeO2(111) > Pt–CeO2(111), where lowest and highest activation barriers were obtained for Pt–CeO2(111) and Ni–CeO2(111) surfaces, respectively.
CH4 activation was also studied at the Pt nanoparticles supported on the ceria support. The Pt nanoparticle supported on the ceria support was modeled by grafting the Pt6 nanocluster at the CeO2(111) surface, as has been shown in Fig. S8 (ESI†), where multiple Pt–O bonds are formed between the Pt6 cluster and CeO2(111) support. The activation barrier for the C–H bond over the Pt6–CeO2(111) surface was calculated to be 63.1 kcal mol−1, which is ∼40 kcal mol−1 higher compared to the C–H bond activation calculated for the Pt–CeO2(111) catalyst surface (Fig. 16, Table 3), indicating the Pt6 nanocluster grafted on the CeO2(111) surface to be less active for CH4 activation compared to the Pt–CeO2(111) surface model representing the Ptn+ species grafted in the CeO2 support matrix.
4. Conclusion
The solution combustion method has been used for synthesizing the 2%Ni/CeO2 (NC), 0.5%Pt/CeO2 (PC) and 2%Ni–0.5%Pt/CeO2 (NPC) solid solution based catalysts by using citric acid as a complexation agent. The catalytic performance of the synthesized catalysts was tested for methane dry reforming and a comparable study was carried out between monometallic and bimetallic catalysts. All synthesized catalysts exhibit decreases in their lattice parameter compared to the undoped ceria, which is associated with the formation of a solid solution, as confirmed by the XRD and Rietveld analysis. The extent of the solid solution follows the order: 2%Ni–0.5%Pt/CeO2 > 2%Ni/CeO2 > 0.5%Pt/CeO2. The extent of solid solution formation is linearly associated with the defect sites and active oxygen species, as confirmed by Raman and O2-TPD. The synergetic effect of Pt and Ni on the NPC catalysts alters the electronic and structural properties compared to the monometallic (NC/PC) catalyst. NPC catalysts exhibited strong metal–support interaction, defect-sites, and active oxygen species compared to the NC and PC catalyst. The strong metal–support interaction is beneficial for the adsorption of CH4/CO2 to a higher extent. The monometallic catalysts are less active individually compared to the bimetallic catalysts. At 675 °C, the activity of the catalyst follows the trend: 2%Ni–0.5%Pt/CeO2 (NPC) > 2%Ni/CeO2 (NC) > 0.5%Pt/CeO2 (PC). The 0.5%Pt/CeO2 catalyst is more active in lowering the methane light-off temperature, and the 2%Ni/CeO2 catalyst is found to be more selective for syngas. On the other hand, the 2%Ni–0.5%Pt/CeO2 catalyst exhibited the synergetic behaviour of both monometallic catalysts and showed remarkable activity and stability without any deactivation up to 100 h of stability test. So, it can be concluded that a combination of Pt and Ni based catalysts might be a breakthrough in DRM due to the trade-off between the cost and life span of catalysts for their potential application in industry.Author contributions
Rubina Khatun – design and performing experiments of the research work, manuscript writing; Nazia Siddiqui, Rohan Singh Pal, Sonu Bhandari, Mukesh Kumar Poddar contributed in catalyst characterization; Tuhin Suvra Khan – design and performing DFT studies; Chanchal Samanta contributed in catalyst characterization and manuscript writing; Rajaram Bal – conceptualization and design of the whole study, design of experiments of the research work, and manuscript correction.Conflicts of interest
The authors declare no conflicts of interest.Acknowledgements
R. K. thanks CSIR, New Delhi, India. R. S. P. and S. B. thank UGC, New Delhi, India, for fellowship support. TSK would like to acknowledge CSIR for the financial support in the form of the OLP-1180 project. The Director, CSIR-IIP, is acknowledged for his encouragement and help. The authors thank the Analytical Science Division, Indian Institute of Petroleum, for providing analytical support.References
- V. UNFCCC, Proposal by the President, 2015, vol. 282, p. 2 Search PubMed.
- J. Rogelj, M. Den Elzen, N. Höhne, T. Fransen, H. Fekete, H. Winkler, R. Schaeffer, F. Sha, K. Riahi and M. Meinshausen, Nature, 2016, 534, 631–639 CrossRef CAS PubMed.
- M. Li and A. C. van Veen, Appl. Catal., B, 2018, 237, 641–648 CrossRef CAS.
- T. G. de Araújo Moreira, J. F. S. de Carvalho Filho, Y. Carvalho, J. M. A. R. de Almeida, P. N. Romano and E. F. Sousa-Aguiar, Fuel, 2021, 287, 119536 CrossRef.
- R. Singha, A. Shukla, A. Sandupatla, G. Deo and R. Bal, J. Mater. Chem. A, 2017, 5, 15688–15699 RSC.
- M. Shah, S. Das, A. K. Nayak, P. Mondal and A. Bordoloi, Appl. Catal., A, 2018, 556, 137–154 CrossRef CAS.
- M. García-Diéguez, I. Pieta, M. Herrera, M. Larrubia and L. Alemany, Appl. Catal., A, 2010, 377, 191–199 CrossRef.
- N. Wang, W. Qian, W. Chu and F. Wei, Catal. Sci. Technol., 2016, 6, 3594–3605 RSC.
- Y. Zhang, Y. Zu, D. He, J. Liang, L. Zhu, Y. Mei and Y. Luo, Appl. Catal., B, 2022, 315, 121539 CrossRef CAS.
- D. Guo, Y. Lu, Y. Ruan, Y. Zhao, Y. Zhao, S. Wang and X. Ma, Appl. Catal., B, 2020, 277, 119278 CrossRef CAS.
- D. G. Araiza, D. G. Arcos, A. Gómez-Cortés and G. Díaz, Catal. Today, 2021, 360, 46–54 CrossRef CAS.
- D. Shen, Z. Li, J. Shan, G. Yu, X. Wang, Y. Zhang, C. Liu, S. Lyu, J. Li and L. Li, Appl. Catal., B, 2022, 318, 121809 CrossRef CAS.
- J. Yang, D. Gong, X. Lu, C. Han, H. Liu and L. Wang, Crystals, 2022, 12, 713 CrossRef CAS.
- H. Chen, S. Chansai, S. Xu, S. Xu, Y. Mu, C. Hardacre and X. Fan, Catal. Sci. Technol., 2021, 11, 5260–5272 RSC.
- M. Shah, A. Bordoloi, A. K. Nayak and P. Mondal, Fuel Process. Technol., 2019, 192, 21–35 CrossRef CAS.
- R. K. Singha, A. Yadav, A. Agrawal, A. Shukla, S. Adak, T. Sasaki and R. Bal, Appl. Catal., B, 2016, 191, 165–178 CrossRef CAS.
- M. A. A. Aziz, H. D. Setiabudi, L. P. Teh, M. Asmadi, J. Matmin and S. Wongsakulphasatch, Chem. Eng. Technol., 2020, 43, 661–671 CrossRef.
- S. R. de Miguel, I. M. J. Vilella, S. Maina, D. San José-Alonso, M. Román-Martínez and M. Illán-Gómez, Appl. Catal., A, 2012, 435, 10–18 CrossRef.
- Y. Mukainakano, K. Yoshida, S. Kado, K. Okumura, K. Kunimori and K. Tomishige, Chem. Eng. Sci., 2008, 63, 4891–4901 CrossRef CAS.
- W.-J. Cai, L.-P. Qian, B. Yue and H.-Y. He, Chin. Chem. Lett., 2014, 25, 1411–1415 CrossRef CAS.
- L. Bobadilla, V. Garcilaso, M. Centeno and J. Odriozola, J. CO2 Util., 2018, 24, 509–515 CrossRef.
- Y. H. Hu, in Advances in CO2 conversion and utilization, ACS Publications, 2010, pp. 155–174 Search PubMed.
- P. Corbo and F. Migliardini, Int. J. Hydrogen Energy, 2007, 32, 55–66 CrossRef CAS.
- J. Niu, Y. Wang, S. E. Liland, S. K. Regli, J. Yang, K. R. Rout, J. Luo, M. Rønning, J. Ran and D. Chen, ACS Catal., 2021, 11, 2398–2411 CrossRef CAS.
- V. M. Gonzalez-Delacruz, F. Ternero, R. Pereñíguez, A. Caballero and J. P. Holgado, Appl. Catal., A, 2010, 384, 1–9 CrossRef CAS.
- R. O. da Fonseca, A. R. Ponseggi, R. C. Rabelo-Neto, R. C. Simões, L. V. Mattos and F. B. Noronha, J. CO2 Util., 2022, 57, 101880 CrossRef CAS.
- S. Das, A. Jangam, S. Jayaprakash, S. Xi, K. Hidajat, K. Tomishige and S. Kawi, Appl. Catal., B, 2021, 290, 119998 CrossRef CAS.
- I. Luisetto, S. Tuti, C. Romano, M. Boaro, E. Di Bartolomeo, J. K. Kesavan, S. S. Kumar and K. Selvakumar, J. CO2 Util., 2019, 30, 63–78 CrossRef CAS.
- R. Khatun, S. Bhandari, M. K. Poddar, C. Samanta, T. S. Khan, D. Khurana and R. Bal, Int. J. Hydrogen Energy, 2022, 47, 38895–38909 CrossRef CAS.
- W. Shan, Z. Feng, Z. Li, J. Zhang, W. Shen and C. Li, J. Catal., 2004, 228, 206–217 CrossRef CAS.
- W. Kang and A. Varma, Appl. Catal., B, 2018, 220, 409–416 CrossRef CAS.
- Y. Wang, L. Yao, S. Wang, D. Mao and C. Hu, Fuel Process. Technol., 2018, 169, 199–206 CrossRef CAS.
- B. M. Al-Swai, N. B. Osman, A. Ramli, B. Abdullah, A. S. Farooqi, B. V. Ayodele and D. O. Patrick, Int. J. Hydrogen Energy, 2021, 46, 24768–24780 CrossRef CAS.
- F. Zhang, R. A. Gutiérrez, P. G. Lustemberg, Z. Liu, N. Rui, T. Wu, P. J. Ramírez, W. Xu, H. Idriss and M. V. Ganduglia-Pirovano, ACS Catal., 2021, 11, 1613–1623 CrossRef CAS PubMed.
- R. K. Singha, S. Ghosh, S. S. Acharyya, A. Yadav, A. Shukla, T. Sasaki, A. M. Venezia, C. Pendem and R. Bal, Catal. Sci. Technol., 2016, 6, 4601–4615 RSC.
- T. Sagar, D. Padmakar, N. Lingaiah and P. Sai Prasad, Catal. Lett., 2019, 149, 2597–2606 CrossRef CAS.
- H.-H. Liu, Y. Wang, A.-P. Jia, S.-Y. Wang, M.-F. Luo and J.-Q. Lu, Appl. Surf. Sci., 2014, 314, 725–734 CrossRef CAS.
- A. Miri, M. Sarani and M. Khatami, RSC Adv., 2020, 10, 3967–3977 RSC.
- Y. Li, B. Zhang, X. Tang, Y. Xu and W. Shen, Catal. Commun., 2006, 7, 380–386 CrossRef CAS.
- F. Abbas, T. Jan, J. Iqbal, I. Ahmad, M. S. H. Naqvi and M. Malik, Appl. Surf. Sci., 2015, 357, 931–936 CrossRef CAS.
- T. Herminio, M. R. Cesário, V. D. Silva, T. A. Simões, E. S. Medeiros, D. A. Macedo, H. L. Tidahy, C. Gennequin and E. Abi-Aad, Environ. Chem. Lett., 2020, 18, 895–903 CrossRef CAS.
- R. Singha, A. Shukla, A. Yadav, T. Sasaki, A. Sandupatla, G. Deo and R. Bal, Catal. Sci. Technol., 2017, 7, 4720–4735 RSC.
- Q. Dongsheng, L. Guanzhong, G. Yun, W. Yanqin and G. Yanglong, J. Rare Earths, 2010, 28, 742–746 CrossRef.
- Z. Bian, Y. M. Chan, Y. Yu and S. Kawi, Catal. Today, 2020, 347, 31–38 CrossRef CAS.
- W. Shan, M. Fleys, F. Lapicque, D. Swierczynski, A. Kiennemann, Y. Simon and P.-M. Marquaire, Appl. Catal., A, 2006, 311, 24–33 CrossRef CAS.
- Z. Hu, X. Liu, D. Meng, Y. Guo, Y. Guo and G. Lu, ACS Catal., 2016, 6, 2265–2279 CrossRef CAS.
- X. Zhou, J. Ling, W. Sun and Z. Shen, J. Mater. Chem. A, 2017, 5, 9717–9722 RSC.
- R. S. Pal, S. Rana, S. K. Sharma, R. Khatun, D. Khurana, T. S. Khan, M. K. Poddar, R. Sharma and R. Bal, Chem. Eng. J., 2023, 141379 Search PubMed.
- Y.-L. Lee, A. Mnoyan, H.-S. Na, S.-Y. Ahn, K.-J. Kim, J.-O. Shim, K. Lee and H.-S. Roh, Catal. Sci. Technol., 2020, 10, 6299–6308 RSC.
- D.-W. Jeong, W.-J. Jang, H.-S. Na, J.-O. Shim, A. Jha and H.-S. Roh, J. Ind. Eng. Chem., 2015, 27, 35–39 CrossRef CAS.
- R.-P. Ye, Q. Li, W. Gong, T. Wang, J. J. Razink, L. Lin, Y.-Y. Qin, Z. Zhou, H. Adidharma and J. Tang, Appl. Catal., B, 2020, 268, 118474 CrossRef CAS.
- P. Sudhakar and A. Pandurangan, J. Porous Mater., 2018, 25, 747–759 CrossRef CAS.
- M. García-Diéguez, I. Pieta, M. Herrera, M. Larrubia and L. Alemany, J. Catal., 2010, 270, 136–145 CrossRef.
- R. Khatun, S. Bhandari, M. K. Poddar, C. Samanta, T. S. Khan, D. Khurana and R. Bal, Int. J. Hydrogen Energy, 2022, 38895–38909 CrossRef CAS.
- Q. Li, Z. Yan, N. Wang, Z. Xu, G. Wang and G. Huang, Catal. Sci. Technol., 2020, 10, 4030–4041 RSC.
- J. Xu, R. Xi, Q. Xiao, X. Xu, L. Liu, S. Li, Y. Gong, Z. Zhang, X. Fang and X. Wang, J. Catal., 2022, 408, 465–477 CrossRef CAS.
- C. Rotaru, G. Postole, M. Florea, F. Matei-Rutkovska, V. Pârvulescu and P. Gelin, Appl. Catal., A, 2015, 494, 29–40 CrossRef CAS.
- R. S. Pal, S. Rana, S. Sadhu, T. S. Khan, M. K. Poddar, R. K. Singha, S. Sarkar, R. Sharma and R. Bal, Energy Adv., 2023, 180–197 RSC.
- S. O. Omarov, K. D. Martinson, A. N. Matveyeva, M. I. Chebanenko, V. N. Nevedomskiy and V. I. Popkov, Fuel Process. Technol., 2022, 236, 107429 CrossRef CAS.
- S. Loridant, Catal. Today, 2021, 373, 98–111 CrossRef CAS.
- M. Daniel and S. Loridant, J. Raman Spectrosc., 2012, 43, 1312–1319 CrossRef CAS.
- Z. Xie, B. Yan, J. H. Lee, Q. Wu, X. Li, B. Zhao, D. Su, L. Zhang and J. G. Chen, Appl. Catal., B, 2019, 245, 376–388 CrossRef CAS.
- J. M. García-Vargas, J. L. Valverde, F. Dorado and P. Sánchez, J. Mol. Catal. A: Chem., 2014, 395, 108–116 CrossRef.
Footnote |
| † Electronic supplementary information (ESI) available. See DOI: https://doi.org/10.1039/d3cy00600j |
| This journal is © The Royal Society of Chemistry 2023 |

