Methane activation with nitric oxide at low temperatures on supported Pt catalysts: effects of the support†
Nobuya
Suganuma
a,
I. Tyrone
Ghampson
 a,
Hiroki
Miura
 acd,
Junichi
Murakami
 e,
Kyoko K.
Bando
 e,
Tetsuya
Kodaira
 f,
Tatsuya
Yamasaki
b,
Atsushi
Takagaki
 g,
Tatsumi
Ishihara
 b and
Tetsuya
Shishido
 *acd
*acd
aDepartment of Applied Chemistry for Environment, Graduate School of Urban Environmental Sciences, Tokyo Metropolitan University, 1-1 Minami-osawa, Hachioji, Tokyo 192-0397, Japan. E-mail: shishido-tetsuya@tmu.ac.jp
bDepartment of Applied Chemistry, Faculty of Engineering, Kyushu University, Fukuoka 819-0395, Japan
cResearch Center for Hydrogen Energy-Based Society, Tokyo Metropolitan University, 1-1 Minami-Osawa, Hachioji, Tokyo 192-0397, Japan
dElements Strategy Initiative for Catalysts & Batteries, Kyoto University, Goryo, Nishikyo-ku, Kyoto 615-8520, Japan
eNanomaterials Research Institute, National Institute of Advanced Industrial Science and Technology (AIST), Central 5, 1-1-1 Higashi, Tsukuba, Ibaraki 305-8565, Japan
fResearch Institute for Chemical Process Technology, National Institute of Advanced Industrial Science and Technology (AIST), Central 5, 1-1-1 Higashi, Tsukuba, Ibaraki 305-8565, Japan
gDivision of Materials and Chemical Engineering, Faculty of Engineering, Yokohama National University, 79-5 Tokiwadai, Hodogaya-ku, Yokohama, Kanagawa 240-8501, Japan
First published on 3rd June 2023
Abstract
Platinum nanoparticles supported on various metal oxides (MgO, (θ + γ)-Al2O3, SiO2, TiO2, Y2O3, ZrO2, and CeO2) were examined for the catalytic activation of methane with nitric oxide at low temperatures (300–400 °C) and atmospheric pressure. The catalysts exhibited similar levels of CH4 and NO conversion, except for those supported on the basic oxides (MgO and Y2O3). Notably, hydrogen cyanide (HCN), a widely used chemical intermediate, was detected in an appreciable amount only on the (θ + γ)-Al2O3-supported Pt catalyst. A more detailed comparison of the Pt nanoparticles dispersed on SiO2, TiO2, and (θ + γ)-Al2O3 indicated that the difference in the catalytic behavior for C–N coupling was not related to the electronic and geometric properties of Pt, but rather stems from the relative concentrations of adsorbed CHx and NO species. A combination of reactivity and in situ spectroscopic results suggest that a much higher surface concentration of NO relative to CHx may be responsible for the easier reduction of NO to form N2 and N2O on Pt/SiO2 and Pt/TiO2. Along the same vein, comparable concentrations of NO and CHx may be responsible for the formation of HCN on Pt/(θ + γ)-Al2O3. A further comparison of Pt catalysts supported on Al2O3 with different crystal structures (α-Al2O3, θ-Al2O3, (θ + γ)-Al2O3, and γ-Al2O3) confirmed the favorable properties of Al2O3 in HCN formation, although a preponderance of surface acidic OH groups on the supports promoted subsequent hydrolysis of HCN to NH3.
1. Introduction
In recent years, expansion of the production and use of unconventional resources (methane hydrate, shale gas, and shale oil) along with improvements in mining technologies (the shale revolution) has had a significant impact on the global production and consumption of natural gas.1 The global primary energy share over the past 20 years shows a decline in the share of conventional crude oil and a steady increase in the share of natural gas and renewable energy due, in part, to an increasing trend towards decarbonization.2 Methane (CH4), the main component of natural gas, is an abundant resource with a high hydrogen–carbon ratio and low carbon dioxide (CO2) emissions per energy production, making it an excellent energy resource and a viable alternative carbon source to petroleum.3 Industrially, CH4 is used as a feedstock for the production of fuels and chemicals via indirect routes which involve an initial conversion to synthesis gas by steam reforming reaction and subsequent transformation to desired products. However, the steam reforming reaction is a highly endothermic process, requiring temperatures ≥800 °C, and hence the indirect processes are energy-intensive. Realization of a more direct and selective conversion of CH4 to useful products under mild conditions is desirable and has been the focus of intensive research.4–7Among the direct conversion technologies, the conversion of CH4 to hydrogen cyanide (HCN) has the potential to contribute to the diversification of methane resources. HCN is a useful chemical product in high demand as a raw material for fuels, agricultural chemicals, pharmaceuticals, polymers, etc.8,9 It is produced industrially either as a byproduct of the synthesis of acrylonitrile using propylene (Standard Oil of Ohio (SOHIO) method)10 or via ammoxidation of CH4 with oxygen (Andrussow process)11 or without oxygen (Blausäure, Methan and Ammoniak, BMA process).12,13 The stand-alone Andrussow and BMA processes proceed on Pt-based catalysts at temperatures above 1000 °C.13 There are economic and energy conservation incentives to decrease temperature either through modification of the industrial processes or via development of novel reactions at mild conditions. In that regard, Yi and coworkers have reported the synthesis of HCN from the reaction of CH4 and NH3 (BMA process) on Pt (ref. 14) and Cu (ref. 15) catalysts at 400 °C by utilizing non-thermal plasma (NTP) to activate CH4 and NH3 into radical species. Alternatively, HCN was produced through a catalytic reaction of CH4 and nitric oxide (NO) at 300–425 °C on alumina-supported Pt catalyst.16 This alternative process produced HCN at comparatively higher turnover frequency (TOF) than the plasma-assisted processes, and also formed environmentally benign N2 as well as industrially useful feedstock, such as NH3 and N2O. The study also found through examination of other noble metal catalysts (Ru, Pd, and Rh) that HCN was formed only on Pt, a behavior which was explained by its resistance to transformation to bulk oxide. Hence, additional studies have dealt exclusively with Pt-based catalysts, in which the effect of particle size17 and state of Pt (ref. 18) on reactivity have been investigated, but not the effect of support.
The nature of the catalyst support has been found to exert a significant influence on CH4 oxidation19–22 and NO reduction23,24 reactions. In particular, acid–base properties have been shown to affect reactive intermediates and, as a consequence, the reaction products. In this paper, a series of metal oxides were used to investigate the effect of support on methane activation using NO as the oxidant over Pt catalysts. It will be shown that, aside from basic oxides, the support does not have a strong influence on catalytic activity at high temperatures. Furthermore, it is found that the Al2O3 support possesses properties favorable for HCN formation and, thus, special attention is placed on investigating the role of surface hydroxyls on Al2O3 with different crystal structures. It has been reported that surface hydroxyls and crystalline structure have strong influence on the dispersion of Pt on Al2O3 and, consequently, catalytic activity.25 In this work, it will be shown that surface hydroxyls also impacted productivity of HCN.
2. Experimental
2.1 Materials
The supports used for catalyst preparation were α-Al2O3, purchased from FUJIFILM Wako Pure Chemical Corp., γ-Al2O3 (JRC-ALO-9) and θ-Al2O3 (JRC-ALO-10), acquired from Nippon Light Metal Holdings Co., Ltd., (θ + γ)-Al2O3 (AKP-G15; JRC-ALO-8 equiv.; Sumitomo Chemical Co., Ltd.), SiO2 (JRC-SIO-10; Sumitomo Chemical), TiO2 (JRC-TIO-15; Nippon Aerosil Co., Ltd.), ZrO2 (JRC-ZRO-7; Daiichi Kigenso Kagaku-Kogyo Co., Ltd.) and CeO2 (JRC-CEO-1; Nikki-Universal Co., Ltd.), all obtained from the Catalysis Society of Japan. The other chemicals used were Mg(OH)2 (>95.0%), Y(NO3)3·nH2O (99.9%), aqueous NH3 solution (28%), and H2PtCl6·6H2O (>98%), all purchased from FUJIFILM Wako Pure Chemical Corp. All the gases used were purchased from Taiyo Nippon Sanso JFP Corp.2.2 Catalyst preparation
The commercial supports were calcined at 500 °C for 3 h in flowing air prior to use. The MgO support was obtained by calcining Mg(OH)2 at 500 °C for 3 h in air. The Y2O3 support was prepared by a precipitation method, whereby a quantity of Y(NO3)3·nH2O was dissolved in 200 mL of distilled water, and then 20 mL of aqueous NH3 solution was added dropwise over 20 min under stirring. The mixture was stirred for 2 h and allowed to stand still for another 2 h. The supernatant was removed, washed with distilled water, and dried at 80 °C overnight in ambient air. The solid sample was pulverized into fine powders to obtain Y(OH)3 which was then calcined at 500 °C for 3 h under flowing air to obtain the Y2O3 support.The catalysts were prepared by the impregnation method by dispersing the supports in an aqueous solution of H2PtCl6·6H2O at 80 °C for 2 h. The mixture was evaporated to dryness under continuous stirring, dried further at 80 °C overnight under ambient air, and then calcined at 500 °C for 3 h in flowing air. The loading amount of Pt was fixed at 5 wt%.
2.3 Catalyst characterization
Atomic absorption spectroscopic analysis was used to measure the actual content of platinum in the catalysts. The measurements were performed using a spectrophotometer (SHIMADZU AA-6200, Shimadzu Corp., Japan). Specific surface areas of the catalysts were estimated using the Brunauer–Emmett–Teller (BET) method for N2 adsorption isotherms at liquid N2 temperature. The isotherms were measured using an adsorption analyzer (BELSORP-mini II, MICROTRAC MRB) after the samples were degassed under vacuum at 300 °C for 3 h. X-ray diffraction (XRD) patterns were obtained with a powder X-ray diffractometer (SmartLab, Rigaku, Tokyo, Japan) using Cu Kα radiation (λ = 1.5405 Å). The patterns were recorded over the 2θ range of 10 to 70° at a scanning rate of 10° min−1 and a resolution of 0.01°. The amount of CO adsorption was measured using gas adsorption instruments equipped with thermal conductivity detectors (BP-2, Okura Riken Co., Ltd.; BELCATII, MICROTRAC MRB). The samples were reduced at 400 °C (heating rate of 10 °C min−1) for 1 h in H2 (30 mL min−1) and cooled to 40 °C under flowing He (30 mL min−1). Pulses of CO (0.972 mL STP) were introduced to the sample at 40 °C to measure the dynamic gas uptake. High-angle annular dark-field scanning transmission electron microscopy (HAADF-STEM) images of the catalysts were obtained with a field emission electron microscope (JEM-3200FS, JEOL Ltd., Japan) operated at 300 kV. The samples were dispersed in ethanol and deposited on carbon-coated copper grids (JEOL Ltd.), followed by evaporation of the ethanol in air. High resolution scanning electron microscopy (SEM) images were obtained with Hitachi SU9000 operated at 5 kV acceleration. Images of secondary electron (SE) and high-angle back scattering electron (HABSE) were simultaneously observed for a common field view. Fourier transform infrared (FT-IR) measurements of adsorbed CO were performed using spectrometers (FT/IR-610 and FT/IR-6600, JASCO, Japan) equipped with mercury-cadmium-telluride (MCT) detectors. The samples were pressed into 10- or 13 mm diameter self-supporting wafers (30–100 mg) and pretreated at 400 °C for 1 h in H2 (50 mL min−1). Background spectra were taken at a resolution of 4 cm−1 with 100 scans after the samples were cooled to 50 °C under He (50 mL min−1). Subsequently, the samples were exposed to 1% CO/He (20 mL min−1) for 15 min and purged with He for 15 min. Spectra were then recorded.The amount of surface hydroxyls (OH) on the catalysts was estimated from FT-IR measurements of isotopic exchange of the OH groups (OH) using deuterium oxide (D2O). The samples were pressed into self-supporting wafers (30–100 mg) with a diameter of 20 mm, pretreated at 400 °C for 1.5 h under 20 kPa of flowing O2, and evacuated at the same temperature for 15 min. The samples were then cooled to room temperature and background spectra were taken with a JASCO FT/IR-4200 type A spectrometer equipped with a triglycine sulfate (TGS) detector with a resolution of 4 cm−1 using 64 scans. Afterwards, the temperature was raised to 400 °C and the samples were exposed to D2O (2 kPa) for 30 min and evacuated for 15 min. The deuteration and evacuation steps were carried out three times, after which the samples were cooled to room temperature, and the spectra were recorded.
2.4 Catalytic activity test
Catalytic measurements were carried out in a fixed-bed tubular reactor at atmospheric pressure. The catalysts (100 mg; 26–50 mesh) were loaded on quartz wool plugs placed in the reactor (i.d. 8 mm). Prior to the tests, the catalysts were reduced in 50% H2/He (100 mL min−1) by increasing the temperature to 400 °C at 10 °C min−1 and holding for 1 h. The catalysts were then cooled to 300 °C under He (100 mL min−1), after which a reaction gas comprising 13.4% CH4, 1.8% NO, and 84.8% He was introduced at a total flow rate of 100 mL min−1. The reaction temperature was varied from 300 to 400 °C, and reaction products were analyzed using two on-line gas chromatographs (GCs) and an FT-IR spectrometer. The GCs were a Shimadzu GC-2010 equipped with a barrier discharge ionization detector and a Restek Rt-U-BOND capillary column for the analysis of HCN and CH3CN, and an Agilent 490 micro-GC equipped with a TCD and two columns (a PoraPLOT Q and a molecular sieve 5A column) for the analysis of CH4, CO2, N2O, N2, and CO. The FT-IR spectrometer was a JASCO FT/IR-4700 equipped with a 10 cm gas cell and a TGS detector at a resolution of 1 cm−1 for the analysis of NO and NH3.Conversions of CH4 and NO, yields of products, and HCN productivity were calculated using the following equations:
 | (1) |
 | (2) |
 | (3) |
 | (4) |
 | (5) |
Contact time analyses were performed at 400 °C by varying the total flow rate (50–190 mL min−1) and catalyst weight (7 and 20.5 mg) while keeping the reactant gas ratio constant (CH4![[thin space (1/6-em)]](https://www.rsc.org/images/entities/char_2009.gif) :
:![[thin space (1/6-em)]](https://www.rsc.org/images/entities/char_2009.gif) NO
NO![[thin space (1/6-em)]](https://www.rsc.org/images/entities/char_2009.gif) :
:![[thin space (1/6-em)]](https://www.rsc.org/images/entities/char_2009.gif) He = 13.4%/1.8%/84.8%). The catalyst bed volume was also kept constant at 0.8 cm3 by diluting with quartz sand of the same particle aggregates as the catalyst. The contact time was calculated by:
He = 13.4%/1.8%/84.8%). The catalyst bed volume was also kept constant at 0.8 cm3 by diluting with quartz sand of the same particle aggregates as the catalyst. The contact time was calculated by:
 | (6) |
2.5 In situ FT-IR spectroscopy
In situ FT-IR measurements were obtained using an FT/IR-610 and FT/IR-4000 spectrometers (JASCO) equipped with MCT detectors. About 20–40 mg of finely ground catalysts were pressed into self-supporting wafers (10- or 13 mm diameter) and placed at the center of an in situ IR flow cell equipped with KBr windows maintained at 25 °C by a circulation cooler. Before each experiment, the catalysts were pretreated in H2 (100 mL min−1) under the same condition as for the catalytic activity studies and cooled to 300 °C under He (100 mL min−1). The spectra were recorded in transmission mode at a resolution of 4 cm−1 with 100 scans in the region 4000–400 cm−1. For the study of adsorbed species under the reaction conditions, the catalysts were exposed to the reactant gas mixture (13.4% CH4, 1.8% NO, and 84.8% He, 100 mL min−1) at various temperatures and held for 30 min at each temperature with continuous spectra measurements. For the study of stability of adsorbed NO species, the pretreated catalysts were cooled to 50 °C under He (50 mL min−1) during which background spectra were taken at relevant temperatures. Then, the catalysts were exposed to 1.8% NO/He (50 mL min−1) for 15 min at 50 °C and purged under He for 10 min. The spectra were recorded under He as the temperature was raised from 50 to 400 °C.2.6 In situ X-ray Absorption Fine Structure (XAFS) spectroscopy
In situ measurements of Pt L3-edge XAFS were conducted at beamlines BL9C of the Photon Factory (PF) in the Institute of Materials Structure Science, High-Energy Accelerator Research Organization (KEK-IMSS-PF-AR), in Tsukuba, Japan. The X-rays storage ring was operated at 2.5 GeV with a beam current of 450 mA and monochromatized by a Si (111) double crystal monochromator. The spectra were acquired in transmission mode using the quick XAFS (QXAFS) technique and with ionization chambers filled with 15% N2/Ar for the incident X-ray beam (I0) and 50% Ar/N2 for the transmitted beam (I). Before each measurement, the samples were pressed into a disc with a diameter of 10 nm and pretreated in H2 in the same manner as for the activity and in situ FT-IR tests in a gas flow cell equipped with water-cooled Kapton windows. After pretreatment, the samples were purged under He, cooled to 300 °C, and held for 10 min under He. Then, the reactant gas mixture (13.4% CH4, 1.8% NO, and 84.8% He) was introduced into the cell at flow rates adjusted to obtain the same space velocity (1000 mL h−1 g−1). After 30 min, the temperature was raised to 400 °C at a rate of 1 °C min−1. Data reductions and analyses were conducted using REX2000 and xTunes (Science & Technology Inst., Co.).263. Results and discussion
3.1 Effects of various metal oxide supports
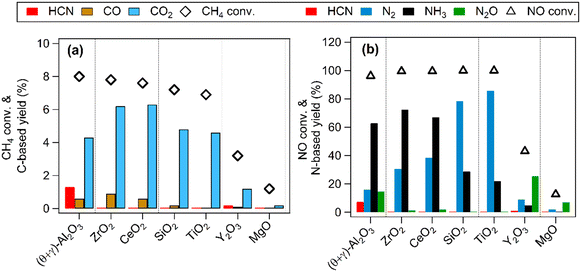
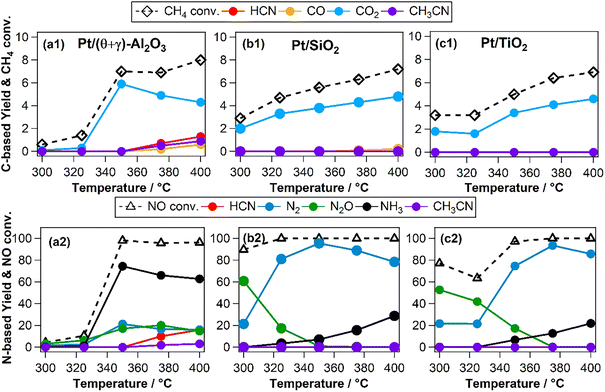
Previous studies have shown that Pt nanoparticles supported on (θ + γ)-Al2O3 were active for the low temperature oxidation of methane with nitic oxide as the oxidant, producing mainly CO2, HCN, CO, N2O, N2, and NH3.16,17 In the present work, various metal oxides were used to investigate the effects of support on the reaction. Fig. 1 compares catalytic performance at 400 °C of Pt supported on MgO, (θ + γ)-Al2O3, SiO2, TiO2, Y2O3, ZrO2, and CeO2. The conversions of CH4 and NO were similar on most of the catalysts, except for those supported on MgO and Y2O3. The noticeably lower activities on Pt/MgO and Pt/Y2O3 may be related to the basicity of the supports: it is surmised that strong adsorption of acidic components of the reaction (such as the reactant NO and the product CO2) may have hindered reactivity. Fig. 1(a) also shows that CO2 was the major carbon-based product on all the catalysts. Notably, appreciable amount of HCN was formed only on Pt/(θ + γ)-Al2O3. Fig. 1(b) shows clear differences in the relative yields of the nitrogen-based products on the catalysts with similar NO conversions, although N2 and NH3 were the main products. These differences and the lack of clear correlation between activity and CO adsorption values and BET surface areas of the catalysts (Fig. S1†) suggest an influence of the support in the reaction.The effects of reaction temperature were investigated for three catalysts (Pt/(θ + γ)-Al2O3, Pt/SiO2, and Pt/TiO2) with distinctive support properties. Fig. 2 shows clear temperature dependencies, particularly on the N-based products. On Pt/(θ + γ)-Al2O3, which was the only catalyst to form appreciable amount of HCN, NH3 was the main product at high temperatures (≥350 °C). On both Pt/SiO2 and Pt/TiO2, N2O was the main product at temperatures below 350 °C while N2 was the predominant product at high temperatures. Furthermore, the conversion of NO below 350 °C was significantly higher on Pt/SiO2 and Pt/TiO2 than on Pt/(θ + γ)-Al2O3, suggesting that the SiO2 and TiO2 supports promoted dissociation of NO at low temperatures.
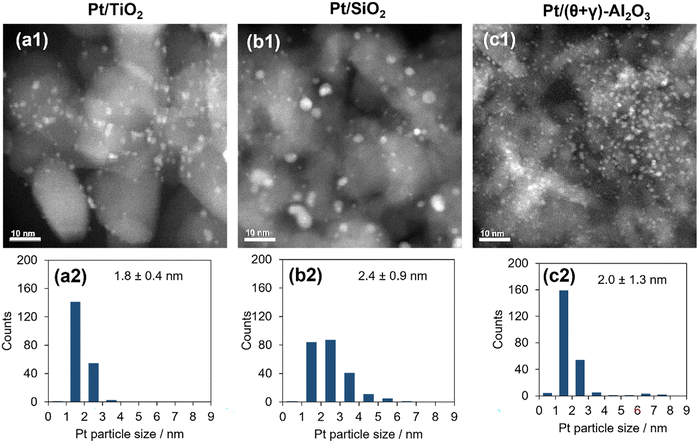
The catalysts were characterized by a series of techniques to obtain insights on the catalytic differences. Table 1 summarizes the measured Pt content, the BET surface area, the CO adsorption values, and average Pt particle sizes of the catalysts supported on Al2O3, SiO2, and TiO2 (see Tables S1 and S2 in the ESI† for the data for the other supported catalysts). The Pt content was identical to the nominal loading, the BET surface areas ranged from 48 to 160 m2 g−1, and the CO uptake ranged from 34 to 88 μmol g−1. Fig. 3 shows STEM images of the reduced catalysts along with their size distribution histograms which revealed that Pt was highly dispersed, although it was more narrowly distributed on the TiO2 support than the SiO2 and (θ + γ)-Al2O3 supports. The average particle sizes calculated from the STEM images were similar (1.8–2.4 nm), in contrast to the particle sizes calculated from the CO adsorption values which increased in the order Pt/(θ + γ)-Al2O3 (3.3 nm) < Pt/SiO2 (6.9 nm) < Pt/TiO2 (8.3 nm). The discrepancy in values for Pt/TiO2 is likely related to the strong metal–support interaction (SMSI) effect, whereas that for Pt/SiO2 may be due to the wide size distribution which is common for SiO2-supported samples prepared by impregnation.
| Catalyst | Pt (wt%) | S BET/m2 g−1 | CO adsorption/μmol g−1 | Particle size | |
|---|---|---|---|---|---|
| d CO /nm | d TEM/nm | ||||
| a Calculated from CO adsorption by assuming spherical particles and CO/Pt = 1 stoichiometric ratio. | |||||
| Pt/TiO2 | 4.9 | 48 | 34 | 8.3 | 1.8 ± 0.4 |
| Pt/SiO2 | 4.9 | 160 | 41 | 6.9 | 2.4 ± 0.9 |
| Pt/(θ + γ)-Al2O3 | 5.0 | 109 | 88 | 3.3 | 2.0 ± 1.3 |
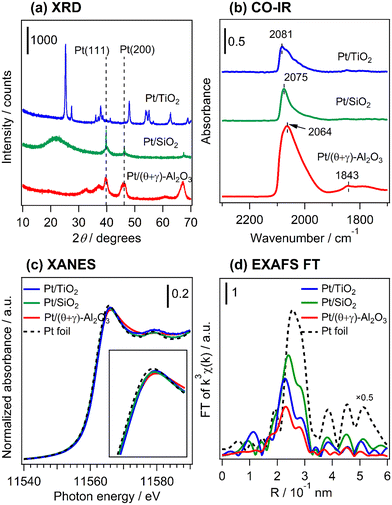
Fig. 4a shows the XRD patterns of freshly reduced Pt catalysts supported on TiO2, SiO2, and (θ + γ)-Al2O3 (see Fig. S2† for the diffraction patterns for all the supported catalysts and the supports). The pattern for Pt/TiO2 shows only peaks associated with the support which correspond to a mixture of anatase and rutile phase TiO2 (anatase PDF#00-001-0562; rutile PDF#00-001-1292), while that for Pt/SiO2 shows broad features centered at 2θ = 22° typical of amorphous silica as well as diffraction peaks attributed to metallic Pt with a face centered cubic (fcc) structure (PDF#00-004-0802). The Pt diffraction peaks were asymmetrical, indicating the formation of Pt with multiple crystallinities. The Pt (111) reflection was deconvoluted into a broad and narrow component (Fig. S3†) and the peak line widths, corrected for instrumental broadening (0.1°), were used to calculate crystallite sizes by the Scherrer equation.27 The crystallite sizes differed substantially, showing the presence of nanoparticulate (4.7 nm) and bulk (59 nm) Pt. The bulk Pt may have originated from loose agglomeration of Pt nanoparticles detached from the SiO2 support. These particles were not observed in the STEM images, suggesting that they may have been removed during ultrasonic dispersion of the powder samples in ethanol prior to the measurements. The broad component of the diffraction peak had a larger integrated area than the narrow counterpart, indicating that the total volume of Pt nanoparticles was larger than that of bulk Pt. Since each Pt nanoparticle has a very small volume, the number of Pt nanoparticles in the sample far exceeded that of the bulk Pt. The pattern for Pt/(θ + γ)-Al2O3 shows peaks due to the support (a mixture of θ-Al2O3 (PDF#00-035-0121) and γ-Al2O3 (PDF#00-002-1420)) which overlaps with possible peaks due to metallic Pt. The absence of Pt-attributable peaks in the pattern for Pt/TiO2 and the presence of Pt nanoparticles in Pt/SiO2 are consistent with their respective size distribution histograms from the STEM analyses. Fig. 4b presents in situ FT-IR spectra at 50 °C in He flow of CO adsorbed on the reduced catalysts. The spectra give characteristic IR bands at 2081 (Pt/TiO2), 2075 (Pt/SiO2), and 2064 cm−1 (Pt/(θ + γ)-Al2O3), assigned to linearly adsorbed CO on Pt terrace sites.28–30 The difference in the positions of the peaks may be due to difference in the electron density around Pt atoms and the coordination structure of Pt in the catalysts. The signals had a tail at lower wavenumber which can be assigned to linearly adsorbed CO on Pt sites with minimal coordination, such as steps, edges and corners.25,26,31 The spectrum for Pt/(θ + γ)-Al2O3 also shows features at 1843 cm−1 due to bridged-bonded CO, whereas the signals for Pt/TiO2 and Pt/SiO2 show either barely visible or no such features. For Pt/SiO2, the absence of bridge-bonded CO is common for this type of material,32 whereas for Pt/TiO2 it may be due to the predominance of small metallic Pt nanoparticles (as revealed by HAADF-STEM) and may indicate the existence of nanoclusters or single Pt atoms.33,34 However, the barely visible bridged Pt–CO feature could also be due to the SMSI effect in Pt/TiO2.32Fig. 4c shows normalized Pt L3-edge X-ray near edge structure (XANES) spectra of the reduced catalysts and a Pt foil reference sample. The spectra were recorded under in situ conditions under He. The intensities of the white lines suggest that the Pt was in the reduced state in the catalysts, although small differences can be observed (see insert of Fig. 4c). These differences are probably due to the difference of coordination structure (e.g., particle size, uniformity of particles, and dominant crystal planes, etc.), as indicated by XRD and TEM results. Fig. 4d shows the Fourier transforms of the k3-weighted extended X-ray absorption fine structure (EXAFS) of the reduced catalysts and the Pt foil. The spectra show only the presence of Pt–Pt scattering peak in the catalysts, suggesting that Pt was in the reduced state, which is consistent with the observations from the CO-FT-IR and XANES analyses. There were small differences in the position and intensity of the Pt–Pt scattering peaks, in which the bond distance and intensity were the largest for Pt/SiO2. This is in general agreement with the particle size trends. It is important to point out that the presence of the Pt–Pt scattering peak indicates the existence of Pt clusters in Pt/TiO2 in addition to the previously mentioned nanoclusters or single atoms. It is reasoned that changes to the electronic and geometric structure of Pt in the catalysts may have been impacted by a difference of particle size and supports. However, the results did not show a direct relationship between these catalyst properties and the reactivity behaviors.
3.2 Effects of Al2O3 supports
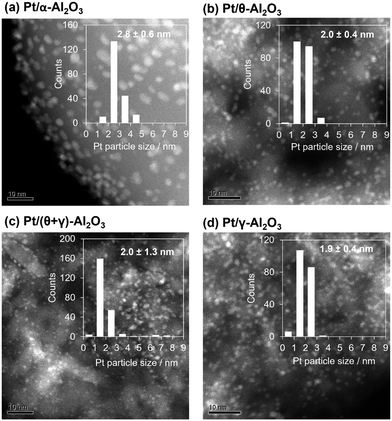
Since the reaction results show that Al2O3 possesses properties favorable for HCN formation, Pt catalysts supported on Al2O3 with different crystal structures were investigated for the CH4–NO reaction. The supports used were α-Al2O3, θ-Al2O3, γ-Al2O3, and (θ + γ)-Al2O3. Details of the characterization results are summarized in Table 2, and shown in Fig. 5 and S3–S5 in the ESI.† Briefly, XRD patterns (Fig. S4†) showed characteristic peaks of α-Al2O3 (corundum, PDF# 00-042-1468), θ-Al2O3 (PDF#00-035-0121), γ-Al2O3 (PDF#00-002-1420), and a mixture of θ- and γ-Al2O3 phases in the respective supports. The diffraction patterns of the catalysts (Fig. S4a†) show peaks due mainly to the support, indicating the presence of highly dispersed Pt in the catalysts, except for the pattern for Pt/α-Al2O3 which also shows peaks corresponding to fcc Pt, suggesting the presence of large metallic Pt crystallites. As previously observed for Pt/SiO2, the Pt (111) reflection of Pt/α-Al2O3 also consisted of two contributions (Fig. S5†) with crystallite sizes of 5.3 and 74 nm. Based on the integrated areas and the corresponding volume, the number of the nanoparticulate Pt in the catalyst was much greater than that of the bulk Pt. The interpretations from the XRD results are consistent with particle sizes calculated from CO adsorption measurements (Table 2). On the other hand, HAADF-STEM images (Fig. 5) show well-dispersed Pt nanoparticles with average diameters of 1.9–2.8 nm in the catalysts, which suggests no major differences in particle sizes. With the exception of Pt/α-Al2O3, the values from TEM agree reasonably with those from CO adsorption. Here, the discrepancy is not related to SMSI since α-Al2O3 does not typically interact strongly with impregnated metals.35 Instead, it may be due to greater contribution to the average size determined by XRD and CO adsorption by large crystallites in the samples and loss of loosely bound bulk Pt during sample preparation for STEM. Differences between the supports and catalysts were probed further by SEM. The SEM images of representative supports and catalysts (Fig. S6†) show that γ-Al2O3 is porous, whereas α-Al2O3 has smoothed surfaces with dense nanoparticles. Stronger HABSE signals can be obtained from heavier elements. Thus, white spots smaller than 10 nm in both HABSE images of Pt/γ-Al2O3 and Pt/α-Al2O3 whose positions coincide with nanoparticles in the secondary electron (SE) images correspond to Pt. It can be observed from the HABSE images that Pt was deposited both on the outer and inner surfaces of the porous support (γ-Al2O3), but was distributed in high density on the surface of the low-surface area support (α-Al2O3). These results indicate that in addition to differences in crystal structure, the distribution of Pt was impacted by the porosity of the supports. Infrared spectra of adsorbed CO spectra of all the catalysts (Fig. S7†), Pt L3-edge XANES (Fig. S8a†) and Fourier transform of EXAFS k3χ(k) weighted spectra (Fig. S8b†) of representative samples show differences in geometric and electronic structure of Pt in the catalysts.| Catalyst | S BET/m2 g−1 | CO ads./μmol g−1 | Particle size/nm | |
|---|---|---|---|---|
| d CO | d TEM | |||
| Pt/α-Al2O3 | 6 | 35 | 8.2 | 2.8 ± 0.9 |
| Pt/θ-Al2O3 | 98 | 113 | 2.5 | 2.0 ± 0.4 |
| Pt/(θ + γ)-Al2O3 | 109 | 88 | 3.3 | 2.0 ± 1.3 |
| Pt/γ-Al2O3 | 189 | 103 | 2.8 | 1.9± 0.4 |
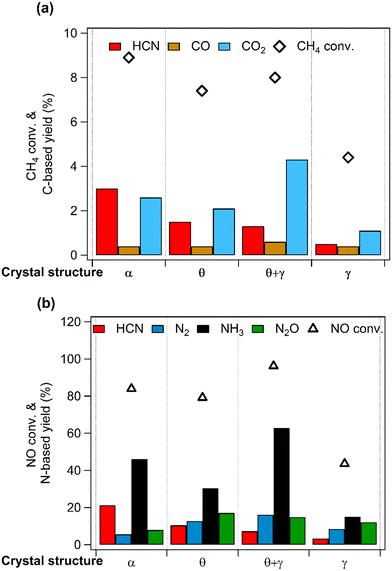
Fig. 6 compares catalytic activities at 400 °C, showing clear differences in the conversions of CH4 and NO. Importantly, HCN was formed on all the catalysts but with different yields: the yield decreased in the order, Pt/α-Al2O3 > Pt/θ-Al2O3 > Pt/(θ + γ)-Al2O3 > Pt/γ-Al2O3. Furthermore, in terms of the carbon-based products, HCN was the main product on Pt/α-Al2O3 and Pt/θ-Al2O3, while CO2 was the main product on Pt/(θ + γ)-Al2O3 and Pt/γ-Al2O3 (Fig. 6a). In the case of the N-based products, NH3 was the dominant product on all the catalysts, but the relative yields of the other products differed. Examination of the results shows no correlation of the order of the reactivity to the CO adsorption values, BET surface areas (Table 2) and the other catalyst properties. However, the HCN yield had an inverse relation with the surface area. As will be explained later, this trend is linked to surface groups on the support.
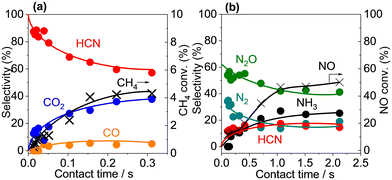
A contact time study with Pt/α-Al2O3 was used to obtain information about the reaction sequence. Fig. 7 shows the product selectivities and CH4 and NO conversions as a function of contact time at 400 °C, and, as expected, the conversions increased with contact time. For the C-based products, the selectivity to HCN was extrapolated to 100% at zero contact time and decreased with increasing contact time, which is characteristic of a primary product. In contrast, the selectivity to CO2 increased gradually with increasing contact time and the selectivity to CO increased slightly and then remained unchanged with increasing contact time, both of which are consistent with non-primary products. For the N-based product, the selectivity profiles suggest that N2O and N2 were primary products, while HCN and NH3 were non-primary products. The results suggest that scission of the C–H and N–O bonds and the subsequent formation of N2O and N2 precede C–N coupling reaction to form HCN, which is converted subsequently to NH3, CO2 and/or CO via oxidation and hydrolysis reactions.36–38 The oxidation of HCN proceeded on Pt sites,36,37,39 conceivably through reaction with NO and N2O (eqn (7) and (8)), while the hydrolysis of HCN occurred over the Al2O3 support surface via reaction with H2O (eqn (9)):32,40
| 2HCN + 3NO → 2CO + 2N2 + H2 | (7) |
| 2HCN + 2N2O → 2CO + 2N2 + H2 | (8) |
| HCN + 2H2O → CO2 + 2NH3 + H2 | (9) |
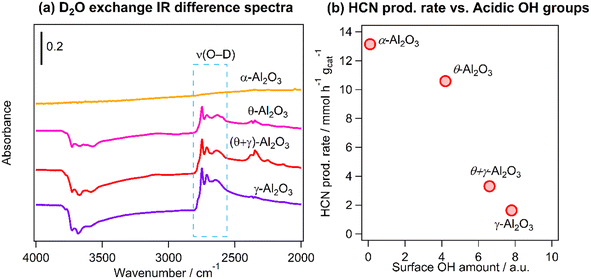
As was mentioned earlier, the inverse relationship between HCN yield and the BET surface area may be related to reaction on acidic hydroxyls (OH) on the Al2O3 supports. The amount of acidic OH groups was quantified using FT-IR and D2O exchange measurements. Fig. 8a shows the difference infrared spectra in the region 4000–2000 cm−1 of the catalysts after deuteration of the OH groups: the negative peaks at higher wavenumbers are attributed to the consumption of the acidic OH groups by reaction with D2O and the features at 2800–2600 cm−1 are the formed deuteroxyl (OD) groups. The amount of the acidic OH groups was obtained by integration of the OD bands in the region 2800–2686 cm−1. Fig. 8b shows a clear inverse correlation between the production rate of HCN and the amount of OH groups, suggesting that the highest HCN yield obtained on Pt/α-Al2O3 was associated with the suppression of hydrolysis reaction due to the very low amount of acidic OH groups on the support.
The catalytic rate of HCN produced by the CH4–NO process compares favorably to other reported non-industrial processes. Yi and coworkers studied the plasma-catalytic reaction of CH4 and NH3 to form HCN on Pt (ref. 14) and Cu (ref. 15) catalysts and reported HCN TOF values of 17.6 and 9.6 h−1 at 400 °C, respectively. Xiang and coworkers reported the formation of HCN through an NH3-assisted reforming of CH4 on Re catalysts with a maximum TOF of 2856 h−1 at 650 °C. In the present work, the reaction of CH4 and NO on Pt/α-Al2O3 formed HCN with a TOF of 375 h−1 at 400 °C.
3.3 In situ FT-IR measurements
An important question that arises from the reaction of CH4 and NO is the formation of HCN on Pt/(θ + γ)-Al2O3 but not on Pt/SiO2 and Pt/TiO2. To help shed light on these behaviors, adsorbed species on the catalysts under the reaction conditions (CH4/NO/He = 13.4/1.8/84.8) were investigated by in situ FT-IR. Fig. 9 shows the FT-IR spectra at various temperatures: the spectra were taken 30 min after the reaction gas mixture was introduced at the respective temperatures. The spectra for Pt/TiO2 show features around 2036 cm−1 at all temperatures, attributed to Pt–CO species. Similarly, the spectra for Pt/SiO2 show features due to Pt–CO species (2068 cm−1), although the features were visible only at higher temperatures. The spectra for Pt/(θ + γ)-Al2O3 show distinctive peaks at 1591 cm−1 at all temperatures, which may be due to carbonate species on alumina,23,41 a broad feature around 1768 cm−1 only at 300 °C, assigned to bridge-bonded CO (Pt–CO–Pt), and prominent features with maxima at 2149 and 2179 cm−1, attributed to Pt–CN (ref. 16 and 17) and Pt–NCO (ref. 42–44) species, respectively. Features due to Al–NCO species, which are reportedly around 2245 cm−1,18,41,45 were not observed. The absence of the bridge-bonded CO feature at higher temperatures suggests that these species were intermediate species that may have reacted with surface oxygen species to form CO2 or with adsorbed NO species to form Pt–NCO and Pt–CN species, possible intermediates for HCN. The spectra for Pt/α-Al2O3 also show the formation of Pt–CN species (2160 cm−1) which appear to support the conclusion that they are reaction intermediates for HCN. However, the intensity of the Pt–CN bands was much lower despite its higher HCN yield. This may be due to lower surface sensitivity of Pt/α-Al2O3 for infrared measurements due to its lower surface area (18 times). Alternatively, it is possible that not all the Pt–CN species on Pt/(θ + γ)-Al2O3 contributed to the formation of HCN.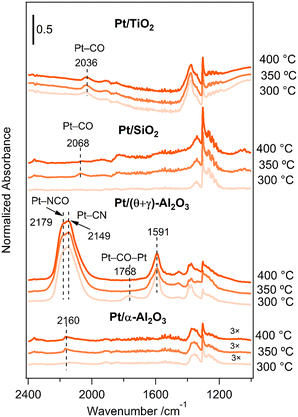 | ||
| Fig. 9 In situ FT-IR spectra for the reaction of CH4 and NO on the Pt/TiO2, Pt/SiO2, Pt/(θ + γ)-Al2O3, and Pt/α-Al2O3 catalysts at various temperatures. | ||
The difference in the spectral features between Pt/(θ + γ)-Al2O3 and the other catalysts provides insights into their catalytic behaviors. The presence of adsorbed nitrogen-containing species on Pt/(θ + γ)-Al2O3 suggests that they were stabilized well on the catalysts and were more available for reaction to form HCN. In contrast, N-containing species may have been consumed rapidly during the reaction on Pt/SiO2 and Pt/TiO2 because of their predominance on the active surfaces. This may be the reason why the yields for N2 and N2O, which are produced from NO dissociation reactions, were high at all temperatures on Pt/SiO2 and Pt/TiO2. In other words, the results suggest that the formation of HCN requires appropriate amounts of adsorbed C and N species.
The results also suggest that NO dissociation on the catalysts was influenced by the support. Hence, the stability of NO species on the catalysts was investigated by FT-IR spectroscopy. The catalysts were exposed to 1.8% NO/He at 50 °C for 15 min, purged with He for 10 min, and then the temperature was raised to 400 °C under He. Fig. S9a–c† shows a series of spectra taken under He at various temperatures. All the spectra show characteristic Pt0–NO peaks, along with features due to nitrites (NO2−), nitrates (NO3−) and N2O4− species.42,46–48 The spectra for Pt/(θ + γ)-Al2O3 also show features due to Ptδ+–NO species.45 The nitrite/nitrates species were probably formed by a reaction between NO adsorbed on Pt and oxygen species on the supports. The N2O4− species were likely obtained by NO2 dimerization.43 The spectra of the bare SiO2 support were featureless, but those for the bare TiO2 and (θ + γ)-Al2O3 supports show features that correspond to nitrites and N2O4− species (Fig. S10, ESI†). These suggest that the observed NO2− and N2O4− species on the Pt/TiO2 and Pt/(θ + γ)-Al2O3 catalysts also include contributions from the supports.
The intensity of the features decreased with increasing temperature, although it is apparent that the decrease differed depending on the catalyst. To compare the stability of the NO and NOx species on the catalysts, the areas of the Pt–NO and nitrite/nitrate features at the various temperatures were normalized to the corresponding areas at 50 °C. Fig. S9d and e† compares the relative areas which shows that the stability of NO on the Pt species in the catalysts decreased in the order Pt/SiO2 > Pt/(θ + γ)-Al2O3 > Pt/TiO2, while the stability of the NOx species decreased in the reverse order. The trends correspond to the adsorption strength of NO and NOx species which gives indication of their surface coverages. Since Pt/SiO2 and Pt/TiO2 have higher adsorption strength of NO and NOx species, the surface concentration of these species should be higher, which may increase the probability of N2 and N2O formation. This interpretation of the results is consistent with the reactivity behavior of the catalysts. It is also important to note that the trend suggests that NO and NOx species on Pt/(θ + γ)-Al2O3 were moderately stable, which appears to be beneficial for HCN formation.
3.4 In situ XAFS measurements
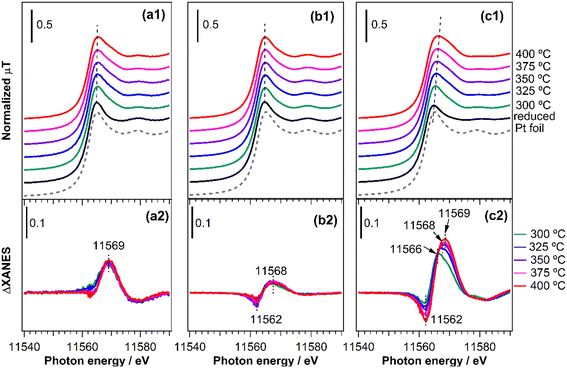
In situ XAFS spectroscopy was used to track the state of Pt in the catalysts under reaction conditions and to obtain more information on adsorbed species. The same condition as for the reactivity tests was used and the spectra were taken continuously during catalyst pretreatment and introduction of the reactant gas mixture (CH4/NO/He = 13.4/1.8/84.8) at 300, 325, 350, 375, and 400 °C. Fig. 10(a1–c1) shows the normalized Pt L3-edge XANES spectra of the catalysts at various stages of the reaction, along with the spectra for the Pt foil. The spectra for all the reduced catalysts resemble that for the Pt foil, indicating that Pt was mainly in a metallic state. However, there are some notable differences between the catalysts after the introduction of the reaction gas mixture. For both Pt/TiO2 (Fig. 10(a1)) and Pt/SiO2 (Fig. 10(b1)), the intensity of the white line increased and broadened although there was no apparent energy shift. In contrast, for Pt/(θ + γ)-Al2O3 (Fig. 10(c1)), the increase in intensity and broadening of the white line was accompanied by an obvious shift to higher energy. These differences are more clearly illustrated in Fig. 10(a2 and b2) which show the difference spectra obtained by subtracting the XANES spectra of the catalyst before the reaction (reduced) from the spectra during the reaction at the various temperatures. Negative peaks observed in the difference spectra at 11562 eV correspond to energy shifts (which were not apparent in Fig. 10(b1)), so their presence for Pt/SiO2 indicates that the positive peaks observed at 11568 eV are due to adsorbed species. However, there were no changes in the position and intensity of the peaks with increasing temperature, suggesting that the nature of the adsorbed species was similar at all temperatures. Based on the in situ FT-IR results spectra (Fig. 9), and in line with previous studies,49,50 the positive peaks are attributed to the adsorption of CO. Similarly, the increase in the energy shifts of the positive peaks for Pt/(θ + γ)-Al2O3 at increasing temperature may be due to gradual transformation of adsorbed species and the increase in the intensity is consistent with greater coverage of the Pt surface by adsorbed species. Based on the related in situ FT-IR spectra, the shifts correspond to the transformation of Pt–CO to Pt–CN.16 To confirm the origin of the peak shifts, freshly reduced Pt/(θ + γ)-Al2O3 was exposed to CO and NO (see ESI† for details of the experiments). Fig. S11† shows that the introduction of the gases led to an increase in white line intensity, although there were clear differences in the energy positions: the flow of NO led to a slight peak shift to 11![[thin space (1/6-em)]](https://www.rsc.org/images/entities/char_2009.gif) 566 eV, whereas the flow of CO broadened the peak and led to larger energy shift to 11
566 eV, whereas the flow of CO broadened the peak and led to larger energy shift to 11![[thin space (1/6-em)]](https://www.rsc.org/images/entities/char_2009.gif) 568 eV. These results confirm that the initial small energy shift observed during the in situ XANES spectra measurements under the reaction conditions corresponds mainly to the formation of Pt–NO species and that the subsequent larger shift relates to Pt–CO species. Although it was not possible to independently verify the formation of Pt–CN species, the additional shift to 11
568 eV. These results confirm that the initial small energy shift observed during the in situ XANES spectra measurements under the reaction conditions corresponds mainly to the formation of Pt–NO species and that the subsequent larger shift relates to Pt–CO species. Although it was not possible to independently verify the formation of Pt–CN species, the additional shift to 11![[thin space (1/6-em)]](https://www.rsc.org/images/entities/char_2009.gif) 569 eV likely involves strong contribution from these species. Importantly, the increase in the coverage of the surface species correlates with the increased HCN yield observed at higher temperatures, giving additional evidence that Pt–CN species were intermediates for the CH4–NO reaction to form HCN. For Pt/TiO2, the lack of energy shift in the white line suggests that Pt was partially oxidized during the reaction, possibly during facile NO decomposition to N2 and N2O. It is also possible that there was very low coverage by adsorbates, which may explain the discrepancy between the XANES and FT-IR results. The combination of catalyst characterizations, reactivity measurements, and in situ spectroscopic analysis indicates a strong effect of support in the reaction, particularly as it pertains to the formation of HCN. It is possible that the effect consisted of direct involvement of the support surface and indirect influence of the support via modification of Pt surface structure and adsorption property. The specific nature of the effect of metal oxide support warrants additional investigation.
569 eV likely involves strong contribution from these species. Importantly, the increase in the coverage of the surface species correlates with the increased HCN yield observed at higher temperatures, giving additional evidence that Pt–CN species were intermediates for the CH4–NO reaction to form HCN. For Pt/TiO2, the lack of energy shift in the white line suggests that Pt was partially oxidized during the reaction, possibly during facile NO decomposition to N2 and N2O. It is also possible that there was very low coverage by adsorbates, which may explain the discrepancy between the XANES and FT-IR results. The combination of catalyst characterizations, reactivity measurements, and in situ spectroscopic analysis indicates a strong effect of support in the reaction, particularly as it pertains to the formation of HCN. It is possible that the effect consisted of direct involvement of the support surface and indirect influence of the support via modification of Pt surface structure and adsorption property. The specific nature of the effect of metal oxide support warrants additional investigation.
A comparison of the in situ XANES results for Pt/α-Al2O3 and Pt/(θ + γ)-Al2O3 (Fig. S12†) indicates similar nature of adsorbates, which may be the reason for their activity for HCN formation. The lower intensity of the difference spectra peaks for Pt/α-Al2O3 may be due to lower surface coverage as a result of its lower exposed Pt sites (Table 2) and is consistent with the lower intensities of the features observed in the infrared spectra (Fig. 9).
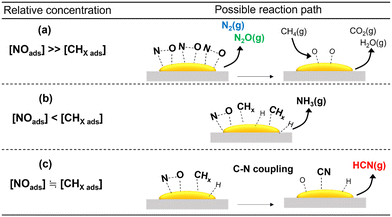
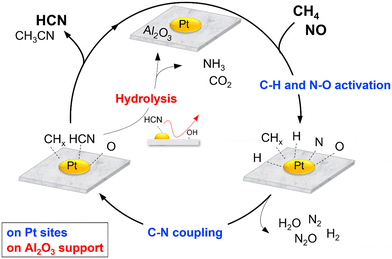
3.5 Proposed reaction schemes
As discussed previously, among the various metal oxides used as support for Pt catalysts, HCN was formed in appreciable amount only on Al2O3. In situ FT-IR and XAFS spectroscopic studies indicated that this may be due to the ability of Pt/Al2O3 to form surface Pt–CN species during the reaction. The reactivity results showed that Pt/SiO2 and Pt/TiO2 exhibited high NO conversion even at 300 °C, indicating that NO dissociation was more facile on these catalysts. However, N2O was the main product at 300 °C which suggests that the concentration of adsorbed molecular NO on the catalyst surface was relatively high due to partial NO dissociation. As expected, increase in temperature decreased the yield for N2O at the expense of N2 and NH3, suggesting an increase in dissociated NO species (N and O) and CH4 activated species (CHx). These are consistent with reported studies that the relative concentration of adsorbed NO has a strong influence on products selectivity51 (schematic depictions are shown in Scheme 1). Thus, it can be surmised that the inactivity of the Pt/SiO2 and Pt/TiO2 catalysts for C–N coupling reaction to form HCN is related to the predominance of adsorbed NO species over surface CHx species at low temperatures, hindering the formation of Pt–CN intermediates. On the other hand, the formation of HCN on Al2O3-supported Pt catalysts may be due to a balance of adsorbed NO and CHx species on the catalysts. To verify further, the partial pressures of CH4 and NO were varied to study their effect on the reaction on Pt/α-Al2O3 (see the ESI† for details of the experiments). The results are expressed as the logarithms of the turnover frequency of the products formation against the logarithms of the CH4 and NO partial pressures (Fig. S13†). Fitting the data by linear least squares regression analysis gave reasonable R2 values (0.94–0.99) for most of the products. For N2, N2O, and CO2, a positive dependence on the NO partial pressure and an inverse dependence on the CH4 partial pressure were obtained, which are consistent with the interpretation from Scheme 1(a). In the case of NH3, a negative dependence with respect to the NO partial pressure is consistent with Scheme 1(b). For HCN, a strong dependence on the CH4 partial pressure and an inconsistent dependence on the NO partial pressure align with the deductions from Scheme 1(c). These results suggest that the proposed schemes are reasonable.The various studies carried out allow reaction schemes to be proposed. Scheme 2 shows a simplified version of the reaction cycle on Pt/Al2O3 which begins with dissociative adsorption of NO on Pt sites to form adsorbed N and O species (Nads and Oads) and cleavage of the C–H bonds in CH4 to form surface CHx and Hx species. Reaction between Nads (or NOads) and CHx species form Pt–CN or Pt–NCO intermediates which react subsequently with surface H species to form HCN. Subsequent hydrolysis reaction of adsorbed HCN is catalyzed by surface acidic OH groups on Al2O3 to form NH3 and CO2. These suggested steps are reasonable and have also been proposed in the literature.42,52–54
4. Conclusions
A series of metal oxides were used to investigate the effects of supports on the activation of CH4 with NO on Pt catalysts at low temperatures. The catalysts were active for C–H activation and NO dissociation reactions, producing mainly CO2, CO, N2O, N2, and NH3, in varying yields. However, only Pt/(θ + γ)-Al2O3 displayed appreciable activity for C–N coupling reaction to form HCN. In line with the reactivity results, in situ FT-IR and XAFS spectroscopic studies revealed that Pt–CN species, a possible intermediate for HCN, were observed on Pt/(θ + γ)-Al2O3 but not on Pt/SiO2 and Pt/TiO2. Differences in the relative concentration of adsorbed CHx and NO species were credited with the different catalytic behaviors. A comparative investigation of Pt dispersed on Al2O3 with different crystal structures showed that the highest HCN yield was obtained on the support with the lowest amount of surface acidic hydroxyls because hydrolysis of HCN was minimized.Conflicts of interest
There are no conflicts to declare.Acknowledgements
This work was supported by the Japan Science and Technology Agency under the CREST program, Grant Number JPMJCR16P2. The XAFS measurements were performed under the approval of the Photon Factory Program Advisory Committee (Proposal No. 2019G070 and 2020G039).Notes and references
- Key World Energy Statistics, International Energy Agency, 2021, https://www.iea.org/reports/key-world-energy-statistics-2021 Search PubMed.
- BP Statistical Review World Energy, 2022, https://www.bp.com/en/global/corporate/energy-economics/statistical-review-of-world-energy.html Search PubMed.
- P. Lott and O. Deutschmann, Emiss. Control Sci. Technol., 2021, 7, 1–6 CrossRef CAS.
- J. H. Lunsford, Catal. Today, 2000, 63, 165–174 CrossRef CAS.
- T. V. Choudhary, E. Aksoylu and D. Wayne Goodman, Catal. Rev.: Sci. Eng., 2003, 45, 151–203 CrossRef CAS.
- A. I. Olivos-Suarez, À. Szécsényi, E. J. M. Hensen, J. Ruiz-Martinez, E. A. Pidko and J. Gascon, ACS Catal., 2016, 6, 2965–2981 CrossRef CAS.
- C. Okolie, Y. Lyu, L. Kovarik, E. Stavitski and C. Sievers, ChemCatChem, 2018, 10, 2700–2708 CrossRef CAS.
- M. Ruiz-Bermejo, J. L. de la Fuente, C. Pérez-Fernández and E. Mateo-Martí, Processes, 2021, 9, 597 CrossRef CAS.
- J. Sauer, M. Bewersdorf, M. Köstner, M. Rinner and D. Wolf, in Handbook of heterogeneous Catalysis, ed. G. Ertl, H. Knözinger, F. Schüth and J. Weitkamp, Wiley-VCH Verlag GmbH& Co. KGaA, Weinheim, Germany, 2008, vol. 1, pp. 2592–2609 Search PubMed.
- T. A. Hanna, Coord. Chem. Rev., 2004, 248, 429–440 CrossRef CAS.
- V. A. Kondratenko, G. Weinberg, M. M. Pohl and D. S. Su, Appl. Catal., A, 2010, 381, 66–73 CrossRef CAS.
- M. Aschi, M. Brönstrup, M. Diefenbach, J. N. Harvey, D. Schröder and H. Schwarz, Angew. Chem., Int. Ed., 1998, 37, 829–832 CrossRef CAS PubMed.
- R. Horn and R. Schlögl, Catal. Lett., 2015, 145, 23–39 CrossRef CAS.
- Z. Guo, Y. Yi, L. Wang, J. Yan and H. Guo, ACS Catal., 2018, 8, 10219–10224 CrossRef CAS.
- Y. Yi, X. Wang, A. Jafarzadeh, L. Wang, P. Liu, B. He, J. Yan, R. Zhang, H. Zhang, X. Liu, H. Guo, E. C. Neyts and A. Bogaerts, ACS Catal., 2021, 11, 1765–1773 CrossRef CAS.
- T. Yamasaki, A. Nishida, N. Suganuma, Y. Song, X. Li, J. Murakami, T. Kodaira, K. K. Bando, T. Ishihara, T. Shishido and A. Takagaki, ACS Catal., 2021, 11, 14660–14668 CrossRef CAS.
- T. Yamasaki, A. Takagaki, T. Shishido, K. K. Bando, T. Kodaira, J. Murakami, J. T. Song, E. Niwa, M. Watanabe and T. Ishihara, J. Jpn. Pet. Inst., 2022, 65, 184–191 CrossRef CAS.
- I. T. Ghampson, H. Miura, J. Murakami, K. K. Bando, T. Kodaira, A. Takagaki, T. Ishihara and T. Shishido, ACS Catal., 2023, 13, 6574–6589 CrossRef CAS.
- C. Williams, J. H. Carter, N. F. Dummer, Y. K. Chow, D. J. Morgan, S. Yacob, P. Serna, D. J. Willock, R. J. Meyer, S. H. Taylor and G. J. Hutchings, ACS Catal., 2018, 8, 2567–2576 CrossRef CAS.
- V. Vargheese, J. Murakami, K. K. Bando, I. T. Ghampson, G.-N. Yun, Y. Kobayashi and S. T. Oyama, J. Catal., 2020, 389, 352–365 CrossRef CAS.
- I. T. Ghampson, G.-N. Yun, A. Kaneko, V. Vargheese, K. K. Bando, T. Shishido and S. T. Oyama, ACS Catal., 2022, 12, 11190–11205 CrossRef CAS.
- K. Murata, D. Kosuge, J. Ohyama, Y. Mahara, Y. Yamamoto, S. Arai and A. Satsuma, ACS Catal., 2020, 10, 1381–1387 CrossRef CAS.
- G. R. Bamwenda, A. Ogata, A. Obuchi, J. Oi, K. Mizuno and J. Skrzypek, Appl. Catal., B, 1995, 6, 311–323 CrossRef CAS.
- Y. Lin, Y. Cao, Q. Yao, O. J. H. Chai and J. Xie, Ind. Eng. Chem. Res., 2020, 59, 20561–20581 CrossRef CAS.
- J. Lee, E. J. Jang and J. H. Kwak, Appl. Catal., A, 2019, 569, 8–19 CrossRef CAS.
- H. Asakura, S. Yamazoe, T. Misumi, A. Fujita, T. Tsukuda and T. Tanaka, Radiat. Phys. Chem., 2020, 175, 108270 CrossRef CAS.
- B. D. Cullity, Elements of X-ray Diffraction, Addison-Wesley, Menlo Park, C.A., 1978 Search PubMed.
- K. Tanaka and J. M. White, J. Catal., 1983, 79, 81–94 CrossRef CAS.
- M. Bartók, J. Sárkány and A. Sitkei, J. Catal., 1981, 72, 236–245 CrossRef.
- V. Marchuk, X. Huang, J.-D. Grunwaldt and D. E. Doronkin, Catal. Sci. Technol., 2023, 13, 2946–2965 RSC.
- L. Deng, H. Miura, T. Shishido, S. Hosokawa, K. Teramura and T. Tanaka, Chem. Commun., 2017, 53, 6937–6940 RSC.
- M. A. Vannice and C. C. Twu, J. Chem. Phys., 1981, 75, 5944–5948 CrossRef CAS.
- J. Fu, J. Lym, W. Zheng, K. Alexopoulos, A. V. Mironenko, N. Li, J. A. Boscoboinik, D. Su, R. T. Weber and D. G. Vlachos, Nat. Catal., 2020, 3, 446–453 CrossRef CAS.
- B. Qiao, A. Wang, X. Yang, L. F. Allard, Z. Jiang, Y. Cui, J. Liu, J. Li and T. Zhang, Nat. Chem., 2011, 3, 634–641 CrossRef CAS PubMed.
- K. Murata, Y. Mahara, J. Ohyama, Y. Yamamoto, S. Arai and A. Satsuma, Angew. Chem., Int. Ed., 2017, 56, 15993–15997 CrossRef CAS PubMed.
- O. Kröcher and M. Elsener, Appl. Catal., B, 2009, 92, 75–89 CrossRef.
- H. Zhao, R. G. Tonkyn, S. E. Barlow, B. E. Koel and C. H. F. Peden, Appl. Catal., B, 2006, 65, 282–290 CrossRef CAS.
- Q. Wang, X. Wang, L. Wang, Y. Hu, P. Ning, Y. Ma and L. Tan, Microporous Mesoporous Mater., 2019, 282, 260–268 CrossRef CAS.
- X. Guo, A. Winkler, I. Chorkendorff, P. L. Hagans, H. R. Siddiqui and J. T. Yates, Surf. Sci., 1988, 203, 17–32 CrossRef CAS.
- N. W. Cant, D. C. Chambers, A. D. Cowan, I. O. Y. Liu and A. Satsuma, Top. Catal., 2000, 10, 13–20 CrossRef CAS.
- K. Almusaiteer and S. S. C. Chuang, J. Catal., 1999, 184, 189–201 CrossRef CAS.
- J.-L. Freysz, J. Saussey, J.-C. Lavalley and P. Bourges, J. Catal., 2001, 197, 131–138 CrossRef CAS.
- V. Matsouka, M. Konsolakis, R. M. Lambert and I. V. Yentekakis, Appl. Catal., B, 2008, 84, 715–722 CrossRef CAS.
- J. Raskó and F. Solymosi, J. Catal., 1981, 71, 219–222 CrossRef.
- S. Kim, D. C. Sorescu and J. T. Yates, J. Phys. Chem. C, 2007, 111, 18226–18235 CrossRef CAS.
- K. I. Hadjiivanov, Catal. Rev.: Sci. Eng., 2000, 42, 71–144 CrossRef CAS.
- J.-L. Freysz, J. Saussey, J.-C. Lavalley and P. Bourges, J. Catal., 2001, 197, 131–138 CrossRef CAS.
- E. Ivanova, M. Mihaylov, F. Thibault-Starzyk, M. Daturi and K. Hadjiivanov, J. Mol. Catal. A: Chem., 2007, 274, 179–184 CrossRef CAS.
- T. Kubota, K. Asakura and Y. Iwasawa, Catal. Lett., 1997, 46, 141–144 CrossRef CAS.
- I. T. Bae and D. A. Scherson, J. Phys. Chem., 1996, 100, 19215–19217 CrossRef CAS.
- I. Balint, A. Miyazaki and K.-i. Aika, Appl. Catal., B, 2002, 37, 217–229 CrossRef CAS.
- R. Burch and A. Ramli, Appl. Catal., B, 1998, 15, 49–62 CrossRef CAS.
- A. L. Marsh, K. A. Becraft and G. A. Somorjai, J. Phys. Chem. B, 2005, 109, 13619–13622 CrossRef CAS PubMed.
- W. Schießer, H. Vinek and A. Jentys, Appl. Catal., B, 2001, 33, 263–274 CrossRef.
Footnote |
| † Electronic supplementary information (ESI) available. See DOI: https://doi.org/10.1039/d3cy00555k |
| This journal is © The Royal Society of Chemistry 2023 |

