 Open Access Article
Creative Commons Attribution 3.0 Unported Licence
Molecular beacon decorated silver nanowires for quantitative miRNA detection by a SERS approach†
Martina
Banchelli
 *,
Sara
Tombelli
 *,
Marella
de Angelis
 ,
Cristiano
D'Andrea
 ,
Cosimo
Trono
,
Francesco
Baldini
,
Cosimo
Trono
,
Francesco
Baldini
 ,
Ambra
Giannetti‡
and
Paolo
Matteini‡

Istituto di Fisica Applicata Nello Carrara – CNR, Via Madonna del Piano 10, Sesto F.no (FI), Italy. E-mail: m.banchelli@ifac.cnr.it; s.tombelli@ifac.cnr.it
First published on 27th October 2023
Abstract
Advantages of biosensors based on surface enhanced Raman scattering (SERS) rely on improved sensitivity and specificity, and suited reproducibility in detecting a target molecule that is localized in close proximity to a SERS-active surface. Herein, a comprehensive study on the realization of a SERS biosensor designed for detecting miRNA-183, a miRNA biomarker that is specific for chronic obstructive pulmonary disease (COPD), is presented. The used strategy exploits a signal-off mechanism by means of a labelled molecular beacon (MB) as the oligonucleotide biorecognition element immobilized on a 2D SERS substrate, based on spot-on silver nanowires (AgNWs) and a multi-well low volume cell. The MB was properly designed by following a dedicated protocol to recognize the chosen miRNA. A limit of detection down to femtomolar concentration (3 × 10⁻¹⁶ M) was achieved and the specificity of the biosensor was proved. Furthermore, the possibility to regenerate the sensing system through a simple procedure is shown: with regeneration by using HCl 1 mM, two detection cycles were performed with a good recovery of the initial MB signal (83%) and a reproducible signal after hybridization.
1 Introduction
With the advancement in nanotechnology and metallic nanostructured materials, surface-enhanced Raman scattering (SERS) has opened exciting new routes for many biosensing applications.1–7 Due to its high sensitivity, SERS has emerged as a powerful technique for disease biomarker detection, including oligonucleotide sequences (DNA, messenger RNA (mRNA), microRNA (miRNA), etc.)8–12 and proteins.13,14Among all biomarkers, scientists are paying increasing attention to miRNAs, which are small (ca. 22 nucleotides in length) non-coding regulatory RNAs with potential to impact the development and progression of nearly all human diseases through interactions with mRNA.15,16 In fact, any single miRNA can potentially target and repress hundreds of mRNAs by a broad network of miRNA–mRNA interactions, therefore affecting a broad range of cellular and biological processes.
In recent years, miRNAs have shown great promise as a novel class of biomarkers for the detection of various diseases, including cancer,17 inflammatory chronic diseases18 and others.19 However, miRNAs have not yet been adopted into clinical practice for diagnostics because of some technical difficulties arising from their intrinsic characteristics, such as the short sequence length, low abundance, high sequence similarity and a wide range of expression levels.
The target of this work is miRNA-183 (miR-183), that is highly expressed in chronic obstructive pulmonary disease (COPD), which is an inflammatory chronic respiratory disease largely heterogeneous not only in clinical symptoms, but also in the variable response to therapy.20 miR-183 as well as miR-200b and miR-200c were found in increased concentration in the blood of patients affected by the disease.21,22 Over the past 10 years, miRNA research in COPD has studied the role that miRNA may play in contributing to the phenotypic heterogeneity of COPD. Several studies on miRNA expression in lung tissues, lung cells, and peripheral blood and immune cells have associated a number of miRNAs with COPD23 as well as with COPD-related phenotypes, such as emphysema24 and the asthma-COPD overlap syndrome.23 COPD patients may display a distinctive miRNA profile of their biological fluids depending on the particular phenotype of the disease; therefore, miRNAs in COPD hold great potential to serve as biomarkers not only for early diagnosis, but also for the investigation of COPD progression and treatment in relation to different phenotypes.
Currently, northern blotting, microarrays, and quantitative RT-PCR are employed as conventional detection methods, which involve elaborate, time-consuming and expensive steps requiring special laboratory equipment.25 To overcome these limitations, the research in this field is currently focused on the detection capabilities of optical bio- and nanosensors, which provide the required sensitivity and increased specificity and offer significant advantages in cost and response time, making them suitable for high-throughput applications.26–28 Among these, high sensitivity can be achieved by means of SERS-based methods, and accordingly, different SERS nanosensors for miRNA biosensing have been realized, in biofluids as well as living cells.29–36 Most of them exploit the immobilization of oligonucleotides on SERS nanoparticles to capture the target miRNA and measure the signal of specific Raman-active probes attached on the nanoparticle surface. However, the facile fabrication of affordable and well-defined labelled nanostructures to produce intense, stable, controllable, and differentiable SERS signals remains challenging.37–40 To achieve the highly sensitive detection of miRNAs, various amplification strategies, based on enzyme-assisted or enzyme-free amplification methods, have been developed and combined with SERS platforms; these strategies provided sensitive miRNA detection methods with LOD values down to sub-femtomolar concentrations.41–43 However, the possibility of practical application of these methods is hampered due to the complicated manipulation of the sample target and the long times required for the amplification procedures; in addition, all these amplification methods require a great amount of reagent consumption with a consequent increase in analysis cost.
To overcome the issues connected to the need of multiple steps for the application of the amplification methods, we propose a promising strategy in sensitive SERS miRNA detection, that indeed does not require any amplification step, by exploiting a signal-off mechanism by means of a labelled molecular beacon (MB) as the oligonucleotide biorecognition element immobilized on the SERS substrate: a MB tagged with a Raman reporter is employed, and the distance between the label and the SERS surface is distinctly changed upon hybridization with miRNA, resulting in a measurable SERS signal variation. This approach has already been developed for the sensitive detection of several miRNAs and gene fragments, achieving a limit of detection (LOD) down to sub-femtomolar concentrations.9,44–47
However, critical limitations for the use of this kind of SERS-based biosensor in practical and clinical routines remain, mainly related to the scarce reproducibility of the SERS system, the high fabrication costs of SERS platforms and the unfeasibility of these SERS systems in probing the target biomolecule in their physiological state. Therefore, the primary issue in SERS biosensing is to take advantage of SERS substrates that are easily and cheaply manufactured; improvements in the production methods of SERS nanosensors can lead to minimization of cost and enhancement in performance. For this purpose, we recently invested considerable effort in implementing low-cost SERS substrates based on silver nanowires (AgNWs) showing superior capabilities as SERS sensing platforms,48–51 in terms of robustness and reproducibility.
Herein, we try to go one step further by engineering a AgNW-based SERS platform aimed at miR-183 detection by (1) designing a specific MB as a biorecognition element to selectively capture miR-183 on the SERS platform and related signal generation; (2) optimizing a sensitive spot-on the AgNW substrate through a rapid and simple procedure; (3) realizing a multi-well cell for SERS inspection of microliter volumes of the target sample. This last feature, avoiding the drying step frequently used in SERS systems,37,38 guarantees the maintenance of the adequate in-solution environment necessary for the MB to adopt the right conformation, both in the absence and in the presence of the target fragment.
The engineering of the multi-well cell and the in-depth optimization of the SERS nanomaterials as well as of the MB bio-interface, were carried out to enhance the sensitivity and to achieve optimal selectivity for the target, leading to a LOD of 0.3 fM. Furthermore, two cycles of detection/regeneration were performed with a recovery of 83% of the initial MB signal and a reproducible signal after hybridization. More importantly, the SERS platform was obtained by means of cost-effective materials and time-saving fabrication procedures without losing reproducibility in the transduction response.
2 Experimental
2.1 Materials
Silver nanowires (AgNWs) 50 nm in diameter and 5–10 μm in length, were obtained from 3D-Nano (Kraków, Poland). Hydrophobic PTFE filter membranes having 0.45 μm pore size (25 mm diameter × 80 μm thickness) obtained from Sartorius GmbH (Göttingen, Germany) were used. All the reagents for the buffers, 6-mercaptohexanol (MCH), ethanol and HCl were purchased from Merck (Milan, Italy). MB and target sequences were purchased from TwinHelix (Milan, Italy). The sequences of the different MBs and the target are reported in Table S1,† where the MB used for the characterization in fluorescence is indicated as MBf. The protocol used to design the MB specific for miRNA-183 is described in detail in section S2 of the ESI.† miRNA-183 SERS biosensing was demonstrated by using a DNA analogue with the same sequence as the miRNA target.2.2 Molecular beacons in fluorescence and SERS approaches
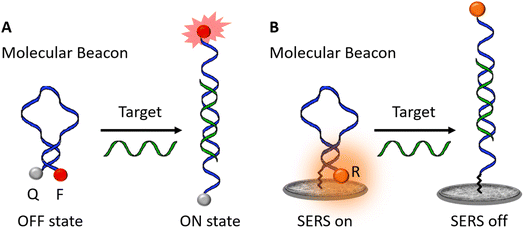
According to the classical definition, a MB is a molecular species undergoing the Förster resonance energy transfer (FRET) phenomenon, i.e. capable of turning on by emitting light upon interaction with its specific target.28Fig. 1A shows the operating scheme of a typical fluorescent MB, which is constituted by an oligonucleotide sequence of about 30–35 bases, having the two side-end portions complementary to each other (4–5 bases on the side), the so-called stem, and then able to close form a circular part (the loop) with a structure defined as a hairpin. The presence of a target species, complementary to the central portion of the MB determines its opening and, in turn, the generation of a fluorescence signal as a result of the increased distance between a fluorophore and a quencher, which are attached to the terminal ends of the MB.On the other hand, in the case of the MB to be used in SERS, a Raman tag attached on one MB end as well as a plasmonic SERS support work as main elements controlling the switch on/switch off of the MB (Fig. 1B).
2.3 Fabrication of a SERS substrate and multi-well cell
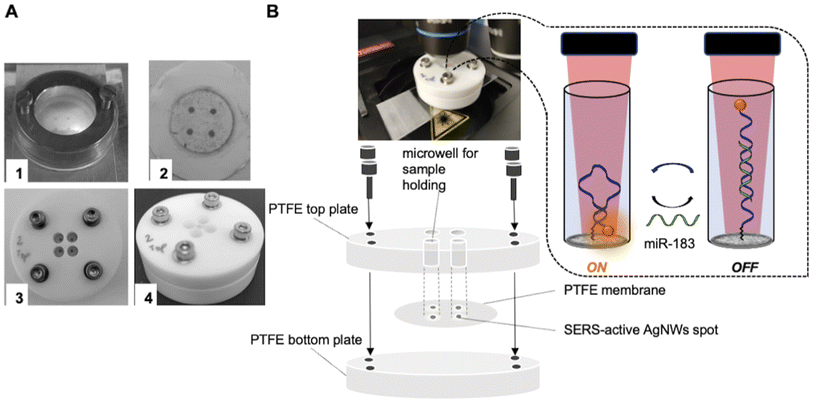
The SERS substrate was obtained from spotted networks of AgNWs, which were previously characterized in terms of optical efficiency, hotspot density and performance in the direct measurements of biomolecules.48 The initial suspension of AgNWs (Ag 0.017 wt%) was diluted in ethanol to reach a 20-time final dilution. The diluted AgNWs were then subjected to filtration under a mild pressure (350 mbar) through porous PTFE membranes: an amount of 2 mL of solution was passed through a PTFE membrane by using an Amicon Stirred cell (Merck Millipore, Milan Italy) after initially wetting the membrane with ethanol before its placement into the filter holder. The substrate was then extensively washed in anhydrous ethanol and there stored in a vacuum until further use.The as-fabricated AgNW assembly on PTFE was finally patterned in the form of dot arrays by using a laser engraving technique. Four SERS-active spots 2 mm in diameter were obtained by patterning the silver layer with a laser engraver (NEJE, λ = 405 nm, max power 3 W, spatial resolution 0.45 μm) in a Petri dish filled with 1 ml of ethanol (Fig. 2A and B, S2 and movie in the ESI†).
A dedicated multi-well cell for the SERS measurements was realized by sandwiching the AgNWs/PTFE substrate between two adjoining PTFE plates as shown in Fig. 2. In detail, the substrate was pressed in between 1 cm-thick bottom and top PTFE plates stabbed with 4 holes 6 mm in diameter and centered at the 4 silver spots of the SERS substrate, as shown in Fig. 2A. Afterwards, the two PTFE plates were tightly assembled to produce 4 microwells, each one containing a SERS-active spot at the bottom. Each microwell was filled with a minimum of 20 μl to a maximum of 40 μl of solution and finally the SERS multi-well cell was placed under a Raman microscope for SERS measurements (Fig. 2B).
2.4 Raman experimental setup
SERS spectra were acquired using a LabRam HR-Evo spectrometer (Horiba, France) working in backscattering geometry, with an excitation wavelength of 633 nm, focused through a 50× objective (Olympus, 0.25 NA, ∼2.5 μm waist) and laser power of 0.5 mW at the sample. For each sample, a total of 25 spectra at different positions within an area of 0.1 mm2 (100 × 100 μm2) of the AgNW spot were collected. Each spectrum was acquired in the range of 1100–1800 cm−1, illuminating the sample for 1 s of integration time, dispersing the scattered light by using a 600 grooves per mm grating, and collecting it with a Peltier cooled CCD detector (Sincerity OE, Horiba).All the spectra were corrected for wavelength, by acquiring the silicon signal of first Raman order (520.8 cm−1) and calibrating the grating at the beginning of each measurement session. Each SERS experiment was conducted in three replicas. Spectral processing and fitting were performed by using Labspec 6 software (Horiba) as follows: spectra were corrected for cosmic ray spikes and baselined (polynomial fit); then Raman bands of interest were fitted through Lorentzian functions to obtain Raman intensity and area. Data fitting in the SERS calibration plots of the MB biosensor with the target was performed by the OriginPro 2022 software by means of a logistic sigmoidal model.
Simulation of the electric field distribution in the near proximity of the AgNWs was performed by using a commercial finite element ,ethod (FEM) package, the wave optical module of COMSOL Multiphysics (v 5.1), as previously reported.48 The local field enhancement factor was expressed as the fourth power of the local normalized electric field intensity at the laser wavelength.
3 Results and discussion
3.1 Molecular beacon: design and characterization
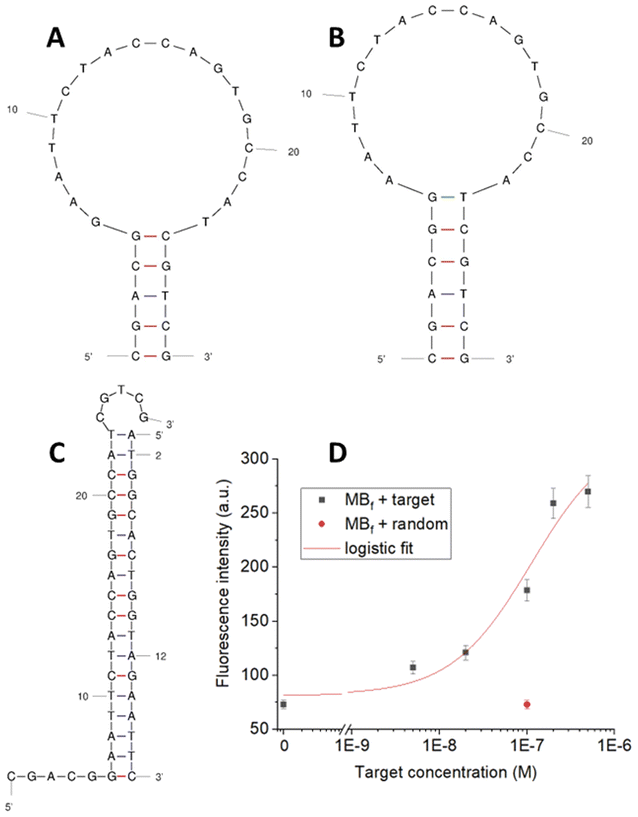
A MB specific for the chosen miRNA, miR-183, was designed and characterized in solution, by using a standard reference spectrofluorometer equipped with multi-well microtiter plates. In particular, a dedicated protocol was followed based on general rules which especially consider the length and base composition of the stem and the loop (details in ESI, section S2†). Two MB sequences, MB1 and MB2, differing in the length of the loop (Table S1†) were designed and characterized by the software UNAFold available online.42 Considering the high energy involved (ΔG0 −2.96 kcal mol−1) and the fact that the stem is very long compared to the loop (9 bases with respect to the 5 hypothesized) for the first MB sequence (MB1), a second MB, MB2, was taken into account. For this sequence two possible conformations, A and B, with a similar ΔG0 and stem/loop length were proposed by the UNAfold software (Fig. 3A and B).The two conformations, A and B, have a stem of 5 and 6 base-pairs with ΔG0 values of −2.88 kcal mol−1 and −2.70 kcal mol−1 respectively, ultimately fulfilling the specific requirements listed in section S2.† The latter sequence was then selected for the hybridization study with the target sequence. Fig. 3C shows the perfect complementarity between the target and the loop of the MB, leaving the part of the decoupled stem at the two side-ends and accounting for a hybridization energy of −21.39 kcal mol−1 (about 10-fold compared to that of the closed MB).
The MB hybridization ability with the target sequence in solution was verified through fluorescence experiments, by introducing Cy5 as a fluorophore at the MB-5′end and BBQ as a fluorescence quencher at the MB-3′end (sequence named MBf, Table S1†). Different concentrations of the target were incubated with the designed MBf and the fluorescence signal generated was compared to the one corresponding to the MBf alone in buffer. A 3.5-fold increase in fluorescence was obtained with the MBf and the target incubated at equal concentrations (200 nM), with a good correlation among the MBf fluorescence and the different tested concentrations (Fig. 3D). A negligible signal, comparable to the one of the MBf in buffer without a target, was obtained with a random oligonucleotide (not complementary, Table S1†) tested at 100 nM (Fig. 3D), demonstrating the high specificity of the interaction. For better characterization of the MB we evaluated the dissociation constant (Kd) value from the calibration shown in Fig. 3D: by using both a 4 parameter logistic function and the similar Hill function, the Kd value can be extracted and approximated to the EC50 value, resulting for this interaction to be ∼80 nM.
For MB immobilization on the SERS substrate, we designed a probe containing the selected MB sequence for target recognition and two different chemical functionalities at the oligonucleotide ends, a HS–(CH2)6– branch near the MB-3′end and a ROX (carboxy-X-rhodamine) molecular tag at the MB-5′end (sequence named MB, Table S1†). The ROX molecule is non-intercalative with DNA strands and is a very efficient Raman tag in DNA SERS sensing, down to the single molecule SERS detection.52
3.2 SERS detection of the target sequence by the selected MB
To realize the MB-based SERS nanoprobe for the detection of the short DNA mimicking miR-183, we exploited the SH function at the 3′-end of the MB for the biofunctionalization of the AgNW SERS substrate through the S–Ag bond,53 while ROX functionalization at the 5′-end of the MB was used for monitoring the aperture and closure of the MB hairpin loop on the SERS surface. The SERS signal-off relies on the effect that the hybridization of the MB with the target induces on the distance of the ROX moiety from the SERS surface. When the MB is immobilized on the AgNW surface in a non-hybridized conformation, the oligonucleotide is suited to assume the most favorable energetic conformation, that is the closed hairpin. In this MB conformation, ROX signals are greatly amplified by the localized plasmon resonances of the silver nanostructured substrate underneath (signal-on). Upon addition of the target, the MB hairpin opens forming a double strand helix, which in turn brings the ROX moiety far away from the SERS surface and, consequently, a decreased SERS enhancement (signal-off).The immobilization of the MB was carried out by incubating 1 μM of the oligonucleotide on the SERS substrate in the microwell. The incubation time of the MB was appropriately fixed to allow the thiol modification to form a covalent-like bond to the silver nanostructures. We chose a prolonged incubation of 120 min to allow sufficient time for the formation of a stable thiol–silver bond, which is the rate-limiting step in the immobilization of thiolated DNA on gold and silver surfaces.54
As a second step, a passivation step of the SERS substrate with a thiolated small molecule was realized. The use of small thiolated molecules after immobilization of thiolated oligonucleotides is a common procedure for surface passivation adopted for biofunctionalized sensor surfaces, usually made of gold (in ‘surface plasmon resonance’, SPR, or ‘quartz crystal microbalance’, QCM, biosensors), to prevent unspecific binding of different molecules to the metal surface and to lift up the DNA probes, which could lie on the surface after immobilization.55,56 For the MB-decorated SERS biosensor in this work, MCH was selected amongst the small molecules due to its identical length to the C6-spacer on the MB, which should ensure complete functionality of the immobilized oligonucleotide by forming a mixed monolayer.57
Accordingly, we prepared two different MB-decorated SERS biosensors, with a pure MB layer and with mixed MB–MCH layer, that were first characterized by SERS and then both used for the quantitative SERS detection of the miRNA target. The SERS spectrum of the immobilized MB, in the absence and in the presence of MCH, is shown in Fig. 4, while Raman assignment of the main peaks is shown in Table 1.28,56,58 The A and T nucleobase bands of the MB have the same intensity in the two spectra, indicating that the conformation and surface density of the MB are comparable in the pure MB and mixed MB–MCH monolayers. More intense signals of CH deformations at 1300 cm−1 and 1435 cm−1 are characteristic of the mixed MB–MCH system and they originate from the MCH passivating layer. In both spectra, two prominent SERS signals of ROX at 1503 cm−1 and 1646 cm−1 are present. For the SERS analysis with the target, we referred to the 1646 cm−1 signal of the ROX molecule, which is located in a clean spectral region with respect to the ROX signal at 1503 cm−1 and to the MB and MCH signals. The 1503 cm−1 band of ROX, although showing an optimal intensity for the SERS transduction of the MB coupling with the target, is highly convoluted with the C–H bending modes in the mixed MB–MCH spectrum, and it cannot be as sensitive as the 1646 cm−1 band in quantitative target detection (Fig. S3†).
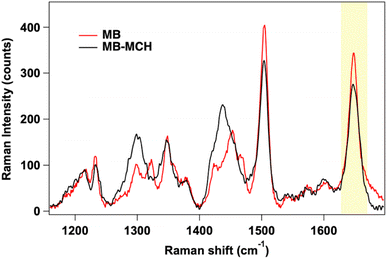 | ||
| Fig. 4 SERS spectrum of MB-decorated AgNWs: with only the MB immobilized (red line) and in the presence of the mixed MB–MCH layer (black line). The key ROX peak for SERS analysis is highlighted. | ||
| Position (cm−1) | MB | MB–MCH |
|---|---|---|
| 1230 | C (MB) | C (MB) |
| 1300 | A (MB) | A, CH (MB, MCH) |
| 1320 | A (MB) | A (MB) |
| 1340 | G (MB) | G (MB) |
| 1372 | T (MB) | T (MB) |
| 1420 | G (MB) | G (MB) |
| 1435 | CH (MCH) | |
| 1448 | C, G, T (MB) | C, G, T (MB) |
| 1457 | CH (MCH) | |
| 1465 | G (MB) | G (MB) |
| 1503 | ν(C–C)ring (ROX) | ν(C–C)ring (ROX) |
| 1646 | ν(C–C)ring (ROX) | ν(C–C)ring (ROX) |
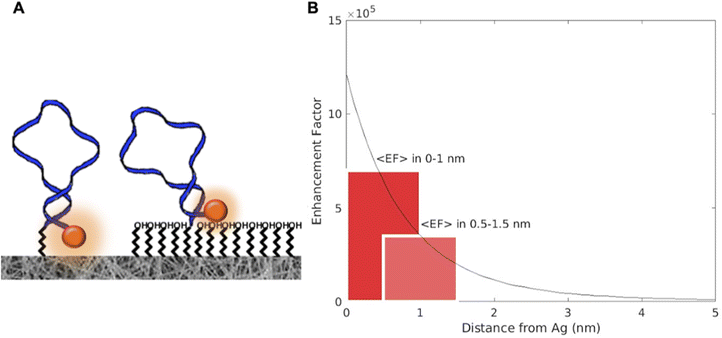
ROX signals appear more intense when the MB stands alone on the SERS surface (peak area at 1646 cm−1, 9219 ± 450 a.u.), while the presence of the mixed MB–MCH layer causes a signal reduction of ROX (peak area at 1646 cm−1, 5640 ± 450 a.u.). The presence of the MCH backfilling layer could force the distancing of the 5′-end of the closed MB hairpin from the SERS surface (scheme in Fig. 5A), thus resulting in significant changes in the SERS intensity of the 5′-end ROX signals.
Actually, the magnitude of the electromagnetic field outside a SERS hot spot generated by a plasmonic nanosystem decays rapidly, implying the existence of a finite sensing volume for molecules in proximity to the SERS surface. In Fig. 5B the result of FEM simulation depicts the enhancement factor in the region between 0 nm and 5 nm from the silver surface.48 When a 1 nm thiol monolayer is deposited, it acts as a spacer layer that interposes between the SERS surface and the ROX that is the Raman reporter. If we assume that SERS signal is proportional to the 4th power of the local electric field, we can estimate the average decrease in the signal due to the increasing distance from the SERS surface. The profile of the calculated enhancement factor (EF) shows that 1 nm far from the SERS surface, the signal can be halved.
In addition, the passivation of the surface with MCH can have a further effect of lifting up the MB eventually lying down onto the nanowires; this latter configuration is coherent with the hypothesis that DNA probes (the MB in this case) can interact with the noble metal not only by the –SH group at one end but also through nucleotide adsorption onto its surface.61 Further treatment with MCH can lead to a more homogeneous surface by displacing the non-specifically adsorbed DNA, resulting in a mixed monolayer of the probe (MB) and MCH.61 In addition, when MCH is added, the MB adsorbed is lifted up, forcing the MB-end carrying the ROX moiety to be at an increased distance from the SERS active surface, inducing the ROX signal decrease.
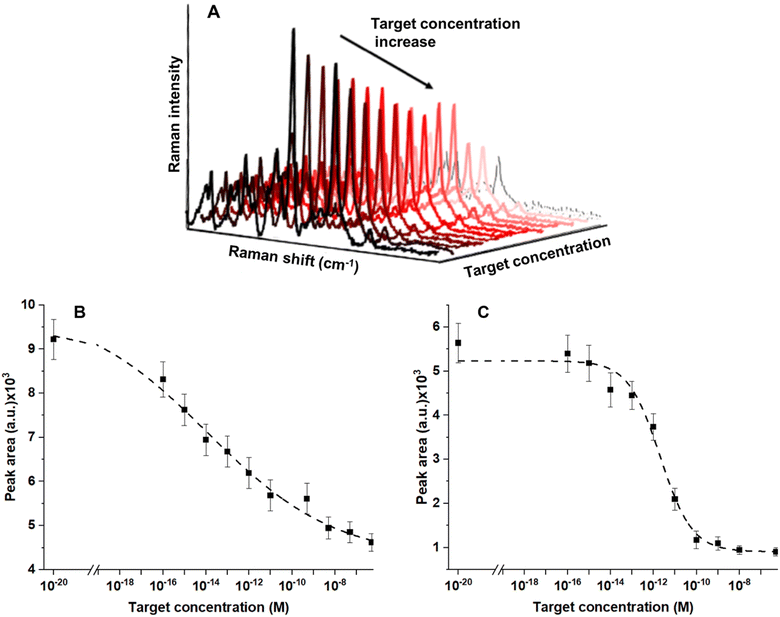
To investigate the analytical performance of the two configurations of the SERS surface, with and without MCH, in both the configurations, standard solutions containing concentration values of the target in the range between 10−6 and 10−16 M were tested. The signal of ROX at 1646 cm−1 can be monitored in the spectra as the target concentration increases from 10−16 to 10−6 M and it can be clearly observed that its intensity gradually decreases (Fig. 6A).
Data analysis for the calculation of the analytical performances of the MB and MB–MCH functionalized biosensor (Fig. 6B and C) was performed as follows. Data fitting in the calibration plots was performed by means of a logistic sigmoidal model described by using the following equation (four parameter logistic regression, eqn (1)), which has been reported to be well correlated with biochemical phenomena:62
 | (1) |
The calibration curves have very good relative fits to the used sigmoidal model with r2 values of 0.990 for both the curves in Fig. 6B and C. For this reason, the fitted curve could be confidently used for the estimation of the LOD because of the optimal correlation with the experimental data. We obtained a LOD of 3 × 10⁻¹⁶ M for the MB, while a higher LOD value, 2.4 × 10⁻¹⁵ M, was obtained in the case of the MCH-functionalized MB. The interassay reproducibility in terms of the average coefficient of variation (CV) was 5% (N = 3) and the intra-assay CV was 4% (N = 3) on independent testing of the same concentration of the target.
3.3 Selectivity and regeneration of the SERS MB-biosensor
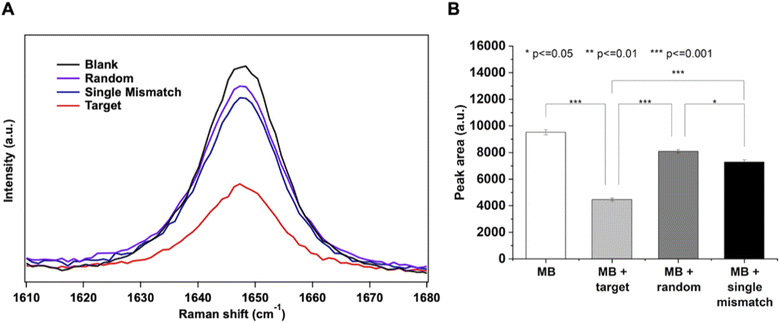
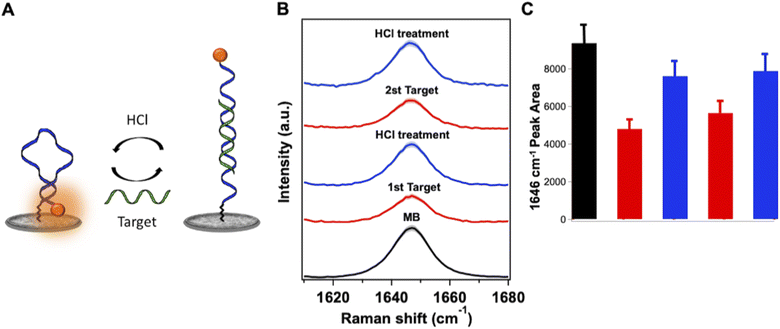
The selectivity of the MB SERS biosensor was investigated against oligonucleotides with the same length and a similar base content as the target. A single mismatch (SM) and a random sequence (R), described in Table S1,† were used at 500 nM concentration for the SERS measurements. The SERS intensity of the ROX band at 1646 cm−1 for SM and R oligonucleotides is close to the intensity of the same band in the blank MB spectrum, as shown in Fig. 7A. At the same time, the target DNA, at the same concentration, induces a large decrease in the SERS intensity of the ROX band, due to the full hybridization with the MB causing the complete opening of the beacon and the SERS switching-off effect. The evaluation of statistically significant differences among data was performed by one-way ANOVA with the Tukey comparison method by using the app “Paired comparison plot” of the OriginPro 2022 software. P ≤ 0.05 was considered statistically significant (Fig. 7B).Finally, the regeneration of the SERS sensor was tested. As oligonucleotides can be reversibly transformed between the single and the double stranded form through appropriate chemical treatment,63 the behavior of the SERS sensor upon acidic treatment with HCl 1 mM after target hybridization has been investigated, in order to dissociate the duplex MB-target and regenerate the target-free sensor surface (Fig. 8A). Interestingly, under such acidic conditions, the AgNW substrate of the sensor retains its SERS efficiency and stability, and the characteristic SERS peak of ROX can be recovered in just 1 minute of HCl treatment. As shown in Fig. 8B and C, after the first hybridization with the target, the regeneration of the sensor by the HCl treatment led to the recovery of the MB signal (83% of the initial value). Furthermore, it was demonstrated that, after the first regeneration, the sensor was still able to detect the target (200 nM, Fig. 8C) and to be regenerated again with full recovery of the MB signal.
3.4 Discussion
In the realization of the MB-decorated SERS biosensor for the quantitative detection of the short DNA mimicking miR-183, we exploited the convenience of an optimized SERS substrate based on AgNWs adapted to a multi-well cell for the study of hybridization of the MB with the target DNA and its quantitative detection. The substrate that was adopted for measuring the SERS spectrum of the MB and the MB/target hybrid relies on a spot-on plasmonic platform, which represents a convenient option when a multi-sample and rapid analysis of microliter volumes of sample is concerned.48 In order to maximize the SERS signal while ensuring the advantages of a cost-effective and practical assay, our strategy included a substrate specifically designed to increase the local molecular density at the SERS hotspots produced from a network of AgNWs, which previously proved successful in the sensitive label-free detection of amyloids and of other biological species down to the micromolar concentration.50,51 The AgNW SERS substrate was fabricated through a simple and rapid procedure and integrated in a multi-well cell for in-liquid measurements. The stability of the SERS substrate is guaranteed by the use of PVP-capped AgNWs which have been demonstrated to be sufficiently stable under different working conditions (pH, buffer composition, etc.) with respect to other Ag nanostructures.64,65A MB specific for miR-183 was properly designed and first tested free in a solution by a conventional fluorescence-based approach, by exploiting the fluorophore/quencher resonance energy transfer that is the standard working principle of MBs. Then, we adopted the ROX-labelled MB for the decoration of the SERS substrate to accomplish signal transduction through a SERS signal-off mechanism. The engineered SERS platform became highly reproducible upon MB immobilization with a relative standard deviation < 8% in the MB signal intensity (Fig. S3†).
Two different approaches for biosensor surface modification were realized and compared: a first configuration contained only a layer of the MB and a second configuration contained a mixed MB–MCH probe layer. We hypothesized that the presence of the MCH passivating molecules on the SERS surface could be beneficial for increasing the homogeneity of the sensing surface and, at the same time, could negatively affect the LOD of the SERS biosensor in target detection. We obtained a LOD of 3 × 10⁻¹⁶ M for the surface with only a MB, while a higher LOD value, 2.4 × 10⁻¹⁵ M, was obtained with the mixed MB–MCH layer. These differences, related to the functionalization of the SERS substrate, were partially explained by considering a combination of factors influencing the immobilized MB and the relative SERS signal; as discussed above, the presence of MCH can increase the distance between ROX and the SERS surface and, as reported elsewhere,66 MCH, commonly optimal for surface passivation on gold, may be not equally useful in the case of the Ag-based surfaces such as the proposed AgNW SERS substrate. However, the treatment with MCH could also lead to a more homogeneous MB coating by removing from the SERS substrate those MBs which are only unspecifically adsorbed or by lifting up the part of the MB adsorbed (Fig. S4†). This effect can explain the reduced sensitivity with MCH at very low concentrations of the target, derived from the increased distance of ROX from the surface in the more regular distribution of a MB; at the same time, the same effect can contribute to the increased sensitivity with MCH in the central part (concentration range, 5 × 10⁻¹⁴ to 1 × 10⁻¹⁰ M, maximum sensitivity increase, 3.5 times) of the curves in Fig. 6A and B, where a more homogeneous layer of probe can lead to a more efficient interaction with the target molecules. These results showed that the sensitivity and, in general, the analytical performances of the MB SERS biosensor depend on how certain factors, such as the MB surface chemistry and the MB/nanostructure mode of interaction, impact the SERS signal transduction for target detection.
The simple MB-based signal-off detection method exploited in this work, offers several advantages with respect to other SERS systems requiring a signal amplification step.9,41–43 In particular, the absence of amplification, both enzyme-based and enzyme-free, leads to analysis time reduction, in the order of 1–2 hours, due to the direct detection of the target which only requires the hybridization step and to a decrease in analysis cost due to a reduced amount of required reagents. The method proposed in this work, based on AgNWs, reached a comparable LOD in the sub-fM range with respect to that of the other SERS biosensors based on MBs and a signal-off mechanism for DNA and miRNA detection (Table 2) which employed different SERS substrates, such as gold and silver nanoparticles (AuNPs and AgNPs) and Ag nanorods.44–47 The use of different sensing conditions (dry, wet and in cells) has been reported, and the possibility of performing the SERS measurement in a low volume multi-well cell, here presented, offers the advantage of maintaining the correct environment for hybridization and MB function exploitation and makes the SERS system more user friendly.
| SERS substrate | Target | Probe and label | Sensing conditions | LOD (fM) | Detection time | Ref. |
|---|---|---|---|---|---|---|
| Ag nanorod array | miRNA, 22 bases | MB, 38 bases, ROX, Cy5 or FAM | Wet | 0.015 | 2 h | 44 |
| AgNP-decorated silicon wafer | DNA, 15 bases (p53 gene) | MB, 25 bases, ROX | Dry | 1 | 2.5 h | 45 |
| AuNPs | DNA, 300 bases (mecA gene) | MB, 25 bases, ROX | In a sensing chamber (sample volume 130 μL) | 8.5 × 10³ | 5 min | 46 |
| AuNP-decorated silicon nanowire array | DNA, 15 bases (p21 gene) | MB, 25 bases, Cy5 | Dry | 10 | 2 h | 47 |
| AgNWs | DNA, 18 bases (miR-183 analogue) | MB, 25 bases, ROX | In a multi-well cell (sample volume 20 μL) | 0.3 | 1 h | This work |
The LOD obtained in the detection of the target, which is below fM levels, has great potential for diagnostic application in COPD disease. Overall, significant improvements of the realized MB SERS biosensor over conventional miRNA biosensing techniques, include low costs (simple and rapid procedure for SERS substrate and MB nanoprobe preparation), short time-to-results (≤1 hour) and enhanced reliability of measurements (high reproducibility of the SERS substrate), together with regeneration capability. The multiplexing potential of the MB SERS biosensor to detect different miRNA targets in biological samples will be further explored to realize a next-generation miRNA biosensor, since understanding the complex role of miRNA in a disease requires a multiplexed approach.
4 Conclusions
In this work, a MB-decorated SERS biosensor for the quantitative detection of short DNAs, mimicking the miR-183 sequence, was realized. A low-cost SERS substrate, adapted to a multi-well cell for measuring μl-volumes of sample, was fabricated and the metal/MB-analyte surface was optimized to achieve the highest signal sensitivity and reliability. SERS signals correlated with the concentration of the target over a range from 10−15 to 10−10 M with a detection of limit of 3 × 10⁻¹⁶ M. Besides the high reproducibility of the SERS biosensing platform, its selectivity was proved. Furthermore, the possibility to regenerate the sensing system through a simple procedure was shown.The biosensor here presented thus possesses great potential for diagnostics, enabling sensitive detection of the miR-183 biomarker. Methods for trace detection of target nucleic acids based on SERS sensing will be implemented in diagnostic and clinical applications as technological advances in platform design and smaller, portable and more robust instrumentation continue to be developed. Moreover, as research is focusing on the immediate diagnostic capabilities of biosensors, the intracellular implementation of SERS biosensors decorated with MBs could enable in vivo real-time monitoring and would pave the way for advancements in delivery and treatment.
Author contributions
Conceptualization, M. B., A. G.; formal analysis, S. T., M. de A., C. T.; writing – original draft preparation, M. B.; writing – review and editing, A. G., S. T., M. de A., C. T., C. D'A. and P. M.; funding acquisition, A. G., F. B. and P. M. All authors have read and agreed to the published version of the manuscript.Conflicts of interest
There are no conflicts of interest to declare.Acknowledgements
Special thanks to Andrea Donati from IFAC-CNR for the collaboration in the realization of the multi-well cell for SERS measurements. We acknowledge the support of the European Union by the Next Generation EU project ECS00000017 ‘Ecosistema dell’Innovazione’ Tuscany Health Ecosystem (THE, PNRR, Spoke 4: Nanotechnologies for diagnosis and therapy) and the Investment Partenariato Esteso PE8 “Conseguenze e sfide dell'invecchiamento”, Age-It project (Ageing Well in an Ageing Society) as well as of the Tuscany Region by the Bando Salute 2018 PRAMA project.Notes and references
- K. A. Willets and R. P. Van Duyne, Annu. Rev. Phys. Chem., 2007, 58, 267–297 CrossRef CAS PubMed.
- A. H. Nguyen, E. A. Peters and Z. D. Schultz, Rev. Anal. Chem., 2017, 36, 20160037 CAS.
- C. Zong, M. X. Xu, L. J. Xu, T. Wei, X. Ma, X. S. Zheng, R. Hu and B. Ren, Chem. Rev., 2018, 118, 4946–4980 CrossRef CAS PubMed.
- X. S. Zheng, I. J. Jahn, K. Weber, D. Cialla-May and J. Popp, Spectrochim. Acta, Part A, 2018, 197, 56–77 CrossRef CAS PubMed.
- J. Langer, D. J. de Aberasturi, J. Aizpurua, R. A. Alvarez-Puebla, B. Auguie, J. J. Baumberg, G. C. Bazan, S. E. J. Bell, A. Boisen, A. G. Brolo, J. Choo, D. Cialla-May, V. Deckert, L. Fabris, K. Faulds, F. J. G. de Abajo, R. Goodacre, D. Graham, A. J. Haes, C. L. Haynes, C. Huck, T. Itoh, M. Ka, J. Kneipp, N. A. Kotov, H. Kuang, E. C. Le Ru, H. K. Lee, J. F. Li, X. Y. Ling, S. A. Maier, T. Mayerhofer, M. Moskovits, K. Murakoshi, J. M. Nam, S. Nie, Y. Ozaki, I. Pastoriza-Santos, J. Perez-Juste, J. Popp, A. Pucci, S. Reich, B. Ren, G. C. Schatz, T. Shegai, S. Schlucker, L. L. Tay, K. G. Thomas, Z. Q. Tian, R. P. Van Duyne, T. Vo-Dinh, Y. Wang, K. A. Willets, C. Xu, H. Xu, Y. Xu, Y. S. Yamamoto, B. Zhao and L. M. Liz-Marzan, ACS Nano, 2020, 14, 28–117 CrossRef CAS PubMed.
- O. Guselnikova, H. Lim, H. J. Kim, S. H. Kim, A. Gorbunova, M. Eguchi, P. Postnikov, T. Nakanishi, T. Asahi, J. Na and Y. Yamauchi, Small, 2022, 18, 2107182 CrossRef CAS PubMed.
- S. Laing, L. E. Jamieson, K. Faulds and D. Graham, Nat. Rev. Chem, 2017, 1, 0060 CrossRef CAS.
- H. T. Ngo, H. N. Wang, T. Burke, G. S. Ginsburg and T. Vo-Dinh, Anal. Bioanal. Chem., 2014, 406, 3335–3344 CrossRef CAS PubMed.
- M. Li, J. Y. Li, X. Zhang, M. M. Yao, P. Li and W. P. Xu, Talanta, 2021, 232, 122432 CrossRef CAS PubMed.
- Y. Liu, S. H. Wu, X. Y. Du and J. J. Sun, Sens. Actuators, B, 2021, 338, 129854 CrossRef CAS.
- Y. M. Si, L. Xu, T. Deng, J. Zheng and J. S. Li, ACS Sens., 2020, 5, 4009–4016 CrossRef CAS PubMed.
- J. Y. Chen, Y. Wu, C. C. Fu, H. Y. Cao, X. P. Tan, W. B. Shi and Z. Y. Wu, Biosens. Bioelectron., 2019, 143, 111619 CrossRef CAS PubMed.
- C. Song, S. Guo, S. Jin, L. Chen and Y. M. Jung, Chemosensors, 2020, 8, 118 CrossRef CAS.
- Y. B. Zhan, R. H. Fei, Y. Lu, Y. Wan, X. M. Wu, J. Dong, D. H. Meng, Q. Y. Ge and X. W. Zhao, Analyst, 2022, 147, 4124–4131 RSC.
- K. R. Aass, T. M. V. Nedal, S. S. Tryggestad, E. Haukas, T. S. Slordahl, A. Waage, T. Standal and R. Mjelle, Sci. Rep., 2022, 12, 12147 CrossRef CAS PubMed.
- K. Saliminejad, H. R. K. Khorshid, S. S. Fard and S. H. Ghaffari, J. Cell. Physiol., 2019, 234, 5451–5465 CrossRef CAS PubMed.
- L. J. Galvao-Lima, A. H. F. Morais, R. A. M. Valentim and E. Barreto, Biomed. Eng. Online, 2021, 20, 21 CrossRef PubMed.
- J. Grillari, R. E. Makitie, R. Kocijan, J. Haschka, D. C. Vazquez, E. Semmelrock and M. Hackl, Bone, 2021, 145, 115787 CrossRef CAS PubMed.
- C. E. Condrat, D. C. Thompson, M. G. Barbu, O. L. Bugnar, A. Boboc, D. Cretoiu, N. Suciu, S. M. Cretoiu and S. C. Voinea, Cells, 2020, 9, 276 CrossRef CAS PubMed.
- S. A. Christenson, B. M. Smith, M. Bafadhel and N. Putcha, Lancet, 2022, 399, 2227–2242 CrossRef PubMed.
- M. E. Ezzie, M. Crawford, J. H. Cho, R. Orellana, S. L. Zhang, R. Gelinas, K. Batte, L. B. Yu, G. Nuovo, D. Galas, P. Diaz, K. Wang and S. P. Nana-Sinkam, Thorax, 2012, 67, 122–131 CrossRef PubMed.
- T. Sato, H. Baskoro, S. I. Rennard, K. Seyama and K. Takahashi, Chronic Obstr. Pulm. Dis., 2016, 3, 382–388 Search PubMed.
- B. D. Hobbs and K. G. Tantisira, Eur. Respir. J., 2019, 53, 1900515 CrossRef CAS PubMed.
- Y. H. Zhuang, B. D. Hobbs, C. P. Hersh and K. Kechris, Front. Genet., 2021, 12, 748356 CrossRef CAS PubMed.
- J. W. Ye, M. C. Xu, X. K. Tian, S. Cai and S. Zeng, J. Pharm. Anal., 2019, 9, 217–226 CrossRef PubMed.
- M. M. Lai and G. Slaughter, Nanomaterials, 2019, 9, 1573 CrossRef CAS PubMed.
- B. N. Johnson and R. Mutharasan, Analyst, 2014, 139, 1576–1588 RSC.
- A. Giannetti, S. Tombelli and F. Baldini, Anal. Bioanal. Chem., 2013, 405, 6181–6196 CrossRef CAS PubMed.
- H. L. Shao, H. Lin, Z. Y. Guo, J. Lu, Y. R. Jia, M. Ye, F. M. Su, L. M. Niu, W. J. Kang, S. Wang, Y. F. Hu and Y. J. Huang, Biosens. Bioelectron., 2019, 143, 111616 CrossRef CAS PubMed.
- J. D. Driskell, A. G. Seto, L. P. Jones, S. Jokela, R. A. Dluhy, Y. P. Zhao and R. A. Tripp, Biosens. Bioelectron., 2008, 24, 917–922 CrossRef CAS PubMed.
- Y. D. Sun, L. Shi, L. Mi, R. Y. Guo and T. Li, J. Mater. Chem. B, 2020, 8, 5178–5183 RSC.
- C. Novara, A. Chiado, N. Paccotti, S. Catuogno, C. L. Esposito, G. Condorelli, V. De Franciscis, F. Geobaldo, P. Rivolo and F. Giorgis, Faraday Discuss., 2017, 205, 271–289 RSC.
- S. Berneschi, C. D'Andrea, F. Baldini, M. Banchelli, M. de Angelis, S. Pelli, R. Pini, D. Pugliese, N. G. Boetti, D. Janner, D. Milanese, A. Giannetti and P. Matteini, Anal. Bioanal. Chem., 2021, 413, 6171–6182 CrossRef CAS PubMed.
- Q. Zhang, J. Liu, Y. R. Dong, W. Li, R. R. Xing, Y. Y. Ma and Z. Liu, ACS Appl. Nano Mater., 2019, 2, 3960–3970 CrossRef CAS.
- J. Liu, Y. R. Wen, H. He, H. Y. Chen and Z. Liu, Chem. Sci., 2018, 9, 7241–7246 RSC.
- W. Ma, M. Z. Sun, P. Fu, S. Li, L. G. Xu, H. Kuang and C. L. Xu, Adv. Mater., 2017, 29, 1703410 CrossRef PubMed.
- C. C. Li, Y. M. Huang, X. Y. Li, Y. R. Zhang, Q. L. Chen, Z. W. Ye, Z. Alqarni, S. E. J. Bell and Y. K. Xu, J. Mater. Chem. C, 2021, 9, 11517–11552 RSC.
- X. M. Lin, Y. Cui, Y. H. Xu, B. Ren and Z. Q. Tian, Anal. Bioanal. Chem., 2009, 394, 1729–1745 CrossRef CAS PubMed.
- H. Q. Liu, Y. N. He and K. Z. Cao, Adv. Mater. Interfaces, 2021, 8, 2100982 CrossRef.
- M. E. Farrell, P. Strobbia, P. M. Pellegrino and B. Cullum, Appl. Opt., 2017, 56, B198–B213 CrossRef CAS PubMed.
- Y. F. Pang, C. W. Wang, J. Wang, Z. W. Sun, R. Xiao and S. Q. Wang, Biosens. Bioelectron., 2016, 79, 574–580 CrossRef CAS PubMed.
- J. Zheng, D. D. Ma, M. L. Shi, J. H. Bai, Y. H. Li, J. F. Yang and R. H. Yang, Chem. Commun., 2015, 51, 16271–16274 RSC.
- X. X. Li, S. J. Ye and X. L. Luo, Chem. Commun., 2016, 52, 10269–10272 RSC.
- C. Y. Song, Y. J. Yang, B. Y. Yang, Y. Z. Sun, Y. P. Zhao and L. H. Wang, Nanoscale, 2016, 8, 17365–17373 RSC.
- H. Wang, X. X. Jiang, X. Wang, X. P. Wei, Y. Zhu, B. Sun, Y. Y. Su, S. D. He and Y. He, Anal. Chem., 2014, 86, 7368–7376 CrossRef CAS PubMed.
- A. H. Nguyen, S. Song, H. T. Do, L. N. Mai, T. T. Trinh and K. Rajaram, NanoTrends, 2023, 2, 1–8 Search PubMed.
- X. P. Wei, S. Su, Y. Y. Guo, X. X. Jiang, Y. L. Zhong, Y. Y. Su, C. H. Fan, S. T. Lee and Y. He, Small, 2013, 9, 2493–2499 CrossRef CAS PubMed.
- M. Banchelli, C. Amicucci, E. Ruggiero, C. D’Andrea, M. Cottat, D. Ciofini, I. Osticioli, G. Ghini, S. Siano, R. Pini, M. d. Angelis and P. Matteini, ChemNanoMat, 2019, 5, 1036–1043 CrossRef CAS.
- C. Amicucci, C. D’Andrea, M. de Angelis, M. Banchelli, R. Pini and P. Matteini, Nanomaterials, 2021, 11, 1495 CrossRef CAS PubMed.
- A. Barucci, C. D'Andrea, E. Farnesi, M. Banchelli, C. Amicucci, M. de Angelis, B. Hwang and P. Matteini, Analyst, 2021, 146, 674–682 RSC.
- M. Banchelli, R. Cascella, C. D'Andrea, L. Cabaj, I. Osticioli, D. Ciofini, M. S. Li, K. Skupien, M. de Angelis, S. Siano, C. Cecchi, R. Pini, G. La Penna, F. Chiti and P. Matteini, RSC Adv., 2020, 10, 21907–21913 RSC.
- W. N. Fang, S. S. Jia, J. Chao, L. Q. Wang, X. Y. Duan, H. J. Liu, Q. Li, X. L. Zuo, L. H. Wang, N. Liu and C. H. Fan, Sci. Adv., 2019, 5, aau4506 CrossRef PubMed.
- L. G. Carrascosa, L. Martinez, Y. Huttel, E. Roman and L. M. Lechuga, Eur. Biophys. J. Biophys. Lett., 2010, 39, 1433–1444 CrossRef CAS PubMed.
- K. B. Frohling, T. S. Alstrom, M. Bache, M. S. Schmidt, M. N. Schmidt, J. Larsen, M. H. Jakobsen and A. Boisen, Vib. Spectrosc., 2016, 86, 331–336 CrossRef.
- C. Song, Z. Ma, C. Li, H. Zhang, Z. Zhu and J. Wang, Biosensors, 2022, 12, 643 CrossRef CAS PubMed.
- J. A. Ribeiro, M. G. F. Sales and C. M. Pereira, TrAC, Trends Anal. Chem., 2022, 157, 116766 CrossRef CAS.
- S. Park, K. A. Brown and K. Hamad-Schifferli, Nano Lett., 2004, 4, 1925–1929 CrossRef CAS.
- E. Pyrak, J. Krajczewski, A. Kowalik, A. Kudelski and A. Jaworska, Molecules, 2019, 24, 4423 CrossRef CAS PubMed.
- M. L. Coluccio, F. Gentile, G. Das, G. Perozziello, N. Malara, S. Alrasheed, P. Candeloro and E. Di Fabrizio, J. Opt., 2015, 17, 114021 CrossRef.
- R. Gillibert, M. N. Triba and M. L. de la Chapelle, Analyst, 2018, 143, 339–345 RSC.
- J. N. Murphy, A. K. H. Cheng, H. Z. Yu and D. Bizzotto, J. Am. Chem. Soc., 2009, 131, 4042–4050 CrossRef CAS PubMed.
- M. A. Oconnell, B. A. Belanger and P. D. Haaland, Chemom. Intell. Lab. Syst., 1993, 20, 97–114 CrossRef CAS.
- D. Zopf, A. Pittner, A. Dathe, N. Grosse, A. Csaki, K. Arstila, J. J. Toppari, W. Schott, D. Dontsov, G. Uhlrich, W. Fritzsche and O. Stranik, ACS Sens., 2019, 4, 335–343 CrossRef CAS PubMed.
- A. Madeira, M. Plissonneau, L. Servant, I. A. Goldthorpe and M. Treguer-Delapierre, Nanomaterials, 2019, 9, 899–907 CrossRef CAS PubMed.
- M. Tejamaya, I. Romer, R. C. Merrifield and J. R. Lead, Environ. Sci. Technol., 2012, 46, 7011–7017 CrossRef CAS PubMed.
- E. Pyrak, K. Jedrzejewski, A. Szaniawska and A. Kudelski, Molecules, 2021, 26, 4246 CrossRef CAS PubMed.
Footnotes |
| † Electronic supplementary information (ESI) available. See DOI: https://doi.org/10.1039/d3ay01661g |
| ‡ Both A. G. and P. M. are to be considered as last authors. |
| This journal is © The Royal Society of Chemistry 2023 |

