Rapid diagnosis of acute myocardial infarction based on reverse transcription-accelerated strand exchange amplification of miR-208a†
Ying
Zhao‡
 a,
Linlin
Zhuang‡
a,
Peilong
Tian
a,
Ming
Ma
*a,
Guoqiu
Wu
*b and
Yu
Zhang
a,
Linlin
Zhuang‡
a,
Peilong
Tian
a,
Ming
Ma
*a,
Guoqiu
Wu
*b and
Yu
Zhang
 *a
*a
aState Key Laboratory of Digital Medical Engineering, Jiangsu Key Laboratory for Biomaterials and Devices, School of Biological Science and Medical Engineering & Collaborative Innovation Center of Suzhou Nano Science and Technology, Southeast University, Nanjing 210096, P. R. China. E-mail: zhangyu@seu.edu.cn; maming@seu.edu.cn
bCenter of Clinical Laboratory Medicine, Zhongda Hospital, Southeast University, Nanjing 210009, P. R. China. E-mail: nationball@163.com
First published on 23rd August 2023
Abstract
Acute myocardial infarction (AMI) is a prevalent cardiovascular disease associated with high morbidity and mortality, posing a significant threat to human health. Therefore, early diagnosis of AMI has become a focal point of research. MiR-208 is specifically expressed in the heart and is involved in the regulation of cardiomyocyte hypertrophy, cardiac fibrosis, and other myocardial gene expressions. It is expected to be applied in the clinical detection of AMI due to its release by damaged myocardial cells within 3 hours of AMI. In this study, we developed a denatured bubble-mediated reverse transcription-accelerated strand exchange amplification (RT-ASEA) method to detect the early biomarker miR-208a of AMI. The novel approach allowed rapid amplification of miR-208a in 15 minutes, with good performance in terms of repeatability (CV < 6%), determination limit (1 × 100 pmol L−1), and linearity (R2 = 0.9690). Based on the analysis of 42 clinical samples, a strong correlation was observed between the Ct value of miR-208a detected by the RT-ASEA method and the cTnI concentration, considered the gold standard for diagnosis of AMI. The research suggested that the RT-ASEA method could be applied to distinguish between AMI and healthy groups. The area under the receiver operating characteristic curve (AUC) was 0.9976, with a sensitivity of 96% and a specificity of 100%. Optimized RT-ASEA is a reliable and efficient method for miRNA detection. Furthermore, this study provides crucial data support for the development of miR-208a as an early biomarker for AMI, which is of great significance in life and health.
1. Introduction
Cardiovascular disease is one of the leading causes of death in the world, and its morbidity and mortality are at the forefront, even higher than those of cancer and other diseases.1 Acute myocardial infarction (AMI) occurs when a thrombus completely occludes a coronary artery, which can lead to myocardial ischemia and myocardial injury, causing irreversible damage to the heart.2 AMI is the most serious manifestation of coronary artery disease, and the first 90 minutes after onset are considered the golden time for successful AMI treatment.3 Thus, it is of great significance to identify early biomarkers of AMI to achieve early diagnosis and reduce the mortality rates of AMI.4The current gold standard for clinical diagnosis of AMI is cardiac troponin I (cTnI).5 Studies have shown that cTnI can only be detected in plasma 4 to 12 hours after the onset of chest pain.6 Moreover, the expression level of cTnI increases in severe heart failure, atrial fibrillation and other cardiac diseases, as well as in non-cardiac diseases such as chronic kidney disease and septic shock.7 In addition, traditional biomarkers used for early diagnosis of AMI include creatine kinase MB (CK-MB), myoglobin (Myo), and heart fatty acid-binding protein (H-FABP).8,9 However, the specificity of these markers is poor,10 and the expression levels of Myo and H-FABP return to the baseline within 20 hours, leading to the possibility of misdiagnosis and missed diagnosis.11,12 Therefore, finding new biomarkers with higher sensitivity and specificity has become an urgent issue in the clinical diagnosis of AMI.13
MicroRNA (miRNA) is a class of endogenous non-coding single-stranded RNA with a length of 19–24 nucleotides.14 Dysregulation of miRNA expression has been demonstrated in a variety of diseases, including cancer, cardiovascular disease and diabetes.15 Currently, numerous studies have demonstrated that the expression levels of miRNA change earlier than those of traditional myocardial infarction markers in response to myocardial infarction and exhibit high specificity.16,17 In the early stage of AMI (within 6 h), the expression levels of various miRNA in the human body will be significantly up-regulated, such as miR-1,18 miR-133a,19 miR-208a,20 miR-328,21 and miR-499a.22 Among them, miR-208a is specifically expressed in the heart and is involved in the regulation of cardiomyocyte hypertrophy, cardiac fibrosis, and other cardiac gene expressions.23 It has been shown that miR-208a induces myocardial fibrosis in acute myocardial infarction by increasing myocardial endoglin expression.24 Within an hour of AMI onset, the level of miR-208a significantly increases to a detectable level and reaches the peak in 3 hours.25 Thus, miR-208a is a promising early diagnostic marker for AMI that could potentially replace cTnI.
Northern blotting is the earliest assay for systematic analysis of miRNA expression. Nevertheless, the probe hybridization-based method suffers from low specificity and sensitivity, as well as prolonged assay duration and excessive sample consumption.26 The microarray chip technology, resembling northern blotting, is frequently used for high-throughput detection of miRNA. While the detection speed of this method is relatively fast, its sensitivity and selectivity are often compromised due to the short length and high sequence similarity of miRNAs of the same species.27 Furthermore, the high cost of this method can be a limiting factor in its widespread use. Quantitative real-time-polymerase chain reaction (qRT-PCR) is considered the gold standard for miRNA detection due to its high sensitivity and strong specificity.28 However, in contrast to that of DNA, the detection of miRNA requires a reverse transcription step before PCR amplification, which prolongs the assay time. It is not conducive to early diagnosis based on miRNA biomarkers. In addition, many novel miRNA detection methods are now being developed based on nanomaterials. Zhang et al. used hairpin DNA-templated silver nanoclusters as a fluorescence-enhanced beacon for strand displacement amplification (SDA), achieving single and dual detection methods for miRNAs.29 Zou et al. constructed a novel suspension array platform based on AIEgen-encoded microspheres for miRNA multiplex detection.30 Although these methods convert miRNA signals into multiple fluorescence signals to achieve multiple detection, the sensitivity and the limit of detection need to be further optimized.
In 2016, Shi et al. first proposed strand exchange amplification (SEA) based on denatured bubbles for RNA detection.31 The SEA method performs isothermal amplification of RNA by primer invasion of denatured bubbles produced during DNA respiration, which can prevent high-temperature thermal denaturation from completely opening the DNA double-strand, thus effectively reducing amplification time. When double-stranded DNA bases are partially opened to form DNA-denatured bubbles, a short oligonucleotide sequence can invade and extend under the action of Bst 2.0 WarmStart™ DNA polymerase.32 Due to the reverse transcriptase activity and strand-displacement activity of Bst 2.0 WarmStart™ DNA polymerase, reverse transcription and amplification of miRNA can be performed in the same system.33 Compared with traditional isothermal amplification methods such as loop-mediated isothermal amplification (LAMP),34 rolling circle amplification (RCA),35 and other isothermal amplification methods, SEA only requires one enzyme and a pair of primers to achieve efficient amplification of the target miRNA. However, isothermal amplification based on SEA is time-consuming (taking approximately 1 hour) and prone to producing non-specific amplification, which is not suitable for real-time detection in clinical applications.
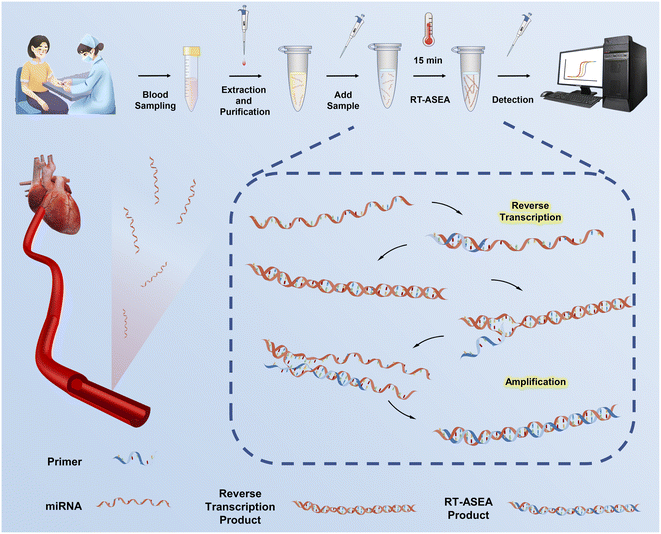
In order to achieve early diagnosis of AMI, a denatured bubble-mediated reverse transcription-accelerated strand exchange amplification (RT-ASEA) method was established and optimized to detect the early biomarker miR-208a of AMI. After extracting miRNA from blood samples, RT-ASEA was applied to significantly enhance amplification efficiency by utilizing a series of narrow loops (Fig. 1). RT-ASEA required only one pair of primers and a single enzyme to complete reverse transcription and rapid amplification of miR-208a within 15 minutes, realizing the quantitative detection of miR-208a. The results of real-time fluorescence quantitative detection showed that the RT-ASEA method established in this study has the advantages of high sensitivity, strong specificity and a wide linear range. Verified using 42 clinical samples, there is a strong correlation between the Ct value of miR-208a detected by the RT-ASEA method and the concentration of cTnI, the gold standard for AMI, showing high specificity and sensitivity in the diagnosis of clinical AMI. The optimized RT-ASEA method exhibits great potential as a dependable research approach for miRNA studies and provides technical support for the detection of biomarkers in clinical diseases. It shows good performance in terms of easy operation, short detection time and high efficiency, compared with SEA, LAMP and qRT-PCR, which are commonly used in RNA detection.
2. Experimental
2.1. Design of RT-ASEA primers
Based on the sequence information of miR-208a-3p in the miRBase database, a pair of RT-ASEA primers was designed using Primer Premier 5.0 (Premier Biosoft, Canada). The forward primer is homologous to the 5′ end sequence of miR-208a-3p, and the reverse primer is complementary to the 3′ end sequence of miR-208a-3p. The stability of the primers was evaluated using NUPACK online software,36 and the specificity of the primers was further verified using the basic local alignment search tool (BLAST) and primer-BLAST provided by the National Center for Biotechnology Information (NCBI). All the above primers were synthesized by Shanghai Sangon Biotech Co., Ltd (Sangon Biotech, Shanghai, China).2.2. Establishment of the RT-ASEA method and enzymatic validation
HPLC-purified miR-208a-3p was synthesized by Shanghai Sangon Biotech Co., Ltd (Sangon Biotech, Shanghai, China) and dissolved in 10 nM using RNase-free water. The final volume for the RT-ASEA reaction was 20 μL, including 2 μL 10× isothermal amplification buffer, 2 μL dNTPs (10 mM each) (New England Biolabs, Massachusetts, USA), 2 μL PEG-200 (Solarbio, Beijing, China), 1.2 μL MgSO4 (100 mM), 1 μL 20× Eva Green (Maokang Biotechnology, Shanghai, China), 0.8 μL Bst 2.0 WarmStart™ DNA polymerase (New England Biolabs, Massachusetts, USA), 1.5 μL forward primer and 1.5 μL reverse primer Primer (10 μM), 4 μL template, and 4 μL RNase-free water (TaKaRa, Beijing, China). The RT-ASEA reaction was performed in 50 narrow cycles (denaturation at 70 °C for 6 s and amplification at 60 °C for 8 s). The amplification results were analyzed using the amplification curve of a QuantStudio 3 Real-Time PCR System (Thermo Fisher Scientific, Massachusetts, USA), and the amplified products were observed by 3.5% (w/v) agarose gel electrophoresis.In order to verify the feasibility and accuracy of the strand exchange amplification method, the restriction endonuclease AluI was used for verification. The total volume of the enzyme digestion reaction was 20 μL, including 5 μL amplification product, 1.5 μL AluI (New England Biolabs, Massachusetts, USA), 2 μL CutSmart buffer and 11.5 μL RNase-free water (TaKaRa, Beijing, China). After incubation at 37 °C for 1 h, the digested products were electrophoresed on a 3.5% agarose gel at 100 V for 40 min, and the bands were observed under ultraviolet light. A 20 bp DNA ladder (TaKaRa, Beijing, China) was used as a reference.
2.3. Optimization of reaction conditions and systems
The denaturation temperature, amplification temperature, template amount, denaturation time and amplification time of RT-ASEA all have significant impacts on the amplification efficiency. To optimize the reaction temperature, the denaturation temperature was first set to 69 °C, 70 °C, 71 °C, 72 °C and 73 °C, respectively, and each reaction included a positive control (miR-208a) and no-template control (RNase-free water). Then, according to the determined optimal denaturation temperature, the amplification temperature was set to 58 °C, 59 °C, 60 °C, 61 °C and 62 °C for amplification. In order to improve the amplification efficiency of RT-ASEA, the amount of template was set to 1 μL, 2 μL, 3 μL, 4 μL and 5 μL. Finally, the important impact of denaturation time and amplification time on the performance of the RT-ASEA method during the thermal cycling process was considered. Denaturation times of 4 s, 5 s, 6 s, 7 s, 8 s and amplification times of 5 s, 6 s, 7 s, 8 s, 9 s were tested. The fluorescence curves were analyzed to determine the optimal conditions for amplification.2.4. Performance evaluation of the RT-ASEA method
Based on the determined optimal reaction conditions, the repeatability test of miR-208a was performed using the RT-ASEA method, and miR-208a and RNase-free water were used as the positive control and no-template control (NTC), respectively. Each control was analyzed 10 times. RT-ASEA was carried out for 50 cycles under optimal conditions (70 °C for 6 s and 60 °C for 8 s). The fluorescent signals generated during the amplification process were measured using QuantStudio 3 Real-Time PCR System (Thermo Fisher Scientific, Massachusetts, USA).Due to the short length of miRNA and highly similar homologous sequences, it is extremely challenging to distinguish miRNA family members.37 In order to evaluate the selectivity of the RT-ASEA method, miR-208a, miR-133a, miR-499a and a non-complement sequence were respectively used as reaction templates to carry out RT-ASEA amplification under the determined optimal reaction conditions. The fluorescence signals were measured using the QuantStudio 3 Real-Time PCR System (Thermo Fisher Scientific, Massachusetts, USA). Each sample was analyzed in triplicate.
To determine the determination limit of the RT-ASEA method applied to miR-208a, RT-ASEA was performed using different concentrations of miR-208a as a template. Using Easy Dilution (TaKaRa, Beijing, China), miR-208a was serially diluted 10 times from 1 × 10⁵ pmol L−1 to 1 × 10⁻¹ pmol L−1. At the same time, RNase-free water was used as the NTC. All experiments were carried out under optimized reaction conditions. The fluorescent signals were measured using the QuantStudio 3 Real-Time PCR System (Thermo Fisher Scientific, Massachusetts, USA). Samples at each concentration were analyzed in triplicate.
2.5. Detection of miR-208a in clinical samples
A total of 42 blood samples were collected from Zhongda Hospital of Southeast University. Among these samples, 25 patients with elevated cTnI values diagnosed as AMI were included in the AMI group. All patients in this group met the diagnostic criteria for AMI, and malignant tumors, liver and kidney insufficiency, and previous CVDs such as myocardial infarction and stroke were excluded. At the same time, 17 healthy people (without physical abnormalities and no drug treatment) who underwent physical examination in the immediate vicinity were randomly selected as the control group. The above samples are the remaining samples after clinical testing. Peripheral blood was collected and stored in EDTA anticoagulant tubes. After centrifugation at 2000g for 10 min at 4 °C, the upper plasma was collected for miRNA extraction. The collected plasma was subjected to cell lysis and miRNA extraction using an miRNA extraction kit (Cwbio, Taizhou, China), and 30 μL RNase-free water was used to elute miRNA. The concentration and purity of the extracted miRNA were determined using a NanoDrop micro-spectrophotometer (Macylab Instrument, Hangzhou, China). GraphPad Prism 8.0 was used to analyze the data, considering that P < 0.001 for the difference was extremely statistically significant. Clinical human serum samples were collected from Zhongda Hospital and informed consent was obtained before the study was performed. All extracted miRNA samples were stored at −80 °C until use. All experiments complied with relevant laws and institutional guidelines and were conducted in accordance with the 1975 Declaration of Helsinki and later amendments. The research project reported herein was approved by the Research Ethics Committee of Zhongda Hospital.In order to verify the detection performance of the RT-ASEA method in clinical samples for miR-208a, the correlation between the RT-ASEA results and cTnI concentration was analyzed for 42 clinical blood samples. The NTC was set for each RT-ASEA reaction, and the reaction process was determined using the QuantStudio 3 Real-Time PCR System (Thermo Fisher Scientific, Massachusetts, USA). All RT-ASEA experiments were performed in triplicate. A confusion matrix was constructed and a receiver characteristic curve (ROC) was plotted according to Table S1.† Sensitivity and specificity were calculated according to eqn (1)–(5) in the ESI.†38
3. Results and discussion
3.1. Design of RT-ASEA primers
Authoritative gene sequence databases such as NCBI (National Center for Biotechnology Information) and miRBase show that miR-208a is located at the position 23388596–23388666 on the 14th chromosome of the human body. The precursor pre-miRNA-208a was 71 nt in length, and two mature miRNAs with a length of 22 nt were formed after cutting the stem-loop with the Dicer enzyme, namely miR-208a-3p and miR-208a-5p. The Genotype-Tissue Expression Project (GTEx) database shows that miR-208a is highly specifically expressed in heart diseases (Fig. S1†). In order to verify the potential value of miR-208a as an early biomarker of AMI disease, miR-208a-3p was selected as the target sequence to establish a new method of reverse transcription-accelerated strand exchange amplification (RT-ASEA) for the detection of acute myocardial infarction.Based on the target sequence miR-208a-3p, a pair of strand exchange amplification primers were designed using Primer Premier 5.0 (Premier Biosoft, Canada), and the primer sequences are shown in Table 1. The length of the forward primer (Primer-F) sequence is 25 nt, which is homologous to the target sequence. The reverse primer (Primer-R) sequence is 25 nt in length and is complementary to the target sequence. In addition, an AluI restriction site (AG▲CT) was designed in the sequence of the reverse primer to verify the accuracy of RT-ASEA. The secondary structure stability of the two primers was tested using the online website NUPACK, as shown in Fig. S2.† According to the evaluation by NUPACK, the two designed primers were confirmed to stably exist in the reaction system in a single-stranded form, without self-circularization or intermolecular hybridization. As a result, the problem of non-specific amplification was effectively avoided.
| Names | Sequences (5′–3′) | Number of bases |
|---|---|---|
| a The underlined sequence in Primer-F is homologous to that of the target, and the dotted sequence in Primer-R is complementary to the target. The sequence in italics is the recognition site of the AluI enzyme (AG▲CT). | ||
| miR-208a-3p | AUAAGACGAGCAAAAAGCUUGU | 22 nt |
| Primer-F |

|
25 nt |
| Primer-R |

|
25 nt |
3.2. Establishment of the RT-ASEA method and enzymatic validation
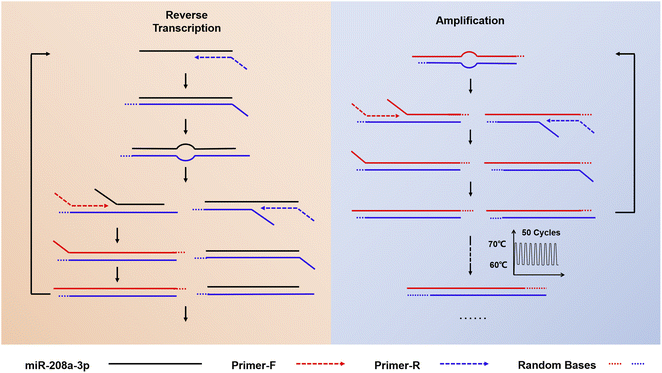
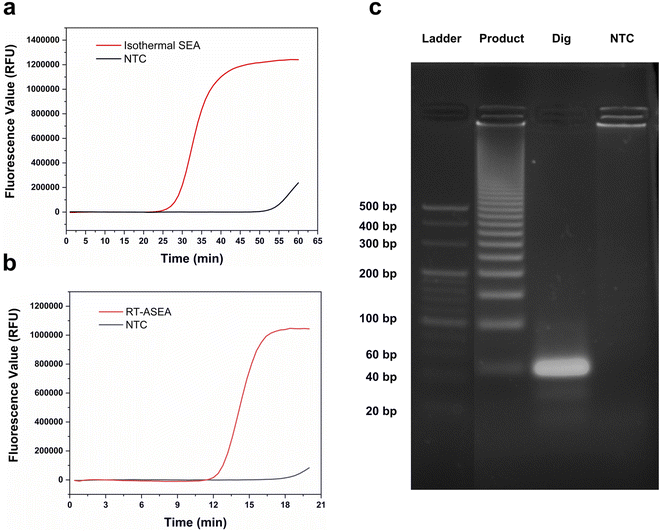
The schematic diagram of the amplification of miR-208a using RT-ASEA is shown in Fig. 2. At the beginning of the reaction, Primer-R hybridizes to the target sequence and is extended by Bst 2.0 WarmStart™ DNA polymerase to synthesize a complementary DNA strand. Subsequently, Primer-F binds to the newly synthesized DNA strand and extends to produce a complementary DNA strand. In the narrow cycling process, as the temperature increases, numerous denaturation bubbles are formed in the double-stranded DNA. The two primers invade the denaturation bubbles and bind to the DNA strands, initiating efficient strand-displacement amplification. Because the Bst 2.0 WarmStart™ enzyme has 5′-3′ DNA polymerase activity and strong strand displacement activity but lacks exonuclease activity, after the amplification is completed, there will be some random bases at the 3′ end of the newly synthesized strand that cannot be excised and are retained. The new product will serve as the template for the next amplification, causing the 3′ terminal bases of the amplification product to continuously accumulate.39–41To realize the rapid amplification and detection of miR-208a, the RT-ASEA method was preliminarily established based on the designed reaction system and amplification program. In order to reflect the effective improvement of the narrow cycle for the amplification efficiency of RT-ASEA, the same reaction system was reacted at a constant temperature of 60 °C for 1 h. Fig. 3 shows the amplification curves of the two methods and agarose gel electrophoresis results. It can be seen that the isothermal amplification reaction reaches the plateau (one cycle for 60 s) in about 45 minutes, and the NTC will have a detectable fluorescent signal in about 50 minutes. The RT-ASEA method can reach the plateau in about 15 minutes (one cycle for about 20 s). In order to verify the feasibility and accuracy of the strand exchange amplification method, the amplification product was digested with the restriction endonuclease AluI. Fig. 3c shows the electrophoresis results of the amplified products, digested products and NTC in agarose gel. It can be seen that the amplification product is a series of gradient bands, which is the result of the continuous accumulation of 3′ terminal bases during the amplification process. After cutting at a specific site, only a single bright band of about 44 bp remained, and there was no obvious band in the NTC group. It is proven that the strand exchange amplification method is feasible. In Fig. 3b, it can be seen that the NTC will show weak non-specific amplification after 20 min. Since the two primers are based on the principle of SEA, the preferred primers are obtained through the comprehensive screening using Primer Premier 5.0 (Premier Biosoft, Canada) and the BLAST in NCBI.42 To reduce non-specific amplification, the reaction system and conditions will be further optimized.
3.3. Optimization of reaction conditions and systems
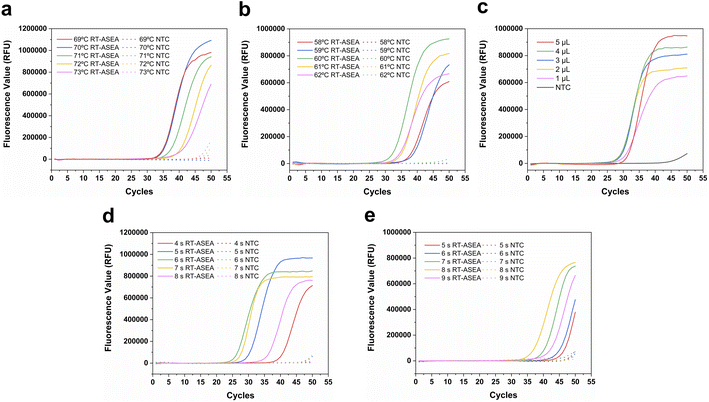
In order to improve the amplification efficiency of RT-ASEA and suppress non-specific amplification, some important conditions in the reaction were optimized (Fig. 4). As an important factor for the combination and extension of primers and templates, the denaturation temperature and amplification temperature were first optimized respectively. It can be seen from Fig. 4a that at a denaturation temperature of 70 °C, the Ct value of the amplification reaction is the smallest and the fluorescence value in the plateau phase is the highest. 70 °C was used as the optimal denaturation temperature. Similarly, 60 °C was selected from 58 °C to 62 °C as the optimal amplification temperature (Fig. 4b). The amount of template is also one of the important reaction conditions. The amount of template was set from 1 μL to 5 μL for amplification, and the threshold cycle number Ct was used as the criterion, and finally 4 μL was selected as the template amount. In addition, denaturation time and amplification time also have an important impact on the amplification efficiency. As shown in Fig. 4d, 6 s corresponds to the minimum threshold cycle number and the highest amplification efficiency, so 6 s was used as the denaturation time. It can be seen that the amplification efficiency is highest when the denaturation time is 8 s. In the optimized reaction system, it only takes 15 minutes for the amplified miR-208a to reach the plateau.3.4. Performance evaluation of the RT-ASEA method
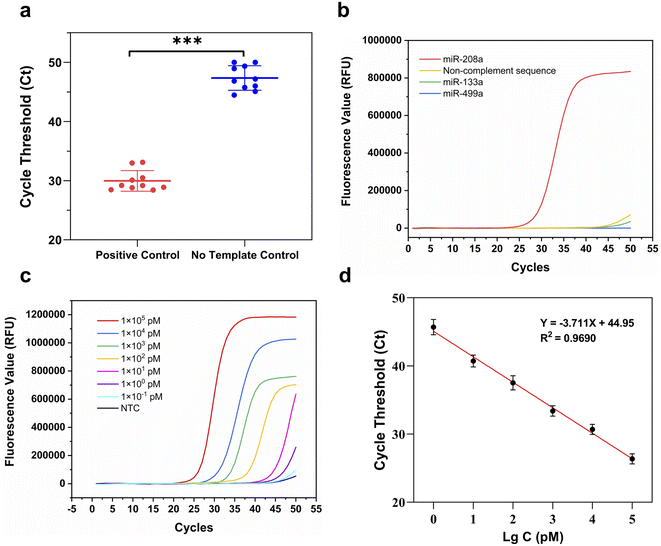
The repeatability, selectivity and determination limit of the RT-ASEA method were analyzed under the optimized reaction conditions and reaction system. First, the repeatability test of the RT-ASEA method was carried out with miR-208a and RNase-free water as positive control and no-template control. Each sample was analyzed 10 times. As shown in Table 2 and Fig. 5a, the Ct values of the positive samples ranged from 28.40 to 33.09, and the coefficient of variation was 5.85%. The Ct values of the NTC were between 44.47 and 50.00, and the coefficient of variation was 4.38%. It shows that the Ct values of the two groups of samples are significantly different (P < 0.001), and the repeatability of the RT-ASEA method is good.| Samples | 1 | 2 | 3 | 4 | 5 | 6 | 7 | 8 | 9 | 10 | CV |
|---|---|---|---|---|---|---|---|---|---|---|---|
| Positive | 28.81 | 28.87 | 30.49 | 30.08 | 29.20 | 28.40 | 33.09 | 29.17 | 32.98 | 28.46 | 5.85% |
| NTC | 45.76 | 46.00 | 44.47 | 45.08 | 47.19 | 46.84 | 50.00 | 50.00 | 49.36 | 48.94 | 4.38% |
AMI is associated with dysregulation of multiple miRNA levels, such as miR-133a and miR-499a. Therefore, to assess the selectivity of the RT-ASEA method, miR-133a, miR-499a and a randomly synthesized segment of a non-complement sequence were selected for simultaneous amplification with miR-208a. The amplified sequences are shown in Table 3. As shown by the amplification curve in Fig. 5b, RT-ASEA was specific only for miR-208a, and the other RNA fragments did not show significant fluorescent signals.
| miRNA | Sequences (5′–3′) | Number of bases |
|---|---|---|
| miR-208a-3p | AUAAGACGAGCAAAAAGCUUGU | 22 nt |
| Non-complement sequence | UUGUACUACACAAAAGUACUG | 21 nt |
| miR-133a-3p | UUUGGUCCCCUUCAACCAGCUG | 22 nt |
| miR-499a-3p | AACAUCACAGCAAGUCUGUGCU | 22 nt |
To evaluate the limit of detection of miR-208a by RT-ASEA, serial dilutions of miR-208a standards were performed using RNase-free water. The templates with concentrations ranging from 1 × 10⁵ pmol L−1 to 1 × 10⁻¹ pmol L−1 were obtained for the RT-ASEA reaction. The Ct value and the logarithm of the template concentration were linearly fitted to obtain the concentration standard curve of miR-208a detected by RT-ASEA. Amplification curves and concentration standard curves are shown in Fig. 5c and d. From the amplification curve in Fig. 5c, it can be seen that as the concentration decreases, the cycle threshold number of the RT-ASEA reaction increases continuously. When the template concentration was 1 × 10⁻¹ pmol L−1, the amplification curve was similar to that of the NTC, which did not achieve effective detection. Therefore, the linear range of the RT-ASEA method is 1 × 100 to 1 × 10⁵ pmol L−1. The determination limit is 1 × 100 pmol L−1. The established linear regression equation y = −3.711x + 44.95 (R2 = 0.9690) shows that the two have a good linear relationship.
The proposed new method RT-ASEA was compared with published methods for RNA detection including SEA, LAMP, and qRT-PCR, as shown in Table 4. Compared with SEA, RT-ASEA significantly shortens the detection time from 60 min to 15 min by accelerating the amplification through a narrow cycle of variable temperature.43 LAMP and qRT-PCR have high sensitivity, but their primers are difficult to design and expensive to experiment.44,45 Therefore, the proposed RT-ASEA method has the advantages of time-saving, simple operation, low cost, and high sensitivity and specificity and is expected to be a promising new method for RNA quantitative detection.
| Comparisons | RT-ASEA | SEA | LAMP | qRT-PCR |
|---|---|---|---|---|
| Reaction time | 15 min | 60 min | 30–60 min | 1–1.5 h |
| Primer number | 2 | 2 | 4–6 | 2–3 |
| Types of fluorescent dye | 1 | 1 | 0–1 | 1–2 |
| Experimental costs | Low | Low | Middle | High |
| Sensitivity | 96% | 90.5% | 82.4% | 97% |
| Specificity | 100% | 100% | 99.6% | 100% |
3.5. Detection of miR-208a in clinical samples
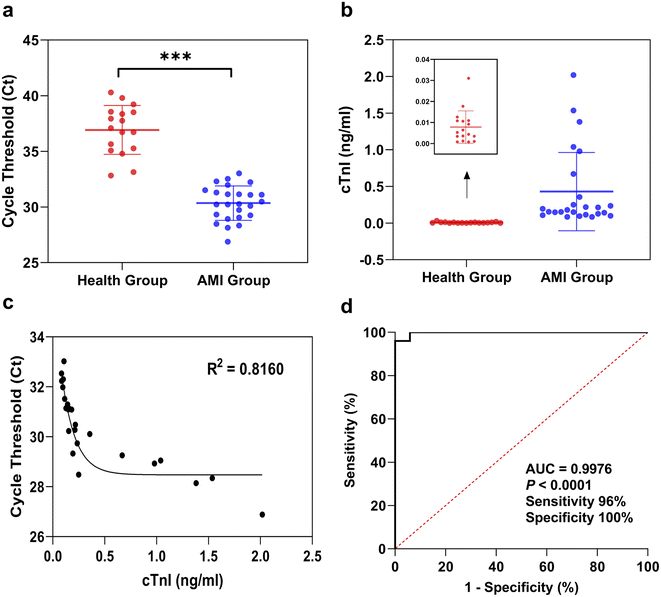
Blood samples from 25 AMI patients and 17 healthy people were collected to verify the performance of the RT-ASEA method in clinical applications, and a correlation analysis was performed with the cTnI values measured by chemiluminescence immunoassay in each sample. In clinical practice, a cTnI concentration exceeding 0.04 ng mL−1 is used as the diagnostic standard for AMI. Among healthy people with cTnI values ranging from 0.0008 to 0.031 ng mL−1, the Ct values of miR-208a detected by RT-ASEA in 17 samples were 32.83 to 40.29. Among the AMI patients with cTnI values ranging from 0.085 to 2.019 ng mL−1, the Ct values of miR-208a detected by RT-ASEA in 25 AMI patients were 26.88 to 33.02. Regardless of the cTnI concentration or the threshold cycle number, the results of the AMI group and the healthy group were significantly different (P < 0.001). It can be seen from Fig. 6a that there are two samples in the healthy population with lower threshold cycle numbers, 32.83 and 33.14, corresponding to cTnI values of 0.0177 ng mL−1 and 0.0310 ng mL−1, respectively. The cTnI concentrations measured by the chemiluminescence immunoassay were relatively high, close to the clinical diagnostic criteria. It is speculated that this may be related to the dysregulation of the miR-208a expression level earlier than that of the cTnI expression level in AMI patients. In the follow-up study, the sample size will be expanded and continuous observation and research will be carried out. Correlation analysis was performed between the Ct value of miR-208a detected in the AMI group and the concentration of cTnI, as shown in Fig. 6c. There was a strong correlation between the Ct value of miR-208a detected by the RT-ASEA method and the concentration of cTnI (R2 = 0.8160), which indicated that miR-208a might be a potential biomarker to replace cTnI.In order to further confirm that miR-208a is an early biomarker of AMI, a receiver operating characteristic curve (ROC) was drawn for verification. And according to the ROC curve the best diagnostic threshold for AMI is determined when miR-208a is selected as the detection object.46 The ROC curve was obtained based on the Ct value of miR-208a detected in the AMI group and the healthy group, as shown in Fig. 6d. The area under the curve (AUC) was 0.9976 (95% confidence interval [CI], 0.9899 to 1; P < 0.0001), which indicated that miR-208a had a high diagnostic accuracy as a biomarker for AMI patients.47 According to the Youden index, the cut-off value was calculated to be 32.68, which is the diagnostic threshold of AMI with miR-208a as the detection object. The detection sensitivity was 96%, and the specificity was 100%. Therefore, miR-208a has potential application value for early diagnosis of AMI and is expected to be developed into an early biomarker of AMI for clinical application.
4. Conclusion
In this study, a reverse transcription-accelerated strand exchange amplification (RT-ASEA) method based on denatured bubbles was established, which can be used to detect miR-208a, an early biomarker of AMI. The reverse transcription and strand exchange amplification of miR-208a can be completed within 15 min with only one pair of primers and one enzyme. The RT-ASEA method has the advantages of simple operation, high sensitivity, strong specificity and a wide linear range. In the verification of clinical samples, there was a strong correlation between the Ct value of miR-208a detected by RT-ASEA and the concentration of cTnI and there was a significant difference between the healthy group and the AMI group. The area under the receiver operating characteristic curve (ROC) was 0.9976. It showed high specificity and sensitivity in the diagnosis of AMI disease, which indicated that the detection of miR-208a by the RT-ASEA method could be used as a rapid, accurate and reliable method for early diagnosis of AMI. To support the verification of miR-208a as a potential early biomarker for AMI diagnosis, it is necessary to continuously track AMI patients, collect clinical samples over different time periods, and conduct dynamic detection of miR-208a in the samples. In addition, the time to collect plasma and extract miRNA took approximately 40 minutes, which is a limitation of this study. In the future, nucleic acid extraction technology will be further studied to optimize the sample pretreatment steps before amplification, leading RT-ASEA to become a universal rapid miRNA quantification technique.Author contributions
Y Zhao: conceptualization, investigation, methodology, formal analysis, writing – original draft, writing – review & editing. LL Zhuang: investigation, methodology, formal analysis, validation, writing – original draft. PL Tian: conceptualization, investigation, formal analysis, visualization. M Ma: conceptualization, investigation, formal analysis, visualization. GQ Wu: investigation, resources, supervision, validation. Y Zhang: conceptualization, supervision, formal analysis, funding acquisition, project administration, resources, supervision, writing – review & editing.Conflicts of interest
There are no conflicts to declare.Acknowledgements
This work was supported by the National Key Research and Development Program of China [No. 2022YFA1205802 and 2022YFC2406504]; National Natural Science Foundation of China [No. 82072067 and 61821002]; Special Fund for Transformation of Scientific and Technological Achievements of Jiangsu Province [BA2020016] and the Fundamental Research Funds for the Central Universities.References
- B. A. Bergmark, N. Mathenge and P. A. Merlini, Lancet, 2022, 399, 1347–1358 CrossRef PubMed.
- R. Agarwal, R. G. Aurora and B. B. Siswanto, Coron. Artery Dis., 2022, 33, 137–143 CrossRef PubMed.
- G. W. Reed, J. E. Rossi and C. P. Cannon, Lancet, 2017, 389, 197–210 CrossRef PubMed.
- J. Song, K. Murugiah and S. Hu, Heart, 2021, 107, 313–318 CrossRef PubMed.
- A. T. Manikkan, J. Endocr. Soc., 2018, 2, 1020–1023 CrossRef PubMed.
- E. A. Amsterdam, N. K. Wenger and R. G. Brindis, Circulation, 2014, 130, 2354–2394 CrossRef PubMed.
- D. Banerjee, C. Perrett and A. Banerjee, Eur. Cardiol. Rev., 2019, 14, 187–190 Search PubMed.
- L. Zhu, W. Fu and B. Zhu, Talanta, 2023, 262, 124626 CrossRef CAS PubMed.
- J. Shen, L. Zhang and J. Yuan, Anal. Chem., 2021, 93, 15033–15041 CrossRef CAS PubMed.
- H. A. Alhadi and K. A. A. Fox, Q. J. Med., 2004, 97, 187–198 CrossRef CAS PubMed.
- C. J. McCann, B. M. Glover and I. B. A. Menown, Eur. Heart J., 2008, 29, 2843–2850 CrossRef CAS PubMed.
- E. A. Amsterdam, N. K. Wenger and R. G. Brindis, Circulation, 2014, 130, e344–e426 Search PubMed.
- J. Viereck and T. Thum, Circ. Res., 2017, 120, 381–399 CrossRef CAS PubMed.
- C. Peng, F. Wu and Y. H. Zeng, Chem. Commun., 2023, 59, 7411–7414 RSC.
- Y. D'Alessandra, P. Devanna and F. Limana, Eur. Heart J., 2010, 31, 2765–2773 CrossRef PubMed.
- X. Wu, H. Yang and W. Li, Sens. Actuators, B, 2021, 344, 130 Search PubMed.
- S. Zhou, J. Jin and J. Wang, Acta Pharmacol. Sin., 2018, 39, 1073–1084 CrossRef CAS PubMed.
- Y. Zhao, J. F. Ransom and A. Li, Cell, 2007, 129, 303–317 CrossRef CAS PubMed.
- Y. Liu, Y. Liang and J. Zhang, Exp. Cell Res., 2017, 354, 66–70 CrossRef PubMed.
- M. Cheng, J. Yang and X. Zhao, Nat. Commun., 2019, 10, 959 CrossRef PubMed.
- J. Huang, F. Wang and X. Sun, Am. J. Transl. Res., 2021, 13, 2365–2378 CAS.
- Y. Shi, Y. Han and L. Niu, Biotechnol. Lett., 2019, 41, 837–847 CrossRef CAS PubMed.
- S. Białek, D. Górko and A. Zajkowska, Kardiol. Pol., 2015, 73, 613–619 CrossRef.
- K. Shyu, B. Wang and W. Cheng, Can. J. Cardiol., 2015, 31, 679–690 CrossRef PubMed.
- G. Wang, J. Zhu and J. Zhang, Eur. Heart J., 2010, 31, 659–666 CrossRef CAS PubMed.
- H. Dong, J. Lei and L. Ding, Chem. Rev., 2013, 113, 6207–6233 CrossRef CAS PubMed.
- S. Li, S. Teng and J. Xu, Briefings Bioinf., 2019, 20, 1420–1433 CrossRef CAS PubMed.
- S. C. Taylor, K. Nadeau and M. Abbasi, Trends Biotechnol., 2019, 37, 761–774 CrossRef CAS PubMed.
- J. Zhang, C. Li and X. Zhi, Anal. Chem., 2016, 88, 1294–1302 CrossRef CAS PubMed.
- D. Zou, W. Wu and J. Zhang, RSC Adv., 2019, 9, 39976–39985 RSC.
- C. Shi, F. Shang and M. Zhou, Chem. Commun., 2016, 52, 11551–11554 RSC.
- R. Metzler and T. Ambjornsson, J. Biol. Phys., 2005, 31, 339–350 CrossRef CAS PubMed.
- C. Shi, X. Shen and S. Niu, J. Am. Chem. Soc., 2015, 137, 13804–13806 CrossRef CAS PubMed.
- K. Sharma, M. Sharma and N. Batra, J. Orthop. Res., 2017, 35, 361–365 CrossRef CAS PubMed.
- R. M. Bialy, A. Mainguy and Y. Li, Chem. Soc. Rev., 2022, 51, 9009–9067 RSC.
- C. D. S. J. Joseph and N. Zadeh, J. Comput. Chem., 2011, 32, 170–173 CrossRef PubMed.
- A. W. Wark, H. J. Lee and R. M. Corn, Angew. Chem., Int. Ed., 2008, 47, 644–652 CrossRef CAS PubMed.
- T. Fawcett, Pattern Recognit. Lett., 2006, 27, 861–874 CrossRef.
- J. S. King, C. F. Fairley and W. F. Morgan, J. Biol. Chem., 1996, 271, 20450–20457 CrossRef CAS PubMed.
- L. Zhuang, J. Gong and Q. Shen, Anal. Sci., 2023, 39, 191–202 CrossRef CAS PubMed.
- N. V. Zyrina, L. A. Zheleznaya and E. V. Dvoretsky, Biol. Chem., 2007, 388, 367–372 CrossRef CAS PubMed.
- J. Deng, Y. Li and W. Shi, Anal. Biochem., 2020, 593, 113593 CrossRef CAS PubMed.
- X. Wang, X. Wang and C. Shi, Talanta, 2020, 216, 120978 CrossRef CAS PubMed.
- C. Houwen, N. van Lisdonk and J. Bolier, Diagn. Microbiol. Infect. Dis., 2023, 106, 115970 CrossRef CAS PubMed.
- W. P. d. O. S. Bernardes, T. G. Santos and N. M. G. S. Fernandes, J. Infect. Public Health, 2023, 16, 1081–1088 CrossRef PubMed.
- E. Montassier, G. A. Al Ghalith and T. Ward, Genome Med., 2016, 8, 49 CrossRef PubMed.
- J. N. Mandrekar, J. Thorac. Oncol., 2010, 5, 1315–1316 CrossRef PubMed.
Footnotes |
| † Electronic supplementary information (ESI) available. See DOI: https://doi.org/10.1039/d3ay01116j |
| ‡ These authors contributed equally to this work. |
| This journal is © The Royal Society of Chemistry 2023 |

