 Open Access Article
Dithia[9]helicenes: Molecular design, surface imaging, and circularly polarized luminescence with enhanced dissymmetry factors†
Bianca C.
Baciu
a,
Pawel J.
Bronk
a,
Tamara
de Ara
b,
Rafael
Rodriguez
 c,
Pierpaolo
Morgante
 e,
Nicolas
Vanthuyne
 d,
Carlos
Sabater
 b,
Carlos
Untiedt
b,
Jochen
Autschbach
b,
Carlos
Untiedt
b,
Jochen
Autschbach
 *e,
Jeanne
Crassous
 *c and
Albert
Guijarro
 *a
*a
aDepartamento de Química Orgánica and Instituto Universitario de Síntesis Orgánica, Unidad asociada CSIC, Universidad de Alicante, Campus de San Vicente del Raspeig, E-03080, Alicante, Spain. E-mail: aguijarro@ua.es
bDepartamento de Física Aplicada and Unidad asociada CSIC, Universidad de Alicante, Campus de San Vicente del Raspeig, E-03080, Alicante, Spain
cUniversité Rennes, CNRS, ISCR-UMR 6226, Rennes, F-35000, France. E-mail: jeanne.crassous@univ-rennes1.fr
dAix Marseille University, CNRS, Centrale Marseille, iSm2, Marseille, France
eDepartment of Chemistry, University at Buffalo, State University of New York, Buffalo, New York 14260, USA. E-mail: jochena@buffalo.edu
First published on 5th September 2022
Abstract
Synthesis of two dithia[9]helicenes by means of a LED-based double photocyclization is reported. The compounds have sulfur atoms placed at the terminal rings of the helicene, and they display two alternative C2-symmetrical arrangements named exo (1) and endo (2). Separation of enantiomers of opposite helicity allowed the complete characterization in solution, in silico, by X-ray crystallography, and adsorbed on gold. The theoretical analysis confirms the unexpected finding that endo-dithia[9]helicene displays an experimental dissymmetry factor (glum) in CPL larger than its isomer exo-dithia[9]helicene (–0.0125 vs. −0.0042). This enhanced glum factor ranks among the largest for a helicene-type molecule. Comparison with smaller analogues, namely exo and endo-dithia[7]helicenes (10 and 11, respectively), is also presented.
Introduction
Helicenes display a robust, fully conjugated helical architecture that makes them prototypes of chiral polyaromatic hydrocarbons with an ever-increasing range of applications.1 For example, much attention has been focused on circularly polarized luminescence (CPL) for future potential applications in cryptography, circularly polarized organic light-emitting diode (OLED) technology, bioimaging, or photocatalysis.2 A chiral excited molecule imprints its chirality on the emitted photon, thus causing the emission to acquire right-handed or left-handed circular polarization (RCP, LCP).3 The efficiency of CPL is quantified by the emission dissymmetry factor, glum = 2(IL − IR)/(IL + IR), where IL and IR refer to LCP and RCP of the luminescence intensity. The dissymmetry factor is typically in the 10−3 to 10−5 range for small organic molecules.4 For transitions that are not electric dipole-forbidden, and in the Gaussian units commonly used for optical activity, . Subscripts e and m refer to the ground-to-excited state electric and magnetic transition dipole moment (TDM), respectively, and Im indicates the imaginary part of the scalar product of these vectors. In the case of electric dipole-forbidden transitions, terms of higher order in the multipole expansion of the electromagnetic wave would need to be considered, but they can be neglected for the present work. For glum to be nonzero, the electric and magnetic TDM must not be perpendicular or individually vanish, a condition only fulfilled for chiral molecules.3 Thus,
  , with θ representing the angle between the transition moments.5,6 Endowed with an inherently chiral chromophore, the application of simple carbohelicenes as CPL emitters has been the focus of intense research in the last decade.7 Compared to fully carbonated systems, the synthesis of heterohelicenes aims not only to create new structures but also to adjust their photophysical properties,8 providing new helicene-related emitters with improved properties.9,10 Among them, the best performing compounds typically exhibit a glum in the range 10−2–10−3.11
Thiahelicenes represent an important class of heterohelicenes because they combine both high electronic properties arising from polythiophene materials along with intriguing chiroptical properties that can be reached when dealing with helical chirality.12 Thiahelicenes have significant advantages with respect to simpler carbohelicenes, that include (i) the lower oxidation potentials which present an essential parameter for application as conducting organic materials; (ii) the easier functionalization of the thiahelicene backbone, either in the α position or in the β position of the terminal thiophene rings; (iii) a plethora of short intermolecular S–S (and of S to other atoms) contacts along with the π–π stackings in the solid state. All these features offer new opportunities to design novel organic semiconductors with high carrier mobility and original (chir)optical properties. Among the different classes of thiahelicenes, readily accessible tetrathiahelicenes have monopolized much of the attention.13 We have recently reported a synthetic procedure to access dithiahelicenes with the sulfur atoms located in the first and last rings, but pointing inwards to the helical axis in what was called the endo-isomer, namely in the form of endo-dithia[7]helicene, in addition to the more easily accessible exo-isomer with the sulfur atom pointing outwards.14 In this work we propose the preparation of exo-dithia[9]helicene 1 and endo-dithia[9]helicene 2, presented in Scheme 2. We performed a detailed characterization in solution, in the solid state and on a gold surface, and analyzed the chiroptical properties of these new compounds. We found strong CPL activity, with emission dissymmetry factors as high as 1.2 × 10⁻². The paper is organized as follows: (a) synthesis of these molecules using a LED photocyclization as a key step; (b) characterization in the solid state by X-ray crystallography; (c) experimental photophysical and chiroptical properties of exo-1 and endo-2, as well as of their smaller [7]homologues; (d) simulated spectra and theoretical analysis, and (e) characterization on a gold surface by scanning tunneling microscopy (STM).
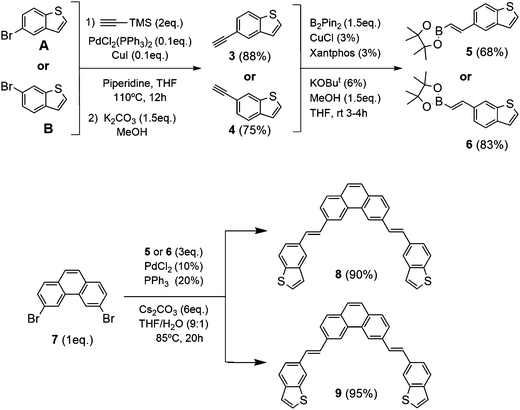 | ||
| Scheme 1 Synthesis of 3,6-bis-((E)-2-(benzo[b]thiophen-5-yl)vinyl)phenanthrene (8) and 3,6-bis-((E)-2-(benzo[b]thiophen-6-yl)vinyl)phenanthrene (9). | ||
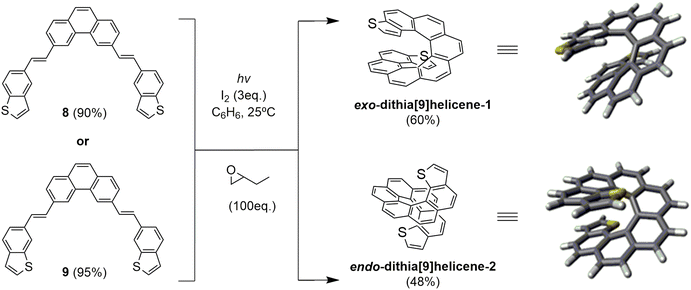 | ||
| Scheme 2 Photochemical synthesis of racemic dithia[9]helicenes 1 and 2via double photocyclization of bis-stilbenic precursors 8 and 9. | ||
Results and discussion
Synthesis of exo-dithia[9]helicene-1 and endo-dithia[9]helicene-2
Based on our previous experience with the preparation of exo- and endo-dithia[7]helicenes in good yields,14,15 we propose now the synthesis of exo- and endo-dithia[9]helicenes 1 and 2. The synthetic pathways used for this modular synthesis adapted our state of the art methods of Pd-catalyzed coupling reactions with a key final double photocyclization step of a symmetric bis-stilbenic precursor, yielding the desired thiahelicene regiochemistry.These bis-stilbenic precursor compounds were prepared following the general synthetic route depicted in Scheme 1. Starting from commercial 5- and 6-bromobenzo[b]thiophene (A and B, respectively), the compounds 3 and 4 were synthesized by means of a Sonogashira reaction using tri(methylsilyl)acetylene followed by the desilylation in basic medium. Then with the hydroboration of 3 and 4 we obtain the vinylboronic derivatives needed for the subsequent Suzuki coupling with the central fragment of the ensemble 7. This fragment, 3,6-dibromophenanthrene (7), was easily prepared from commercially available starting materials.14 The hydroboration was done by means of bis(pinacolatodiboron) (B2Pin2) through a copper catalyzed reaction activated by bidentate diphosphine ligand, Xantphos, which afforded the I-vinylboronate 5 and 6 in good yield. Bis-stilbenic precursors 8 and 9 were obtained by a Suzuki coupling of 5 and 6 with the central symmetric fragment 7 in good yields. These precursors were ready for the key photocyclization step. One of the strengths of this step is the high regioselectivity displayed by the process. It is worth recalling at this point that there are two stilbenic moieties, one on each side of the molecule, undergoing a sequential double photocyclization. Each side could in principle photocyclize in 4 different fashions. This leaves, after omitting equivalent compounds, a total of 10 possible regioisomers as final products (all the possible structures of the isomers for the exo and endo series are illustrated in the ESI,† Fig. S1). Among them, the desired helicene final product, i.e. with fully ortho-fused rings was the only successfully detected, isolated and characterized.
Bis-stilbenic compounds 8 and 9 were initially subjected to irradiation using a 400 W high-pressure Hg lamp to undergo a sequential double photocyclization under typical Mallory-Katz conditions.16 Irradiation was carried out in benzene under refluxing conditions (3–4 hours). In both cases the final products were obtained (52% and 38% yield for 1 and 2 by 300 MHz 1H-NMR analysis), contaminated with unidentified byproducts of polymeric nature that made the purification step tedious.
Our objective at this point was to improve the photochemical setup by introducing UV LED technology in the light of our previous studies on the UV-vis absorption spectra of related bis-stilbenic compounds.14 We built a new cylindrical aluminum minireactor which incorporated two 50 W air-refrigerated LED chip sources emitting at 365 nm on opposite sides of the cylinder walls. The top of the reaction tube was connected to a silicone bubbler, placed in the center of the reactor cylinder standing up vertical and was magnetically stirred from the bottom during irradiation. After optimizing the conditions of the new system, we obtained a much cleaner 1H-NMR spectrum than in the case of the high-pressure vapor Hg lamp. The sample was conveniently irradiated overnight. Not only the reaction yields were slightly improved (60% and 48% isolated yield for 1 and 2, respectively), but the safety of the system was noticeably improved since irradiation was carried out at ambient conditions, avoiding intense refluxing of benzene due to heat overproduction as in the previous case.
The reaction afforded the expected racemic exo-dithia[9]helicene-1 from 8 and endo-dithia[9]helicene-2 from 9, which were easily purified and fully characterized (see ESI†). A distinctive fingerprint useful in the structural elucidation of this type of thiahelicene by 1H-NMR are the two doublets originated by the coupling of the vicinal hydrogens of the thiophene ring. They can be distinguished in the spectrum for two reasons: (a) within the framework of a helicenic structure, the thiophene hydrogens are shifted upfield because of the anisotropic effect of the rest of the underlying aromatic structure; (b) the coupling constant (J) of these vicinal hydrogens is smaller than the other aromatic constants. The result is a pair of easily identifiable doublets in the 6–7 ppm region with J around 5–6 Hz. In the case of 1 there are two doublets at 6.50 (dd, J = 5.5 0.4 Hz, 2H) and 6.00 (dd, J = 5.5 0.8 Hz, 2H), and in the case of 2, these two doublets are at 6.88 (d, J = 5.4 Hz, 2H) and 6.72 (d, J = 5.4 Hz, 2H).
HPLC separations over chiral stationary phases enabled to obtain enantiomeric samples (ee > 99.5%) of 1 and 2. For the sake of comparison, smaller analogues, i.e. previously reported racemic exo and endo-dithia[7]helicene 10 and 11, were separated into pure enantiomers by the same method (ee > 99.5%, see ESI† for details).
Crystal structures of exo and endo-dithia[9]helicenes 1 and 2
The compounds crystallized in small, somewhat weakly diffracting crystals that nonetheless allowed for resolute molecular/isomeric characterization, corroborating beyond doubt the isomeric molecular structure that arises from the synthesis. Diffraction data acquisition was performed at room temperature. Space group assignment was carried out under these conditions. Dynamic disorder and weak diffraction in one of the crystal dimensions were some issues that had to be overcome in the packing characterization. Nevertheless, fruitful information about solid state organization can be obtained. In the solid state, exo-1 and endo-2 display a monoclinic, quasi-orthorhombic unit cell with quite different type of packing, both among themselves and also when compared to their shorter [7]homologues.15 The crystal structure of exo-1 is quite intricate. It has two non-symmetrically equivalent molecular units (type A and B) in a very large unit cell containing 16 molecules overall. A homochiral columnar arrangement of molecules ABAB in the a direction (longest axis) is a characteristic feature of this structure. The cell density of exo-1 is 1.418 g cm−3. A much simpler unit cell is found in endo-2, with only one symmetrically independent molecule and overall 4 molecules per cell. The density of this cell is 1.382 g cm−3, appreciably lower than its exo isomer. The difference between the two cells is likely due to the larger van der Waals radius of the sulfur atom compared to carbon, which results in a slightly longer helical axis and an increased volume of the endo compound. Despite these differences, both unit cells are centrosymmetric, and they include an equal number of molecules displaying P and M helicities that are located opposite to each other with respect to the inversion center of the unit cell. There are no crystal structures reported for carbo[9]helicene derivatives, so a structural comparison with carbohelicene was not possible. The geometries of the individual dithiahelicenes, although slightly distorted form the ideal C2 symmetry due to the crystal packing, match very well the theoretically calculated structures, as shown visually and numerically in Fig. 1 for both compounds. The root mean squared deviations (RMSDs) reported in Fig. 1 were calculated considering only heavy atoms,17 and they indicate geometrical deviations in the typical range of most functional/small basis set combinations.18 The dihedral angles (φ) of the edge of the inner helix, starting from C1 in 1 or S1 in 2, were used as a geometrical parameter to compare the helicene structures.19 The experimental values from the X-ray structures followed by the standard uncertainty (in parentheses) are 11(1), 28(1), 26(1), 22(1), 28(1), 23(1), and 11(1)° for the type A molecule of exo-1, and 10(1), 26(1), 28(1), 17(1), 30(1), 23(1), and 8(1)° for the type B molecule. The angles add up 149° (A) and 142° (B), respectively, with standard uncertainties of ±3°, revealing a relatively compressed B type of coil respect to A in the solid. For the endo isomer, the angles are 10(1), 23(1), 31(1), 18(1), 28(1), 30(1), and 9(1)°, adding up to 149° also with ±3° of standard uncertainty. This shows a slightly stretched endo isomer coil in comparison to the average exo isomer.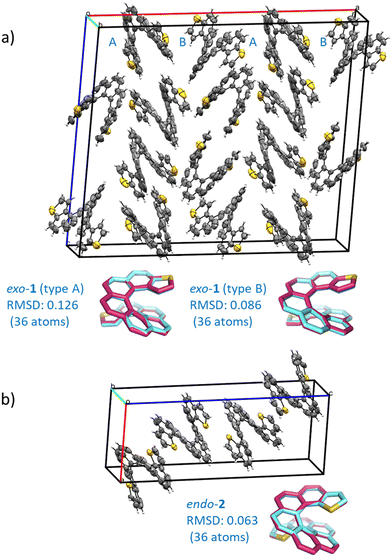 | ||
| Fig. 1 (a) Crystal structure of the racemate exo-dithia[9]helicene (1): Monoclinic unit cell, space group C2/c, a = 33.075(4), b = 9.8984(11), c = 28.178(3) (Å); α = 90, β = 94.890(2), γ = 90°; Z = 16; CCDC number 2184340. The experimental structures of both molecular types found in the unit cell (A and B, reported in cyan) are overlapped with the calculated CAM-B3LYP/def2-SV(P) structures (in magenta) and shown below the unit cell; (b) crystal structure of the racemate endo-dithia[9]helicene-2: Monoclinic unit cell, space group P21/n, a = 9.712(2), b = 9.709(3), c = 25.072(6) (Å); α = 90, β = 94.401(7), γ = 90°; Z = 4; CCDC number 2184341. The experimental and calculated (CAM-B3LYP/def2-SV(P)) structures, reported in cyan and magenta respectively, are overlapped and shown below the unit cell. The root mean square deviation (RMSD, in Å) is calculated considering only the heavy atoms of an isolated dithia[9]helicene of (M) configuration for both isomers. For the crystal cells, ORTEP diagrams are shown with thermal ellipsoids drawn at 50% probability. The data was acquired at room temperature. | ||
Experimental photophysical and chiroptical properties and theoretical simulation of exo-dithia[9]helicene-1 and endo-dithia[9]helicene-2, and comparison with their [7]homologues
The UV-vis spectra of 1 and 2, depicted in Fig. 2a, were measured in CH2Cl2 solution at concentrations ca. 10−5 M. exo-Dithia[9]helicene 1 displays (i) one intense band (ε > 1![[thin space (1/6-em)]](https://www.rsc.org/images/entities/char_2009.gif) 00
00![[thin space (1/6-em)]](https://www.rsc.org/images/entities/char_2009.gif) 000 M−1 cm−1) at 270 nm, accompanied with a slightly distinguishable band at higher energy (ε ∼ 58
000 M−1 cm−1) at 270 nm, accompanied with a slightly distinguishable band at higher energy (ε ∼ 58![[thin space (1/6-em)]](https://www.rsc.org/images/entities/char_2009.gif) 000 M−1 cm−1 at 244 nm) and a shoulder at lower energy (ε ∼ 18
000 M−1 cm−1 at 244 nm) and a shoulder at lower energy (ε ∼ 18![[thin space (1/6-em)]](https://www.rsc.org/images/entities/char_2009.gif) 000 M−1 cm−1 at 320 nm), (ii) and one wide band (ε ∼ 16
000 M−1 cm−1 at 320 nm), (ii) and one wide band (ε ∼ 16![[thin space (1/6-em)]](https://www.rsc.org/images/entities/char_2009.gif) 000 M−1 cm−1) centered at 360 nm. endo-Dithia[9]helicene 2 displays two intense bands at 250 and 285 nm (ε ∼ 60–70
000 M−1 cm−1) centered at 360 nm. endo-Dithia[9]helicene 2 displays two intense bands at 250 and 285 nm (ε ∼ 60–70![[thin space (1/6-em)]](https://www.rsc.org/images/entities/char_2009.gif) 000 M−1 cm−1) and a wide band at 360 nm (ε ∼ 16
000 M−1 cm−1) and a wide band at 360 nm (ε ∼ 16![[thin space (1/6-em)]](https://www.rsc.org/images/entities/char_2009.gif) 000 M−1 cm−1). Overall the UV-vis response is similar for 1 and 2 in the low-energy region and differs in the high-energy with a red shift of the stronger band for compound 2 and the presence of an additional one. To shed some light on the electronic origin of these bands, time-dependent DFT (TD-DFT) calculations were performed (vide infra).
000 M−1 cm−1). Overall the UV-vis response is similar for 1 and 2 in the low-energy region and differs in the high-energy with a red shift of the stronger band for compound 2 and the presence of an additional one. To shed some light on the electronic origin of these bands, time-dependent DFT (TD-DFT) calculations were performed (vide infra).
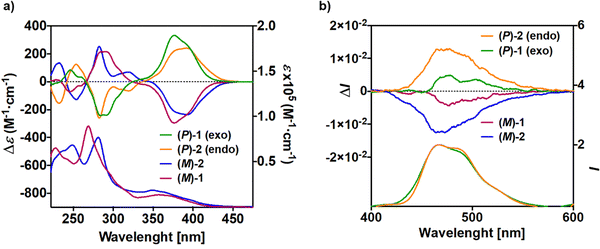 | ||
| Fig. 2 (a) Experimental UV-vis (bottom) and ECD (top) spectra and (b) fluorescence (bottom) and CPL (top) spectra of (P) and (M) enantiomers of 1 and 2 (CH2Cl2, C ∼ 10−5 M). | ||
The electronic circular dichroism (ECD) spectra and optical rotation (OR) values of enantiopure samples of exo- and endo-dithia-[9]helicenes 1 and 2 were then measured (Fig. 2a, and Table 1). Both systems display strong specific rotation values ( = +5544 and +6940 for (P)-1 and (P)-2, respectively in CH2Cl2 at concentrations of 10−5 M).20 As depicted in Fig. 2a, the (M) and (P) enantiomers display the expected mirror-image ECD spectra. The different sets of bands observed in UV-vis spectra are strongly ECD active in both 1 and 2. For instance, exo compound (P)-1 displays two moderate positive bands at 245 nm (Δε = +80 M−1 cm−1) and 262 nm (+33), two strong negative bands at 284 (−241) and 291 (−240) and one shoulder at 306 (−103), and two strong positive bands 377 (+331) and 392 (+268) nm. Overall, the endo compound exhibits a similar ECD spectral envelope. Indeed, (P)-2 displays (i) one positive band at 255 nm (Δε = +120 M−1 cm−1), (ii) one strong negative band at 283 (−259), and two moderate ones at 309 (−54), and 319 (−65), and (iii) two strong positive bands at 378 (+227) and 395 nm (+236).
The UV-vis spectra of 10 and 11, depicted in Fig. 3, were also measured in CH2Cl2 solution at concentrations ca. 10−5 M. exo-Dithia[7]helicene 10 displays two intense bands (ε > 30![[thin space (1/6-em)]](https://www.rsc.org/images/entities/char_2009.gif) 000 M−1 cm−1) at 240 and 267 nm, accompanied with one shoulder at 259, and a set of bands at 332, 354 and 396 nm together a very weak band at 419 nm. endo-Dithia[7]helicene 11 displays quite similar absorption spectrum, more specifically two intense bands (ε > 40
000 M−1 cm−1) at 240 and 267 nm, accompanied with one shoulder at 259, and a set of bands at 332, 354 and 396 nm together a very weak band at 419 nm. endo-Dithia[7]helicene 11 displays quite similar absorption spectrum, more specifically two intense bands (ε > 40![[thin space (1/6-em)]](https://www.rsc.org/images/entities/char_2009.gif) 000 M−1 cm−1) at 242 and 254 nm, accompanied with one distinguishable band at lower energy (ε ∼ 17
000 M−1 cm−1) at 242 and 254 nm, accompanied with one distinguishable band at lower energy (ε ∼ 17![[thin space (1/6-em)]](https://www.rsc.org/images/entities/char_2009.gif) 000 M−1 cm−1 at 290 nm), and a set of several bands of moderate magnitude at 318, 330, 350, 379 nm together a very weak band at 426 nm.
000 M−1 cm−1 at 290 nm), and a set of several bands of moderate magnitude at 318, 330, 350, 379 nm together a very weak band at 426 nm.
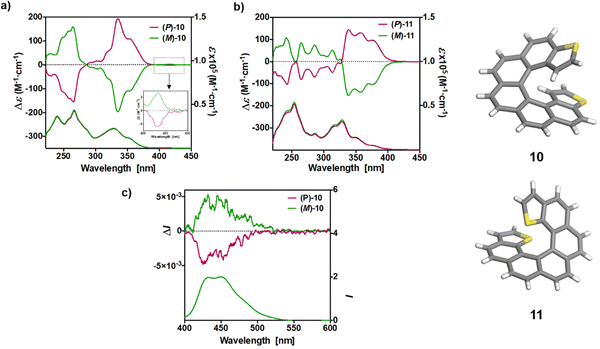
The ECD spectra and OR values of enantiopure samples of exo- and endo-dithia-[7]helicenes 10 and 11 were also measured (Fig. 3 and Table 1). Both systems display strong specific rotation values ( = +3340 and +3550 for (P)-10 and (P)-11, respectively) that are almost half those of dithia[9]helicenes 1 and 2. The different sets of bands observed in UV-vis spectra are ECD active and the (M) and (P) enantiomers display the expected mirror-image ECD spectra. For instance, exo compound (P)-10 displays a moderate negative band at 230 nm (Δε = −46 M−1 cm−1), a structure of several intense negative bands at 250, 260 and 265 nm (−111, −141 and −154), a set of weak to moderate positive bands at 293, 303 and 319 nm (+10, +16 and +53), and two intense positive bands at 336 nm (+191), and 355 nm (+108). Finally, a very weak negative band (−2.4) is observed at 416 nm. Although weak, it is highly important because it dictates the sign of the CPL signal (vide infra). The endo compound (P)-11 displays a set of four well-separated negative bands at 242, 265, 286 and 312 nm (Δε = −101, −79, −69, −48 M−1 cm−1) together with some shoulders, and a set of three well-separated positive bands at 340, 360 and 378 nm (+140, +130, +92), together a slightly positive band at 420 nm (+1.4). Overall, the ECD spectrum of (P)-11 is quite different, showing red-shifted and more defined signals than (P)-10.
The luminescence properties of compounds 1–2 and 10–11 were examined in CH2Cl2 at room temperature (r.t., 298 K). The r.t. emission of the exo derivative 1 is displayed in Fig. 2b, showing fluorescence signals at 466, 473 and 526 nm. The structuration most probably originated from the vibronic structures. Furthermore, a very low quantum yield of fluorescence (ΦF = 0.2% at 470 nm) was measured. The endo derivative 2 displayed the same structured fluorescence signals at similar wavelengths and a higher quantum yield ΦF of 3.5% at 470 nm. The [7]helicene derivatives 10 and 11 also exhibit extremely weak fluorescence signals. Interestingly, although weakly fluorescent, all compounds exhibit a signal at low temperature which is assigned to classical phosphorescence (see Fig. S2-1, ESI†). This is in line with a comparatively strong spin–orbit interaction which promotes intersystem crossing already observed in longer helicenes.21
Helicenes are known to exhibit efficient circularly polarized fluorescence or phosphorescence activity, which makes them appealing for incorporation into OLEDs as circularly polarized electroluminescent materials.10 However, most thiahelicene derivatives do not emit light and few CPL-active systems have been reported.13 The CPL spectra of the (P) and (M) enantiomers of 1 and 2 derivatives were recorded in CH2Cl2 at rt (Fig. 2b). Satisfyingly, the enantiomers revealed nice mirror-image CPL activity. Regarding the dissymmetry factors, which reflect the percentage of circularly polarized emitted light (glum = 2(IL − IR)/(IL + IR)), we obtained glum of −4.2 × 10⁻³/+4.6 × 10−3 for 1 and −1.23 × 10⁻²/+1.25 × 10−2 for 2, for (M)/(P) enantiomers, respectively. Interestingly, the endo derivative displays a much higher absolute glum value than the exo derivative, with a 10−2 order of magnitude, among the highest in helicenes and other heteroaromatic helicene-like compounds.11 These results nicely highlight the impact of the chemical structure and regioisomerism in heterohelicenes on the final photophysical and chiroptical properties since two exo and endo isomers display different CPL intensities. The fact that 2 displays higher glum values as compared to 1 is in agreement with theoretical calculations (vide infra). Note that for these measurements much care must be paid and very low concentrations must be used (around 10−5 M). Finally, due to very low emission signal, only exo-dithia[7]helicene 10 was found to display CPL activity (±5 × 10⁻³) with low glum values and inverted signals (positive for (M) and negative for (P), Fig. 3b). Indeed, the CPL sign is in agreement with the ECD sign of low-energy band found at 415 nm (Fig. 3a inset and ESI†).
Theoretical analysis
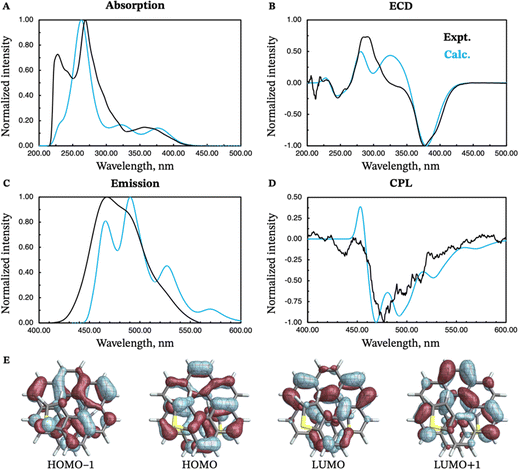
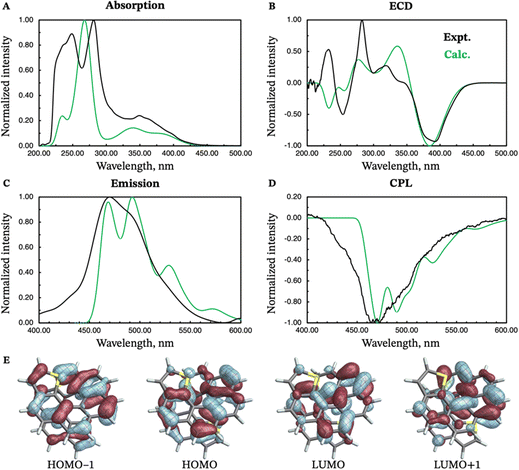
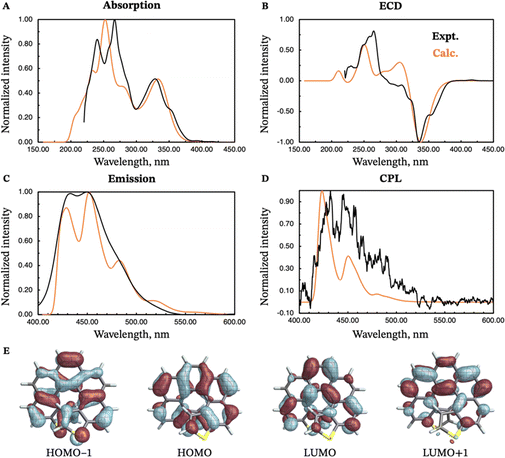
The absorption and emission properties of both isomers of dithia[9]helicene, as well as of the smaller dithia[7]helicene, were investigated using Kohn–Sham density functional theory (KS-DFT) and its time-dependent (TD) extension. See ref. 23 and 24 regarding general strategies of modeling chiroptical parameters with TD-DFT and other electronic structure methods. The CAM-B3LYP functional25 and the def2-SV(P) basis set26 were employed for all calculations. Section S2 in the ESI† provides additional computational details. The spectra obtained with CAM-B3LYP are usually in satisfactory agreement with experiments, but overestimation of the transition energies up to about 0.5 eV for helicene systems has been noted in previous research.27 For this work, a shift of −0.40 eV—optimal for the exo-dithia[9]helicene compound—was adopted for endo-dithia[9]helicene and the two dithia[7]helicenes as well, although it appears that a slightly smaller shift may already be sufficient. The calculations for exo-dithia[9]helicene and endo-dithia[7]helicene were performed with the (P) isomer, but for consistency the (M) isomer is considered in the following discussion. The signs of the chiroptical properties were inverted accordingly. Given the lack of experimental emission and CPL data for endo-dithia[7]helicene 11, most of the theoretical analysis focuses on the dithia[9]helicenes 1 and 2, and on exo-dithia[7]helicene 10. The calculated absorption and ECD spectra of endo-dithia[7]helicene are briefly commented on.Because of the C2 symmetry of the compounds, the excited states have either 1A or 1B symmetry. Inspection of the TD-DFT spectra revealed that the transitions involving the states relevant for CPL—the ground state, S0, and the first excited state, S1—have 1A symmetry. The dominant contributions to the transitions involve the HOMO−1, HOMO, LUMO, and LUMO+1 orbitals, shown in panel E of Fig. 5–7, that extend over the helicene core. The same orbitals are also involved in the S0–S1 transition for (M)-endo-dithia[7]helicene, see panel C of Fig. 8. The optimized geometries of the S0 and S1 states of (M)-exo-dithia[9]helicene 1 and (M)-endo-dithia[9]helicene 2 appear very similar, suggesting no substantial molecular rearrangement in the excited state. This is true for (M)-exo-dithia[7]helicene 10 as well. A comparison of the equilibrium geometries of both states for the three compounds is shown in Fig. S15 in the ESI.† For each of the four molecules, the calculated absorption and ECD spectra (after energy-shifting) show good agreement with their experimental analogues (vide infra). For the CPL spectra, it was found that the simultaneous inclusion of Franck–Condon (FC) and Herzberg–Teller (HT) vibronic effects is necessary to obtain good agreement with the experimental data (panel D in Fig. 5–7). FC effects alone are not sufficient, as they result in spectra exhibiting a positive sign, like the purely electronic spectra but opposite to the experimental results. It is the combination with the negative intensities calculated including HT effects that yields calculated spectra matching the experimental band signs. See Section S2 in the ESI† for additional details on the spectra calculated with FC, HT, and FC + HT effects, and Fig. S16 (ESI†) for their visual comparison.
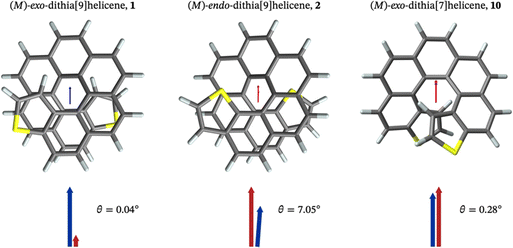
The purely electronic spectra of the two dithia[9]helicenes do not reproduce the experimentally observed negative CPL signs. Similar cases have been discussed previously.28 In both cases, the calculated electronic rotatory strengths are found to be positive, a feature that is attributable to the angle, θ, between the transition electric and magnetic dipole moments being close to 0°, as shown in panels A and B of Fig. 4. The magnitude of the purely electronic rotatory strengths for the S1–S0 transitions is rather small (see Tables S1 and S2 in the ESI†), but in the case of (M)-exo-dithia[9]helicene this positive contribution to the vibrationally resolved spectrum can still be observed in the region around the 0–0 transition (panel D of Fig. 5), where it is not cancelled by HT effects. The spectrum obtained for the endo isomer does not exhibit any positive peaks, probably because the electronic contributions coming from the smaller rotatory strength of this compound are more effectively canceled by the FC + HT treatment. The calculated spectrum of exo-dithia[7]helicene exhibits a positive sign at the purely electronic level (panel C of Fig. 4). This compound has the largest rotatory strength among the four molecules (Table S3 in the ESI†). In contrast to the two dithia[9]helicenes, the intensity calculated at the FC level is greater than the intensity calculated at the HT level, resulting in the overall positive sign of the vibrationally resolved spectrum showed in panel D of Fig. 7.
The dissymmetry factors (glum) were calculated as ΔI/I, i.e. as the ratio between the broadened calculated CPL (ΔI) and emission (I) intensities at the experimental wavelengths, instead of using the rotatory and dipole strengths of the electronic transitions, because of the aforementioned sign problem for the purely electronic transitions of the two dithia[9]helicenes.29 The resulting glum for the two [9]helicenes are in reasonable agreement with the experiments, albeit overestimated for both compounds (Table 2). The calculated glum of (M)-exo-dithia[7]helicene is very close to the experiment (third row of Table 2).
| Compound isomer | ϕ F(%) | Solvent (conc., M) | CPL λexp (nm) | g lum, expt | g lum, calc |
|---|---|---|---|---|---|
| ϕ F Fluorescence quantum yield (ratio emitted/absorbed photons). glum emission dissymmetry factor. | |||||
| (M) exo-Dithia[9]helicene (1) | 0.2 | CH2Cl2 (10−6) | 470 | −0.0042 | −0.019 |
| (M) endo-Dithia[9]helicene (2) | 3.5 | CH2Cl2 (10−6) | 470 | −0.0125 | −0.024 |
| (M) exo-Dithia[7]helicene (10) | 0.3 | CH2Cl2 (10-6) | 475 | 0.0050 | 0.0024 |
| endo-Dithia[7]helicene (11) | 0 | CH2Cl2 (10-6) | — | — | |
| [9]Helicene22 | 0.014 | 1,4-Dioxan (5·10−4) | Unreported | ||
| [7]Helicene22 | 0.021 | 1,4-Dioxan (5·10−4) | Unreported | ||
The electronic absorption spectrum of (M)-exo-dithia[9]helicene 1 (panel A of Fig. 5) exhibits an intense band around 270 nm accompanied by a less intense shoulder around 230 nm, closely resembling the experiment. Additional bands can be observed around 330 and 380 nm. For the ECD spectrum (panel B, Fig. 5), the most intense band is centered around 380 nm, and matches the experimental intensity in both sign and magnitude. The region between 270 and 350 nm appears more structured than the experiment, showing two major bands with positive sign while only one appears in the experimental spectrum. There is a good match between the calculated and experimental bands below 270 nm. The vibrationally resolved calculated emission spectrum (panel C, Fig. 5) is in good agreement with the experiment, but the latter shows less structure. The negative CPL intensity is mostly due to HT effects, although an incomplete cancellation between the FC and HT effects is responsible for the positive band calculated for the 0–0 transition for this compound. This is also observed from the purely electronic transition, as briefly mentioned above (see Section S2 in the ESI† for more details). Apart from this weak positive peak, the calculated CPL spectrum exhibits a major negative peak followed by three less intense bands, which match the structure of the experimental spectrum (panel D of Fig. 5). As mentioned before, the S1–S0 transition is assigned to transitions among HOMO−1, HOMO, LUMO, and LUMO+1, shown in panel E of Fig. 5. The orbitals appear delocalized over the helicene scaffold without contributions from the sulfur atom, except for HOMO−1.
Similar observations can be made for (M)-endo-dithia[9]helicene 2. The calculated absorption spectrum (panel A, Fig. 6) exhibits two bands in the region between 240 and 280 nm. The intensity of the band at higher wavelength is weaker than the one observed experimentally, although the positions match well, and the shoulder around 350 nm is matched by the calculations in both position and intensity. The ECD spectrum (panel B of Fig. 6) shows a major negative band centered around 380 nm. Other peaks at 340, 280 and 240 nm match the experimental spectral shape. The emission spectrum of the endo isomer is very similar to the emission spectrum of the exo isomer, and it shows the same bands. The vibrationally resolved CPL spectrum exhibits a relatively strong negative band corresponding to the 0–0 transition around 470 nm, followed by two additional shoulders (one at around 490 and the other at around 530 nm) that match the less-structured experimental spectrum closely. As for the endo compound, the S1–S0 transition is assigned to transitions among HOMO−1, HOMO, LUMO, and LUMO+1 (panel E in Fig. 6). These orbitals appear qualitatively similar to those of the exo isomer, as one would expect given the structural similarity of the two compounds. The orbitals are delocalized over the helicene scaffold. Some density on the sulfur atom is observed for the HOMO−1, like for the previous case.
The calculated and experimental spectra of (M)-exo-dithia[7]helicene 10 are compared in Fig. 7, panels A–D. The calculated absorption spectrum shows two major peaks, one around 260 nm, and the other around 330 nm. The most intense peak exhibits two almost symmetric shoulders (230 nm, 290 nm). The calculated ECD spectrum has an intense negative band around 340 nm, and a positive band around 250 nm, both matching the experiment in position and intensity. The calculated emission spectrum is similar in both shape and structure to the two [9]helicenes, except shifted towards shorter wavelengths. It also appears more structured than the experimental analogue, which only exhibits two major peaks centered around 450 and 430 nm. The calculated CPL spectrum, shown in panel D of Fig. 7, correctly reproduces the position of the two main bands at 430 and 450 nm. The calculated glum of this compound is smaller than any of the two [9]helicenes, in agreement with the experimental measurements. The compound also retains the electronic properties of the larger analogues, as mentioned earlier.
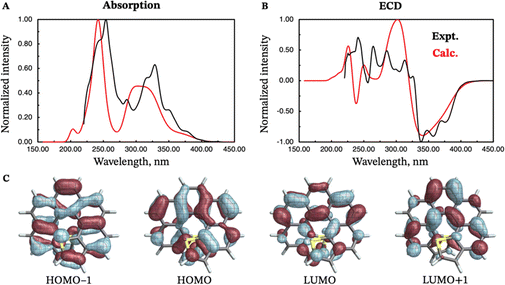
Due to the lack of experimental emission and CPL data for (M)-endo-dithia[7]helicene 11, these spectra have not been calculated. Only the absorption and ECD spectra are compared to their experimental counterparts in Fig. 8. The absorption spectrum (panel A) is characterized by two major peaks centered near 310 and 240 nm. The most intense peak also shows a small shoulder around 200 nm. The calculated ECD spectrum is characterized, similarly to the exo isomer, by an intense negative band around 340 nm, followed by a positive band of similar intensity around 300 nm (panel B of Fig. 8). Both bands match the experimental position and intensity, although the experimental spectrum appears more structured across the whole experimental window. The HOMO−1, HOMO, LUMO, and LUMO+1 orbitals (panel C) are all involved in the S0–S1 transition. They appear delocalized over the whole molecule, and they are—perhaps unsurprisingly—qualitatively similar to those of the exo isomer. Only the HOMO−1 orbital is significantly delocalized over the sulfur atoms, similarly to the other isomer and the dithia[9]helicenes.
Characterization on a gold surface of exo- and endo-dithia[9]helicenes 1 and 2. Unveiling the chirality of a single molecule by STM topography at room temperature
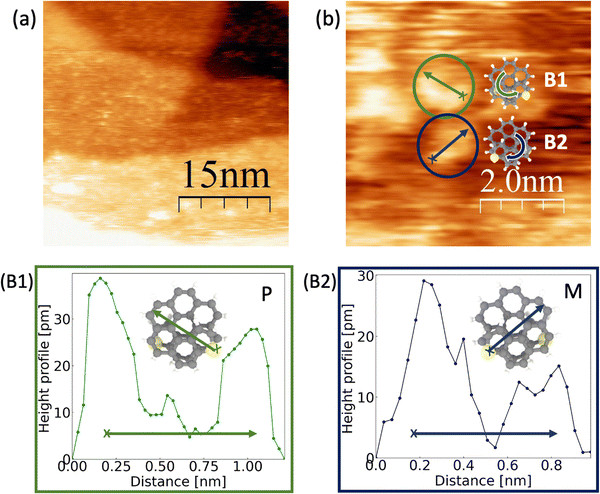
Scanning Tunneling Microscopy (STM) is one of the most successful techniques available that can be used for identifying the chirality of both enantiomers at ambient conditions. In line with our former studies looking for nanoscaled solenoids,13 we characterized our exo- and endo-dithia[9]helicenes on a gold electrode.15 Prior to the topography study, the (111) crystallographic orientation of a gold substrate is prepared through a flame-annealing process. The deposition of the molecules was performed using drop casting followed by a dried step with argon gas and vacuum up to 10−2 mbar. During this study, we worked using a solution in benzene in a concentration of 0.3 mg mL−1. Topographic images were acquired using a Pt90Ir10 tip and a bias voltage around 0.5 V to the sample in a constant current mode. The current amplification is 109 V A−1. Thanks to the flatness of the surface, it is possible to visualize the molecular distribution and distinguish single molecules. It should be pointed out that reports of single helicene molecules imagining are confined only to low temperature and ultra-high vacuum conditions.30Panel (a) of Fig. 9 shows a STM image of the exo- topology decorating the (111) gold terraces. In general, no ordering along the (111) gold terraces is found, although mono or bilayers of molecules without an apparent ordered pattern could be detected. Panel (b) presents an STM image where the two enantiomeric are identified. Green and blue colored circles reveal the mirror-image forms of dithia[9]helicenes, labeled as B1 and B2. For identifying the handedness, panels (B1) and (B2) provide the height profiles versus the distance of the selected molecules following the arrow across the diagonal. Inset illustrations show how the measured molecules are oriented. As criteria, we start from the arrow's nock, positioned close to the highest part of the molecule, up to the head. Together with the measured topography of the scanning, we can clearly identify first, that the molecules present unevenness related to the helix structure, which is an indication that we are measuring the target molecules. Considering the evolution of the recorded intensity along the helix, we can clearly identify the observed chiralities, i.e. P in green and M in blue. Moreover, the direction of the helix of the molecules can be related to the schematic models following the arrow along the structure (see the schematic model in panel (b)). This was also the case for the smaller homologue exo-dithia[7]helicene, which suggests the role of the sulfur atom as an anchoring site of the molecule. Further topographic images of the resolved enantiomers can be found in the ESI.†
Conclusions:
We have implemented a LED-driven methodology to carry out a straightforward synthesis of exo- and endo-dithia[9]helicenes 1 and 2 using a double photocyclization key step that leads to the desired helicene regiochemistry in good yields. P and M enantiomers of both exo- and endo-dithia[9]helicene products were isolated and fully characterized, by X-ray crystallography, in solution, in silico and by STM. The symmetric positioning of the sulfur atoms as anchoring groups in the molecule precludes a scenario of multiple orientations on the gold surface, making it possible to identify the chirality of the isolated molecules via STM topography at room temperature. endo-Dithia[9]helicene-2 displays an experimental dissymmetry factor (glum = 1.2·10−2) about three times larger than its isomer, exo-dithia[9]helicene, and of its smaller homologue endo-dithia[7]helicene. The theoretical calculations reproduce this behavior, although semi-quantitative agreement with the experiment is achieved, and highlight the impact of (1) magnetic and electronic dipole transition moments, (2) HT and FC contributions, on the overall chiroptical responses.It is still early to determine whether this is an isolated event, but a one-order magnitude of amplification of the dissymmetry factor has been also reported in an extended [7]helicene (glum = 0.77·10−3) compared to its longer [9]helicene homologue (glum = 7.44·10−3).31 This opens the gate for further studies trying to relate the structural-CPL response relationships on a larger sampling of structurally related systems in order to determine the underlying factors behind this enhanced dissymmetry factor.
Author contributions
This work is the result of the cooperation between three main research teams from the University of Alicante, the University of Rennes and the State University of New York. B. C. B., P. J. B. and A. G. carried out the synthesis, spectroscopic and crystallographic characterization of the thiahelicenes considered in this work. T. d. A., C. S. and C. U. did the STM characterization as single molecules adsorbed on gold. R. R., N. V. and J. C. performed the separation of enantiomers and determined their photophysical and chiroptical properties. P. M. and J. A. carried out the theoretical studies of the chiroptical properties of these compounds.Conflicts of interest
There are no conflicts to declare.Acknowledgements
A. G. and C. U. thank the financial support by the Spanish MICIIN (PID2019-109539GB-C41), the Generalitat Valenciana (PROMETEO/2021/017), and the University of Alicante (VIGROB-285). C. S. thanks for the financial support by the Generalitat Valenciana through CDEIGENT2018/028. The computational resources provided by the Department of Applied Physics of the University of Alicante are greatly appreciated. J. A. and P. M. thank the National Science Foundation, grant CHE-1855470, for support of the theoretical component of this study, and the Center for Computational Research (CCR) at the University at Buffalo for providing computational resources. J. C. thanks the Ministère de l’Education Nationale, de la Recherche et de la Technologie and the Centre National de la Recherche Scientifique (CNRS). R. R. Thanks Xunta de Galicia for a Postdoctoral Fellowship.References
- C.-F. Chen and Y. Shen, Helicene Chemistry, From Synthesis to Applications, Springer-Verlag: Berlin, Heidelberg, Germany, 2017, pp. 231–245 Search PubMed.
- M. Gingras, Chem. Soc. Rev., 2013, 42, 1051–1095 RSC.
- J. P. Riehl and G. Muller, In Comprehensive Chiroptical Spectroscopy: Instrumentation, Methodologies, and Theoretical Simulations, John Wiley & Sons, Inc., 2012, Volume 1, pp. 65–90 Search PubMed.
- (a) T. Mori, Circularly Polarized Luminescence of Isolated Small Organic Molecules, Springer, 2020 CrossRef; (b) L. E. MacKenzie, L.-O. Palsson, D. Parker, A. Beeby and R. Pal, Nat. Commun., 2020, 11, 1676 CrossRef CAS PubMed.
- T. Mori, Chem. Rev., 2021, 121, 2373–2412 CrossRef CAS PubMed.
- H. Tanaka, M. Ikenosako, Y. Kato, M. Fujiki, Y. Inoue and T. Mori, Commun. Chem., 2018, 1, 38 CrossRef.
- See for instance: H. Kubo, T. Hirose, T. Nakashima, T. Kawai, J. Hasegawa and K. Matsuda, J. Phys. Chem. Lett., 2021, 12, 686–695 CrossRef CAS PubMed.
- K. Dhbaibi, L. Favereau and J. Crassous, Chem. Rev., 2019, 119, 8846–8953 CrossRef CAS PubMed.
- (a) Y. Sawada, S. Furumi, A. Takai, M. Takeuchi, K. Noguchi and K. Tanaka, J. Am. Chem. Soc., 2012, 134, 4080–4083 CrossRef CAS PubMed; (b) K. Nakamura, S. Furumi, M. Takeuchi, T. Shibuya and K. Tanaka, J. Am. Chem. Soc., 2014, 136, 5555–5558 CrossRef CAS PubMed; (c) K. Goto, R. Yamaguchi, S. Hiroto, H. Ueno, T. Kawai and H. Shinokubo, Angew. Chem., Int. Ed., 2012, 51, 10333–10336 CrossRef CAS PubMed; (d) H. Oyama, K. Nakano, T. Harada, R. Kuroda, M. Naito, K. Nobusawa and K. Nozaki, Org. Lett., 2013, 15, 2104–2107 CrossRef CAS PubMed; (e) M. Shyam Sundar, H. R. Talele, H. M. Mande, A. V. Bedekar, R. C. Tovar and G. Muller, Tetrahedron Lett., 2014, 55, 1760–1764 CrossRef CAS; (f) T. Otani, A. Tsuyuki, T. Iwachi, S. Someya, K. Tateno, H. Kawai, T. Saito, K. S. Kanyiva and T. Shibata, Angew. Chem., Int. Ed., 2017, 56, 3906–3910 CrossRef CAS PubMed; (g) C. Shen, M. Srebro-Hooper, M. Jean, N. Vanthuyne, L. Toupet, J. A. G. Williams, A. R. Torres, A. J. Riives, G. Muller, J. Autschbach and J. Crassous, Chem. – Eur. J., 2017, 23, 407–418 CrossRef CAS; (h) R. Yamano, J. Hara, K. Murayama, H. Sugiyama, K. Teraoka, H. Uekusa, S. Kawauchi, Y. Shibata and K. Tanaka, Org. Lett., 2017, 19, 42–45 CrossRef CAS PubMed.
- (a) W. L. Zhao, M. Li, H.-Y. Lu and C.-F. Chen, Chem. Commun., 2019, 55, 13793–13803 RSC; (b) J. Crassous, Circularly polarized luminescence in helicene and helicenoid derivatives in “Circularly Polarized Luminescence of Isolated Small Organic Molecules”, T. Mori, ed., Springer, 2020, pp. 53–97 Search PubMed.
- E. M. Sánchez-Carnerero, A. R. Agarrabeitia, F. Moreno, B. L. Maroto, G. Muller, M. J. Ortiz and S. de la Moya, Chem. – Eur. J., 2015, 21, 13488–13500 CrossRef PubMed.
- E. Licandro, S. Cauteruccio and D. Dova, Chapter One, Adv. Heterocycl. Chem., 2016, 118, 1–46 CrossRef CAS.
- Examples of sulfur-containing [9]helicenes: (a) Y. Yamamoto, H. Sakai, J. Yuasa, Y. Araki, T. Wada, T. Sakanoue, T. Takenobu, T. Kawai and T. Hasobe, J. Phys. Chem. C, 2016, 120, 7421–7427 CrossRef CAS; (b) Y. Yamamoto, H. Sakai, J. Yuasa, Y. Araki, T. Wada, T. Sakanoue, T. Takenobu, T. Kawai and T. Hasobe, Chem. – Eur. J., 2016, 22, 4263–4273 CrossRef CAS PubMed; (c) F. Chen, T. Tanaka, Y. S. Hong, T. Mori, D. Kim and A. Osuka, Angew. Chem., Int. Ed., 2017, 56, 14688–14693 CrossRef CAS; (d) J. Larsen and K. Bechgaard, Acta Chem. Scand., 1996, 50, 71–76 CrossRef CAS; (e) Q. Zhang, Y.-F. Wu, S.-W. Ying, S.-D. Liao, L. Zhang, J.-J. Du, B.-W. Chen, H.-R. Tian, F.-F. Xie, H. Xu, S.-L. Deng, S.-Y. Xie and L.-S. Zheng, Angew. Chem., Int. Ed., 2022, e202204334 Search PubMed.
- B. C. Baciu, T. de Ara, C. Sabater, C. Untiedt and A. Guijarro, Nanoscale Adv., 2020, 2, 1921–1926 RSC.
- B. C. Baciu, J. A. Vergés and A. Guijarro, J. Org. Chem., 2021, 86, 5668–5678 CrossRef CAS PubMed.
- K. B. Jørgensen, Molecules, 2010, 15, 4334–4358 CrossRef.
- Root mean squared deviation calculated with Pymol:L. Schrödinger and W. DeLano (2020). PyMOL. Retrieved from https://www.pymol.org/pymol.
- (a) P. Morgante and R. Peverati, Chem. Phys. Lett., 2021, 765, 138281 CrossRef CAS; (b) R. Peverati and D. G. Truhlar, Philos. Trans. R. Soc., A, 2014, 20120476 CrossRef PubMed.
- Y. Nakai, T. Mori and Y. Inoue, J. Phys. Chem. A, 2012, 116, 7372–7385 CrossRef CAS PubMed.
- K. Dhbaibi, L. Favereau and J. Crassous, Chem. Rev., 2019, 119, 8846–8953 CrossRef CAS PubMed.
- M. Sapir and E. Vander Donckt, Chem. Phys. Lett., 1975, 36, 108–110 CrossRef CAS.
- E. Vander Donckt, J. Nasielski, J. R. Greenleaf and J. B. Birks, Chem. Phys. Lett., 1968, 2, 409–410 CrossRef CAS.
- M. Srebro-Hooper and J. Autschbach, Annu. Rev. Phys. Chem., 2017, 68, 399–420 CrossRef CAS.
- J. Autschbach, L. Nitsch-Velasquez and M. Rudolph, Top. Curr. Chem., 2011, 298, 1–98 CAS.
- T. Yanai, D. P. Tew and N. C. Handy, Chem. Phys. Lett., 2004, 393, 51–57 CrossRef CAS.
- F. Weigend and R. Ahlrichs, Phys. Chem. Chem. Phys., 2005, 7, 3295–3305 RSC.
- K. Dhbaibi, L. Abella, S. Meunier-Della-Gatta, T. Roisnel, M. Vanthuyne, B. Jamoussi, G. Pieters, B. Racine, E. Quesnel, J. Autschbach, J. Crassous and L. Favereau, Chem. Sci., 2021, 12, 5522–5533 RSC.
- G. Longhi, E. Castiglioni, C. Villani, R. Sabia, S. Menichetti, C. Viglianisi, F. Devlin and S. Abbate, J. Photochem. Photobiol., A, 2016, 331, 138–145 CrossRef CAS.
- Y. Liu, J. Cerezo, G. Mazzeo, N. Lin, X. Zhao, G. Longhi, S. Abbate and F. Santoro, J. Chem. Theory Comput., 2016, 12, 2799–2819 CrossRef CAS PubMed.
- K.-H. Ernst, Acc. Chem. Res., 2016, 49, 1182–1190 CrossRef CAS PubMed.
- Z. Qiu, C.-W. Ju, L. Frédéric, Y. Hu, D. Schollmeyer, G. Pieters, K. Müllen and A. Narita, J. Am. Chem. Soc., 2021, 143, 4661–4667 CrossRef CAS.
Footnote |
| † Electronic supplementary information (ESI) available. CCDC 2184340 and 2184341. For ESI and crystallographic data in CIF or other electronic format see DOI: https://doi.org/10.1039/d2tc02910c |
| This journal is © The Royal Society of Chemistry 2022 |


