 Open Access Article
Raman and scanning probe microscopy for differentiating surface imprints of E. coli and B. cereus
Birgit
Bräuer†
ab,
Martin
Werner†
ab,
Dieter
Baurecht
a and
Peter A.
Lieberzeit
 *a
*a
aFaculty for Chemistry, Department of Physical Chemistry, University of Vienna, Waehringer Strasse 42, 1090 Vienna, Austria. E-mail: Peter.Lieberzeit@univie.ac.at
bUniversity of Vienna, Vienna Doctoral School in Chemistry (DoSChem), Währinger Str. 42, 1090 Vienna, Austria
First published on 13th April 2022
Abstract
Molecularly imprinted polymers (MIPs) are artificial recognition materials mimicking biological recognition entities such as antibodies. The general model of imprinting assumes that functional monomers interact with functional groups present on the target species which leads to cavities complementing the template in surface chemistry and shape thus ensuring recognition. However, to date there is little independent experimental evidence supporting that the surface chemistry in the imprints is tailored to analyte recognition and thus differs from the surface chemistry of the surrounding polymer. Herein, we investigate such chemical differences between imprints of Escherichia coli and Bacillus cereus in poly(styrene-co-DVB) and a commercial acrylate-based polymer by the means of confocal Raman microscopy and PLS-DA. The MIPs were generated using a stamping approach. Peak-force QNM measurements were conducted to rule out residues of bacterial cells in the imprints. While imprints of E. coli and B. cereus could be distinguished based on their Raman spectra in the acrylate-based polymer, differentiation in poly(styrene-co-DVB) was not significant. This could be a result of a higher potential of acrylate functional groups for interacting with lipopolysaccharides and peptidoglycans on bacteria surfaces compared to the phenyl groups of poly(styrene-co-DVB) and emphasizes the importance of the right choice of functional monomers for a specific target analyte.
Introduction
Molecular imprinting aims at transferring chemical functionality to macromolecular matrices by template-controlled polymerization. It is widely assumed that the respective mechanism involves self-assembly of functional monomers around the template before polymerization or in an oligomer state. Polymerization of the functional monomers together with crosslinking monomers preserves these pre-arranged adducts. When the template is removed, it leaves complementary binding sites behind that mirror both its shape and functionality.1 Hence, molecular imprinting is related to the process of forming complimentary chemical functionality in antibodies towards an antigen, proposed by Pauling,2 which also gives molecularly imprinted polymers (MIPs) the name “plastic antibodies”.3Several studies have investigated this model, e.g. by examining the initial step of complex formation between template and functional monomers,4,5 or by examining the chemical functionality of the polymerized product.6 However, most MIP studies focus merely on their application as a sorption material or recognition layer in chemical sensing.7,8
Molecular imprinting is not limited to small molecules, but also comprises larger species such as cells.9 There is a vast variety of different cell types, including prokaryotic bacteria cells as well as eukaryotic mammalian cells, that were successfully used as templates in surface imprinting to generate selective recognition layers.10 Chemical sensors, using surface imprinted polymers (SIPs) as recognition layers for bacteria detection, have been reported to feature selective behaviour towards the imprinted species11 and also turned out to be able to detect bacteria in the presence of complex background matrix (e.g. milk).12
SIPs feature cavities on their surfaces that one can visualize by microscopic techniques. According to MIP theory, they should also carry chemical functionality complimentary to the template surface. As a consequence, one would expect that cells with different surface chemistries should also lead to distinct surface functionality in the corresponding imprints (see Scheme 1). To test this hypothesis, bacteria seem an optimal model: Gram-negative species mainly contain lipopolysaccharides and phospholipids on their surfaces.13 In contrast, Gram-positive ones lack such membranes and comprise a thick peptidoglycan cell wall.14
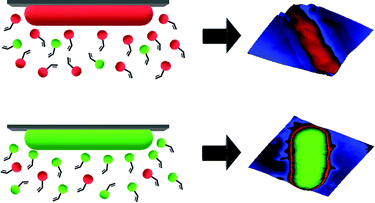 | ||
| Scheme 1 Illustration of generation of complimentary chemical information on SIPs for different bacteria cells. | ||
Raman spectroscopy has previously been used as a straightforward technique to differentiate and identify bacteria cells based on such differences.15–19 However, those spectral differences are rather small. This makes it necessary to apply chemometric tools such as PCA,15 LDA16 or PLS-DA18 to the spectra. If the basic assumption of imprinting is valid, also the imprints of Gram-negative and Gram-positive bacteria should exhibit different spectral characteristics due to different distribution densities of functional groups. This study employs Confocal Raman Microscopy to assess surface imprints of Gram-negative E. coli and Gram-positive B. cereus based on their Raman spectra. For that purpose, we imprinted two different bacteria, namely E. coli (Gram-negative) and B. cereus (Gram-positive) into two polymer systems: a commercial acrylate-based polymer and poly(styrene-co-DVB). Among others, this allows for assessing differences resulting from chemical composition of the polymer.
Confocal Raman Microscopy combines a Raman spectrometer and a confocal microscope, which allows it to acquire spatially resolved chemical information of Raman-active samples, such as polymers, in 3 dimensions.20 Again, it is imperative to use chemometric approaches, in this case PLS-DA,21 to extract the respective spectral differences leading to imprint differentiation. This even more so, because one expects SIP to be different on their surfaces, but the laser focus voxel of the Raman Microscope is about 800 nm in z direction.
One needs to consider a further aspect in these experiments: a recent report shows that cell residues may remain in SIP cavities. Such biomolecule deposits likely influence the surface properties.22 To exclude misinterpretation of the Raman data caused by such residues and thus falsely claim differences between different imprints, it is necessary to determine if they are present on the respective surface. One way to achieve this is Peak Force Quantitative Nano Mechanics (PF-QNM), an atomic force microscopy (AFM) technique that allows for high resolution mapping of nano-mechanical surface properties, such as adhesion forces between tip and surface or surface stiffness.23 If the nanomechanical properties of cell residues differ from those of the polymer surface, they lead to image contrast in PF-QNM.24
Experimental
Materials
(3-Aminopropyl)triethoxysilane (APTES), D-glucose monohydrate, di-potassium hydrogen phosphate, potassium dihydrogen phosphate, dimethyl sulfoxide (DMSO), divinylbenzene (DVB), sodium hydroxide and styrene were purchased from Merck. 2,2′-Azobis(2-methylpropionnitril) (AIBN), 11-mercapto-1-undecanol, toluene and yeast extract were obtained from Sigma Aldrich. Microscope slides and proteose peptone were supplied by VWR chemicals. 3-[(Methacryloyloxy)-propyl]trimethoxysilane was purchased from Alfa Aesar. NaCl was obtained from AppliChem and disuccinimidyl suberate from Acros Organics. Sodium dodecyl sulfate (SDS) was purchased from Fluka Chemie AG. Heavy Duty Ink was supplied by Profactor GmbH. All chemicals were used as received without further purification. Escherichia coli ATCC® 9637™ and Bacillus cereus ATCC® 11778™ were obtained from American Type Culture Collection.Bacteria cultivation
Escherichia coli ATCC® 9637™ and Bacillus cereus ATCC® 11778™ were cultured for 24 hours at 37 °C in lysogeny broth (10 g l−1 proteose peptone, 5 g l−1 yeast extract, 5 g l−1 NaCl and 1 g l−1 D-glucose monohydrate). Cells were harvested by centrifugation (3500 rpm, 6 min) and washed twice with autoclaved distilled water. The bacteria were suspended in distilled water to concentrations of 108–109 cells per ml, which was determined on a cell counter (CASY Cell Counter with 45 μm capillary; OMNI Life Science GmbH & Co. KG).Fabrication of E. coli and B. cereus stamps
Glass slides were cut from microscope slides, cleaned in acetone and oxidized in a Diener Zepto One plasma cleaner at a pressure of 1 × 10⁻³ mbar and a power of 5.5 W for 15 minutes. Incubation in a solution of 2.4% (v/v) APTES in toluene for 1 hour at room temperature yielded amino-functionalized glass. The glass slides were then immersed in a solution of 0.5% DSS in DMSO for 1 hour at room temperature, washed with 25 mM PBS (pH = 7) and left to dry at 37 °C. Aqueous bacteria suspensions with concentrations of 108 cells per ml were prepared for both E. coli and B. cereus. Glass slides were incubated with the respective bacteria suspension for 2 hours before unbound excess bacteria were washed off with distilled water and stamps were dried at 37 °C prior to imprinting.Synthesis of E. coli-and B. cereus-imprinted poly(styrene-co-DVB)
Substrate glass slides were cleaned in acetone and oxidized in a Diener Zepto One plasma cleaner (1 × 10⁻³ mbar, 5.5 W) for 15 minutes. To covalently link the polymer to the glass substrates, the latter were functionalized with 3-[(methacryloyloxy)propyl] trimethoxysilane by immersion into a solution of 2% (v/v) of the silane in toluene. The modified slides were washed with toluene, acetone, and water, and dried at 80 °C. Poly(styrene-co-DVB) was prepared by adding 250 μl each of styrene and DVB to 9 mg AIBN and pre-polymerizing at 70 °C until reaching the gelling point. The pre-polymer was spin-coated (2000 rpm, 10 s) onto the functionalized glass substrate before pressing two stamps each of E. coli and B. cereus onto the coated substrate in a diagonal manner (Scheme 2). Polymerization took place at 80 °C overnight.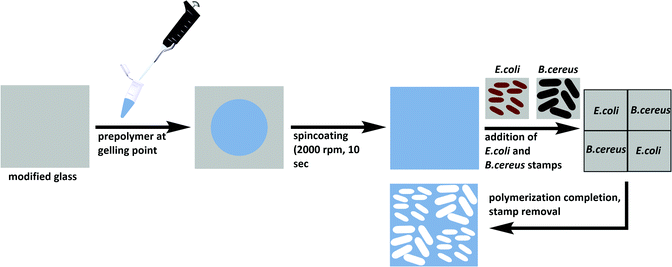 | ||
| Scheme 2 Preparation of E. coli- and B. cereus-imprinted poly(styrene-co-DVB) using the stamp imprinting approach. | ||
Synthesis of E. coli- and B. cereus-imprinted Heavy Duty Ink
Functionalized substrate slides (see above) were spin-coated with the Heavy Duty Ink polymerization mixture at 2000 rpm, 10 s. Two stamps each of E. coli and B. cereus were placed on top of the film in a diagonal manner. Polymerization took place in Argon atmosphere by UV irradiation at 365 nm for 1 hour. Following removal of bacteria stamps, the samples were washed in a solution of 0.5% SDS in 20 mM NaOH and rinsed with distilled water to ensure complete removal of bacteria from the imprinted polymer.Investigation of rebinding capability of E. coli-imprinted poly(styrene-co-DVB) and Heavy Duty Ink
E. coli-imprinted poly(styrene-co-DVB) and Heavy Duty Ink were prepared as described above. Complete removal of template bacteria was confirmed by AFM imaging. For investigating rebinding of E. coli to the imprints, both E. coli-imprinted thin films were incubated in aqueous E. coli suspension (108 cells per ml) for 2 hours. Subsequently, the samples were dipped in distilled water to avoid bacteria simply drying on random locations on the sample surface. Rebinding was then investigated via AFM imaging.AFM and PF-QNM measurements
Tapping mode AFM and PF-QNM measurements took place on a Bruker Multi Mode 8 AFM equipped with PF-QNM extension. Tapping mode AFM measurements were performed on E. coli- and B. cereus-imprinted poly(styrene-co-DVB) and Heavy Duty Ink as well as E. coli- and B. cereus glass stamps to determine surface roughnesses of imprints and bacterial cells. TESPA-V2 probes (Bruker Corporation; 320 kHz; 42 N m−1) were used to scan 5 μm × 5 μm areas at a resolution of 512 samples per line. For PF-QNM measurements, Bruker RTESPA-525 probes (Bruker Corporation; 525 kHz, 200 N m−1) were modified according to an adapted recipe:25 the tips were PVD-coated with 5 nm Cr and 30 nm Au and modified with 11-mercapto-1-undecanol by immersing in a 3 mM solution of 11-mercato-1-undecanol in ethanol overnight. Prior to actual measurements, tips underwent relative calibration (with PF-QNM standard sample kit; Bruker Corporation): A sapphire 12 M standard served to calibrate deflection sensitivity, while the polystyrene-film-12 M standard was utilized to determine the tip radius. Images were acquired with a scan size of 20 μm × 20 μm at a resolution of 256 samples per line.AFM measurements for E. coli rebinding were conducted using the AFM function of a WITec alpha 300 RAS combined Raman Microscope and AFM using tapping mode probes (WITec Wissenschaftliche Instrumente und Technologie GmbH, 285 kHz, 42 N m−1). AFM scans were acquired with a scan size of 50 × 50 μm and 256 samples per line.
Data evaluation of AFM and PF-QNM measurements
Data was evaluated with the open-source software Gwyddion 2.50. Subtracting a second order polynomial from the image removed background curvature followed by levelling the topography images to a minimum value of 0. The z-ranges of the image scans were adjusted for better comparison of the data. Imprint depth was determined from topography images by extracting section profiles through the cavities (N = 5 for each sample). Two-sample Student t-tests were performed to evaluate depth differences of the cavities on the different SIP thin films. Surface roughness was determined for 1 μm sections in the imprints and on bacterial cells immobilized on the stamp. Stiffness and adhesion force data were evaluated from the corresponding PF-QNM image scans by extracting the values from different spots that were representative for the different surface types (N = 5 for each surface type) with an averaging radius of 5 pixels per spot.Confocal Raman microscopy instrumentation
Raman spectra were acquired on an alpha 300 ARS Confocal Raman Microscope by WITec Wissenschaftliche Instrumente und Technologie GmbH (Germany). A 532 nm diode laser was used as an excitation source at a laser power of 8 mW. An integration time of 20 s and 3 accumulations were chosen for all Raman spectra. An EC “Epiplan Neofluar” DIC lens (Carl Zeiss AG, Germany) with 100-fold magnification and a numerical aperture of 0.9 served to focus the excitation light onto the sample surface. The instrument was equipped with an ultra-high throughput Raman spectrometer employing a diffraction grating (600 g mm−1), BLZ = 500 nm) and using a thermoelectrically cooled front-illuminated CCD camera to detect the Raman scattered light.General preprocessing of Raman spectra
Spectral preprocessing prior to PLS-DA was carried out using the WITec Project FIVE software. Removal of cosmic rays was achieved by utilizing the cosmic ray detection algorithm with a filter size of 2 pixels and a dynamic factor (algorithm sensitivity) of 12. Background subtraction was performed using the shape function with a shape size of 100 pixels.Differentiating between E. coli and B. cereus imprints using PLS-DA
Differentiating between E. coli and B. cereus imprints took place in the same manner for both poly(styrene-co-DVB) and Heavy Duty Ink samples (Scheme 3): 20 Raman spectra each were acquired on 20 different random locations on both of the 2 E. coli-imprinted and B. cereus-imprinted quadrants. Spectral autofocus was carried out for the spectral range between 2785 and 3098 cm−1 prior to acquiring each Raman spectrum to maximize signal intensity and ensure the same relative location of the Raman laser focus compared to the imprint surface. Following removal of cosmic rays and background subtraction, PLS-DA was carried out in the SoloMIA chemometrics software (Eigenvector Research Inc.). 20 spectra of each E. coli and B. cereus imprints (10 per quadrant) were used for model calibration. The spectra were assigned their correct class (either E. coli or B. cereus imprint) and were cropped so that only spectral regions containing polymer signals were left (491–1762 cm−1 and 2778–3171 cm−1). Further spectral pre-processing comprised normalizing (1-Norm, area = 1) and autoscaling before calculating the PLS-DA model. The dataset for PLS-DA model validation consisted of the remaining 10 spectra per quadrant (20 per imprint type) and was pre-processed in the same manner as the calibration data. For the control experiments for both poly(styrene-co-DVB) and Heavy-Duty Ink, 20 Raman spectra were acquired per quadrant in the same manner as before, but on the polymer surface surrounding the imprints instead of in the imprints. Spectra acquired around E. coli imprints were classified as “polymer A” and those acquired adjacent to B. cereus imprints were assigned the class “polymer B”. Spectral pre-processing as well as PLS-DA model calibration and validation for polymer A and B happened in the same manner as during differentiation experiments. | ||
| Scheme 3 Workflow for establishing Raman-based PLS-DA models for differentiation of E. coli and B. cereus imprints in Heavy Duty Ink and poly(styrene-co-DVB). | ||
In order to investigate the significance of the results, class prediction probabilities (i.e. the probability of assigning a certain spectrum to a defined class) were collected from the SoloMIA software, followed by calculating mean values and standard deviations for E. coli-imprint and B. cereus-imprint spectra (or Polymer A and B for control experiments). One-sample student t-tests helped determining if the probabilities significantly differ from 0.5 (which is the expected value for random assignment). Additionally, two-sample student t-tests were carried out to determine if the results from imprint classification indicated significantly better class predictions than the results from the control experiments.
Results and discussion
AFM investigations of SIP thin films
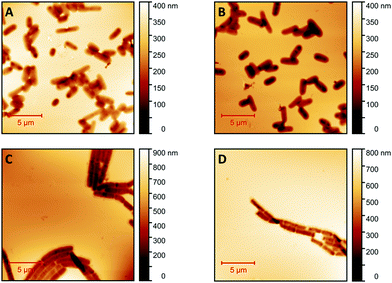
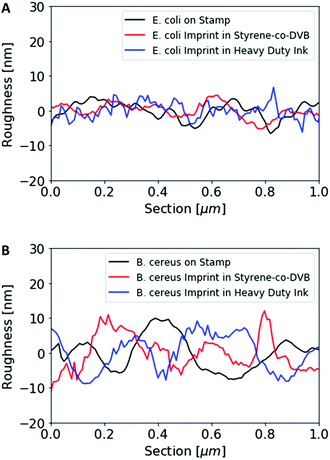
Fig. 1 shows AFM images revealing the topographies of the synthesized thin films. Both polymer types imprinted with E. coli cells feature rod-shaped cavities distributed over their respective surfaces (Fig. 1A and B). Obviously, neither cavity shapes, nor imprinting densities depend on the polymer type. Also, the cavities in both polymer thin films reveal similar imprint depths, namely 174 nm ± 31 nm for poly(styrene-co-divinylbenzene) and 170 nm ± 30 nm for Heavy Duty Ink. In the same manner, B. cereus SIP also show rod-shaped cavities spread over the respective surface (Fig. 1C and D). However, B. cereus imprints are larger than E. coli imprints and also lead to a different pattern regarding surface coverage, which probably results from different aggregation properties of the bacteria on stamps. Again, imprints in the two polymers are equally deep, namely 402 nm ± 25 nm for poly(styrene-co-divinylbenzene) and 434 nm ± 40 nm for the Heavy-Duty Ink. However, B. cereus imprints are considerably deeper those of E. coli.Fig. 2 summarizes the roughness profiles of both bacteria species on the stamps and the corresponding imprints (Fig. 2), respectively. Clearly, all these values are similar when comparing the same bacteria species. It is worth mentioning that B. cereus comprises and leads to rougher surfaces, than E. coli. Similarities between the surface roughness of the bacteria cells and their corresponding imprints on SIPs indicate that the surface roughness inside the imprints is determined by the roughness of the template cell, which further corroborates the imprinting process. Transfer of nanostructures via surface imprinting of bacteria cells has recently been reported24 and manifests itself in the roughness data herein.
Surface imprinting of different bacteria species leads to differences in imprint depth and surface roughness inside the cavities. However, imprinting the same bacteria species in two different polymer systems, namely poly(styrene-co-DVB) and heavy duty ink, generates SIPs with similar imprint depth and surface roughness. Therefore, these SIPs only differ in their chemical functionality.
Differentiating between E. coli- and B. cereus-imprints in Heavy Duty Ink
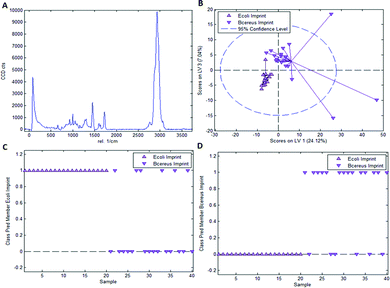
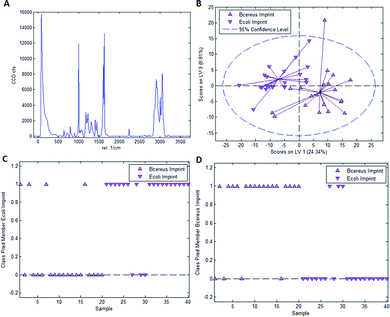
As mentioned earlier, it is necessary to apply chemometric strategies to classify different imprinted and non-imprinted surfaces for two reasons: first, the Raman spectra of bacteria are rather similar despite variations in surface chemistry. And second, the Raman microscope has a sampling depth of about 800 nm and thus does not only monitor the surface. Fig. 3 collects the respective data for distinguishing imprints of E. coli and B. cereus in Heavy Duty Ink. Fig. 3A shows the Raman spectrum of this acrylate-based, commercial matrix for UV-coating (i.e. Heavy Duty Ink). Fig. 3B shows the scores plot obtained from a PLS-DA model with 3 latent variables using a calibration dataset of 20 spectra of each E. coli- and B. cereus-imprints (see Experimental section for details on model establishment). Clearly, the spectra obtained in E. coli- and B. cereus-imprints, respectively, show two distinct clusters. However, PLS-DA is a supervised method; it requires assigning calibration spectra to their respective classes prior to establishing the model. Hence one expects clustering of each class, so this per se does not necessarily mean that the model indeed successfully distinguishes the two different imprint categories. For that purpose, it is necessary to validate the model by applying it to a test dataset comprising 20 spectra of each imprint type that have not been part of model calibration. Fig. 3C and D show class prediction memberships for E. coli- and B. cereus-imprints, respectively. A value of 1 indicates assignment of a spectrum to the respective class, while a value of 0 means that the spectrum is not associated with the class. While all E. coli-imprint samples are correctly identified as E. coli-imprints, 6 out of 20 B. cereus-imprints are falsely classified as E. coli-imprints. In total, the model correctly identifies 34 out of 40 (85%) validation spectra.Since PLS-DA is extremely sensitive to spectral differences, one cannot rule out that distinction between the imprint types originates from inhomogeneities in the bulk polymer rather than from actual differences in surface chemistry between the two imprint types. To rule this out, it is necessary to carry out a control experiment by recording Raman spectra on the polymer surrounding the cavities rather than inside them.
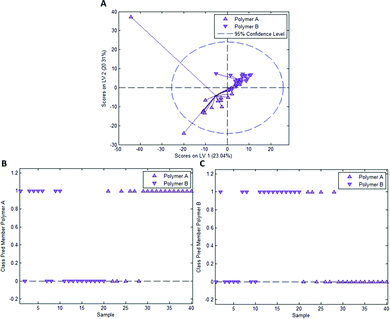
Fig. 4A depicts the scores plot obtained from a PLS-DA model with 3 latent variables resulting from a calibration dataset comprising 20 spectra each for “polymer A” (surface in the vicinity of E. coli imprints) and “polymer B” (surface in the vicinity of B. cereus imprints). Again, each individual class clusters, but model validation in Fig. 4B and C leads to different results than the experiment with E. coli- and B. cereus-imprints: 9 out of 20 spectra are correctly classified as “polymer A” and 12 out of 20 spectra are correctly assigned as “polymer B”. Overall, 52.5% of spectra are accurately classified, which is very close to 50%, the value one would expect for random class assignment in a model with 2 classes.
Table 1 lists the mean values and standard deviations for prediction probabilities of E. coli- and B. cereus imprints as well as polymers A and B for their respective classes and the corresponding Student t-tests data. Obviously, the mean class prediction probabilities for E. coli- and B. cereus-imprint classification for their respective classes significantly differ from 0.5, the value expected for random class assignment. In contrast, the mean class prediction probabilities in the control experiment do not differ significantly from 0.5, indicating random class assignment in that case. Additionally, a two-sided Student t-test reveals that mean class prediction probabilities for E. coli- and B. cereus-imprint classification differ significantly from the values obtained for the control experiment. This indicates that class assignment of E. coli- and B. cereus-imprints in Heavy Duty Ink is neither random, nor the result of inhomogeneities in polymer composition. This is strongly indicative of differences in surface chemistry between E. coli and B. cereus imprints(!).
| Significant difference between class prediction probability of SIP imprints and surrounding polymer | p-Value |
|---|---|
| + | 0.00015 |
Differentiating between E. coli- and B. cereus-imprints in poly(styrene-co-DVB)
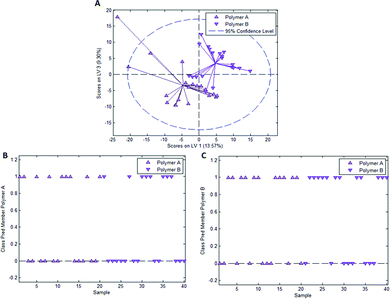
In the case of styrene as a functional monomer and divinylbenzene as a crosslinker, interaction with the template bacteria (i.e. through peptidoglycans in the case of Gram-positive bacteria26 and lipopolysaccharides in the case of Gram-negative bacteria27) is limited to the benzene rings. One would thus expect the differences being less distinct than for acrylates that contain more pronounced functionalities. To test this hypothesis, we established a PLS-DA model distinguishing E. coli- and B. cereus-imprints in poly(styrene-co-DVB) based on their Raman spectra (Raman spectrum of poly(styrene-co-DVB) shown in Fig. 5A). Fig. 5B shows the scores plot of the model calibration with 3 latent variables obtained from a dataset consisting of 20 spectra each of E. coli- and B. cereus- imprints, which form largely distinct clusters in the scores plot. PLS-DA model validation depicted in Fig. 5C and D reveals that 17 out of 20 E. coli-imprint spectra and 16 out of 20 B. cereus-imprint spectra are correctly assigned their respective class, which adds up to 33 out of 40 spectra (82.5%) accurately identified, indicating that differentiation between distinct bacteria imprints seems possible.To determine whether this is due to differences in imprint surface chemistry or just inhomogeneities of the bulk polymer, we undertook the same control experiment as with Heavy Duty Ink. Fig. 6A depicts the scores plot resulting from PLS-DA model calibration with 2 latent variables using a dataset consisting of 20 spectra each of polymer A and polymer B, with observable clustering for both polymer A and B. Fig. 6B and C summarize the outcome of model validation using a dataset of the 20 remaining spectra for each polymer A and B: out of 20 spectra each, 16 spectra for polymer A and 13 spectra for polymer B are assigned their correct classes. Overall, 72.5% of spectra are correctly classified in this case, even though one would expect random assignment (50%) for the control experiment.
Table 2 collects mean class prediction probabilities and standard deviations for both the experiments with E. coli/B. cereus imprints and the control experiment as well as the outcome of the student t-tests. According to one-sample student t-tests, both the prediction probabilities for E. coli/B. cereus imprints as well as polymer A/B significantly differ from 0.5, which indicates that class assignment is not random for either of the experiments.
| Significant difference between class prediction probability of SIP imprints and surrounding polymer | p-Value |
|---|---|
| — | 0.23 |
However, a two-sample student t-test reveals that class prediction probabilities of the E. coli/B. cereus imprint experiment do not differ significantly from those obtained for polymer A and B in the control experiment. Thus, even though differentiation between E. coli and B. cereus imprints is possible, there is no significant difference to the control experiment. This indicates that differentiation between imprint types in this case may just be a result of inhomogeneities in the bulk polymer composition and thus probably not the result of actual chemical differences between imprint and polymer surface. When keeping in mind that styrene as a functional monomer offers fewer possibility for interaction with bacteria surfaces than the acrylate-based Heavy-Duty ink, this seems entirely reasonable.
PF-QNM investigations on SIP thin films
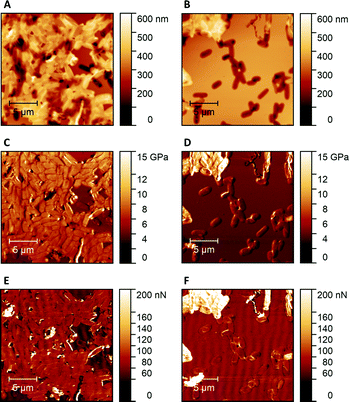
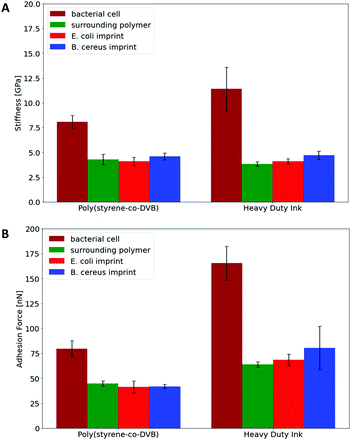
Hence, Raman Microscopy results strongly indicate that it is possible to differentiate imprinted cavities resulting from different microorganisms in Heavy Duty Ink. However, it is necessary to investigate if those differences indeed result from polymer surfaces or from residues stemming from incomplete template removal. PF-QNM measurements are useful for that task, because they are feasible to uncover differences in nano-mechanical properties on surfaces.28 If there are any in the cavities of SIP thin films, this may indicate contamination by cell residues. Fig. 7 summarizes peak-force images obtained on different sample surfaces with modified tips to test this hypothesis: both SIPs – i.e. made from poly(styrene-co-divinylbenzene) and Heavy Duty Ink – show lower stiffness and adhesion forces, than the corresponding bacteria cells. In a qualitative manner, both polymers thus lead to the same result: PF-QNM data allows for distinguishing bacteria and polymers from each other.In a more quantitative manner, Fig. 8 compares the stiffnesses and adhesion forces of different spots in imprints, on the surrounding polymer and on bacteria cells. Obviously, bacteria cells show considerably higher stiffness than the polymer. Both polymer systems show similar stiffness inside the cavities and on the surrounding polymer. In the same manner, E. coli- and B. cereus imprints reveal rather similar mechanical properties. Comparing the adhesion forces between the OH-modified tip and the examined surface, bacteria cell surfaces reveal higher values than the polymers. Furthermore, Heavy Duty Ink shows larger adhesion than poly(styrene-co-divinylbenzene). The latter is not surprising given that it comprises an acrylic polymer, which in inherently more polar, than the styrene-based system. However, as two different tips were used to measure the different polymer systems, one cannot directly compare the absolute values to each other. Nevertheless, the results clearly show that not only stiffnesses, but also the adhesion forces inside both imprint types are similar to their surrounding polymer. Both the large differences in nanomechanical properties between bacteria and polymer and the similarities inside and outside imprints thus clearly indicate that the imprints do not contain residues of the bacteria cells after washing. In conjunction with Raman measurements, the results indicate that distinct surface chemistries are a result of self-assembly of functional monomers with different bacteria surfaces rather than bacteria cell residues, which to the best of our knowledge is one of the very first attempts to assess the basis of molecular imprinting with independent physical data.
Investigation of rebinding capability of E. coli-imprinted poly(styrene-co-DVB) and Heavy Duty Ink
Literature comprises numerous studies investigating rebinding behaviour of SIPs relying on sensing systems (e.g. QCMs or heat-transfer devices).29,30 While they are suitable for assessing the total amount of bacteria (re)bound to the polymer system, they do not provide information on whether or not those bacteria actually bind to the imprints rather than randomly to the SIP surface. Hence, herein we use AFM for investigating and comparing rebinding behaviour of E. coli-imprinted poly(styrene-co-DVB) and Heavy Duty Ink: it yields high resolution topographic data of SIP thin films. Those are suitable to distinguish between bacteria that have rebound to the imprints from bacteria randomly attached to the polymer surface. Fig. 9 shows AFM images of E. coli-imprinted poly(styrene-co-DVB) (A) and E. coli-imprinted Heavy Duty Ink (B) after incubation in aqueous E. coli-suspension (108 cells per ml) for 2 hours. The respective topography images reveal more E. coli binding to the surface SIP based on poly(styrene-co-DVB) (A) than those on Heavy Duty Ink (B). However, bacteria on the former surface seem randomly distributed with hardly any imprints occupied. In contrast, E. coli on Heavy Duty Ink SIP tend to bind more to the imprints (red circles). While overall E. coli bacteria are more affine to poly(styrene-co-DVB), the changes in surface chemistry in Heavy Duty Ink following E. coli-imprinting seem favorable for binding. Though one can observe unspecific binding of bacteria outside of imprints also in Heavy Duty Ink SIPs, this happens to a smaller degree compared to poly(styrene-co-DVB). However, it has to be noted that the aim of this paper was not to optimize polymers for rebinding E. coli: it is to investigate if imprinting actually changes polymer surface chemistry compared to non-imprinted polymer surrounding the cavities and thus subject this fundament of imprinting to experimental evidence.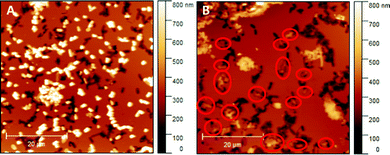 | ||
| Fig. 9 E. coli-imprinted poly(styrene-co-DVB) (A) and E. coli-imprinted Heavy Duty Ink (B) after incubation with E. coli; Bacteria that occupy the imprints were marked with red circles. | ||
Conclusions
Confocal Raman Microscopy and PLS-DA reveal differences in surface chemistry between cavities resulting from surface-imprinting E. coli and B. cereus, respectively, in an acrylate-based polymer (Heavy Duty Ink), but not in a styrene-based SIP. In contrast to this, the surrounding polymer is homogeneous in terms of chemical composition. Furthermore, nanomechanical studies with PF-QNM demonstrate distinctly different properties between bacteria and polymer, but not between non-imprinted and imprinted parts within a polymer. Therefore, it is possible to exclude that the differences observed in Raman result from incomplete bacterial removal.To the best of our knowledge, these findings are among the first to demonstrate with independent physical measures that self-assembly of functional monomers with different templates during the imprinting process leads to distinct imprint surface chemistries. While differentiation is also possible for imprints in poly(styrene-co-DVB), those PLS-DA results do not significantly differ from distinguishing Raman spectra acquired at random locations on the polymer surface outside of the imprints. Thus, imprint differentiation here probably results from chemical inhomogeneity of the polymer. There seems to be no significant difference in surface chemistry between E. coli and B. cereus imprints, which indicates limited possibilities for phenyl groups to interact with bacteria surfaces in different manners. This further emphasizes the importance of choosing appropriate functional monomers for SIPs.
Author contributions
B. B. and M. W.: investigation, methodology, validation, visualization, writing – original draft; D. B.: methodology, supervision, formal analysis; P. A. L.: methodology, supervision, resources, writing – review and editing.Conflicts of interest
There are no conflicts to declare.Acknowledgements
We gratefully acknowledge Dr Leo Schranzhofer from Profactor GmbH, Steyr, for providing us with Heavy Duty Ink.Notes and references
- K. Haupt and K. Mosbach, Chem. Rev., 2000, 100, 2495–2504 CrossRef CAS PubMed
.
- L. Pauling, J. Am. Chem. Soc., 1940, 62, 2643–2657 CrossRef CAS
.
- K. Haupt and K. Mosbach, Trends Biotechnol., 1998, 16, 468–475 CrossRef CAS PubMed
.
- B. Sellergren, M. Lepist and K. Mosbach, J. Am. Chem. Soc., 1988, 110, 5853–5860 CrossRef CAS
.
- J. Svenson, H. S. Andersson, S. A. Piletsky and I. A. Nicholls, J. Mol. Recognit., 1998, 11, 83–86 CrossRef CAS PubMed
.
- K. Ren and R. N. Zare, ACS Nano, 2012, 6, 4314–4318 CrossRef CAS PubMed
.
- J. B. Ferreira, C. de Jesus Macrino, L. A. F. Dinali, J. F. A. Filho, C. F. Silva, K. B. Borges and W. Romão, Anal. Bioanal. Chem., 2021, 413, 6013–6036 CrossRef CAS PubMed
.
- B. Bräuer, C. Unger, M. Werner and P. A. Lieberzeit, Sensors, 2021, 21(5550), 1–25 Search PubMed
.
- F. L. Dickert, O. Hayden and K. P. Halikias, Analyst, 2001, 126, 766–771 RSC
.
- J. Pan, W. Chen, Y. Ma and G. Pan, Chem. Soc. Rev., 2018, 47, 5574–5587 RSC
.
- S. Givanoudi, P. Cornelis, G. Rasschaert, G. Wackers, H. Iken, D. Rolka, D. Yongabi, J. Robbens, M. J. Schöning, M. Heyndrickx and P. Wagner, Sens. Actuators, B, 2021, 332, 1–11 CrossRef
.
- R. Arreguin-Campos, K. Eersels, J. W. Lowdon, R. Rogosic, B. Heidt, M. Caldara, K. L. Jiménez-Monroy, H. Diliën, T. J. Cleij and B. van Grinsven, Microchem. J., 2021, 169, 1–8 CrossRef
.
-
R. Hicks, Methods in Molecular Biology, 2017, vol. 1548, pp. 231–245 Search PubMed
.
- C. Weidenmaier and A. Peschel, Nat. Rev. Microbiol., 2008, 6, 276–287 CrossRef CAS PubMed
.
- D. Klein, R. Breuch, S. von der Mark, C. Wickleder and P. Kaul, Talanta, 2019, 196, 325–328 CrossRef CAS PubMed
.
- J. R. Dettman, J. M. Goss, C. J. Ehrhardt, K. A. Scott, J. D. Bannan and J. M. Robertson, Anal. Bioanal. Chem., 2015, 407, 4757–4766 CrossRef CAS PubMed
.
- D. Kusić, B. Kampe, A. Ramoji, U. Neugebauer, P. Rösch and J. Popp, Anal. Bioanal. Chem., 2015, 407, 6803–6813 CrossRef PubMed
.
- C. Mello, D. Ribeiro, F. Novaes and R. J. Poppi, Anal. Bioanal. Chem., 2005, 383, 701–706 CrossRef CAS PubMed
.
- M. Ghebremedhin, R. Heitkamp, S. Yesupriya, B. Clay and N. J. Crane, J. Clin. Microbiol., 2017, 55, 2480–2490 CrossRef CAS PubMed
.
- S. Gomes da Costa, A. Richter, U. Schmidt, S. Breuninger and O. Hollricher, Morphologie, 2019, 103, 11–16 CrossRef CAS PubMed
.
- D. Ballabio and V. Consonni, Anal. Methods, 2013, 5, 3790–3798 RSC
.
- D. Yongabi, M. Khorshid, P. Losada-Pérez, K. Eersels, O. Deschaume, J. D’Haen, C. Bartic, J. Hooyberghs, R. Thoelen, M. Wübbenhorst and P. Wagner, Sens. Actuators, B, 2018, 255, 907–917 CrossRef CAS
.
- K. Xu, W. Sun, Y. Shao, F. Wei, X. Zhang, W. Wang and P. Li, Nanotechnol. Rev., 2018, 7, 605–621 CrossRef CAS
.
- M. Werner, M. Glueck, B. Braeuer, A. Bismarck and P. A. Lieberzeit, Soft Matter, 2022, 18, 2245–2251 RSC
.
- D. Alsteens, V. Dupres, S. Yunus, J.-P. Latgé, J. J. Heinisch and Y. F. Dufrêne, Langmuir, 2012, 28, 16738–16744 CrossRef CAS PubMed
.
- C. Weidenmaier and A. Peschel, Nat. Rev. Microbiol., 2008, 6, 276–287 CrossRef CAS PubMed
.
-
R. Hicks, Preparation of membrane models of Gram-negative bacteria and their interaction with antimicrobial peptides studied by CD and NMR, 2017, vol. 1548 Search PubMed
.
- B. Pittenger and A. Slade, Micros. Today, 2013, 21, 12–17 CrossRef CAS
.
- A. Poller, E. Spieker, P. A. Lieberzeit and C. Preininger, ACS Appl. Mater. Interfaces, 2017, 9, 1129–1135 CrossRef CAS PubMed
.
- P. Cornelis, S. Givanoudi, D. Yongabi, H. Iken, S. Duwé, O. Deschaume, J. Robbens, P. Dedecker, C. Bartic, M. Wübbenhorst, M. J. Schöning, M. Heyndrickx and P. Wagner, Biosens. Bioelectron., 2019, 136, 97–105 CrossRef CAS PubMed
.
Footnote |
| † These authors contributed equally to this work. |
| This journal is © The Royal Society of Chemistry 2022 |

