 Open Access Article
Creative Commons Attribution 3.0 Unported Licence
On the compatibility of high mass loading bismuth anodes for full-cell sodium-ion batteries†
Lars Olow Simon
Colbin
,
Tochukwu E.
Nwafornso
,
Yunjie
Li
and
Reza
Younesi
 *
*
Department of Chemistry-Ångström Laboratory, Uppsala University, Box 538, SE-75121 Uppsala, Sweden. E-mail: reza.younesi@kemi.uu.se
First published on 13th October 2022
Abstract
Metallic bismuth is here studied as an anode material for sodium-ion batteries. The details of electrochemical redox reactions, rate performance and cycled life were investigated using relatively high mass loading electrodes in two- and three-electrode full-cells. It demonstrated that the rate capability of bismuth anodes with high mass loading are not as good as indicated in previous literatures where low mass loading electrodes were used. It also indicated that the resistances causing a faltering rate performance may be connected to a loss in particle contact during desodiation. Efforts were also made to study the different electrochemical processes that occur during early cycles. Less advantageous characteristics of bismuth electrodes are also discussed. For example, several different electrolyte solutions were tested for compatibility with the bismuth system, where only glyme-based solutions seemed to facilitate robust cycling.
Introduction
For modern alkali ion batteries, the choice of anode material is expected to greatly affect how the battery operates. In sodium-ion batteries, it is common to use carbon based anodes,1 where hard carbon is a promising material.2–4 Hard carbon electrodes have operating potentials close to the potential of sodium plating, which can enable a wide operating potential in a full-cell. Yet, this also means that an overpotential for the sodiation can easily result in plating of sodium, especially if the anode processes are particularly resistive.5,6 Also, the resistance on the hard carbon anode is in general ten times larger than the resistance on common cathodes like Prussian white cathodes, regardless of the electrolyte solution used.5Therefore, there is a motivation to investigate alternatives to hard carbon for use as anode materials for sodium-ion batteries.7–9 One such material is bismuth which is expected to alloy with sodium in two processes, first forming NaBi, thereafter Na3Bi according to the following reactions.10
| Bi + Na+ + e− → NaBi | (1) |
| BiNa + 2Na+ + 2e− → Na3Bi | (2) |
Thus, two distinct plateaus should be obtained during electrochemical cycling. The formation of NaBi is expected to occur around 0.67 V vs. Na+/Na, whereas Na3Bi is expected to form around 0.46 V vs. Na+/Na.11 This means sodiation of bismuth should occur at a significantly higher potential than sodiation of hard carbon. The use of bismuth should therefore decrease the risk of plating sodium during a fast sodiation. In fact, bismuth has been reported to display good rate capability, and low polarization during cycling.11 Furthermore, there have also been attempts to alter the bismuth anode to obtain promising cycling performance, for example using nanoflakes of bismuth on nickel foam,12 or mixing it with carbon.13,14 The method of altering the anode may vary, but it seems that one key to successful cycling in previous literatures is the use of relatively low mass loading electrodes and glyme-based electrolyte solvents, i.e. 1,2-dimethoxyethane (DME), di(2-methoxyethyl)ether (diglyme), or bis[2-(2-methoxyethoxy)ethyl] ether (TEGDME). These two parameters are in particular important for alloying anode materials like bismuth where huge volume change is expected during cycling. The importance of using a compatible electrolyte solution11 has been demonstrated before but the influence of mass loading on the performance has not been studied previously. Wang et al.11 demonstrated that they could obtain good cycling against bismuth when diglyme was used as a solvent, whereas the use of propylene carbonate generated unsatisfactory cycling.11
There is therefore still a need to obtain a better understanding of electrochemical sodiation and desodiation, rate capability, and cycle life of high mass loading bismuth electrodes to investigate whether such electrodes could be used in applied full-cell sodium-ion batteries. Here, two- and three-electrode full-cells based on bismuth and Prussian white electrode as well as symmetric bismuth cells are studied. The general electrochemical performance, the cell resistance, and rate performance of high mass loading bismuth anodes are discussed.
Results and discussion
Most previously reported promising results for bismuth anodes are based on glyme-based electrolytes. However, we measured electrochemical perfroamance of few different electrolyes for high mass loading bismuth electrodes in full-cell sodium-ion batteries (see Fig. S1†). Within this set of experiments, robust cycling was only obtained when using either tetraglyme (TEGDME) or diglyme as the electrolyte solvent. The other electrolyte solutions designed for a significant passivation, such as NaPF6 in sulfolane or N-methyl-2-pyrrolidone, which showed promise in the hard carbon – Prussian white system,5 faced rapid capacity fading in a few cycles. The fact that alloying anodes such as bismuth undergo large volume change during cycling means that a completely stable electrolyte solution with no formation of SEI at operating potential of bismuth is desired. This is in particular important for high mass loading electrodes since the expected large volume expansion and contraction leads to cracking or detachment of active particles and SEI species. This therefore explains the reason of promising results with glyme-based electrolytes since it has been speculated that glyme based electrolytes remain stable at low potential and thus no SEI is formed.15 Note that the operating potential of bimuth anode is higher than hard cabon which works in favour of stability of the electrolyte.With NaPF6 in diglyme being selected as the most promising electrolyte solution, the rest of this work was performed using such electrolyte. During chronopotentiometry, all half-cells displayed a peculiar voltage profile during the first sodiation. Bismuth is expected to display two distinct plateaus during cycling, however, the first sodiation never displayed two clear plateaus (Fig. 1a). Instead, an initial sloping profile was present in place of the first plateau. This could be attributed to an initial pulverization of the bismuth particles.16
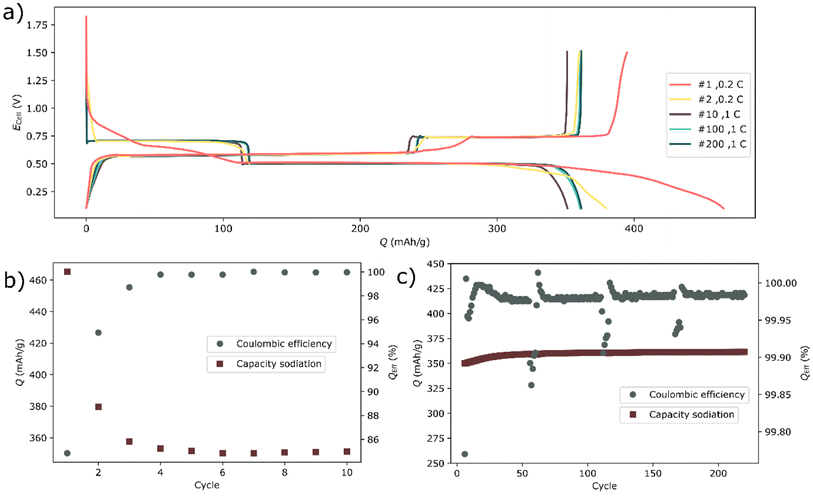 | ||
| Fig. 1 (a) The voltage profile of a bismuth half-cell. (b) The capacity during sodiation (discharging) and coulombic efficiencies during the first 10 cycles and (c) 6 to 220 cycles. | ||
As cycling progressed, the current was intermittently varied. Here 5 cycles at 0.2 C (71 mA g−1, 0.1 mAh cm−2) were followed by 50 cycles at ∼1 C (350 mA g−1, 0.52 mA cm−2) in a repeating fashion (Fig. 1b and c). When the current was decreased, the charge (desodiation) capacity as well as the coulombic efficiency were decreased (Fig. 1c). However, it should be highlighted that such decrease is quite small; the coulombic efficiency decreased from about 99.99% to about 99.85%. A decrease in current would relieve some overpotential which would normally cause an apparent increase in capacity. Yet here, the capacity and coulombic efficiency decreased both during the sodiation and desodiation at lower current.17
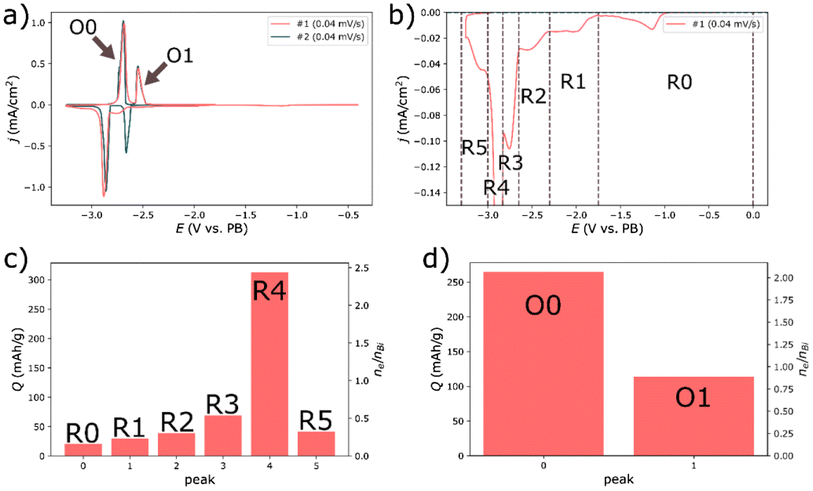
Cyclic voltammetry was performed to get a better understanding of potential side reactions and to get a clearer view of the initial reduction. This was done by using a three-electrode configuration where two separate Prussian white electrodes served as reference and counter-electrode respectively. The counter-electrode was over dimensioned; both in terms of area and capacity. The first reduction revealed several reduction processes, indexed R0 – R5 in Fig. 2. Bismuth should have a capacity of 385 mAh g−1, corresponding to 3 electrons per bismuth atom (see reaction (1) and (2)). Yet, during the first reduction a total charge of 512 mAh g−1 was passed through the cell, corresponding to ∼30% more charge than anticipated by the theoretical capacity. The subsequent oxidation was more in line with the expectations, resulting in a passed charge of 379 mAh g−1 constituted by two peaks (O0 and O1). The charge passed during the first oxidation corresponded to two moles of electrons per mole of bismuth (n_e/n_Bi = 2), see Fig. 2d. That is, precisely what is expected by reaction (2). Similarly, the area of the second oxidation peak inferred that close to one electron per bismuth had passed during this process, which is consistent with reaction (1).
While the oxidation processes were consistent with the expected reactions, the first reduction sweep was evidently more complex. It is noteworthy that the combined area from the peak regions R2, R3 and R4 correspond to a reaction of 3.3 electrons per bismuth (Fig. 2a and b), a bit more than expected from the sum of reaction (1) and (2). Yet, the partitioning of the peaks during the reduction was cruder than for the subsequent oxidation, since there was a clear overlap between several processes. Still, it is tempting to assign the peak regions R2 and R3 to reaction (1) and the peak region R4 to reaction (2)—the first and second alloying reaction with sodium.
The results in Fig. 2 also indicated that the first two reduction events mainly occurred during the first reduction sweep. Bismuth is expected to have an oxide layer, in the form of Bi2O3, of approximately 2 nm.18 Reducing such layer on the electrode to metallic Bi, would require 40 mC for the active mass of 1.17 mg, or 9 mAh g−1 (assuming 100% bismuth, where the density of bismuth is 9.8 g cm−3 and 8.9 g cm−3 for Bi2O319), given smooth spherical particles with a diameter of 40 μm—note that the calculated area and in turn capacity is underestimated. Moreover, in water the reduction of Bi2O3 would be expected to occur as reaction (3):20
| Bi2O3 + 3H2O + 6e− → 2Bi + 6OH− | (3) |
Roughly estimated, this reaction would be expected to have a potential of about −0.8 V vs. PW reference electrode. While the water content was expected to be very low, it is conceivable that the solvent could act as a substitute at a similar potential, resulting in the reduction in the peak region R0 (Fig. 2a and b). Alternatively, the reduction could take place according to reaction (4):
| Bi2O3 + 6Na+ + 6e− → 2Bi + 3Na2O | (4) |
Using the Gibbs free energies of each component19 the potential of this reaction can be roughly estimated to −2.2 V vs. PW reference electrode. Hence, reaction (4) is a possible reaction causing the reduction in the peak region R1 in Fig. 2a and b. It is noteworthy that if the reductions at R0 and R1 were caused by the reduction of Bi2O3 then the powder consisted of 13% oxidized bismuth atoms. This would require 200 mC (50 mAh g−1 assuming 100% bismuth) reduction capacity about six times more than estimated. Bismuth oxide is expected to have been present on the bismuth particles in the pristine electrodes, since no efforts were made to remove an oxide layer before cycling. Still, focused efforts are needed to fully elucidate the electrochemical behavior of such a layer in the presence of non-aqueous battery electrolyte solutions.
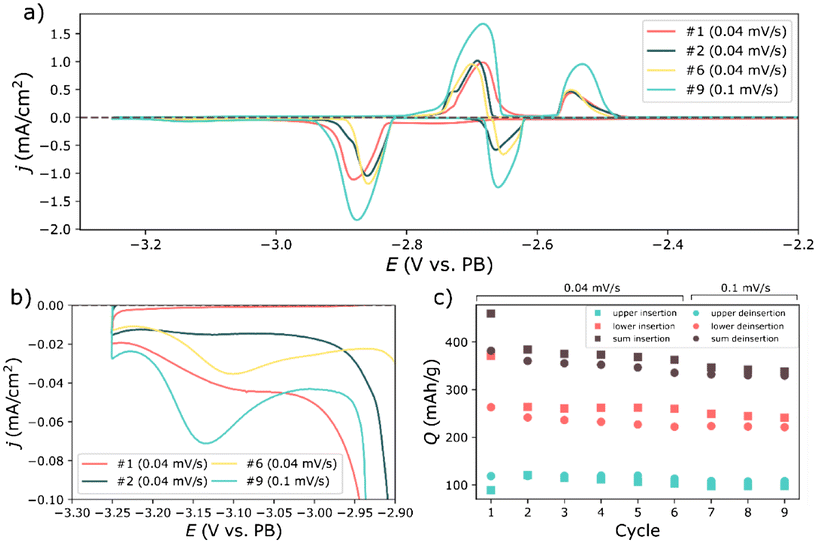
The remaining reduction peak (R5) could be attributed to the reduction of the electrolyte solution and/or impurities in the electrolyte impurities. Similarly, the excess charge from peak region R4 could also be due to a reduction of the electrolyte solution. For long term cycling in full cells, the reduction below −3 V, might become most problematic since it indicated continuous reduction of the electrolyte solution and SEI growth. This reduction is still distinguishable in the subsequent cycles (Fig. 2a, b and 3), albeit to a much lower amount. Reaction (1) and (2) were more distinguishable in the subsequent cycles as shown in Fig. 3a. Calculations of the charge passed in the upper and lower potential regions revealed that the coulombic inefficiency was largely due to the lower potential region. The discrepancy between the charge passed during the lower reduction and oxidation in Fig. 3c, is likely caused by the additional reduction event in Fig. 3b, corresponding to peak region R5 in Fig. 2b. That is, a continuous partial reduction of the electrolyte solution.
Overall, the peaks obtained during the cyclic voltammetry experiment were quite smeared, or displayed a partial splitting. Rather than indicating additional electrochemical processes, this might have been caused by a changing overpotentials for each reaction during operation. The splitting could be caused by particles losing contact, different overpotentials for individual particles, or by a changing electronic conductivity. The smearing might however be due to a limiting diffusion of sodium within the particles. These are all things that could limit the rate performance of the material.
As mentioned earlier the rate capability can be an issue for hard carbon anodes in sodium-ion batteries.21 This is partially an inherent consequence of the low operating potential of hard carbon. Conversely, bismuth has a higher operating potential than hard carbon, thus having the potential to allow higher currents during sodiation. The rate capability of bismuth was tested by performing rate tests in Prussian white – Bimsuth full-cells using two- and three-electrode configurations as well as symmetric cells, presented in Fig. 4–6. The rate capacbility test in two-electrode cells performed with an even mass balancing (N/P-ratio of 1.02). In contrast, the cathode had a large overcapacity in the three-electrode experiment (N/P-ratio of 0.61) in order to get a clearer view of the polarization on the bismuth electrode. In both cases, the cut-off potentials were set to allow for a large polarization, without risking plating sodium. The rate capability of symmetrical bismuth cells was investigated using a narrower cycling window, as complementary to the full-cell measurements (Fig. 5).
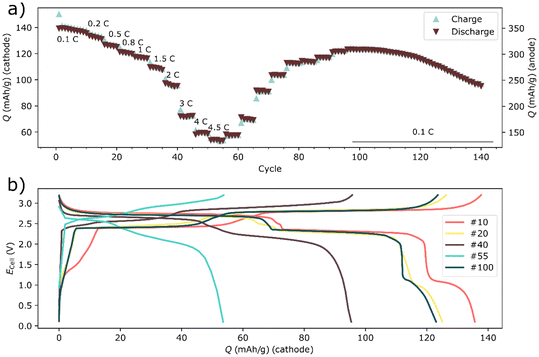 | ||
| Fig. 4 The rate test of a two-electrode Prussian white – Bismuth full-cell. The discharge retention during the symmetrical rate test is shown in a for cycles 1–140, whereas the voltage profile for selected cycles are shown in (b). The indicated C rates in (a) are based on the capacity of the anode. The current densities for the cycles in (b) are shown in Table S1.† | ||
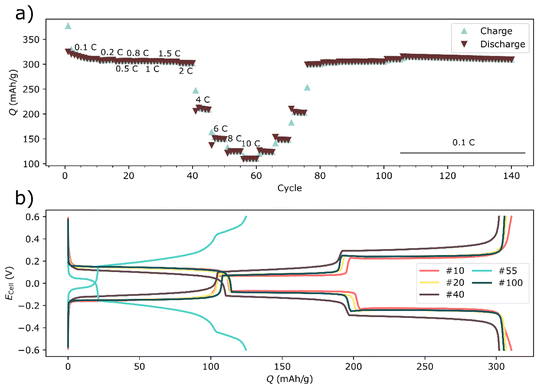 | ||
| Fig. 5 The rate test of a two-electrode bismuth symmetrical cell. The discharge retention during the symmetrical rate test is shown in a for cycles 1–140, whereas the voltage profile for selected cycles are shown in (b). The current densities for the cycles in (b) are shown in Table S2.† | ||
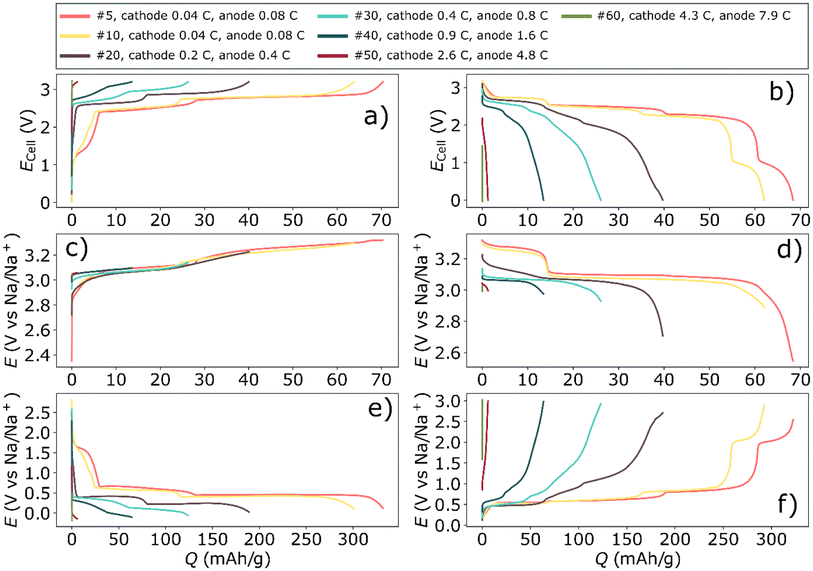 | ||
| Fig. 6 The rate test of a three-electrode cell using a Prussian white cathode, bismuth anode, and a Prussian white reference electrode. The full-cell potential for the charge is shown in (a) whereas the discharge is shown in (b). The potential of the cathode during charging and discharging is shown in (c) and (d), respectively. Similarly, (e) and (f) display the potential of the anode during charging and discharging, respectively. The current densities for the cycles are shown in Table S3.† | ||
The balanced bismuth – Prussian white full-cell displayed a decent rate capability considering that the high mass loading of the cells. Yet, at about 2 C (based on the anode) the polarization began to severely impact the capacity (see Fig. 4). Moreover, deep discharging of the full-cells revealed an additional electrochemical process that occurred around 1 V (Fig. 4b and 6). It was apparent from the three-electrode cycling (Fig. 6 and 7) that this process occurred on the bismuth anode. This process was not visible in half-cell cycling due to the narrower cycling window (a result of a higher control of the potential of the anode during half-cell cycling), see Fig. 1. This additional process may be the semi-reversible cycling of an oxide layer on the bismuth particles. That is, it is possible that one of the initial reduction processes visible in the cyclic voltammetry experiment can be reversed, giving rise to the additional plateau during the rate tests. This process also seemed to be highly affected by the cycling rate, as it was already severely polarized even below 1 C (Fig. 4b and 5f).
Rate tests were also performed on symmetrical bismuth cells (Fig. 5). In the symmetrical cell the rate performance was significantly improved compared to the full-cell. Moreover, there was also less capacity fading compared to the full-cell. The mass-loading of bismuth was even higher in the symmetrical cell (∼8 mg cm−2), than in the full cell (∼6 mg cm−2). It might therefore be tempting to attribute the poor performance to the cathode. Yet, three-electrode experiments revealed a different picture.
In the symmetrical cells the rate performance was significantly improved compared to the full-cell (see Fig. 5). There was also less capacity fading in symmetric cells compared to the full-cell. The mass-loading of bismuth was even higher in the symmetrical cell (∼8 mg cm−2), than in the full cell (∼6 mg cm−2). It might therefore be tempting to attribute the poor performance to the cathode. Yet, three-electrode experiments revealed a different picture, as discussed below.
The rate test using three-electrodes indicated that the polarization was quite severe on the bismuth anode, especially during desodiation (Fig. 6f). This could be explained by that sodium ions slowly diffuse into the core of bismuth particle due to the concentration gradient of sodium from the surface to the core of bismuth.22 The desodiation of those sodium ions from the core of bismuth particles will consequently become an issue at high rates. This polarization was prominent already at 0.4 C, which was in line with the full-cell rate-test. In contrast, the Prussian white electrode was significantly less polarized compared to the bismuth electrode, both during charging and discharging (Fig. 6c and d). This may partly be due to the over-capacity on the cathode. Still, a lower polarization on the cathode would be expected based on diffusion data reported in literatures. Ojwang et al. have concluded that the diffusion coefficient of sodium in Prussian white is 7.3 × 10⁻¹² cm2 s−1.23 This value was recorded on the desodiated material, and the diffusion coefficient might change as the sodium content is increased. However, Hu et al.24 have measured the average diffusion coefficient as the sodium content was varied in a Prussian blue analogue similar to the Prussian white used in the present work. They found that the average sodium diffusion coefficient was 1.4 × 10⁻¹² cm2 s−1. For bismuth, Wang et al.25 reported that sodium diffusion coefficient is between 6.6 × 10⁻¹² and 7.4 × 10⁻¹⁴ cm2 s−1 spread over different sodium concentrations. This give an average diffusion coefficient of 3 × 10⁻¹³ cm2 s−1 for Na diffusion in bismuth particles, therefore, sodium is expected to diffuse approximately ten times faster for a given concentration gradient in Prussian white compared to bismuth.
One key difference between cycling Prussian white against bismuth and cycling bismuth in a symmetrical cell was the absence of the additional redox reaction in the symmetrical cells (Fig. 5b). This difference seemingly had a large impact on both polarization and retention. Interestingly, the magnitude of the polarization in the three-electrode cell (Fig. 6f) seemed to be more dependent on the sodium content or the state of the charge, rather than on which electrochemical reaction with sodium that took place, i.e. Reaction (1) or (2). This might indicate that the polarization is connected to a resistance increase due to the particle contact during desodiation. Moreover, additional cycling of an oxide layer as well as trapping of Na into the core of bismuth particles could likely amplify such a resistance increase.
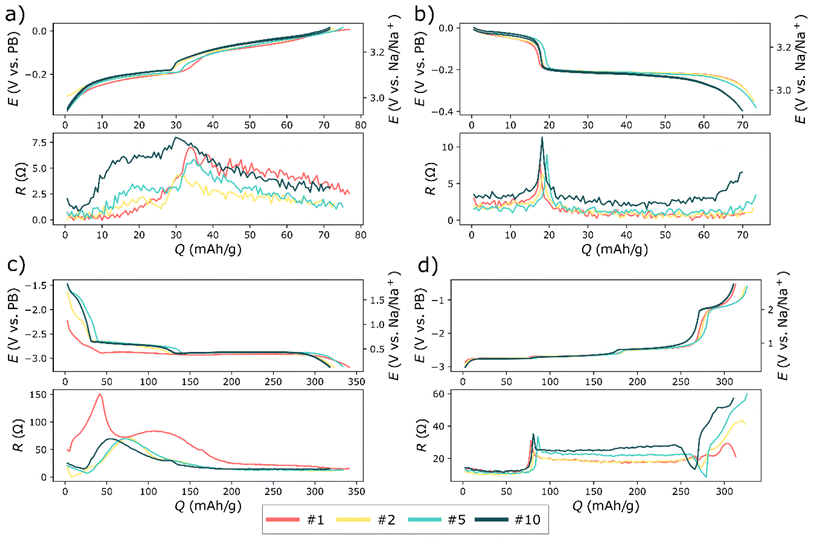
The resistance was measured in a three-electrode cell using the intermittent current interruption (ICI) method (Fig. 7).26 This revealed bismuth has a significantly lower resistance than hard carbon electrodes,5,27 despite the relatively high mass-loading of the bismuth anode. There was also a clear connection between the polarization during the rate test, with the resistances expressed within the corresponding regions since there is a clear increase of resistance at capacities about 75 mAh g−1, see Fig. 6f and 7d. This sharp increase in resistance on the anode at about 75 mAh g−1 corresponds almost half-desodiated Na3Bi via the reverse reaction (2). Furthermore, the resistive region between 75 and 250 mAh g−1 supposedly spanned both the reverse reaction for reaction (1) and (2) for desodiation of Na3Bi and NaBi. This resistance slightly increased as cycling progressed, which further indicates that the resistance increase may be connected to the contraction of the material as sodium is removed. Moreover, scanning electron microscopy images showed that bismuth particles seemed to become more porous as cycling progressed (see Fig. S2†). This is in line with previous literature on bismuth electrodes using the same formulation for the same electrolyte solution.11 In summary, resistance measurements indicated that it was indeed the bismuth that was limiting the rate in the rate test. Moreover, a comparison of full-cells with different bismuth mass loadings (Table S4†) strongly indicate that the mass loading strongly influences the rate performance of the full-cells.
Conclusion
The electrochemical performance of high mass loading bismuth electrode for use in full-cell sodium-ion batteries is demonstrated here. Glyme-based electrolyte solutions were the only electrolytes that could enable stable cycling out of the tested electrolyte solutions. Yet, the cyclic voltammetry experiment indicated that even the diglyme based electrolyte solution continuously underwent side reactions at low potentials. The cyclic voltammetry experiment also indicated that Bismuth oxide on the surface of bismuth particles is reduced during the first charging. Considering the relatively high mass-loading of the bismuth anodes, the investigated full-cells displayed a fair rate capability. Bismuth may be less resistive during sodiation than what has been shown in literature for hard carbon, but the issue of compatibility with different electrolyte solutions, large volume change during cycling, possible formation of surface oxides, and also slow diffusion of sodium ions to the core of bismuth particles make the material challenging for high-rate cells. However, high mass loading bismuth electrodes can be cycled at a moderate rate (2 C) when used with the glyme-based electrolyte solution, and if the electrode is oxides to maximum 1.5 V.Author contributions
All authors (R. Y., S. C, T. N., and Y. L.) contributed to the planning and writing of the article. S. C. T. N., and Y. L. prepared electrolyte solution and coatings. T. N. and Y. L. assembled the cells and performed the electrochemical experiments. S. C. performed the analysis of the cyclic voltammetry and ICI data.Conflicts of interest
Prussian white powder used for full-cells in this study is a commercial product provided by ALTRIS AB, a company founded by R. Y. as a spin-off from Uppsala University. The other authors in this paper declare to have no competing interests.Acknowledgements
The authors acknowledge financial contributions from the Swedish Energy Agency via grant no. 48198-1 and STandUP for Energy, from ÅForsk Foundation via grant no. 20-675, and from EU project SIMBA (Sodium-Ion and Sodium Metal Batteries for Efficient and Sustainable Next-generation Energy Storage) a European Union H2020 research and innovation programme under Grant agreement No 963542. We also would like to thank Dickson Ojwang, Wessel Van Ekeren, and Guiomar Hernandez for their assistance with acquiring the SEM images.References
- D. Saritha, C. H. Sandeep and R. Sujithra, Current advancement on anode materials for Na-ion batteries: Review, Mater. Today: Proc., 2022, 62, 3022–3026, DOI:10.1016/j.matpr.2022.03.068.
- S. Komaba, W. Murata and T. Ishikawa, et al. Electrochemical Na Insertion and Solid Electrolyte Interphase for Hard-Carbon Electrodes and Application to Na-Ion Batteries, Adv. Funct. Mater., 2011, 21(20), 3859–3867, DOI:10.1002/adfm.201100854.
- D. A. Stevens and J. R. Dahn, High Capacity Anode Materials for Rechargeable Sodium-Ion Batteries, J. Electrochem. Soc., 2000, 147(4), 1271, DOI:10.1149/1.1393348.
- H. D. Asfaw, R. Gond, A. Kotronia, C. W. Tai and R. Younesi, Bio-derived hard carbon nanosheets with high rate sodium-ion storage characteristics, Sustainable Mater. Technol., 2022, 32, e00407, DOI:10.1016/j.susmat.2022.e00407.
- R. Mogensen, S. Colbin and R. Younesi, An Attempt to Formulate Non-Carbonate Electrolytes for Sodium-Ion Batteries, Batteries Supercaps, 2021, 4(5), 791–814, DOI:10.1002/batt.202000252.
- J. Hedman, R. Mogensen, R. Younesi and F. Björefors, Fiber Optic Sensors for Detection of Sodium Plating in Sodium-Ion Batteries, ACS Appl. Energy Mater., 2022, 5(5), 6219–6227, DOI:10.1021/acsaem.2c00595.
- H. Zhang, I. Hasa and S. Passerini, Beyond Insertion for Na-Ion Batteries: Nanostructured Alloying and Conversion Anode Materials, Adv. Energy Mater., 2018, 1702582, DOI:10.1002/aenm.201702582.
- R. Le Ruyet, J. Kullgren, A. J. Naylor and R. Younesi, Electrochemical Sodiation and Desodiation of Gallium, J. Electrochem. Soc., 2022, 169(6), 60525, DOI:10.1149/1945-7111/ac766b.
- R. Mogensen, J. Maibach, A. J. Naylor and R. Younesi, Capacity fading mechanism of tin phosphide anodes in sodium-ion batteries, Dalton Trans., 2018, 47(31), 10752–10758, 10.1039/C8DT01068D.
- S. M. Zheng, Y. R. Tian and Y. X. Liu, et al. Alloy anodes for sodium-ion batteries, Rare Met., 2021, 40(2), 272–289, DOI:10.1007/s12598-020-01605-z.
- C. Wang, L. Wang, F. Li, F. Cheng and J. Chen, Bulk Bismuth as a High–Capacity and Ultralong Cycle–Life Anode for Sodium–Ion Batteries by Coupling with Glyme–Based Electrolytes, Adv. Mater., 2017, 29(35), 1702212, DOI:10.1002/adma.201702212.
- L. Wang, C. Wang, F. Li, F. Cheng and J. Chen, In situ synthesis of Bi nanoflakes on Ni foam for sodium-ion batteries, Chem. Commun., 2017, 54(1), 38–41, 10.1039/c7cc08341f.
- P. Xiong, P. Bai and A. Li, et al. Bismuth Nanoparticle@Carbon Composite Anodes for Ultralong Cycle Life and High–Rate Sodium–Ion Batteries, Adv. Mater., 2019, 31(48), 1904771, DOI:10.1002/adma.201904771.
- H. Yang, L. W. Chen and F. He, et al. Optimizing the Void Size of Yolk–Shell Bi@Void@C Nanospheres for High-Power-Density Sodium-Ion Batteries, Nano Lett., 2020, 20(1), 758–767, DOI:10.1021/acs.nanolett.9b04829.
- M. Goktas, C. Bolli and E. J. Berg, et al. Graphite as Cointercalation Electrode for Sodium-Ion Batteries: Electrode Dynamics and the Missing Solid Electrolyte Interphase (SEI), Adv. Energy Mater., 2018, 8(16), 1702724, DOI:10.1002/aenm.201702724.
- H. Gao, W. Ma and W. Yang, et al. Sodium storage mechanisms of bismuth in sodium ion batteries: An operando X-ray diffraction study, J. Power Sources, 2018, 379, 1–9, DOI:10.1016/j.jpowsour.2018.01.017.
- Y. Tesfamhret, M. Carboni, H. D. Asfaw, J. Kullgren and R. Younesi, Revealing capacity fading in Sb-based anodes using symmetric sodium-ion cells, J. Phys. Mater., 2021, 4(2), 024007, DOI:10.1088/2515-7639/abebe9.
- V. G. Alessio, B. Long and F. Gity, et al. Oxide removal and stabilization of bismuth thin films through chemically bound thiol layers, RSC Adv., 2018, 8(58), 33368–33373, 10.1039/C8RA06840B.
- A. Blackman, L. R. Gahan, G. H. Aylward and T. J. V. Findlay, Aylward and Findlay’s SI Chemical Data, John Wiley & Sons, Inc., 7th edn, 2014 Search PubMed.
- W. Zuo, W. Zhu and D. Zhao, et al. Bismuth oxide: A versatile high-capacity electrode material for rechargeable aqueous metal-ion batteries, Energy Environ Sci., 2016, 9(9), 2881–2891, 10.1039/c6ee01871h.
- Y. E. Zhu, L. Yang, X. Zhou, F. Li, J. Wei and Z. Zhou, Boosting the rate capability of hard carbon with an ether-based electrolyte for sodium ion batteries, J. Mater. Chem. A, 2017, 5(20), 9528–9532, 10.1039/c7ta02515g.
- D. Rehnlund, F. Lindgren and S. Böhme, et al. Lithium trapping in alloy forming electrodes and current collectors for lithium based batteries, Energy Environ. Sci., 2017, 10(6), 1350–1357, 10.1039/C7EE00244K.
- D. O. Ojwang, L. Häggström, T. Ericsson, R. Mogensen and W. R. Brant, Guest water hinders sodium-ion diffusion in low-defect Berlin green cathode material, Dalton Trans., 2022, 51, 14712–14720, 10.1039/D2DT02384A.
- H. Hu, W. Liu and M. Zhu, et al. Yolk-shell Prussian blue nanoparticles with fast ion diffusion for sodium-ion battery, Mater. Lett., 2019, 249, 206–209, DOI:10.1016/j.matlet.2019.04.102.
- C. Wang, D. Du, M. Song, Y. Wang and F. Li, A High–Power Na 3 V 2 (PO 4) 3 –Bi Sodium–Ion Full Battery in a Wide Temperature Range, Adv. Energy Mater., 2019, 9(16), 1900022, DOI:10.1002/aenm.201900022.
- M. J. Lacey, Influence of the Electrolyte on the Internal Resistance of Lithium−Sulfur Batteries Studied with an Intermittent Current Interruption Method, ChemElectroChem, 2017, 4(8), 1997–2004, DOI:10.1002/celc.201700129.
- L. O. S. Colbin, R. Mogensen and A. Buckel, et al. A Halogen-Free and Flame-Retardant Sodium Electrolyte Compatible with Hard Carbon Anodes, Adv. Mater. Interfaces, 2021, 8(23), 2101135, DOI:10.1002/admi.202101135.
Footnote |
| † Electronic supplementary information (ESI) available. See DOI: https://doi.org/10.1039/d2dt02686d |
| This journal is © The Royal Society of Chemistry 2022 |

