 Open Access Article
Creative Commons Attribution 3.0 Unported Licence
A fluorescent probe strategy for the detection and discrimination of hydrogen peroxide and peroxynitrite in cells†
Hannah R.
Bolland
a,
Ester M.
Hammond
a and
Adam C.
Sedgwick
 *b
*b
aOxford Institute for Radiation Oncology, Department of Oncology, University of Oxford, Old Road Campus Research Building, Oxford, OX3 7DQ, UK
bChemistry Research Laboratory, University of Oxford, Mansfield Road, OX1 3TA, UK. E-mail: adam.sedgwick@chem.ox.ac.uk
First published on 30th August 2022
Abstract
Aryl boronate fluorescent probes allow the non-invasive study of dynamic cellular processes involving the reactive species, hydrogen peroxide (H2O2) and peroxynitrite (ONOO−). However, the ability of these probes to differentiate between these two species remains unclear. Here, we report a boronate-functionalised hemicyanine dye (HD-BPin) as a potential strategy to distinguish between H2O2 at 704 nm (red channel) and ONOO− at 460 nm (blue channel) in solution and in cells. This work also highlights the choice of fluorophore before boronate functionalization can dictate the observed selectivity between these two species.
Hydrogen peroxide (H2O2) and peroxynitrite (ONOO−) are reactive oxygen (ROS) and reactive nitrogen species (RNS) found within living systems.1 Both species have been identified as key signaling molecules that regulate a variety of cellular processes, ranging from cell growth, differentiation, migration, and programmed cell death.2–4 These chemical biomarkers also act as a source of oxidative and nitrosative stress, in which aberrant concentrations lead to the irreversible modification of important biomolecules such as proteins, enzyme, lipids, and DNA.2,5 The results of these pathological effects are linked to several diseases including cancer, cardiovascular disease, and neurodegenerative disease.6,7 For these reasons, extensive efforts have been devoted to developing methods that can provide detailed information on these species in biological settings.8 However, at present the specific identification of these individual RNS and ROS has proved challenging. Here, we report the fluorescent probe HD-BPin as a potential strategy for the detection of H2O2 (704 nm) and ONOO− (460 nm) in aqueous solution and cells. The key feature of this strategy is that it takes advantage of differences in kinetic reactivity and emission wavelengths to signal the presence of each species.
Small-molecule fluorescent probes have emerged as powerful chemical tools that allow the non-invasive and real-time imaging of cellular processes and biological species.9 Pioneering work by the groups of Chang, Czarnik, Shabat, Lippard, and Tsien, among many others, exploited various aspects of molecular recognition and synthetic methodology to develop a suite of fluorescent probes with high level of specificity for various biological species, including ROS/RNS, biomolecules, and metal ions.9,10 However, as the field has grown, it has become apparent that these first- and second-generation systems built off various fluorescent scaffolds (e.g., coumarin, xanthene, and BODIPY) have limitations.11 For example, a first-generation H2O2-responsive fluorescent probe, peroxyresorufin-1 (PR1), has recently been reported to respond to ONOO−.12,13 This observed reactivity is due to the faster reaction kinetics of ONOO− compared to H2O2 for aryl boronates.14 As a result, this functionality is now being increasingly used for the selective detection of ONOO−.14–16 However, with H2O2-selective aryl boronate probes still being reported,17 we rationalized that the choice of fluorescent scaffold may play a role in dictating selectivity between H2O2 and ONOO− and therefore, we believed a strategy to distinguish these two species could be potentially identified. This study was undertaken in an effort to test this hypothesis.
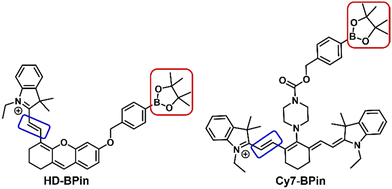
Cyanine (Cy) and hemicyanine (HD)-based fluorophores have found extensive use in the design of fluorescent-based and photoacoustic-based chemical sensors.18–20 Many of these reported systems employ the boronate functionality to detect H2O2in vitro and in vivo.21–23 This observed H2O2 selectivity is unexpected due to the greater reactivity of ONOO− for aryl boronates.14 Previous studies suggest that ONOO− reacts via the oxidative cleavage of the methine bridges (Fig. 1 – blue box) rather than the expected boronate oxidation (Fig. 1 – red box).24,25 We thus hypothesized boronate-based Cy- or HD-probes may provide the ability to discriminate between H2O2 and ONOO−. To test this hypothesis, we synthesized and evaluated two boronate-based fluorescent probes, HD-BPin and Cy7-BPin (Fig. 1) – see supporting information for synthetic procedures (ESI,† Scheme S1 and S2).
 | ||
| Fig. 1 Chemical structures of HD-BPin and Cy7-BPin. Red box highlights H2O2 and ONOO− reactive aryl boronate motif. Blue box highlights ONOO− reactive methine bridge. | ||
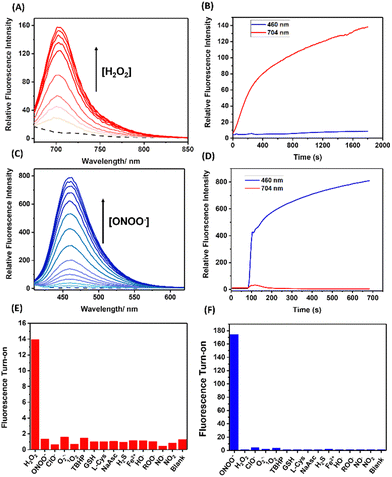
With HD-BPin and Cy7-BPin (Fig. 1) in hand, we first tested the response of each probe to H2O2 and ONOO− in aqueous solution (PBS buffer, pH 7.2). As expected, the addition of H2O2 resulted in increases in the intensity of the near-infrared (NIR) fluorescence features (red emission) at 704 nm and 780 nm for HD-BPin and Cy7-BPin, respectively (Fig. 2A and ESI,† Fig. S1).7,8 These observations are consistent with previous reports (see ESI,† Schemes S3 and S4 for proposed reaction mechanisms).21,22,26 Changes in the absorption profiles of HD-BPin and Cy7-BPin were also seen (ESI,† Fig. S2 and S3). In contrast, the addition of ONOO− (100 μM) to Cy7-BPin resulted in a dramatic change to its NIR absorption with a significant decrease at 750 nm and an appearance of a new absorption peak at ∼525 nm. Unfortunately, no new fluorescent species were observed, which suggests degradation of the cyanine dye scaffold (ESI,† Fig. S4 and S5). Because of this, it was no longer a focus for the rest of the study. With the addition of ONOO− (100 μM) to HD-BPin, an immediate color change from blue to colorless was observed (ESI,† Fig. S6). This color change was also accompanied by a rapid increase in blue fluorescence emission intensity at 460 nm (λex = 360 nm, ESI,† Fig. S7), which is consistent with the ONOO−-mediated formation of a blue fluorescent xanthene dye24,27 – see ESI† for proposed reaction mechanism (ESI,† Scheme S5). Combined with previous reports on aryl boronate fluorescent probes (e.g., PR1 and peroxyorange-128 (ESI,† Fig. S8 and S9)), this data shows the choice of fluorophore when designing a probe has potential to dictate the observed selectivity between H2O2 and ONOO−.
Next, we turned our attention to the evaluation of the dual-wavelength response of HD-BPin as a potential strategy for distinguishing H2O2 and ONOO− in solution and in cells. Increasing H2O2 concentrations (0–450 μM) resulted in a dose-dependent increase at 704 nm with a calculated limit of detection (LOD) = 2.10 μM (Fig. 2A and ESI,† Fig. S10 and S11). Oxidation of the boronate functionality affording the red emissive species was confirmed by mass spectrometry (ESI,† Fig. S12). These responses required incubation times of >30 mins and an overall >20-fold change in red fluorescence emission intensity was observed (Fig. 2B and ESI,† Fig. S13). To our satisfaction, minimal changes in blue fluorescence emission intensity were observed, even at high H2O2 concentrations (i.e., 200 and 400 μM) (ESI,† Fig. S14–S16).
In contrast, the addition of ONOO− (0–140 μM) resulted in a significant increase in fluorescence intensity at 460 nm with a calculated LOD = 0.28 μM (Fig. 2C and ESI,† Fig. S17). These ONOO− induced responses required less than 30 s and an overall ∼200-fold increase in blue fluorescence was observed (Fig. 2D). At low ONOO− concentrations (0–15 μM), an initial increase in blue and red emission intensity was observed. However, when ONOO− concentrations exceeded >10 μM, the fluorescence emission intensity at 704 nm decreased while the blue emission continued to increase in intensity (ESI,† Fig. S18 and S19). This observation suggests a stepwise deprotection mechanism, in which boronate oxidation is favored before the oxidation of the methine bridge (ESI,† Scheme S6). This potential stepwise mechanism is supported by the sigmoidal curve seen in titration experiments and mass spectroscopic analysis identifying the presence of both red and blue emissive species (ESI,† Fig. S21–S24). Although this increase in red emission was unexpected, this turn on response can be readily differentiated from H2O2 due to the simultaneous increase in blue emission intensity at 460 nm. Together, these results demonstrate that HD-BPin can differentiate between H2O2 and ONOO− responses in solution through differences in kinetics (ONOO− (seconds) and H2O2 (minutes)) and differences in emission intensities at 704 nm and 460 nm. Before evaluating this strategy in cell studies, a selectivity assay was carried out against other ROS/RNS, reductants and thiols. As seen in Fig. 2E and F, excellent selectivity was observed for H2O2 at 704 nm and for ONOO− at 460 nm (Fig. 2E and F).
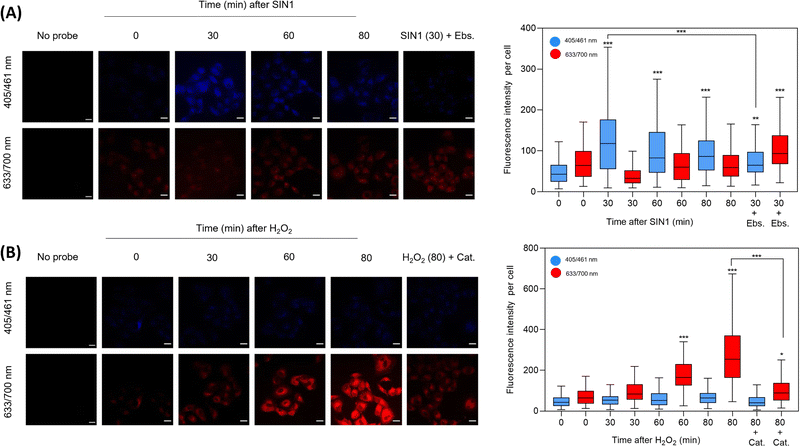
Incubation of HD-BPin in A549 cells was shown not to impact cell viability (ESI,† Fig. S25). Subsequently, we evaluated the fluorescence response of HD-BPin in A549 cells via fixed cell imaging with the exogenous addition of H2O2 and SIN-129 (ONOO− donor). SIN1 (500 μM) treatment led to an increase in blue fluorescence with its maximum intensity at 30 minutes (2.5-fold increase compared to time zero, Fig. 3A). No significant changes in red emission were observed over the measured time points (0–80 mins). Although a slight decrease in blue fluorescence emission can be observed after the optimal 30 min timepoint, the overall fluorescence emission intensity still differs in a statistically significant manner from untreated cells incubated with HD-BPin only. H2O2 treatment (100 μM) resulted in an expected time-dependent increase with an overall 8.6-fold increase in red fluorescence emission after 80 mins (Fig. 3B). Consistent with solution data, minimal changes in emission intensity were seen in the blue emission channel. Scavengers, ebselen (Ebs., ONOO− scavenger) and catalase (Cat., H2O2 scavenger) confirmed the specificity of each observed signal (Fig. 3A and B). Similar trends were observed for HD-BPin when tested in H460 and HCT116 cell lines (ESI,† Fig. S26 and S27). Since 1–3% of SIN1 concentration is reported to form peroxynitrite,30 we wanted to test the response of HD-BPin to various SIN1 and H2O2 concentrations. As shown in Fig. S28 (ESI†), increasing SIN1 concentrations (0–1500 μM) resulted in an initial increase in both blue and red emission intensity followed by a further increase in blue emission with a concomitant decrease in emission in the red channel, reflecting the obtained cuvette data. Whereas, increasing H2O2 concentrations (0–300 μM, 80 min incubation) led to a dose-dependent increase in the red channel with minimal increases in blue emission (ESI,† Fig. S29). It is important to note at low H2O2 and ONOO− concentrations differences between blue and red emission are less substantial and therefore one should take caution during cell analysis.
To demonstrate the potential utility of this strategy, HD-BPin was evaluated in A549 cells treated with known ROS inducers, which include cisplatin, menadione and antimycin A.31,32 Current literature reports suggest H2O2 contributes to cisplatin-mediated cell death.33 Interestingly, as seen in Fig. S30 and S31 (ESI†), the obtained images suggest an increase in ONOO− production as time progressed in A459 cells treated with cisplatin (15 μM). Exogenous addition of Cat. (H2O2) and Ebs. (ONOO−) resulted in decreases in the respect red and blue emission suggesting presence of both H2O2 and ONOO−. PO1 was used as a comparison (ESI,† Fig. S32). A549 cells treated with menadione and antimycin A showed a dose-dependent increase in red emission with little changes seen in the blue emission channel (ESI,† Fig. S33 and S34). This observation suggests a sole increase in intracellular H2O2. These image profiles shows this present strategy has the potential to provide greater molecular insight and overcome the limitations of current commercially available aryl boronate fluorescent probes (e.g., PO1).
In summary, this report demonstrates the fluorescent probe HD-BPin as a potential strategy to distinguish between H2O2 and ONOO− in solution and in cells. Differences in kinetics and resultant emission intensities successfully enables the ability to distinguish between a H2O2 induced response and ONOO− induced response. However, at low ONOO− and H2O2 concentrations, the user should take caution when evaluating differences in both red and blue channels in cells. We anticipate this report to be a useful guide for the development of future ROS/RNS fluorescent probes when using the aryl boronate motif.
ACS would like to thank the Glasstone Research fellowship (University of Oxford) and the major research grant from Jesus College Oxford for financial support. ACS would like to acknowledge the support of Professor Stuart Conway and Professor Stephen Faulkner. HB and EMH thank the EPSRC for the support of programme grant EP/S019901/1.
Conflicts of interest
There are no conflicts of interests to declare.References
- E. A. Veal, A. M. Day and B. A. Morgan, Mol. Cell, 2007, 26, 1–14 CrossRef CAS PubMed.
- H. Sies, Redox Biol., 2017, 11, 613–619 CrossRef CAS PubMed.
- P. Pacher, J. S. Beckman and L. Liaudet, Physiol. Rev., 2007, 87, 315–424 CrossRef CAS PubMed.
- C. Szabó, H. Ischiropoulos and R. Radi, Nat. Rev. Drug Discovery, 2007, 6, 662–680 CrossRef.
- S. Bartesaghi and R. Radi, Redox Biol., 2018, 14, 618–625 CrossRef CAS PubMed.
- M. P. Lisanti, U. E. Martinez-Outschoorn, Z. Lin, S. Pavlides, D. Whitaker-Menezes, R. G. Pestell, A. Howell and F. Sotgia, Cell Cycle, 2011, 10, 2440–2449 CrossRef CAS.
- E. Gochman, J. Mahajna and A. Z. Reznick, Anticancer Res., 2011, 31, 1607–1617 CAS.
- Y. Zhang, M. Dai and Z. Yuan, Anal. Methods, 2018, 10, 4625–4638 RSC.
- D. Wu, A. C. Sedgwick, T. Gunnlaugsson, E. U. Akkaya, J. Yoon and T. D. James, Chem. Soc. Rev., 2017, 46, 7105–7123 RSC.
- K. J. Bruemmer, S. W. M. Crossley and C. J. Chang, Angew. Chem., Int. Ed., 2020, 59, 13734–13762 CrossRef CAS PubMed.
- J. Chan, S. C. Dodani and C. J. Chang, Nat. Chem., 2012, 4, 973–984 CrossRef CAS PubMed.
- M. Weber, A. B. Mackenzie, S. D. Bull and T. D. James, Anal. Chem., 2018, 90, 10621–10627 CrossRef CAS PubMed.
- E. W. Miller, A. E. Albers, A. Pralle, E. Y. Isacoff and C. J. Chang, J. Am. Chem. Soc., 2005, 127, 16652–16659 CrossRef CAS PubMed.
- A. Sikora, J. Zielonka, M. Lopez, J. Joseph and B. Kalyanaraman, Free Radical Biol. Med., 2009, 47, 1401–1407 CrossRef CAS PubMed.
- N. Rios, L. Piacenza, M. Trujillo, A. Martinez, V. Demicheli, C. Prolo, M. N. Alvarez, G. V. Lopez and R. Radi, Free Radical Biol. Med., 2016, 101, 284–295 CrossRef CAS PubMed.
- J. Zielonka, A. Sikora, J. Joseph and B. Kalyanaraman, J. Biol. Chem., 2010, 285, 14210–14216 CrossRef CAS.
- J. Hou, M. Qian, H. Zhao, Y. Li, Y. Liao, G. Han, Z. Xu, F. Wang, Y. Song and Y. Liu, Anal. Chim. Acta, 2018, 1024, 169–176 CrossRef CAS PubMed.
- S. H. Gardner, C. J. Brady, C. Keeton, A. K. Yadav, S. C. Mallojjala, M. Y. Lucero, S. Su, Z. Yu, J. S. Hirschi, L. M. Mirica and J. Chan, Angew. Chem., Int. Ed., 2021, 60, 18860–18866 CrossRef CAS PubMed.
- Y. Tan, L. Zhang, K. H. Man, R. Peltier, G. C. Chen, H. T. Zhang, L. Y. Zhou, F. Wang, D. Ho, S. Q. Yao, Y. Hu and H. Y. Sun, ACS Appl. Mater. Interfaces, 2017, 9, 6796–6803 CrossRef CAS.
- J. Yin, Y. Kwon, D. Kim, D. Lee, G. Kim, Y. Hu, J. H. Ryu and J. Yoon, J. Am. Chem. Soc., 2014, 136, 5351–5358 CrossRef CAS.
- J. Weber, L. Bollepalli, A. M. Belenguer, M. D. Antonio, N. De Mitri, J. Joseph, S. Balasubramanian, C. A. Hunter and S. E. Bohndiek, Cancer Res., 2019, 79, 5407–5417 CrossRef CAS PubMed.
- J. Zhang, L. Shi, Z. Li, D. Li, X. Tian and C. Zhang, Analyst, 2019, 144, 3643–3648 RSC.
- Y. Hao, Z. Li, N. Ding, X. Tang and C. Zhang, Spectrochim. Acta, Part A, 2022, 268, 120642 CrossRef CAS PubMed.
- D. Y. Zhou, O. Y. Juan, Y. Li, W. L. Jiang, T. Yang, Z. M. Yi and C. Y. Li, Dyes Pigm., 2019, 161, 288–295 CrossRef CAS.
- T. Hou, K. Zhang, X. Kang, X. Guo, L. Du, X. Chen, L. Yu, J. Yue, H. Ge, Y. Liu, A. M. Asiri, K. A. Alamry, H. Yu and S. Wang, Talanta, 2019, 196, 345–351 CrossRef CAS.
- A. Sagi, R. Weinstain, N. Karton and D. Shabat, J. Am. Chem. Soc., 2008, 130, 5434 CrossRef CAS PubMed.
- L. L. Wu, J. H. Liu, X. Tian, R. R. Groleau, S. D. Bull, P. Li, B. Tang and T. D. James, Chem. Sci., 2021, 12, 3921–3928 RSC.
- B. C. Dickinson, C. Huynh and C. J. Chang, J. Am. Chem. Soc., 2010, 132, 5906–5915 CrossRef CAS PubMed.
- I. M. Bonilla, A. Sridhar, Y. Nishijima, S. Gyorke, A. J. Cardounel and C. A. Carnes, J. Cardiovasc. Pharmacol., 2013, 61, 401–407 CrossRef CAS PubMed.
- F. J. Martin-Romero, Y. Gutierrez-Martin, F. Henao and C. Gutierrez-Merino, J. Fluoresc., 2004, 14, 17–23 CrossRef CAS.
- G. Loor, J. Kondapalli, J. M. Schriewer, N. S. Chandel, T. L. Vanden Hoek and P. T. Schumacker, Free Radical Biol. Med., 2010, 49, 1925–1936 CrossRef CAS PubMed.
- W. H. Park, Y. W. Han, S. H. Kim and S. Z. Kim, J. Cell. Biochem., 2007, 102, 98–109 CrossRef CAS PubMed.
- Y. I. Chirino and J. Pedraza-Chaverri, Exp. Toxicol. Pathol., 2009, 61, 223–242 CrossRef CAS PubMed.
Footnote |
| † Electronic supplementary information (ESI) available. See DOI: https://doi.org/10.1039/d2cc03406a |
| This journal is © The Royal Society of Chemistry 2022 |


