 Open Access Article
Creative Commons Attribution 3.0 Unported Licence
An endoplasmic reticulum targeting green fluorescent protein chromophore-based probe for the detection of viscosity†
Xiaoqin
Wei‡
 a,
Yiming
Zhu‡
a,
Xiang
Yu
a,
Lei
Cai
a,
Nanan
Ruan
a,
Luling
Wu
a,
Yiming
Zhu‡
a,
Xiang
Yu
a,
Lei
Cai
a,
Nanan
Ruan
a,
Luling
Wu
 *ab,
Nengqin
Jia
 a,
Tony D.
James
 *bc and
Chusen
Huang
 *a
*a
aThe Education Ministry Key Laboratory of Resource Chemistry, Shanghai Key Laboratory of Rare Earth Functional Materials, and Shanghai Frontiers Science Research Base of Biomimetic Catalysis, Department of Chemistry, Shanghai Normal University, 100 Guilin Road, Shanghai 200234, China. E-mail: huangcs@shnu.edu.cn
bDepartment of Chemistry, University of Bath, BA2 7AY, UK. E-mail: wllcyl@126.com; T.D.James@bath.ac.uk
cSchool of Chemistry and Chemical Engineering, Henan Normal University, Xinxiang 453007, China
First published on 9th August 2022
Abstract
The occurrence of endoplasmic reticulum (ER) stress is the main cause of a variety of biological processes that are closely related to numerous diseases. The homeostasis of the ER microenvironment can be disrupted under ER stress. In this research, by linking a pentafluorophenyl to the green fluorescent protein chromophore, we have developed a new ER-targeting fluorescent probe (GE-Y) for measuring changes of intracellular ER viscosity caused by ER stress. Importantly, an increase in ER viscosity was observed using GE-Y in cells undergoing autophagy. As such, our research provides an ideal tool for studying ER stress and autophagy.
Green fluorescent protein (GFP), a luminescent protein discovered from the jellyfish Aequorea victoria in 1962, is widely used in protein localization, gene transcription regulation and cytoskeleton research.1–3 The core chromophore of GFP, p-hydroxybenzylidene imidazolidinone (HBDI), is non-fluorescent in solution due to the rotation of the excited state of the double bond between the phenyl and imidazolidinone.4 In order to expand the applications of the GFP chromophore, two strategies have been developed: (1) restriction of the free rotation through formation of host–guest complexes, such as interaction with β-cyclodextrin,5 MOFs,6 and host proteins,7 (2) enhancement of the intrinsic torsional barrier for the chromophore by the introduction of substituents.8,9 Significantly, the GFP chromophore has not been extensively explored for the design of fluorescent probes suitable for the mapping of cellular viscosity until recently when our group reported on a HBDI-based fluorescent probe to detect the viscosity of lysosomes in live cells.10,11
The endoplasmic reticulum (ER) is a significant multi-functional organelle in eukaryotic cells and is responsible for the synthesis and metabolism of lipids and steroids, maintenance of Ca2+ homeostasis, protein synthesis, folding and post-translational modification.12 However, some external factors such as infection,13 hypoxia,14 and inflammation15 can disrupt protein folding. Consequently, the accumulation of unfolded or misfolded proteins within the ER may influence the normal physiological functions of the organelle, which can trigger an imbalance in homeostasis within the ER and as such induce ER stress. ER stress plays a key role in protecting cells by initiating the unfolded protein response to eliminate misfolded proteins. While ER stress can also induce autophagy when it persists for a long time. Studies have shown that the coexistence of ER stress and autophagy are closely related to cardiovascular disease, senile dementia, diabetes, and cancer.16,17
As an important intracellular parameter, intracellular viscosity plays an important role in material transfer, information transmission and the interaction of biological macromolecules.18 It has been reported that during ER stress, protein accumulation in the ER cavity will inevitably lead to changes of viscosity. To date, changes of viscosity during ER stress remain poorly understood, which is the result of a lack of tools for the measurement of ER viscosity in situ.
Traditional instruments for measuring viscosity include the rotational,19 falling ball20 and capillary21 viscometers which are not suitable for intracellular measurements. However, over the past few years, microscopic viscosity detection technologies including optical tweezers,22 fluorescence imaging,23 and rotational Brownian motion of microbeads24 have been developed. Among these methods, fluorescence molecular imaging, which exhibits high selectivity, is noninvasive, and facilitates direct visualization and in situ detection, has become a powerful tool and attracted significant attention. To date, researchers have developed a variety of small-molecule organic rotors for monitoring the viscosity of cells.23,25 In addition, subcellular organelle targeting viscosity-responsive probes have also been reported. However, most subcellular organelle targeting probes have focused on viscosity detection in the mitochondria26–28 and lysosomes,29–32 while few systems have been developed for monitoring the viscosity of the ER.33–37 Fluorescent probes that have been developed for ER viscosity have been based on BODIPY,33,34,37 hemicyanine36 and iridium complex35 molecular rotors (Scheme S2, ESI†).
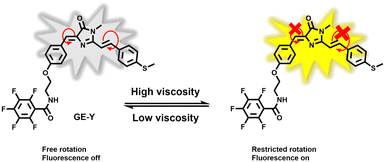
In this research, we have developed a fluorescent probe GE-Y for monitoring changes of viscosity in the ER of living cells. The GFP chromophore HBDI was used as the fluorophore. A methyl phenyl sulfide was connected to the imidazolinone ring through an ethylenic bond to enlarge the conjugated π-system of the probe for the purpose of red-shifting the emission wavelength (Scheme 1). In addition, pentafluorobenzene was attached to the hydroxyl of the aryl group and serves as a targeting group for the ER. In a low-viscosity environment, free rotation of the benzyl group and the C![[double bond, length as m-dash]](https://www.rsc.org/images/entities/char_e001.gif) C double bonds between the imidazolinone and the phenylthio group cause the energy of the excited state to be lost in a non-radiative manner, resulting in a low fluorescence quantum yield of the probe. However, in an environment of high viscosity, free rotation is inhibited, and the fluorescence emission of the probe is significantly enhanced.
C double bonds between the imidazolinone and the phenylthio group cause the energy of the excited state to be lost in a non-radiative manner, resulting in a low fluorescence quantum yield of the probe. However, in an environment of high viscosity, free rotation is inhibited, and the fluorescence emission of the probe is significantly enhanced.
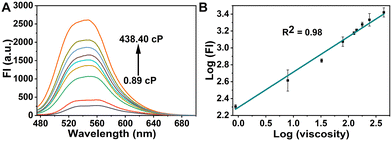
To explore the optical properties of the probe GE-Y, the UV-Vis absorption and fluorescence emission spectra in PBS buffer (10 mM, pH 7.4) and glycerin were evaluated. As shown in Fig. S1A (ESI†), the absorption peak of GE-Y is located at 430 nm both in PBS buffer and in glycerin. However, the intensity of absorption in glycerin is higher than that in PBS buffer. GE-Y exhibits negligible fluorescence emission in PBS buffer, which can be attributed to the low viscosity of PBS buffer. In contrast, in glycerin with high viscosity a dramatic fluorescence off–on response is observed (Fig. S1B, ESI†). The emission enhancement can be attributed to restricted rotation in the high viscosity system. In addition, we investigated the fluorescence response of GE-Y towards increasing viscosity using a binary system of PBS/glycerin of different viscosity. As shown in Fig. 1A, the fluorescence intensity increases gradually with an increase of viscosity, with an approximate 10-fold enhancement in fluorescence intensity being observed on an increase of viscosity from 0.89 cP to 438.4 cP, suggesting that GE-Y is particularly sensitive towards changes of viscosity. In accordance with the Förster and Hoffmann equation,38 there is a good linear relationship between log![[thin space (1/6-em)]](https://www.rsc.org/images/entities/char_2009.gif) (FI) and log
(FI) and log![[thin space (1/6-em)]](https://www.rsc.org/images/entities/char_2009.gif) (viscosity) at 550 nm (R2 = 0.98) (Fig. 1B). Moreover, we evaluated the fluorescence quantum yield (Φ) of the probe in low viscosity (0.89 cP) and high viscosity (438.4 cP) environments, respectively. As shown in Fig. S2 and Table S2 (ESI†), the fluorescence quantum yield of the probe in the high viscosity environment (Φ = 0.13) was significantly increased when compared with the low viscosity (Φ = 0.01) environment. All these results indicate that GE-Y has the potential to be used as a sensitive fluorescent probe for viscosity detection.
(viscosity) at 550 nm (R2 = 0.98) (Fig. 1B). Moreover, we evaluated the fluorescence quantum yield (Φ) of the probe in low viscosity (0.89 cP) and high viscosity (438.4 cP) environments, respectively. As shown in Fig. S2 and Table S2 (ESI†), the fluorescence quantum yield of the probe in the high viscosity environment (Φ = 0.13) was significantly increased when compared with the low viscosity (Φ = 0.01) environment. All these results indicate that GE-Y has the potential to be used as a sensitive fluorescent probe for viscosity detection.
To further evaluate the enhancement in fluorescence intensity by variations of solvent polarity, the fluorescence emission spectra in different solvents were also evaluated. As expected, GE-Y shows very strong fluorescence signals in glycerin compared to in other solvents (Fig. S3, ESI†). This result suggested that polarity exhibits a negligible effect on the fluorescence off–on response of GE-Y.
Subsequently, we measured the effect of pH on the performance of GE-Y in high-viscosity (240.70 cP) and low-viscosity (7.90 cP) PBS/glycerin systems. As shown in Fig. S4 (ESI†), there are minimal changes of the maximum emission intensity of GE-Y when the pH changes from 3.32 to 10.98, illustrating that changes in pH hardly influence the probe.
Next, we evaluated the selectivity of GE-Y in the presence of various common species that may exist in living organisms. Therefore, common interfering species including cations (Fe2+, Fe3+, Mn2+, Ca2+, K+, Zn2+, Na+), anions (Br−, NO2−, SO42−, ClO−, ONOO−), and amino acids (homocysteine, cysteine, glutathione, glycine, L-threonine, L-arginine) were added to GE-Y in PBS (10 mM, pH 7.4), respectively, and none of the species induce significant fluorescence changes (Fig. S5, ESI†). We then repeated the interference assay in a high viscosity environment. As shown in Fig. S6 (ESI†), the fluorescence intensity of 10 μM GE-Y in a solution with viscosity value at 126.80 cP did not change significantly after the addition of various competing reagents (including 1 mM for ClO−, ONOO− and amino acids, 100 mM for other cations and anions). Thus, GE-Y exhibits high selectivity towards viscosity, even in the presence of high concentrations of other biological species. In addition, GE-Y was stable in the presence of ROS species including ClO− and ONOO−. All the results confirm that GE-Y is suitable for measuring the viscosity in complex biological systems.
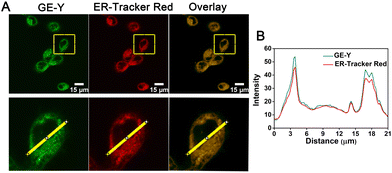
Having established a fluorescence method for the sensitive and selective detection of viscosity in solution, we then explored the use of GE-Y for tracing the viscosity changes of live cells. Initially, a standard MTT assay was conducted to assess the toxicity of different concentrations of GE-Y (0 μM, 4 μM, 8 μM, 12 μM, 16 μM, and 20 μM, respectively). From Fig. S7 (ESI†) the cell survival rate remains above 90% when the cells were incubated with probe GE-Y for 6 h. In addition, when the concentration of GE-Y is lower than 16 μM, there is no effect on the viability of the cells even if the incubation time is extended to 12 h. Therefore, we selected 10 μM GE-Y for cell imaging, for extended monitoring of viscosity changes in live cells. We then performed a colocalization experiment to verify the ER targeting capability of GE-Y. MCF-7 cells were co-stained with GE-Y (10 μM) and commercially available ER-Tracker Red (1 μM) for 20 min. The results of the colocalization experiment using a confocal laser microscope are shown in Fig. 2. The green fluorescence of GE-Y and the red fluorescence of ER-Tracker Red are significantly overlapped. (The Pearson's colocalization coefficient was 0.95.) To demonstrate the superior ER-targeting capability of GE-Y, co-localization experiments were also performed using A549 cells, HeLa cells and CHO cells. As shown in Fig. S8 (ESI†), the green and red channels overlapped well in all the cell lines, with Pearson's colocalization coefficients of 0.97 in A549 cells, 0.96 in HeLa cells and 0.98 in CHO cells, demonstrating that probe GE-Y is mainly located in the ER.
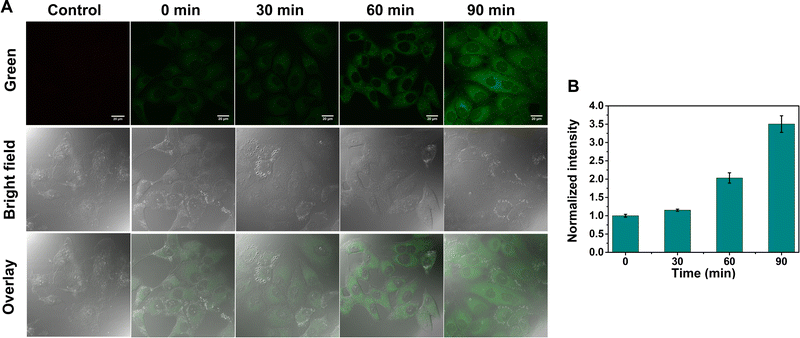
After verifying the high ER-targeting ability of GE-Y in live cells, we then used GE-Y to trace the viscosity changes under ER stress in living MCF-7 cells. Tunicamycin was used to increase the ER viscosity because it is an antibiotic that can inhibit N-glycosylation to cause an accumulation of unfolded proteins in the ER39 and induce ER stress.33 As shown in Fig. 3, the intracellular fluorescence increases gradually with an increase in incubation time (Fig. 3A). Specifically, the cells treated with tunicamycin for 90 min exhibited a remarkable fluorescence enhancement compared to the cells treated with tunicamycin for 0 min. Furthermore, a semi-quantitative analysis of the intracellular fluorescence intensity using ImageJ software indicated a 3.5-fold enhancement after the cells were treated with tunicamycin for 90 minutes. The enhancement in the intracellular fluorescence could be ascribed to an increased ER viscosity that was induced by the addition of tunicamycin. As such, GE-Y can be used as a visualization tool for measuring changes of intracellular viscosity.
Autophagy and ER stress are independent biological processes. However, a growing amount of research has indicated that there is a close relationship between ER stress and autophagy.40,41 As such, ER stress can induce autophagy and in turn, the elevated ER stress will activate autophagy to counteract the high stress on the ER by degrading accumulated misfolded proteins. However, the detailed biological interplay of mechanisms associated with ER stress and autophagy remains unclear.42 Therefore, we used probe GE-Y to monitor viscosity fluctuations in the ER during autophagy to evaluate the relationship between the two processes. There are two common methods for the induction of autophagy, one is starvation and the other is drug induced.43 As such Hanks' Balanced Salt Solution (HBSS) was used to induce autophagy of the cells through the starvation method.44 Protein light chain 3(LC3), which includes two forms LC3-I and LC3-II, is a biomarker of autophagy.45 When autophagy occurs, the LC3 precursor is cleaved to form LC3-I. Subsequently, LC3-I transforms to membrane-bound LC3-II.46 As such an elevated ratio of LC3-II to LC3-I indicates enhanced autophagic activity.47,48 We monitored the ratio of LC3-II/LC3-I by western blot to ensure autophagy occurred in the experimental group (Fig. S9 and Table S3, ESI†). From Fig. S10 (ESI†), the fluorescence intensity of cells undergoing autophagy was enhanced remarkably over the control cells, clearly indicating the higher viscosity of the ER during autophagy. These results indicated that both ER stress and autophagy can lead to an increase in ER viscosity, confirming that ER stress is closely related to autophagy. As such GE-Y exhibits great potential for use in exploring the detailed mechanisms between cellular autophagy and ER stress.
In summary, we have developed a fluorescent probe (GE-Y) based on the GFP-chromophore (HBDI) for monitoring changes in ER viscosity. GE-Y exhibited high selectivity and rapid response to viscosity changes in solution. In addition, GE-Y was able to monitor intracellular ER viscosity changes during stress through the time-dependent fluorescence signal readout. GE-Y was then used to monitor changes in ER viscosity during autophagy. The results indicated that autophagy could cause an increase in the viscosity of the ER, confirming the relationship between ER stress and autophagy. This research indicates that GE-Y is an effective tool for monitoring the viscosity of the ER, whilst also providing a powerful tool for monitoring ER stress during autophagy and related diseases.
The authors gratefully acknowledge the financial support from the National Natural Science Foundation of China (Grants 21672150 and 21302125), Shanghai Rising-Star Program (19QA1406400), and Shanghai Government (18DZ2254200). T. D. J. wishes to thank the Royal Society for a Wolfson Research Merit Award and the Open Research Fund of the School of Chemistry and Chemical Engineering, Henan Normal University for support (2020ZD01). L. W. wishes to thank the China Scholarship Council and the University of Bath for supporting his PhD in the United Kingdom.
Conflicts of interest
There are no conflicts to declare.Notes and references
- J. Lippincott-Schwartz and G. H. Patterson, Science, 2003, 300, 87–91 CrossRef CAS PubMed.
- A. Miyawaki, Annu. Rev. Biochem., 2011, 80, 357–373 CrossRef CAS PubMed.
- D. C. Prasher, V. K. Eckenrode, W. W. Ward, F. G. Prendergast and M. J. Cormier, Gene, 1992, 111, 229–233 CrossRef CAS.
- A. Acharya, A. M. Bogdanov, B. L. Grigorenko, K. B. Bravaya, A. V. Nemukhin, K. A. Lukyanov and A. I. Krylov, Chem. Rev., 2017, 117, 758–795 CrossRef CAS PubMed.
- S. Ge, H. Deng, Y. Su and X. Zhu, RSC Adv., 2017, 7, 17980–17987 RSC.
- A. Singh, D. Samanta, M. Boro and T. K. Maji, Chem. Commun., 2019, 55, 2837–2840 RSC.
- Y. Liu, C. H. Wolstenholme, G. C. Carter, H. Liu, H. Hu, L. S. Grainger, K. Miao, M. Fares, C. A. Hoelzel, H. P. Yennawar, G. Ning, M. Du, L. Bai, X. Li and X. Zhang, J. Am. Chem. Soc., 2018, 140, 7381–7384 CrossRef CAS PubMed.
- S. Chatterjee, K. Ahire and P. Karuso, J. Am. Chem. Soc., 2020, 142, 738–749 CrossRef CAS PubMed.
- M.-S. Tsai, S.-Y. Tsai, Y.-F. Huang, C.-L. Wang, S.-S. Sun and J.-S. Yang, Chem. - Eur. J., 2020, 26, 5942–5945 CrossRef CAS PubMed.
- X. Li, R. Zhao, Y. Wang and C. Huang, J. Mater. Chem. B, 2018, 6, 6592–6598 RSC.
- L. Cai, H. Li, X. Yu, L. Wu, X. Wei, T. D. James and C. Huang, ACS Appl. Bio Mater., 2021, 4, 2128–2134 CrossRef CAS PubMed.
- S. Sun, X. Tang, Y. Guo and J. Hu, Curr. Opin. Cell Biol., 2021, 71, 1–6 CrossRef CAS PubMed.
- A. C.-H. Chen, L. Burr and M. A. McGuckin, Clin. Transl. Immunol., 2018, 7, e1019 CrossRef PubMed.
- M. Akman, D. C. Belisario, I. C. Salaroglio, J. Kopecka, M. Donadelli, E. De Smaele and C. Riganti, J. Exp. Clin. Cancer Res., 2021, 40, 28 CrossRef CAS PubMed.
- N. T. Sprenkle, S. G. Sims, C. L. Sánchez and G. P. Meares, Mol. Neurodegener., 2017, 12, 42 CrossRef PubMed.
- K. Park, S. E. Lee, K.-O. Shin and Y. Uchida, FEBS J., 2019, 286, 413–425 CrossRef CAS PubMed.
- K. R. Bhattarai, M. Chaudhary, H.-R. Kim and H.-J. Chae, Trends Cell Biol., 2020, 30, 672–675 CrossRef CAS PubMed.
- J. Lippincott-Schwartz, E. Snapp and A. Kenworthy, Nat. Rev. Mol. Cell Biol., 2001, 2, 444–456 CrossRef CAS PubMed.
- C. S. Cardoso de Castro, D. M. d E. Santo Filho, J. R. R. Siqueira, A. P. F. Barbosa, C. R. d C. Rodrigues, M. L. Cabral, E. M. da Silva, F. d O. Baldner and J. M. G. Gouveia, J. Pet. Sci. Eng., 2016, 138, 292–297 CrossRef CAS.
- B. Calvignac, E. Rodier, J.-J. Letourneau, P. Vitoux, C. Aymonier and J. Fages, J. Supercrit. Fluids, 2010, 55, 96–106 CrossRef CAS.
- E. Lee, B. Kim and S. Choi, Sens. Actuators, A, 2020, 313, 112176 CrossRef CAS.
- A. Statsenko, W. Inami and Y. Kawata, Opt. Commun., 2017, 402, 9–13 CrossRef CAS.
- C. Ma, W. Sun, L. Xu, Y. Qian, J. Dai, G. Zhong, Y. Hou, J. Liu and B. Shen, J. Mater. Chem. B, 2020, 8, 9642–9651 RSC.
- C.-J. Chen, W.-L. Chen, P. H. Phong and H.-S. Chuang, Sensors, 2019, 19, 1217 CrossRef CAS PubMed.
- F. Liu, Z. Yuan, X. Sui, C. Wang, M. Xu, W. Li and Y. Chen, Chem. Commun., 2020, 56, 8301–8304 RSC.
- X. Mu, Y. Liu, S. Liu, Y. Sun, N. Lu, Y. Lu, W. Li, X. Zhou, B. Liu and Z. Li, Sens. Actuators, B, 2019, 298, 126831 CrossRef CAS.
- X. Wang, L. Fan, S. Wang, Y. Zhang, F. Li, Q. Zan, W. Lu, S. Shuang and C. Dong, Anal. Chem., 2021, 93, 3241–3249 CrossRef CAS PubMed.
- J. Yin, M. Peng and W. Lin, Anal. Chem., 2019, 91, 8415–8421 CrossRef CAS PubMed.
- J. Cui, H. Nie, S. Zang, S. Su, M. Gao, J. Jing and X. Zhang, Sens. Actuators, B, 2021, 331, 129432 CrossRef CAS.
- J. Park, B. Lim, N. K. Lee, J. H. Lee, K. Jang, S. W. Kang, S. Kim, I. Kim, H. Hwang and J. Lee, Sens. Actuators, B, 2020, 309, 127764 CrossRef CAS.
- B. Shen, L. F. Wang, X. Zhi and Y. Qian, Sens. Actuators, B, 2020, 304, 127271 CrossRef CAS.
- L. Wang, Y. Xiao, W. Tian and L. Deng, J. Am. Chem. Soc., 2013, 135, 2903–2906 CrossRef CAS PubMed.
- Z. Yang, Y. He, J. H. Lee, W.-S. Chae, W. X. Ren, J. H. Lee, C. Kang and J. S. Kim, Chem. Commun., 2014, 50, 11672–11675 RSC.
- Y. He, J. Shin, W. Gong, P. Das, J. Qu, Z. Yang, W. Liu, C. Kang, J. Qu and J. S. Kim, Chem. Commun., 2019, 55, 2453–2456 RSC.
- L. Hao, Y.-M. Zhong, C.-P. Tan and Z.-W. Mao, Chem. Commun., 2021, 57, 5040–5042 RSC.
- Y. Zhou, Z. Liu, G. Qiao, B. Tang and P. Li, Chin. Chem. Lett., 2021, 32, 3641–3645 CrossRef CAS.
- H. Lee, Z. Yang, Y. Wi, T. W. Kim, P. Verwilst, Y. H. Lee, G.-i. Han, C. Kang and J. S. Kim, Bioconjugate Chem., 2015, 26, 2474–2480 CrossRef CAS PubMed.
- L. Yu, J. F. Zhang, M. Li, D. Jiang, Y. Zhou, P. Verwilst and J. S. Kim, Chem. Commun., 2020, 56, 6684–6687 RSC.
- A. Heifetz, R. W. Keenan and A. D. Elbein, Biochemistry, 1979, 18, 2186–2192 CrossRef CAS PubMed.
- M. Rocha, N. Apostolova, R. Diaz-Rua, J. Muntane and V. M. Victor, Trends Endocrinol. Metab., 2020, 31, 725–741 CrossRef CAS PubMed.
- M. Bhardwaj, N. M. Leli, C. Koumenis and R. K. Amaravadi, Semin. Cancer Biol., 2020, 66, 116–128 CrossRef.
- S. Song, J. Tan, Y. Miao and Q. Zhang, J. Cell. Physiol., 2018, 233, 3867–3874 CrossRef CAS.
- N. Mizushima, T. Yoshimori and B. Levine, Cell, 2010, 140, 313–326 CrossRef CAS PubMed.
- J. Mejlvang, H. Olsvik, S. Svenning, J.-A. Bruun, Y. P. Abudu, K. B. Larsen, A. Brech, T. E. Hansen, H. Brenne, T. Hansen, H. Stenmark and T. Johansen, J. Cell Biol., 2018, 217, 3640–3655 CrossRef CAS PubMed.
- I. Tanida, T. Ueno and E. Kominami, in Autophagosome and Phagosome, ed. V. Deretic, Humana Press, USA, 2008, vol. 445, ch. 4, pp. 77–88 Search PubMed.
- Y. Kabeya, N. Mizushima, T. Ueno, A. Yamamoto, T. Kirisako, T. Noda, E. Kominami, Y. Ohsumi and T. Yoshimori, EMBO J., 2000, 19, 5720–5728 CrossRef CAS PubMed.
- N. Mizushima, Int. J. Biochem. Cell Biol., 2004, 36, 2491–2502 CrossRef CAS PubMed.
- J. Guan, J. Sun, F. Sun, B. Lou, D. Zhang, V. Mashayekhi, N. Sadeghi, G. Storm, E. Mastrobattista and Z. He, Nanoscale, 2017, 9, 9190–9201 RSC.
Footnotes |
| † Electronic supplementary information (ESI) available. See DOI: https://doi.org/10.1039/d2cc00118g |
| ‡ Equal contribution. |
| This journal is © The Royal Society of Chemistry 2022 |


