Recent advances in electrocatalytic chloride oxidation for chlorine gas production
Yihan
Wang†
a,
Yangyang
Liu†
a,
Dianne
Wiley
 a,
Shenlong
Zhao
 *a and
Zhiyong
Tang
 b
b
aSchool of Chemical and Biomolecular Engineering, The University of Sydney, NSW 2006, Australia. E-mail: shenlong.zhao@sydney.edu.au
bCAS Key Laboratory of Nanosystem and Hierarchical Fabrication, CAS Center for Excellence in Nanoscience, National Center for Nanoscience and Technology, Beijing 100190, P. R. China
First published on 28th May 2021
Abstract
Chlorine gas is one of the most basic chemicals produced through electrolysis of brine solution and is a key raw material in many areas of industrial chemistry. In the past half a century, the dimensionally stable anode (DSA) made of RuO2 and TiO2 coated on the Ti substrate is the most widely used catalytic electrode for chlorine oxidation. However, the drawbacks of the DSA such as high cost, inferior selectivity and detrimental effects on the environment cannot meet the demand of modern industries. Recently, tremendous progress has been achieved in developing low-cost and efficient electrocatalysts for the chlorine evolution reaction (CER). Herein, a concise, but comprehensive and critical review is provided to summarize the recent advances in the field of electrocatalytic CER. First, the history of the chlor-alkali process and the catalytic mechanism of CER are summarized and presented. Then, three categories, namely, noble metal-based, earth-abundant transition-metal-based, and carbon-based metal-free electrocatalysts, are reviewed together with strategies for improving the CER catalytic performance. Lastly, future opportunities in this exciting field are outlined in terms of materials design, structure–performance relationship, technical improvements for the reactor and application scenarios extension.
1. Introduction
Chlorine (Cl2), as a chemical precursor, is crucial for many important industrial processes including polymer synthesis, disinfection goods production, pharmaceutical manufacture, and wastewater treatment.1,2 Up to 2020, the global production of Cl2 was more than 88 million tons per year.3 Industrially, chlorine production widely relies on the chlor-alkali process, which consists of a pair of redox reactions including CER and hydrogen evolution reaction (HER). In comparison to HER, the anodic CER which requires a higher reaction energy barrier (1.36 V vs. SHE) is considered as the determining reaction of the chlor-alkali process.4 To reduce the energy consumption of CER, various metal/carbon-based materials have been developed in the past century. Among them, mixed metal oxides (MMOs) based on precious metals Ru or Ir, such as DSAs, have been predominantly employed as CER catalysts.5 However, recently reported studies revealed that MMO-based catalysts are also highly active for the oxygen evolution reaction (OER), which suggests that the OER and CER are intimately coupled.6–10 The concomitant water oxidation on MMOs, therefore, unavoidably leads to an inferior selectivity for CER. Further, noble metals are susceptible to the formation of thermodynamically stable species under harsh environments such as soluble Ru chlorides/oxides, eventually resulting in catalyst degradation.4 In addition, the scarcity and high overpotential of DSAs greatly increase the cost of chlorine production, hindering large-scale application and the commercialization process. Thus, it is highly desirable to develop readily available and cost-effective electrocatalytic materials that possess a better catalytic performance than the ones currently used in industry.In the past decades, substantial efforts focusing on both theoretical computations and experiments have provided insights into the CER mechanism, thereby exhibiting new perspectives in searching for efficient materials. First-principles calculations reveal that regulating the electronic and geometric structures of electrocatalysts to optimize the reaction pathway of chlorine oxidation is vital for improving the activity, selectivity and stability of catalysts.6–10 And, various strategies such as heteroatom doping, atomic scaling and surface functionalization have been developed to improve the efficiency of the anodic reaction in the chlor-alkali process. For example, a variety of transition metals (e.g. Sn, Sb) doped into RuO2 were synthesized as CER electrocatalysts with a low overpotential and excellent faradaic efficiency (FE).11–14 Besides, the latest research indicated that size tailoring could be an efficient approach to improve the utilization and accessibility of active sites, leading to greatly improved performance in low Cl− concentration electrolytes.15 Apart from noble metal-based catalysts, earth-abundant transition metal oxides such as Co3O4 and CoSb2Ox have been reported to provide abundant active sites and extraordinary durability for effective electrocatalytic chlorine evolution.16,17 However, the intrinsic properties of traditional metal oxides (such as the low surface area and poor corrosion resistance) present barriers to the improvement of mass transfer and stability. To eliminate the dependence on metal-based catalysts, carbon materials are regarded as promising candidates owing to their high porosity, structural controllability and excellent stability.18,19 In fact, certain carbon-based electrodes such as graphite have been fabricated and successfully used for practical chlor-alkali industrialization.5
In recent years, tremendous progress has been achieved in both mechanistic understanding and performance enhancement of CER electrocatalysts. In particular, developed novel catalysts make it possible to overtake traditional DSAs in the race to the chlor-alkali marketplace. Therefore, it is timely to review the current research status in this important field. This review provides a concise and critical updated overview of earlier outbreaks and recent advances, presenting critical issues governing the fundamental understanding of reaction mechanisms and design strategies for controlled synthesis of CER electrocatalysts along with challenges and directions for future research.
2. Progress of chlor-alkali production
Over the past century, three types of two-electrode reaction systems including the diaphragm cell, mercury cell and membrane cell have been designed for chlor-alkali production (Fig. 1).20 The earlier established technology, the diaphragm cell, was integrated with asbestos fibres to strengthen and functionalize the concrete used in the construction of the cell.21 However, asbestos is known to cause lung cancer and other health issues. The next commercial technology, the mercury cell, dominated most of the chlor-alkali industry for a long period as it requires a lower concentration of the raw brine and enables comparatively large capacity production.22 Nevertheless, the growing concerns about environmental and health hazards of mercury poisoning have severely curtailed its use and further development.23,24 For example, Ontario Minamata disease in Canada and Japan caused by mercury poisoning has severe negative impacts on human health. Membrane-based electrolysis developed slowly until the invention of the homogeneous cation-selective membrane.25,26 Owing to the process eco-friendliness, high efficiency and product purity, membrane-based electrolysis became the most attractive approach in the chlor-alkali industry. Until 2020, the chlorine manufacturing market was comprised of 83% membrane-based cells, with the rest comprising 12.5% diaphragm cells, 2.1% mercury cells and 2.1% others.3 The mercury cell is being phased out in most countries. The asbestos-based diaphragm cell is also prohibited in some areas. Thus, the membrane-based cell dominates current chlorine production.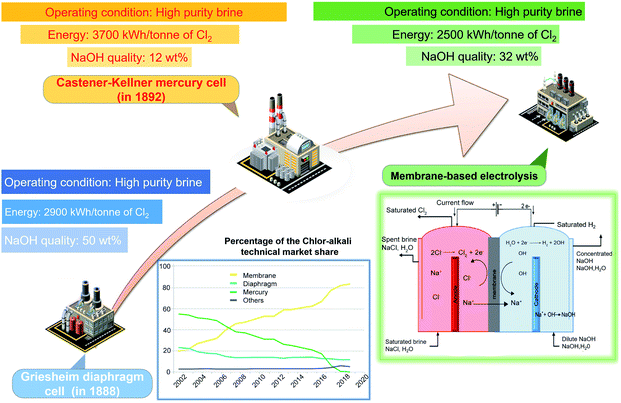 | ||
| Fig. 1 Comparison of the diaphragm, mercury, and membrane cell in the chlor-alkali process. Reproduced with permission.20 Copyright 2019, Elsevier. | ||
As anodic chlorine oxidation is a highly energy-intensive process, the electrocatalyst design is significant in reducing energy consumption of the integrated chlor-alkali process. Numerous efforts have been devoted to exploring electrode materials with high performance as well as long-term tolerance to the acidic environment. The graphite material that has been used before, was bulky and massive, and suffered from oxide layer corrosion during electrolysis.23 Therefore, polished Pt, Ir or their alloys were preferred because of superior stability over graphite.27 The discovery of the DSA, composed of 30% RuO2 and 70% TiO2 coatings, is a significant breakthrough in anode design.28 Until now, various DSA-like mixed metal oxides (AOx·BOx) coated on the base metal substrate have been developed for the anodic chlorine oxidation process.29 Precious metals (A) (Ru, Ir, Pt, etc.) generally act as catalytically active sites.30 Meanwhile, insulating metals (B) (Ti, Sn, Sb, Zr, etc.) act as auxiliary species to strengthen coating adhesion and simultaneously improve the selectivity and stability of the electrode via a synergistic effect. Even though the current widely employed DSA possesses good catalytic performance, there is still a huge potential in reducing its cost and energy consumption for achieving a more sustainable future chlor-alkali process.
3. Mechanism of CER
Though the CER is a simple two-electron process, the actual reaction mechanism is still controversial. Many strategies including first-principles calculations and ab initio thermodynamic analysis were employed to explore the fundamental catalytic pathways of the RuO2 (110) model involved in the CER process.6–9 In addition to theoretical computations, substantial experimentation has been carried out to validate theoretical predictions.8 To date the following three mechanistic reaction pathways, Volmer–Tafel (V–T), Volmer–Heyrovsky (V–H), and Krishtalik have been proposed.Volmer–Tafel
 | (1) |
Volmer–Heyrovsky
 | (2) |
Krishatalik
 | (3) |
As shown in eqn (1)–(3), all three pathways contain a Cl− adsorption process as the first step. Then, three different steps follow (1) recombination of two adsorbed chlorine sites and desorption as gaseous chlorine (Tafel); (2) direct recombination of another Cl− on the existing adsorbed chlorine site and desorption as gaseous chlorine (Heyrovsky); (3) chloronium ion formation, which subsequently recombines with another Cl− and desorption as gaseous chlorine (Krishtalik). By examining the kinetic data from a first-principles study, the V–H pathway was regarded as the most likely reaction pathway on the RuO2 (110) surface and most of the other single-crystalline transition metal oxides.32,33 Nevertheless, experimental kinetic results alone were insufficient to support the real catalytic mechanism.9 Therefore, subsequent theoretical studies employed thermodynamic calculations to investigate a more thoroughly CER electrochemical reaction mechanism. It was found that the RuO2 (110) surface is fully covered with on-top oxygen, which means the unsaturated Rucus sites and Rubr sites are generally capped by the surface oxygen under the equilibrium potential (Fig. 2a).7 Then, based on this fully O-covered RuO2 (110) surface, Exner et al. employed density functional theory (DFT) to further identify each step's Gibbs free energy loss.9 As shown in Fig. 2b, the V–H step at U = 1.36 eV is rate determined by the Volmer step with a 0.13 eV energy barrier and no theoretical energy loss in the Heyrovsky step. Meanwhile, the Tafel and Krishtalik steps have approximately 0.36 eV and 0.98 eV energy loss respectively, which are much higher than that in the Volmer step. Hence, among all three proposed pathways, the Volmer–Heyrovsky (V–H) mechanism is the most preferable pathway to explain the exceptional RuO2 (110) surface catalytic ability. Moreover, based on the existing Gibbs energy diagram of the V–H mechanism, it was found that the RuO2 activity could be further enhanced through reducing the Volmer step's Gibbs energy by substituting the partial top Ru sites with other noble atoms. For instance, the Gibbs energy loss is decreased by 0.05 eV for the V–H process when doped with a monolayer PtO2 on the RuO2 (110) surface, as shown in Fig. 2c and d.
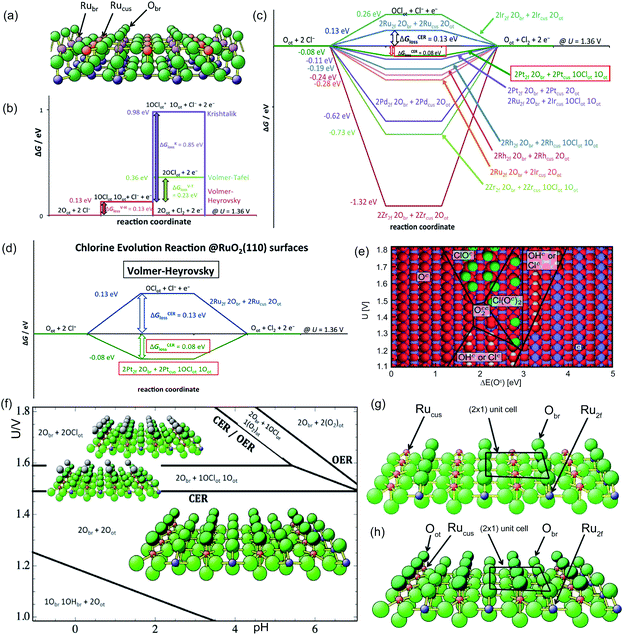 | ||
| Fig. 2 (a) Stoichiometric diagram of the RuO2 (110) crystalline surface. Green ball: oxygen atom, red ball: Ru 1-fold atom (Rucus), pink ball: Ru 2-fold atom (Rubr), and blue ball: bulk Ru atoms. Obr: oxygen adsorbed at the bridge site covered on the RuO2 (110) surface. Reproduced with permission.7 Copyright 2014, Elsevier. (b) Gibbs free energy of the three CER pathways (Volmer–Heyrovsky, Volmer–Tafel and Krishtalik) on the RuO2 (110) fully oxygen covered surface at U = 1.36 V. (c) Gibbs free energy change for the Volmer–Heyrovsky mechanism due to modification of the RuO2 (110) surface by substituting the topmost Ru atoms with other metal atoms. (d) Gibbs free energy change for the Volmer–Heyrovsky mechanism due to modification of the RuO2 (110) surface by a single layer of platinum oxide. Reproduced with permission.9 Copyright 2014, Springer Nature. (e) The most stable oxide surface (pH = 0, aCl− = 1) to a relation among potential U, surface intermediates and ΔE(Oc). Red ball: oxygen atoms; white ball: hydrogen atoms; blue ball: metal ions; green ball: chlorine atoms. Reproduced with permission.31 Copyright 2010, Royal Society of Chemistry. (f) Pourbaix diagram for RuO2 (110) in equilibrium with Cl−, H+ and H2O at 298 K in consideration of solvent effects. br: adsorbates on Rubr sites, and ot: adsorbates on Rucus sites. Reproduced with permission.7 Copyright 2014, Elsevier. (g) Stoichiometric RuO2 (110) surface “RuO2 (110) − (2 × 1) − (2Ru2f 2Obr + 2Rucus)” (2 × 1) unit cell contains two bridging (br) oxygen atoms Obr coordinated to Ru2f and two Rucus sites, and (h) “RuO2 (110) − (2 × 1) − (2Ru2f 2Obr + 2Rucus 2Oot)” (2 × 1) unit cell contains two bridging (br) oxygen atoms Obr coordinated to Ru2f and two Rucus sites and two on-top (ot) oxygen atoms Oot attached to Rucus sites. Reproduced with permission.9 Copyright 2014, Springer Nature. | ||
To gain deeper insight into the chlorine oxidation mechanism, Hanson et al. constructed a Pourbaix diagram to explore the stable surface structure as a function of pH and supplied potential.31 In the plotted Pourbaix diagram, three intermediates (ClOc, Cl(Oc)2, and Clc) are considered as the active species on the RuO2 (110) surface (Fig. 2e), which contribute to the chlorine evolution process as shown in eqn (4)–(6), respectively.
| Oc + 2Cl− → ClOc + Cl− + e− → Oc + Cl2 + 2e− | (4) |
| Occ2 + 2Cl− → Cl(Oc)2 + Cl− + e− → Oc + Cl2 + 2e− | (5) |
| 2Cl− + c → Cl− + Clc + e− → Cl2 + 2e− | (6) |
Among the three proposed intermediates, the on-top oxygen Oc in process (4) is supposed to be likely replaced by the Occ2 in process (5) over a wider pH window considering oxygen dissociation.31 As the applied potential increases, the Cl− in the electrolyte is more possibly adsorbed on the Occ2 to form Cl(Oc)2 and then desorbs as gaseous chlorine. The Cl(Oc)2 is more positively charged than Occ2, which demonstrates that the catalytic pathway on the RuO2 (110) facet is more similar to the Krishtalik mechanism. Later research proposed a different opinion that the intermediate Cl(Oc)2 is not stable enough and, when solvent effects on the existing surface are taken into account, the more thermodynamically stable ClOc is formed preferably (Fig. 2f).7 Therefore, reaction pathway (4) is still considered as the main mechanistic process for the RuO2 (110) O-covered surface, which is more analogous to the Volmer–Heyrovsky pathway. Recent work involving calculation of the Gibbs energy of intermediates on RuO2 and IrO2 surfaces confirms that the formation of ClOc intermediates plays a key role in CER.34 In addition to the on-top oxygen active sites Oc, the unsaturated metal cus (c) could also act as an effective site for CER via the proposed process (6).9 However, compared to the active unsaturated metal cus sites (Rucus), active sites on the surface of RuO2 (110) shown in Fig. 2g, the full on-top oxygen covered surface is more thermodynamically stable (Fig. 2h). The Rucus sites are inevitably occupied by Oot at equilibrium, which makes them difficult to expose and unavailable to directly adsorb Cl− from the electrolyte. Noticeably, although the V–H mechanism is suggested as the most preferable pathway for chlorine oxidation based on the Pourbaix diagram, all the proposed pathways (V–H, V–T, Krishtalik) are feasible on the RuO2 (110) surface.
Aside from the intermediate formation on the surface during the reaction, another concern is the overlapping of CER and OER activity volcanos due to sharing of active sites (Oc and Occ2 in pathways (4) and (5)).8 In general, the formation of the ClOc through active Oc sites on the RuO2 surface is impaired by the formation of OOHc during the OER.31 The parasitic OER leads to the surface Ru oxidation and dissociation into the electrolyte, which are detrimental to both process efficiency and electrode stability.6 In order to better reflect the material selectivity and stability, a linear scaling relationship is used to show the Gibbs free energy difference between the formation of OOHot and OClot (Fig. 3a) (notation ‘ot’ is the same as the ‘c’). The Oot active sites with a larger linear scaling spacing demonstrate a weaker capacity to form OOHot and a higher CER selectivity (Fig. 3b and c). Therefore, breaking the current limiting linear scaling relationship on the metal oxide is significant in improving the selectivity of the CER. For example, doping Ti atoms into the RuO2 crystalline surface could decrease the adsorption energy of Oot and shift the ΔGloss of OER downward by more than 1 eV. The increase of the Gibbs free energy loss significantly hampers the OER but has less influence on CER activity (Fig. 3d). Therefore, doping enables tuning of the electronic configuration and is an efficient approach to enlarge the gap of the linear scaling relationship and improve the selectivity of the electrocatalyst.8 In fact, this rational strategy has been widely employed by mixing TiO2 with RuO2 in the current DSA manufacture.
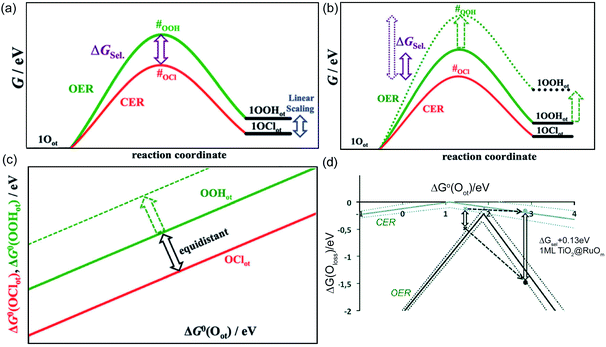 | ||
| Fig. 3 (a) Gibbs free energy diagram along the reaction intermediates of the CER and OER on a single-crystalline RuO2 (110) electrode. Kinetics of CER and OER are governed by the transition states (#) shown during the formation of OClot and OOHot intermediates. The CER selectivity could be quantified by the distance between respective transition states (#). ΔGsel denoted as G#(OOHot) − G#(OClot), the Gibbs free energy difference between the formation of OClot and OOHot. (b) Weaker OOHot bonding results in an increase in the transition state #OOH and enhanced CER selectivity. (c) Constant spacing of the linear scaling relationship between the OClot and OOHot on the transition metal oxide electrode. Shifting the ΔG(OOHot) to a larger value could optimize CER selectivity. Reproduced with permission.6 Copyright 2014, Wiley-VCH. (d) Volcano plots of CER and OER on the RuO2 (110) surface. Dashed lines represent the standard deviations in the linear scaling relations. Reproduced with permission.8 Copyright 2014, Wiley-VCH. | ||
Although the equilibrium potential of CER (1.36 V vs. SHE at 25 °C) is independent of pH, the opposite is encountered for the OER, where the equilibrium potential is reduced by 0.059 eV per pH value.6 Therefore, it is common to suppress changes in the OER equilibrium potential by acidifying the anode electrolyte. Further, based on the Nernst equation (eqn (7)), the equilibrium potential (UCER) of the CER is dependent on the temperature, and Cl− and Cl2 concentration.27 The selectivity of the CER can be improved through increasing the Cl− concentration and temperature to reduce the UCER.10 For instance, the reaction temperature of the current chlor-alkali process is set as 80–90 °C to improve the production efficiency.
 | (7) |
Considering the large demand for chlorine around the world, even a small increment in selectivity will produce a significant improvement in industrial efficiency. Hence, identifying the CER pathway using theoretical analysis enables better design of highly selective catalysts that are vital for the development of the chlor-alkali industry.
4. Electrocatalyst design for CER
As aforementioned, chlorine evolution is a highly energy-intensive process because the half-cell anode equilibrium potential is approximately 1.36 V vs. SHE. Therefore, it is important to use efficient electrocatalysts to reduce the energy consumption in the chlor-alkali process. Though the current state-of-the-art DSA exhibits high performance in CER, there are still some challenges for further industrial scale-up. First, oxide-based DSA type electrodes generally exhibit low selectivity to CER especially in a low Cl− concentration solution such as seawater electrolysis.6 Second, commercialized Ru based MMOs suffer from surface corrosion and depletion during long term electrocatalysis under harsh conditions. The soluble Ru species formation severely impacts both the activity and stability of CER. Moreover, the deactivation of the electrode is accelerated by the partial Ti substrate passivation caused by electrolyte penetration through cracks in the coating, as well as slow bubble removal from compact MMO surfaces.35 Third, the currently used DSA has a high content of noble metals, which imposes high cost on the chlor-alkali process.36 Until now, various strategies have been reported for designing efficient CER catalysts. Herein, we summarize the literature of the impressive progress that has been made for precious metal-, earth-abundant transition metal- and metal-free based electrocatalysts.4.1 Precious metal-based electrocatalysts
Despite the high cost, precious metals are still the dominant components used for synthesizing CER catalysts due to their relatively higher activity. The success of the DSA demonstrates the outstanding performance of RuO2 in an acidic environment over other noble metals (Rh, Pd, and Pt). However, Ru dissolution limits its practical utilization in MMO electrodes.4 In contrast, IrO2 possesses superior stability. The dissolution rate of the IrO2 based metal electrode is only 15 ng cm−2 over 600 s of operation under acidic conditions, around 20 times less than for the RuO2 based metal electrode (∼300 ng cm−2).37 The main limitations of the IrO2 electrode for practical CER utilization are its inferior activity and poor selectivity.38 Therefore, earlier studies mainly focused on mixing IrO2 with RuO2 to enhance the stability of the DSA electrode.39–42 As expected, the presence of IrO2 considerably inhibits detrimental Ru4+ oxidation and effectively minimizes coating corrosion in a harsh CER electrolysis environment.41 Also, online differential electrochemical mass spectrometry (DEMS) revealed that the selectivity of the Ti–Ru–Ir ternary mixed oxides was up to 97% after 500 s testing (Fig. 4a–c).40 Interestingly, with the aid of scanning electrochemical microscopy (SECM), an inhomogeneous surface current distribution is observed in Fig. 4d–f. The difference in the current generated on the surface is attributed to the concurrent chlorine oxidation and reduction in Ru enrichment and Ru deficient regions. Therefore, it is speculated that good dispersion of the active sites on the Ti–Ru–Ir ternary mixed oxide surface is the main reason for the enhanced selectivity toward CER.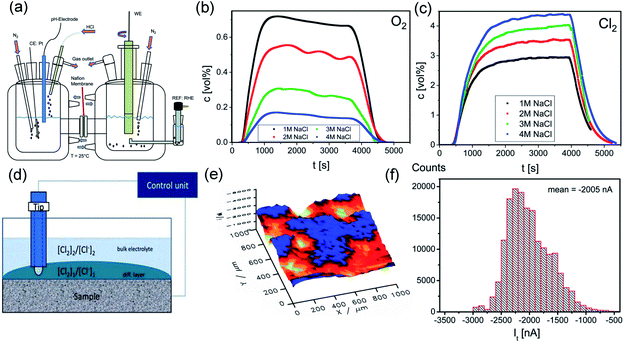 | ||
| Fig. 4 (a) Simple sketch of the two compartment H-cell for DEMS measurement. (b) Monitoring Cl2 production along with time at different NaCl concentrations on Ti–Ru–Ir based oxides. (c) Monitoring O2 production along with time at different NaCl concentrations on Ti–Ru–Ir based oxides. (d) Schematic diagram of the SECM test equipment. (e) SECM image of spatial current distribution on the surface of Ti–Ru–Ir based oxides. (f) Tip current distribution histogram extracted from the SECM image. Reproduced with permission.40 Copyright 2019, Royal Society of Chemistry. | ||
Even though the existence of the synergetic interaction between Ru and Ir improves the performance of Ru-based electrodes, the high price of Ir has no substantial contribution to decreasing the electrode cost. Tremendous research has been devoted to reducing the precious metal-based MMO cost through mixing with other transition metal-based dopants or incorporating carbon support substrates. Recently, reduction in the catalyst size has drawn particular attention for exerting maximum utilization of the metal species and improving the efficiency of each active site.15 Further, selectivity is found to be optimized through downscaling induced electronic configuration tuning.43,44 Additionally, micro/geometric structure optimization is another efficient approach for obtaining high-performance CER catalysts.45–50
Mixed transition metal oxides. Tremendous efforts have been made to investigate the correlation between the ratio of metal oxide components and CER performance.51–55 Beer's first patent uses RuO2 and TiO2 at a molar percent of 50
![[thin space (1/6-em)]](https://www.rsc.org/images/entities/char_2009.gif) :
:![[thin space (1/6-em)]](https://www.rsc.org/images/entities/char_2009.gif) 50.52 RuO2 possesses high catalytic activity on CER, while TiO2 is a supporting metal oxide that is conducive to a better dispersion of active sites. TiO2 provides another important benefit as a stabilizing agent that protects the conducting substrate inside, thereby extending the electrode service life. To upgrade the developed CER electrode, the RuO2 composition is then reduced to 30%.53 As a result, the optimized RuO2–TiO2 exhibits the best kinetic properties and selectivity during CER.54,55 To further disclose the role of TiO2 in the RuO2–TiO2 electrode, Karlsson et al. examined the Ru-doped TiO2 and Ti-doped RuO2 behaviour using DFT (Fig. 5a).56 It was revealed that the ΔE(Oc) on TiO2 could be greatly impacted by even a small amount of Ru dopant, while negligible influence is observed upon Ti doping into RuO2. The volcano plot in Hanson's work shows that the highest selectivity could be found at ΔE(Oc) = 3.2 eV (Fig. 5b). At this point, the overpotential difference between CER and OER is at the theoretical maximum, which suggests an optimal selectivity for CER. As shown in Fig. 5a, the ΔE(Oc) is closest to 3.2 eV when the Ru atom dopant is located on the ‘1b’ bridge site. Meanwhile, the Ti on the 1 cus site could be affected by Ru doping and activated to promote the selectivity of CER (Fig. 5c). This computational analysis outcome is consistent with the experimental results and verifies that the selectivity could be enhanced by the synergistic effect between TiO2 and RuO2. Additionally, reducing the RuO2 composition to 30% incredibly decreases the price of the electrode, making the industrial chlor-alkali process more economic. By combining all the advantages, the RuO2–TiO2 coating (30
50.52 RuO2 possesses high catalytic activity on CER, while TiO2 is a supporting metal oxide that is conducive to a better dispersion of active sites. TiO2 provides another important benefit as a stabilizing agent that protects the conducting substrate inside, thereby extending the electrode service life. To upgrade the developed CER electrode, the RuO2 composition is then reduced to 30%.53 As a result, the optimized RuO2–TiO2 exhibits the best kinetic properties and selectivity during CER.54,55 To further disclose the role of TiO2 in the RuO2–TiO2 electrode, Karlsson et al. examined the Ru-doped TiO2 and Ti-doped RuO2 behaviour using DFT (Fig. 5a).56 It was revealed that the ΔE(Oc) on TiO2 could be greatly impacted by even a small amount of Ru dopant, while negligible influence is observed upon Ti doping into RuO2. The volcano plot in Hanson's work shows that the highest selectivity could be found at ΔE(Oc) = 3.2 eV (Fig. 5b). At this point, the overpotential difference between CER and OER is at the theoretical maximum, which suggests an optimal selectivity for CER. As shown in Fig. 5a, the ΔE(Oc) is closest to 3.2 eV when the Ru atom dopant is located on the ‘1b’ bridge site. Meanwhile, the Ti on the 1 cus site could be affected by Ru doping and activated to promote the selectivity of CER (Fig. 5c). This computational analysis outcome is consistent with the experimental results and verifies that the selectivity could be enhanced by the synergistic effect between TiO2 and RuO2. Additionally, reducing the RuO2 composition to 30% incredibly decreases the price of the electrode, making the industrial chlor-alkali process more economic. By combining all the advantages, the RuO2–TiO2 coating (30![[thin space (1/6-em)]](https://www.rsc.org/images/entities/char_2009.gif) :
:![[thin space (1/6-em)]](https://www.rsc.org/images/entities/char_2009.gif) 70) has been practically used for a long time.
70) has been practically used for a long time.
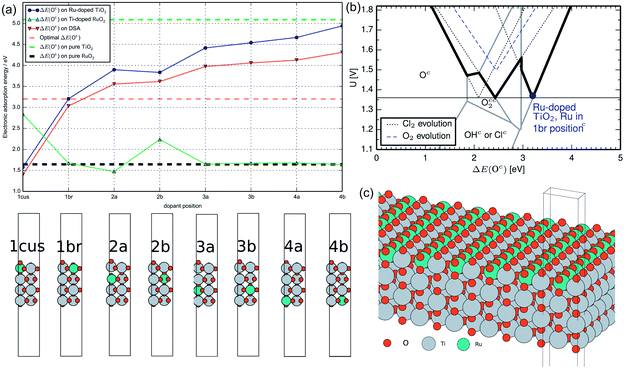 | ||
| Fig. 5 (a) Covered oxygen adsorption energy ΔE(Oc) for Ru-doped TiO2, Ti-doped RuO2, DSA and pure RuO2 and TiO2 at different dopant positions from DFT modelling. (b) Volcano plot from Hansen's work in collaboration with Ru-doped TiO2 at the ‘1b’ site (bold line) in this work. (c) A unit model of the optimized identical Ru-doped TiO2 surface. Reproduced with permission.56 Copyright 2014, Elsevier. | ||
SnO2 is another promising metal oxide for forming a well-stabilized solid solution with the RuO2 rutile crystalline structure.57 Under acidic conditions, the RuO2–SnO2/Ti electrode exhibits a considerably longer lifespan than the RuO2/Ti electrode.58,59 At the same time, the SnO2–Sb2O5 mixture has been shown to provide a good platform for producing chlorine from seawater electrocatalysis.11,12 Theoretically, the Sb5+ can be well incorporated with Sn4+ due to a similar ionic radius. Also, SnO2 conductivity will be optimized by interactions among the different components that optimize the catalytic properties.60,61 For instance, RuO2–Sb2O5–SnO2/Ti was fabricated as an electrocatalyst for CER by pyrolyzing the mixed metal salts at 500 °C.11 Impressively, current efficiency is up to 90.4% in seawater electrolytes, which is higher than that of the commercial IrO2–Ta2O5/Ti electrode. Moreover, the as-prepared electrode exhibits a long service life (5 years) under 500 A m−2 in acidic electrolytes. Subsequently, the RuO2–IrO2–Sb2O5–SnO2 electrode was prepared using a similar method.12 The as-obtained quaternary MMOs exhibit a lower onset potential that is about 50 mV less than that of ternary MMOs. Meanwhile, the quaternary MMOs have a faradaic efficiency at around 86.7% in seawater electrolysis. These results show that manufacturing multi-component metal oxides is a promising strategy for future chlorine production from seawater electrolysis.
Transition metal doping. Other than mixing with transition metal oxides, a variety of transition metals such as Co, Ni, Zn, Fe, Cu, and Mg have been used for developing transition metal doped RuO2 for CER.62–65 Essentially, the electronic interaction of hetero-valent atoms can generate synergistic effects, which could affect both activity and selectivity of catalysts. In general, metal dopants with fewer d-orbital electrons could facilitate absorption strength of the active site and intermediate balance, while the ones with the electron-enriched d-orbital could suppress the CER performance of the active sites.64 For example, Petrykin et al. introduced Zn into the RuO2 crystalline structure using a facile freeze-drying method.44 It was found that the selectivity performance of CER gradually decreases as the Zn molar content increases from 0% to 30%. Experimental and computational studies were carried out to explore the selectivity trend. As shown in Fig. 6a–d, the disordered atomic positions on the cus side hinder the formation of the peroxo species Occ2, which leads to suppression of both CER and OER. However, the OER could still occur through intermediate ‘oxo’ species on the Zn-rich ilmenite surface. Different from OER, there are no alternative intermediates to promote the CER.
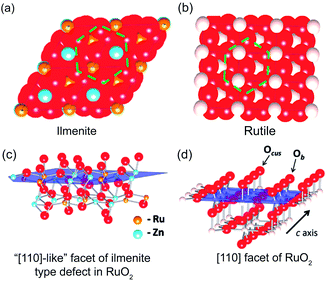 | ||
| Fig. 6 (a) Atomic close packing model of the ilmenite structure and (b) rutile structure. (c) Spatial ilmenite structure of the active RuO2 (110) surface. (d) Spatial rutile structure of the active RuO2 (110) surface. Reproduced with permission.44 Copyright 2011, American Chemical Society. | ||
In addition to Zn doping, Ni-doped RuO2 was also prepared to investigate the doping effect on CER selectivity. The earlier study discovered that Ni doped into the rutile RuO2 structure could form three atomic arrangements on the surface, each one possessing a different extent of selectivity preference.66 Through parallel OER and CER studies on Ru1−xNixO2y, the optimal selectivity and activity for CER are acquired when the molar content of the doped Ni reaches 10%.14 It was shown that further enhancement of the amount of Ni could result in an inferior selectivity. It was suggested that partial substitution of Ru with Ni would result in different cationic arrangements surrounding the active Oc sites that regulate the adsorption preference for Cl− and water.
Carbon substrate incorporation. Apart from heteroatom doped metal oxides, carbon-based materials are another class of efficient electrocatalysts for applications such as water splitting, oxygen reduction reaction and CO2 reduction reaction.67–69 Compared with the industrially used Ti substrate, carbon materials such as carbon nanotubes, graphene and biomass derivatives possess many advantages including low cost, exceptional conductivity and high surface area.18,19 In addition, the surface of conventional MMOs is easily cracked during fabrication, which results in irreversible Ti substrate corrosion caused by electrolyte penetration.4 In this regard, carbon materials are the most competitive candidates to replace the widely used metal support. More importantly, there are abundant defects or functional groups on the surface of carbon materials, which not only offer plenty of support sites to anchor active species but also generate a synergistic effect to further promote the composite activity.70
Recently, biomass-based lignin was employed as a freestanding matrix to prepare a RuO2 doped carbon-supported catalytic electrode for chlorine oxidation (RuO2/CE).43 The prepared carbon electrode (CE) shows high mechanical strength, low resistance and facile shape control characteristics (Fig. 7a). To construct the porous structure on the lignin-based CE, acetylene black was added. As shown in Fig. 7b and c, the fabricated CE with acetylene black exhibits well-interconnected micropores, whereas the pores of the control sample are irregular. The appropriate content of acetylene black is conducive to constructing porous structures that are beneficial to rapid mass transfer and diffusion. Scanning electron microscopy (SEM) and elemental mapping images reveal that the Ru and RuO2 nanospheres are well decorated on the CE surface after electrooxidation (Fig. 7d and e). As a result, the RuO2/CE-10% offers a high current density of 129 mA cm−2 at 1.44 V vs. SHE, which is two times higher than that of the benchmark Ru0.3Ti0.7/Ti electrode (59 mA cm−2) under identical conditions. The electrochemically active surface area (ECSA) of the as-prepared carbon-supported catalyst is 19.4 mF cm−2, which is much higher than that of the control sample (7.9 mF cm−2). Besides, the conductivity of the as-prepared carbon-supported RuO2 is superior to that of the Ru0.3Ti0.7O2/Ti electrode. Therefore, both large active surface area and high conductivity are responsible for its excellent CER activity. This work opens a door for constructing a carbon-based electrocatalyst to support the metal sites, which could effectively avoid passivation layer formation.
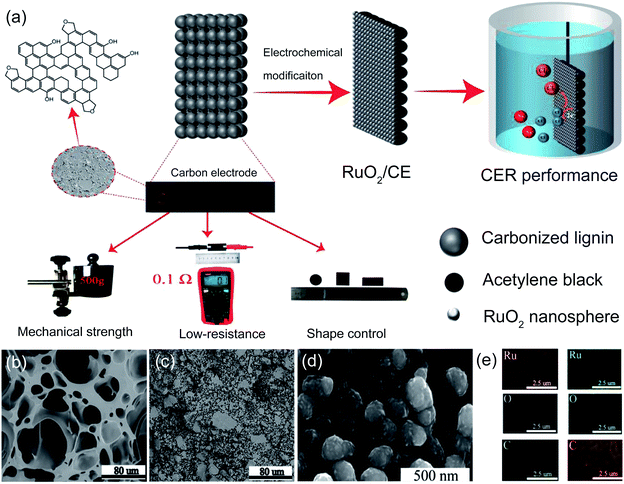 | ||
| Fig. 7 (a) Schematic diagram of the RuO2 doped CE synthesis process and characteristics of the lignin-based carbon electrode including mechanical strength, low resistance, shape control. (b) SEM image for CE with 0 wt% acetylene black (CE-0%). (c) SEM image for CE with 10 wt% acetylene black (CE-10%). (d) SEM image for Ru doped CE with 10 wt% acetylene black (Ru/CE-10%). (e) Elemental mapping of Ru/CE-10% (left column) and RuO2/CE-10% (right column). Reproduced with permission.43 Copyright 2021, Elsevier. | ||
The sol–gel process is considered as the particularly suitable approach to fabricate MMO-based CER electrodes because the molecular level homogeneity of the M–O–M networks can be formed by controlling hydrolysis and condensation reactions.4,46 Generally, the pre-treated Ti substrate is immersed into the well-dispersed metal salt solutions, followed by a pyrolysis process. The morphology and thickness of the coating layers can be optimized by controlling the dipping times and concentration of the solution. Previous studies have examined whether the crack-free electrode prepared by the sol–gel process could exhibit enhanced CER performance.45 Besides, it is a typical method for preparing MMOs with a smooth surface for a comparative investigation of the microstructural effect on the electrochemical activity during Cl2 evolution. For example, Chen et al. fabricated a crack-free Ru0.3Sn0.7O2/Ti electrode, exhibiting a better activity than the Ru0.3Ti0.7O2/Ti electrode produced by conventional thermal decomposition. The as-obtained Ru0.3Sn0.7O2 electrode at a current density of 20 mA cm−2 only requires 1.2 V vs. SHE, about 0.15 V less than that of the commercial Ru0.3Ti0.7O2 under identical conditions (Fig. 8a). As shown in Fig. 8b, the crack-free electrode exhibits a compact surface structure and fine nanopores. Compared with the crack-rich electrode, the sol–gel fabricated less-cracked electrode is beneficial to bubble release. The dependence of the Cl2 bubble release behavior on the microstructure coating is also investigated from SEM and SECM images. Uniform bubble formation appears to align with visual observation of the local electrocatalytic activity of the as-prepared electrode (Fig. 8c).
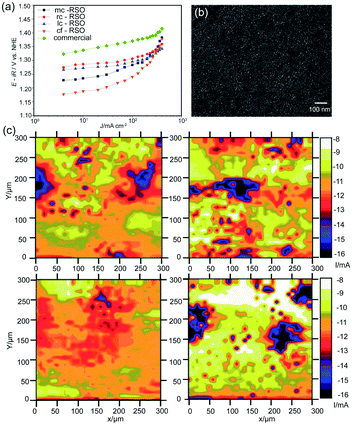 | ||
| Fig. 8 (a) Galvanostatic polarization curves in 3.5 M, pH = 3 NaCl solution and 80 °C for different Ru0.3Sn0.7O2 coating morphologies (5.78 gRu m−2) and the commercial Ru0.3Ti0.7O2 coating (12.1 gRu m−2). (b) SEM image of the Ru0.3Sn0.7O2 coating with crack-free surface microstructure. (c) SECM activity images of different Ru0.3Sn0.7O2 coatings in 5 M, pH = 2 NaCl solution at room temperature. The applied potentials are 1.6 V for the sample and 1.15 V vs. SHE for the Pt tip. (Left top) mud-crack, (right top) reduced-crack, (left bottom) less-crack, and (right bottom) crack-free. Reproduced with permission.45 Copyright 2012, Royal Society of Chemistry. | ||
At the same time, high catalytic performance could be obtained by modifying not only the outside coating surface but also the inner surface, such as the porosity. The porous structure enables fast chlorine bubble removal, thereby maintaining the activity under high current density. Recently, the sol–gel process was further optimized by introducing soft or hard templates into the coating manufacture to improve the inner electrode porosity (Fig. 9a).73 For example, Menzel et al. prepared a dimensionally stable Ru/Ir/TiO2 electrode by adding the polymer F127 into the sol mixture. This soft template greatly improves the porosity of the as-prepared electrode, facilitating reactant contact and product removal. To gain a deep insight into the phase composition, transmission electron microscopy (TEM) observation combined with selected area electron diffraction (SAED) is employed, as shown in Fig. 9b. A lattice constant of approximately 0.33 nm is estimated from Fast Fourier transform (FFT) plots, which corresponds to the (110) rutile structure (Fig. 9c). Cyclic voltammetry (CV) measurement shows that the as-obtained electrode could deliver 80 mA cm−2 current density at a given potential of 1.62 V vs. SHE, nearly two times larger than that of the Ir/TiO2 electrode without pore templates (Fig. 9d and e). The quantitively inductively coupled plasma (ICP) test reveals that the templated Ir/TiO2 presents a more evidently mass related activity than the untemplated Ir/TiO2. At a given potential of 1.57 V vs. SHE, the same mass of the templated Ir/TiO2 catalyst could deliver a current density two times higher than that of the untemplated Ir/TiO2. It is speculated that the porous Ir/TiO2 electrode is able to expose more inner active sites for better utilization of the catalyst.
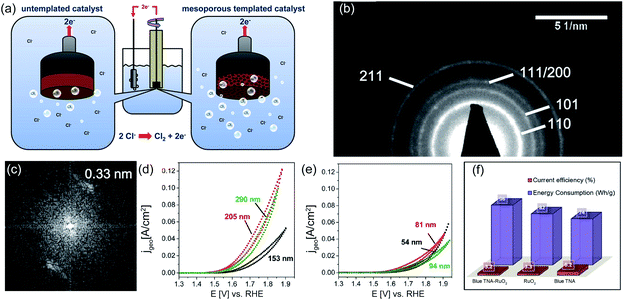 | ||
| Fig. 9 (a) Schematic diagram of untemplated and mesoporous templated catalysts. (b) SAED image and (c) FFT plots of the F127 templated TiO2 film containing 15 wt% of Ir. (d) CV for 10 nm pores templated 15 wt% Ir/TiO2 and (e) untemplated 15 wt% Ir/TiO2 with variation of the catalyst film thickness. Reproduced with permission.73 Copyright 2013, American Chemical Society. (f) Comparison of current efficiencies and energy consumption of blue TNA–RuO2, RuO2 and blue TNA in 0.1 M, pH = 6 NaCl solution. Reproduced with permission.47 Copyright 2018, Elsevier. | ||
Though the sol–gel method could efficiently improve the performance, the addition of surfactants and adhesives could easily block the active sites and decrease the conductivity of the electrode. Recently, the in situ growth of decorating RuO2 onto the electrode has attracted much interest owing to a simplified fabrication process and strengthened interface adhesion between the active site and conductive substrate.74 In comparison to both the conventional thermal decomposition and the sol–gel process, in situ growth of the catalytic sites onto the substrate can effectively avoid electrode deactivation caused by mud cracks.48,50 For example, a binder-free RuO2–TiO2 catalyst was directly grown in situ on the Ti substrate surface through a hydrothermal approach.50 The as-obtained flower-like morphology RuO2–TiO2 catalyst (NF RuO2–TiO2/Ti) possesses an extensive surface area, which facilitates mass transport. Indeed, the NF RuO2–TiO2/Ti shows a lower onset potential at 1.284 V vs. SHE and a Tafel slope of 41 mV dec−1 in the electrochemical tests. The electrochemical surface area (ECSA) results indicate that NF RuO2–TiO2/Ti with a larger Cdl (7480 μF cm−2) is more effective in enlarging the catalytic surface area. Also, the in situ growth of catalysts exhibits extraordinary stability with negligible activity degradation before and after 1200 min electrolysis in 5 M NaCl solution.
Additionally, the in situ anodization method is widely employed to fabricate a RuO2 coated TiO2 nanoarray (TNA–RuO2) as an efficient electrocatalyst for CER.47 The well-dispersed blue TNA–RuO2 tubes show an average diameter of 80 nm. The current efficiency of the blue TNA–RuO2 for chlorine evolution is as high as 96%, which is better than that of RuO2 (82%) and blue TNA (74%) reported in previous studies (Fig. 9f). Further, the estimated energy consumption for chlorine generation reveals the high performance of the blue TNA–RuO2. As shown in Fig. 9f, the energy consumption for generating 1 g of chlorine on the blue TNA–RuO2 electrode is approximately 3.2 W h g−1, which is similar to that of the equivalent pure RuO2 (3.3 W h g−1), and much lower than that of the blue TNA (6.2 W h g−1) under identical conditions. The high current efficiency and low energy consumption of the blue TNA–RuO2 are ascribed to the synergistic effect of the blue TNA and RuO2. Apart from the one-dimensional TNT, similar but different work was conducted by fabricating a two-dimensional belt-like anatase TiO2 substrate (RuO2 NPs@TiO2 NBs) (Fig. 10).48 As shown in Fig. 10a, RuO2 was grown in situ on TiO2 nanobelts through an electrodeposition process. The elemental mapping images show that the O, Ru and Ti elements are uniformly distributed over the entire substrate (Fig. 10b). The SEM images confirm that the approximately 400 nm width as well as the 1–2 μm length of the nanobelt rough surface is well decorated with RuO2 (Fig. 10c). Moreover, the high-resolution transmission electron microscopy (HR-TEM) and corresponding SAED pattern images demonstrate the crystalline nature of the as-synthesized RuO2 NPs@TiO2 NBs. The lattice fringes exhibited in Fig. 10d and e are approximately 0.352 nm and 0.318 nm, which correspond well to the respective TiO2 (101) and RuO2 (110) facets. The electrocatalytic performance of the as-fabricated catalysts was investigated in the saturated NaCl electrolyte. The uniformly dispersed active RuO2 sites on the TiO2 nanobelt exhibit excellent catalytic activity with only 80 mV overpotential when generating a 50 mA cm−2 current density. The as-obtained catalysts possess large surface roughness, which facilitates surface contact between reactants and active sites, while, decreasing the chlorine bubble adhesion force on the electrode. As a result, the onset potential of the RuO2 NPs@TiO2 NB electrode is only 1.31 V vs. SHE with a small Tafel slope of 39 mV dec−1. Moreover, the catalytic activity of the optimized RuO2@TiO2 shows negligible degradation after 12 h electrolysis along with a FE at 91.8% at 100 mA cm−2 during chlorine evolution.
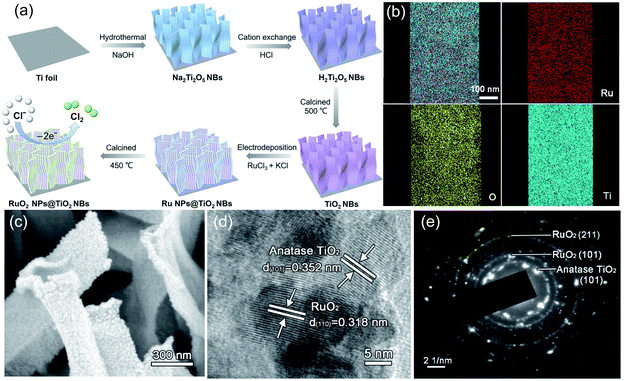 | ||
| Fig. 10 (a) Schematic diagram of the RuO2 NPs@TiO2 NB synthesis process. (b) Energy-dispersive X-ray spectroscopy (EDX) images of RuO2 NPs@TiO2 NBs. (c) SEM images of RuO2 NPs@TiO2 NBs. (d) TEM images and (e) SAED analysis of RuO2 NPs@TiO2 NBs. Reproduced with permission.48 Copyright 2020, Elsevier. | ||
Most recently, Lim et al. fabricated carbon nanotube supported atomic Pt (Pt-CNT) for CER by pyrolyzing the Pt-porphyrin precursor.15 The well-dispersed ultra-small dots in the high-angle annular dark-field scanning transmission electron microscopy (HAADF-STEM) image suggest that the Pt has been successfully embedded into the CNT (Fig. 11a). Impressively, the Pt-CNT displays excellent activity with an overpotential of only 30 mV in dilute 1 M NaCl electrolyte to start the CER, much better than the Pt nanoparticles dispersed on the CNT (PtNP-CNT) and DSA (Fig. 11b). Further, the Pt-CNT shows high mass activity with 1.6 A mgPt−1, which is 6.2 times higher than the Pt particle site activity. The superior selectivity (over 95%) is demonstrated in a neutral pH electrolyte with a low Cl− concentration which is similar to seawater conditions (Fig. 11c). An obvious peak intensity change is detected in the Cl− containing electrolyte from in situ X-ray absorption near edge structure (XANES) spectra (Fig. 11d), revealing the high selectivity of the atomic Pt to the reactants. To identify the geometric structure of the active species, DFT analysis is employed by comparing all three possible models of PtN4C12, PtN4C10, and PtN2+2C4+4 to PtO2 (Fig. 11e and f). The DFT results show that the PtN4C12 sites with the lowest overpotential (0.09 eV) are thermodynamically more favorable than that of PtO2 and other models (Fig. 11g). Simultaneously, combined with experimental kinetic results and theoretical thermodynamic values, the free energy in each reaction step is presented in Fig. 11h. The results show that the Heyrovsky step is the rate determining step at the overpotential of 0.09 eV. This work first integrates the atomically dispersed strategy for synthesizing the electrocatalyst of CER. The promising results demonstrate the feasibility of breaking the current limited scaling relationship on MMO-based electrocatalysts with evolving chlorine directly on the metal cus site. This work enlightens future research directions for development of high efficiency electrocatalysis under mild conditions, such as neutral seawater electrolysis.
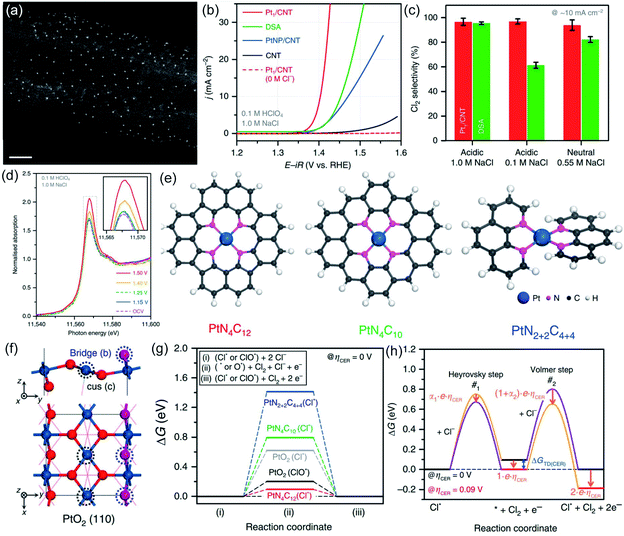 | ||
| Fig. 11 (a) HAADF-STEM of Pt/CNT. (b) Polarization curves of the Pt/CNT, PtNP/CNT, pristine CNT and DSA in 0.1 M HClO4 and 1.0 M NaCl electrolytes. (c) CER selectivity of Pt/CNT and DSA at 10 mA cm−2 in acidic 1.0 M NaCl, 0.1 M NaCl and neutral 0.55 M NaCl. (d) In situ Pt L3-edge XANES spectra of the Pt/CNT catalyst in the 0.1 M HClO4 + 1.0 M NaCl electrolyte. (e) Three possible models (PtN4C12 PtN4C10 PtN2+2C4+4) of the Pt–N4 structure. (f) PtO2 (110) model structure. (g) Free energy diagrams of the PtN4C12 PtN4C10 PtN2+2C4+4 and PtO2 under 0 V overpotential. (h) Free energy diagram of the Heyrovsky and Volmer steps along with the different reaction coordinates at 0 V overpotential (black line) and 0.09 V overpotential (red line). Transition state with a higher free energy pathway (purple line). Decreased free energy pathway (orange line). ΔGTD(CER) is the free energy change of the reaction intermediate at a 0 V overpotential. Reproduced with permission.15 Copyright 2020, Springer Nature. | ||
4.2 Earth-abundant metal-based electrocatalysts
Though the electrocatalytic performance of RuO2 based materials has been improved via various strategies, their dependence on noble metal still remains, which results in economic barriers to further industrial development of these catalysts for the chlor-alkali process. In addition, the overoxidation and depletion of RuO2 in a strongly acidic and highly oxidized environment severely impact the anode stability in a practical chlor-alkali process. Earth-abundant transition metal-based materials with tunable composition and controllable structure are therefore showing promise for completely substituting precious metal catalysts.76 Nevertheless, their inferior electrical conductivity and sluggish reaction kinetics require use of a higher reaction potential. At the same time, the harsh conditions of CER also challenge the transition metal oxide's durability.Over the past years, several strategies such as electronic structure modulation and morphology engineering have been developed to fabricate transition metal-based CER anodes with high electrocatalytic performance.16,17,77 For example, Alavijeh et al. substituted the Ru species with V in the previously developed Ti–Sn–Sb-oxide coated electrode.77 Bulk model calculation reveals that the V substitution can optimize the crystalline structure by forming more zig-zag type chains at the edge (Fig. 12a). All the peaks in the X-ray powder diffraction (XRD) pattern are attributed to the V2O5 and VO2 without any other impurities and confirm the successful V addition to MMOs (Fig. 12b). The Ti–V–Sn–Sb-oxides display a lower onset potential at 1.25 V vs. SHE and high current efficiency (88%) in electrochemical tests, which is comparable to those of Ru-based oxides. The enhanced electrocatalytic activity toward CER is attributed to the V-induced capacitive behavior. To gain a deep insight, projected density of states (PDOS) analysis is performed. The band structure (Fig. 12c) unveils that the bandgap of the as-prepared catalysts is only 1 eV, which is much lower than that of the pristine TiO2 (2.01 eV). The electron density difference (Fig. 12d–f) reveals that the V substitution could decrease the bandgap of MMOs and facilitate electron transfer capacity.
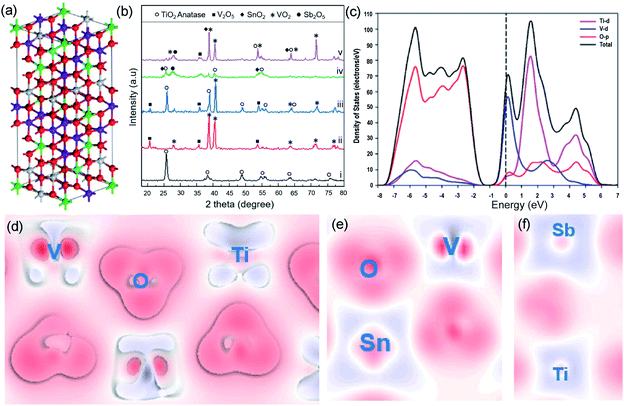 | ||
| Fig. 12 (a) Schematic of the Ti0.35V0.35Sn0.25Sb0.05 structure. Ti, V, O, Sn and Sb atoms are exhibited in grey, purple, red, green, and cyan balls, respectively. (b) XRD patterns of (i) Ti-oxide; (ii) V-oxide; (iii) Ti0.7V0.3-oxides; (iv) Ti0.7Sn0.25Sb0.05-oxides; and (v) Ti0.35V0.35Sn0.25Sb0.05-oxides after annealing. (c) Projected density of states and band structure Ti0.7V0.3. (d) Electron density difference plots of Ti0.7V0.3. (e and f) Electron density difference plots of Ti0.35V0.35 Sn0.25Sb0.05 structures. The depletion of electrons presented by blue areas, and the electron accumulation by red areas. Reproduced with permission.77 Copyright 2020, Elsevier. | ||
Apart from foreign doping, structural tailoring has been demonstrated as an efficient approach to improve the kinetics of transition metal-based electrocatalysts. In general, the limited accessibility and electron transfer capacity of bulk transition metal oxides are the main obstacles to ideal catalytic performance, especially for the interface-determining electrocatalytic process. Therefore, thinning bulk metal oxides into nanosheets/nanobelts could not only create the specifically exposed facet but also facilitates contact between the active site and reactant.78,79 Recently, ultrathin Co3O4 nanobelts (Co3O4 NBAs) have been fabricated and successfully used for attaining high performance in CER.17 The prepared Co3O4 NBAs exhibit uniform 2D belt-like structures, which provide large assessable surface areas for coming into contact with reactants in the electrolyte, as shown in Fig. 13a and b. The as-fabricated nanobelts show the lattice fringes of 0.285 nm (Fig. 13c and d), which is in line with the strongest intensity peaks in XRD (Fig. 13e). Moreover, atomic force microscopy (AFM) demonstrates that the thickness of the nanobelts is nearly 3 times higher than that of the Co3O4 unit cell (Fig. 13f). The as-obtained ultrathin Co3O4 NBAs require a 200 mV overpotential to achieve 10 mA cm−2 current density with a small Tafel slope of 66 mV dec−1. The FE is approximately 90% after half an hour of operation, rivalling to the RuO2. The ECSA result shows that the double-layer capacitance of the ultrathin Co3O4 is 37.9 mF cm−2, which is 5 times higher than that of RuO2 particles, suggesting higher catalytic site exposure of the nanobelts. Further, the lower charge transfer resistance of the ultrathin Co3O4 is revealed from electrochemical impedance spectroscopy (EIS) measurements, demonstrating better conductivity than the RuO2. This work demonstrates that the structure design could effectively regulate the chemical properties of transition metal oxides to enable high catalysis performance.
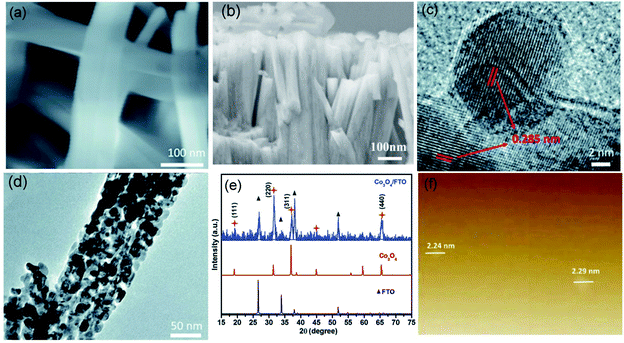 | ||
| Fig. 13 (a and b) SEM images of Co3O4 nanobelt morphologies on the fluorine doped tin oxide (FTO) substrate. (c and d) TEM images of Co3O4 NBAs on the FTO substrate. (e) XRD comparison of the Co3O4/FTO, Co3O4 and FTO. (f) AFM images of the Co3O4. Reproduced with permission.17 Copyright 2018, Royal Society of Chemistry. | ||
Apart from the activity, durability is another key parameter related to catalytic ability.10 As most transition metal oxides lack stability under acidic operating conditions, few studies have shown satisfactory durability in long-term CER electrocatalysis. Therefore, it remains a great challenge to find appropriate materials or design strategies that make catalysts stable in a strong acid environment. Recently, cobalt antimonates (CoSb2Ox) were reported to have exceptional stability and activity in CER.16 The high CER activity has no obvious degradation even after 250 h long-term electrocatalysis (Fig. 14a), which is much better than that of RuTiOx under identical conditions. The initial CoSb2Ox delivers a current density of 100 mA cm−2 with the least potential at 1.864 V vs. SHE, compared to other transition metal antimony oxides (TMA), e.g. NiSb2Ox, MnSb2Ox shown in Fig. 14b. The ICP test reveals that the dissolved Co detected after the stability test is less than 0.5%, further demonstrating its acidic corrosion resistance, which is verified by the X-ray photoelectron spectroscopy (XPS) measurement (Fig. 14c and d). The as-prepared CoSb2Ox presents high current efficiencies around 97.4%. These studies elucidate that it is feasible to prepare high-performance CER catalysts by using cost-effective transition metals. However, the source of the underlying mechanism enhancement is still unclear, which makes further research highly desirable.
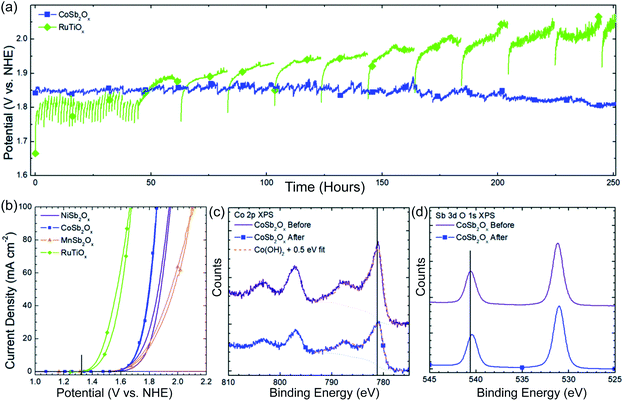 | ||
| Fig. 14 (a) 250 h stability test at 100 mA cm−2 current density for CoSb2Ox and RuTiOx in 4.0 M pH = 2.0 NaCl solution. (b) CV curves of initial electrochemical behavior of NiSb2Ox, CoSb2Ox, MnSb2Ox, and RuTiOx in pH = 2.0, 4.0 M NaCl solution. Vertical black line in the figure indicates the thermodynamic potential for chlorine evolution in 4.0 M NaCl. (c) Co 2p XPS spectra of CoSb2Ox before and after electrochemical operation. (d) Sb 2p XPS spectra of CoSb2Ox before and after electrochemical operation. Reproduced with permission.16 Copyright 2019, Royal Society of Chemistry. | ||
4.3 Metal-free carbon-based electrocatalysts
Presently, metal-based catalysts are the most widely used catalysts in CER and many other catalytic processes including the oxygen reduction/evolution reaction, the hydrogen evolution reaction and so on.19,80 However, metal-based catalysts, especially based on noble metals, often suffer from multiple disadvantages, such as high cost, poor durability, low selectivity, and sometimes detrimental environmental effects. Since metal-free vertically aligned nitrogen-doped CNTs have been reported for oxygen reduction reaction in 2009, exhibiting excellent catalytic ability around 3 times higher than the benchmark Pt/C electrode,81 substantial studies have been conducted in developing low-cost, efficient, carbon-based metal-free catalysts for renewable energy technologies and other applications. Essentially speaking, carbon materials formed by strong covalent bonding between carbon atoms possess numerous unique physical and chemical properties including controllable dimension, ease of accessibility, large surface area, excellent conductivity, high porosity, and abundant defects.18,19 These features provide an ideal platform for the design of efficient CER catalysts. Besides, plenty of efficient techniques for designing metal-free catalysts are available including ball milling, chemical vapor deposition, and chemical modification. Therefore, fabrication of novel metal-free carbon-based materials holds promise for achieving a breakthrough for CER.The earliest used metal-free CER catalyst was graphite which dates back to 1950.82 Though carbon-based materials have good corrosion resistance in strong acidic or alkaline solutions under static conditions, the massive graphite electrode with large overpotential results in a serious self-oxidation process at high potential. Even though new graphite electrodes possess excellent catalytic activity for chlorine evolution, severe surface oxidation still occurs, leading to the overpotential gradually increasing to 400–500 mV after 10 h electrocatalysis. In other words, the limited service life of the graphite electrode is a great challenge for practical application in the chlor-alkali process. To eliminate the drawbacks of the graphite electrode, substantial efforts have been made in the past years. As the most popular strategy for fabricating carbon-based metal-free catalysts, heteroatom doping was employed recently.19 Boron-doped diamond electrodes (BDD) synthesized by hot filament chemical vapor deposition (HFCVD) show exceptional stability and higher selectivity than pure graphite in dilute chlorine media (pH = 3.5).83 The enhanced CER is explored by using a series of electrochemical characterization studies including CV and Tafel analysis. The CV curves of the BDD electrode measured in 1 M NaCl solution (pH = 3.5) show obvious peaks at approximately 1.76 V vs. SHE. It is speculated that some degree of oxidation occurs on the catalyst surface after the activation treatment, opening the possibility for protonation of surface groups in acidic electrolytes which may be related to the source of activity of the carbon-based material in CER. The dependence of the resting potential on the solution pH for the diamond electrodes studied is consistent with other studies.84 Examination of the electrode wettability provides qualitative evidence of the introduction of hydrophilic groups on the BDD surface. Though the proposed CER mechanism is consistent with the electrochemical data, more research is needed to identify the formation of intermediates during CER using in situ X-ray spectra such as Raman and Fourier-transform infrared spectroscopy (FT-IR).
5. Conclusions and perspectives
This article firstly reviewed the history of the chlor-alkali process by presenting the key technical improvements in this field. Then, the fundamental understanding of the CER mechanism was updated. Afterwards, we reviewed recent advances in metal- and metal-free catalysts for electrocatalytic CER. Electrocatalyst performances under defined operating conditions are summarized in Table 1. Most of the explored noble metal-based catalysts could deliver a lower overpotential and higher selectivity toward CER in an acidic, concentrated Cl− electrolyte, while earth abundant transition-metal and metal-free based electrocatalysts still suffer from large overpotential issues. Despite the substantial progress achieved in designing efficient and economic catalysts, the currently explored catalytic materials still cannot meet the standard required for practical applications. Therefore, future research effort with regard to the development of electrocatalytic chlorine oxidation should focus on the following aspects.| Electrocatalysts | Operating conditions | Overpotential (mV) @ 10 mA cm−2 | Current efficiency (%) | Ref. |
|---|---|---|---|---|
| a NA, not available; NP, nanoparticle; NB, nanobelt; NSA, nanosheet array; TNA, titanium nanoarray; TNT, titanium nanotube; FTO, fluorine-doped tin oxide; CNT, carbon nanotube. | ||||
| RuO 2 based mixed metal oxide | ||||
| Flower-like RuO2–TiO2 | pH = 3, 5.0 M NaCl | 44 | NA | 50 |
| RuO2 NPs/TiO2 NBs | pH = 3.1, saturated NaCl | 70 | 90.3 | 48 |
| RuO2/TNA | pH = 7, 0.1 M NaCl, 25 °C | 40 | NA | 47 |
| RuO2@TiO2 NSAs | Saturated NaCl, pH = 2 | 72.2 | 90 | 71 |
| (Ru0.3Ti0.7)-TNTs | 5 M NaCl | 124 | NA | 94 |
| Mesoporous 15 wt% RuO2/TiO2 | pH = 3.0, 4.0 M NaCl, 40 °C | 220 | NA | 73 |
![[thin space (1/6-em)]](https://www.rsc.org/images/entities/char_2009.gif) |
||||
| IrO 2 based mixed metal oxide | ||||
| IrO2–TiO2 NSA | Saturated NaCl (pH = 2) | 44 | 95.8 | 95 |
| Mesoporous 15 wt% IrO2/TiO2 | pH = 3.0, 4.0 M NaCl, 40 °C | 240 | NA | 73 |
| Ti/Ir0.8Nd0.2Ox | 5 M NaCl (pH = 2) | 60 | 91.03 | 96 |
![[thin space (1/6-em)]](https://www.rsc.org/images/entities/char_2009.gif) |
||||
| RuO 2 –IrO 2 mixed metal oxide | ||||
| Commercial DSA Ru–Ti–Ir oxide/Ti (Siontech, Korea) | pH = 0.9, 0.1 M HClO4 + 1.0 M NaCl, 25 °C | 105 | 95.5 | 15 |
| Ru–Ti–Ir oxide/Ti | pH = 2, 4.0 M NaCl | 125.2 | 97 | 40 |
| Mesoporous 15 wt% (Ru–Ir)/TiO2 | pH = 3.0, 4.0 M NaCl, 40 °C | 140 | NA | 73 |
![[thin space (1/6-em)]](https://www.rsc.org/images/entities/char_2009.gif) |
||||
| RuO 2 –TiO 2 –SnO 2 mixed metal oxide | ||||
| Crack free Ru0.3Sn0.7O2 | pH = 3, 3.5 M NaCl, 80 °C | 30 | NA | 45 |
| Ti/RuO2–Sb2O5–SnO2 | 0.5 M Na2SO4 solution + seawater | 120 | 80.0 to 90.4 | 11 |
| Ti/RuO2–IrO2–Sb2O5–SnO2 | Seawater | 75 | 71.2 to 86.7 | 12 |
| (Ru0.3Ti0.34Sn0.3Sb0.06) O2–TNTs | 5 M NaCl, pH = 2 25 °C | 110 | NA | 13 |
| RuO2/lignin-based carbon electrode | Saturated NaCl | 64 | NA | 43 |
![[thin space (1/6-em)]](https://www.rsc.org/images/entities/char_2009.gif) |
||||
| Pt based electrocatalysts | ||||
| Pt1/CNT | pH = 0.9, 0.1 M HClO4 + 1.0 M NaCl, 25 °C | 50 | 97.1 | 15 |
| PtNP/CNT | pH = 0.9, 0.1 M HClO4 + 1.0 M NaCl, 25 °C | 70 | 98.6 | 15 |
![[thin space (1/6-em)]](https://www.rsc.org/images/entities/char_2009.gif) |
||||
| Earth-abundant transition-metal based electrocatalysts | ||||
| NiSb2Ox | pH = 2.0, 4.0 M NaCl | 450 | 96 | 16 |
| CoSb2Ox | pH = 2.0, 4.0 M NaCl | 430 | 97 | 16 |
| MnSb2Ox | pH = 2.0, 4.0 M NaCl | 470 | 89.9 | 16 |
| Co3O4/FTO | pH = 3.1, saturated NaCl | 200 | 90 | 17 |
| Ti0:35 V0:35 Sn0:25 Sb0.05-Oxide | pH ∼ 2, 5 M NaCl + 0.01 M HCl | 987 | 88 | 77 |
![[thin space (1/6-em)]](https://www.rsc.org/images/entities/char_2009.gif) |
||||
| Non-metal based electrocatalysts | ||||
| Boron doped diamond | pH = 3.5, 1 M (NaCl + NaClO4 + HClO4) | 1.684 V vs. SHE to achieve 100 μA cm−2 | 65 | 83 |
5.1 Catalyst design
Traditional metal oxides often suffer from relatively low electrical conductivity, small surface area and poor resistance in harsh electrolytes. Hence, they sometimes are inferior to state-of-the-art DSA, seriously limiting their practical applications. Accordingly, it is highly desirable to develop novel nanomaterials with high activity, excellent selectivity, and long-term stability. As a class of emerging porous materials, metal–organic frameworks (MOFs) are one of the ideal platforms for efficient CER catalyst fabrication owing to their large specific surface area, periodic atom arrangement and adjustable composition. For instance, different lengths of ligands could tune the stability of MOFs for various electrolyte conditions. Shorter ligands provide high stability in alkaline environments such as terephthalic acid, while longer ligands (e.g. 4,4′-diiodo-2,2′,5,5′- tetramethyl-1,1′-biphenyl and hexaaminobenzene) greatly enhance the acid and salinity resistance.78,85,86 Further, some functional groups such as –NH2 or –SO3 have been demonstrated to effectively modify the MOF backbone, leading to a higher electrocatalytic selectivity. Unfortunately, MOFs for CER have not been explored. SACs have also shown excellent performance in many advanced chemical conversion reactions due to their unique physicochemical properties.87 Most recently, atomically dispersed Pt catalysts have been prepared and successfully applied for CER. High atomic efficiency and exceptional selectivity have been achieved in comparison to Pt nanoparticles. However, development of SACs for chlorine oxidation is still in its infancy stage. More research on the design of carbon-supported SACs, especially transition metal-based SACs, is anticipated to achieve highly efficient CER. Apart from metal-based electrocatalysts, metal-free carbon-based materials are also promising to dominate the chlor-alkali process again, like they once did. In recent decades, these materials were supplanted by DSAs, mainly because of corrosion problems in harsh environments. However, huge progress in the synthesis of carbon-based materials has been witnessed over the last ten years and various strategies have been developed to improve the stability of carbon materials. In addition, it is well established that slower mass transfer and bubble release rates are the obstacles to maintain high activity of carbon electrodes over long operating times. So, we believe that optimizing the structure of carbon-based materials (e.g. surface area, pore size and porosity) is promising for addressing the durability of carbon electrodes.5.2 Fundamental understanding of the catalytic mechanism
In spite of numerous studies aimed at unveiling the catalytic mechanism, the exact reaction pathway for CER has still not been fully investigated, and structure–performance correlations are also unclear. To date, fundamental studies mainly rely on computational calculations. Considering the large overpotential and strong acidic environment, metal or carbon materials structure may suffer from dynamic surface evolution processes such as composition dissolution, atomic rearrangement and inner porous structure redistribution. Therefore, more experimental evidence is needed to identify the structure of the real active species and then propose the possible reaction mechanism using computational calculations. To this end, X-ray absorption spectrum (XAS) analysis involving extended X-ray absorption fine structure (EXAFS) and XANES is required for identification of the geometric and electronic structures of catalysts. Also, in situ FTIR and Raman spectroscopy studies are strongly recommended for detecting intermediates during the chlorine oxidation process to better disclose catalytic mechanisms and the possible synergistic effects. Findings from computational models coupled with modern techniques such as operando XAS or in situ HRTEM could be more widely utilized to effectively guide experimental design in the future.5.3 Industrial technical revolution
Apart from electrocatalyst design strategies and mechanism study, industrial technical revolution is also crucial for promoting current membrane-based reactor system efficiency. One of the challenges in the current chlor-alkali process is the pH difference between the anodic and cathodic chambers. Along with Cl− discharge at the anode, the water will be discharged to form OH− at the cathode. To maintain the acidic environment in the anodic chamber, there is a commonly used cation exchange membrane that prohibits negative ion migration. While the selective membrane could prompt chlorine oxidation, nevertheless, it causes accumulation of OH− in the cationic chamber. Then the produced ions seriously affect the pH environment of the cell and corrode the membrane, leading to rapid activity degradation. To address these technical issues, developing a new integrated reactor, composed of anion/cation exchange membranes, a gas diffusion electrode (GDE) and a porous solid electrolyte is a promising strategy. The gas diffusion electrode with excellent capacities for mass transfer and diffusion has already been successfully applied in hydrogen peroxide production and CO2 reduction.88,89 Meanwhile, porous solid electrolytes are successfully used in lithium-ion batteries due to their adjustable pores size and designable functionality. The Na+ and OH− could pass through the cathodic and anodic membranes, respectively, into the solid electrolyte to form NaOH. With the aid of the porosity of the solid electrolyte, the formed NaOH can be discharged along with water from the top of the solid electrolyte and out of the device. Such an ingenious design should eliminate performance degradation caused by NaOH accumulation, facilitate the traditional alkaline enrichment process and lower the production cost.5.4 Coupling the process to other electrocatalytic processes
In addition to direct chlorine gas production, it is of great promise to use the generated chlorine as a redox mediator for combining with other electrocatalytic reactions, such as nitrogen reduction and CO2 reduction.90–92 The continuously produced chlorine from anodic CER is able to serve as a feedstock for oxidation in subsequent reactions, which simplifies complex chemical synthesis processes, improves desired product purity and provides economic benefits. For example, the generated Cl2 can be combined with ethylene and water to form 2-chloroethanol, and then further reacted with OH− from cathodic HER to obtain C2H4O.91 Therefore, coupling the chlor-alkali process with other electrocatalytic processes holds great potential for future energy conservation and storage. Further CER electrocatalyst design research and mechanism studies are necessary for broadening practical chloride oxidation applications.5.5 Chlorine evolution through seawater electrolysis
Even though the current chlor-alkali process is a mature industry, the raw materials still rely on use of a saturated NaCl electrolyte, leading to additional energy consumption for the thermal desalination process. Seawater, as a highly abundant feedstock, attracts increasing attention as an ideal electrolyte to obtain chlorine and hydrogen in a more economical, sustainable and energy-efficient manner. However, the current practical electrode for seawater electrolysis suffers from low selectivity in a limited chloride environment, activity degradation and inferior stability largely due to the numerous impurities in natural seawater.93 Efficient and stable electrocatalysts are required to improve CER performance as well as expand the electrode service life. In the past years, many design strategies have been reported to improve the electrocatalyst performance in seawater electrolysis such as constructing porous structures to accelerate the mass transfer and bubble removal, employing a protective layer to selectively repel undesired ions, and modifying the surface wettability to control the water adsorption ability. Continuous research in this exciting field should be conducive to a green and renewable chlorine production process. Nevertheless, much effort is necessary to explore more powerful as well as high selectivity electrocatalysts.Author contributions
S. Z. proposed the outline; Y. W. and Y. L. prepared the manuscript; S. Z., D. W., Z. T. reviewed the manuscript.Conflicts of interest
There are no conflicts to declare.Acknowledgements
S. Z. acknowledges financial support from the FH Loxton fellowship of the University of Sydney.References
-
T. F. O'Brien, T. V. Bommaraju and F. Hine, Handbook of Technology, Springer, 2005, vol. 1 Search PubMed
.
-
P. Schmittinger, T. Florkiewicz, L. C. Curlin, B. Lüke, R. Scannell, T. Navin, E. Zelfel and R. Bartsch, Ullmann's Encyclopedia of Industrial Chemistry, Wiley-VCH Verlag GmbH & Co. KGaA, Weinheim, Germany, 2012 Search PubMed
.
-
World Chlorine Council, Sustainable Progress, World Chlorine Council, https://worldchlorine.org/wp-content/uploads/2020/09/2020-WCC-Sustainability-Report.pdf, accessed March 2021 Search PubMed
.
- R. Chen, V. Trieu, B. Schley, H. Natter, J. Kintrup, A. Bulan, R. Weber and R. Hempelmann, Z. Phys. Chem., 2013, 227, 651–666 Search PubMed
.
- S. Trasatti, Electrochim. Acta, 2000, 45, 2377–2385 Search PubMed
.
- K. S. Exner, ChemElectroChem, 2019, 6, 3401–3409 Search PubMed
.
- K. S. Exner, J. Anton, T. Jacob and H. Over, Electrochim. Acta, 2014, 120, 460–466 Search PubMed
.
- K. S. Exner, J. Anton, T. Jacob and H. Over, Angew. Chem., 2014, 126, 11212–11215 Search PubMed
.
- K. S. Exner, J. Anton, T. Jacob and H. Over, Electrocatalysis, 2015, 6, 163–172 Search PubMed
.
- R. K. Karlsson and A. Cornell, Chem. Rev., 2016, 116, 2982–3028 Search PubMed
.
- S. Chen, Y. Zheng, S. Wang and X. Chen, Chem. Eng. J., 2011, 172, 47–51 Search PubMed
.
- S. Wang, H. Xu, P. Yao and X. Chen, Electrochemistry, 2012, 80, 507–511 Search PubMed
.
- K. Xiong, Z. Deng, L. Li, S. Chen, M. Xia, L. Zhang, X. Qi, W. Ding, S. Tan and Z. Wei, J. Appl. Electrochem., 2013, 43, 847–854 Search PubMed
.
- K. Macounová, M. Makarova, J. Jirkovský, J. Franc and P. Krtil, Electrochim. Acta, 2008, 53, 6126–6134 Search PubMed
.
- T. Lim, G. Y. Jung, J. H. Kim, S. O. Park, J. Park, Y.-T. Kim, S. J. Kang, H. Y. Jeong, S. K. Kwak and S. H. Joo, Nat. Commun., 2020, 11, 412 Search PubMed
.
- I. A. Moreno-Hernandez, B. S. Brunschwig and N. S. Lewis, Energy Environ. Sci., 2019, 12, 1241–1248 Search PubMed
.
- X. Zhu, P. Wang, Z. Wang, Y. Liu, Z. Zheng, Q. Zhang, X. Zhang, Y. Dai, M.-H. Whangbo and B. Huang, J. Mater. Chem. A, 2018, 6, 12718–12723 Search PubMed
.
- S. Zhao, X. Lu, L. Wang, J. Gale and R. Amal, Adv. Mater., 2019, 31, 1805367 Search PubMed
.
- S. Zhao, D. W. Wang, R. Amal and L. Dai, Adv. Mater., 2019, 31, 1801526 Search PubMed
.
- J. I. Otashu and M. Baldea, Comput. Chem. Eng., 2019, 121, 396–408 Search PubMed
.
- J. Crook and A. Mousavi, Environ. Forensics, 2016, 17, 211–217 Search PubMed
.
- S. Lakshmanan and T. Murugesan, Clean Technol.
Environ. Policy, 2014, 16, 225–234 Search PubMed
.
- M. Neghab, M. Amin Norouzi, A. Choobineh, M. Reza Kardaniyan and J. Hassan Zadeh, Int. J. Occup. Saf. Ergon., 2012, 18, 97–106 Search PubMed
.
- D. Raldúa, S. Díez, J. M. Bayona and D. Barceló, Chemosphere, 2007, 66, 1217–1225 Search PubMed
.
- M. Paidar, V. Fateev and K. Bouzek, Electrochim. Acta, 2016, 209, 737–756 Search PubMed
.
- F. Franco, J. Prior, S. Velizarov and A. Mendes, Appl. Sci., 2019, 9, 284 Search PubMed
.
- I. Sohrabnejad-Eskan, A. Goryachev, K. S. Exner, L. A. Kibler, E. J. Hensen, J. P. Hofmann and H. Over, ACS Catal., 2017, 7, 2403–2411 Search PubMed
.
- H. B. Beer, J. Electrochem. Soc., 1980, 127, 303C Search PubMed
.
- C. Comninellis and G. Vercesi, J. Appl. Electrochem., 1991, 21, 335–345 Search PubMed
.
- G. Foti, C. Mousty, V. Reid and C. Comninellis, Electrochim. Acta, 1998, 44, 813–818 Search PubMed
.
- H. A. Hansen, I. C. Man, F. Studt, F. Abild-Pedersen, T. Bligaard and J. Rossmeisl, Phys. Chem. Chem. Phys., 2010, 12, 283–290 Search PubMed
.
- T. Hepel, F. H. Pollak and W. E. O'Grady, J. Electrochem. Soc., 1986, 133, 69 Search PubMed
.
- S. Trasatti, Electrochim. Acta, 1987, 32, 369–382 Search PubMed
.
- D. Kuo, H. Paik, J. N. Nelson, K. M. Shen, D. G. Schlom and J. Suntivich, J. Chem. Phys., 2019, 150, 041726 Search PubMed
.
- V. Panić, A. Dekanski, V. Mišković-Stanković, S. Milonjić and B. Nikolić, J. Electroanal. Chem., 2005, 579, 67–76 Search PubMed
.
- H. Over, Chem. Rev., 2012, 112, 3356–3426 Search PubMed
.
- S. Cherevko, S. Geiger, O. Kasian, N. Kulyk, J.-P. Grote, A. Savan, B. R. Shrestha, S. Merzlikin, B. Breitbach and A. Ludwig, Catal. Today, 2016, 262, 170–180 Search PubMed
.
- Z. Yi, C. Kangning, W. Wei, J. Wang and S. Lee, Ceram. Int., 2007, 33, 1087–1091 Search PubMed
.
- L. Deng, Y. Liu, G. Zhao, J. Chen, S. He, Y. Zhu, B. Chai and Z. Ren, J. Electroanal. Chem., 2019, 832, 459–466 Search PubMed
.
- A. R. Zeradjanin, N. Menzel, W. Schuhmann and P. Strasser, Phys. Chem. Chem. Phys., 2014, 16, 13741–13747 Search PubMed
.
- S. Hoseinieh, F. Ashrafizadeh and M. Maddahi, J. Electrochem. Soc., 2010, 157, E50 Search PubMed
.
- R. Kötz and S. Stucki, Electrochim. Acta, 1986, 31, 1311–1316 Search PubMed
.
- M. Chi, B. Luo, Q. Zhang, H. Jiang, C. Chen, S. Wang and D. Min, Ind. Crops Prod., 2021, 159, 113088 Search PubMed
.
- V. Petrykin, K. Macounova, J. Franc, O. Shlyakhtin, M. Klementova, S. Mukerjee and P. Krtil, Chem. Mater., 2011, 23, 200–207 Search PubMed
.
- R. Chen, V. Trieu, A. R. Zeradjanin, H. Natter, D. Teschner, J. Kintrup, A. Bulan, W. Schuhmann and R. Hempelmann, Phys. Chem. Chem. Phys., 2012, 14, 7392–7399 Search PubMed
.
- M. Goudarzi and M. Ghorbani, J. Sol-Gel Sci. Technol., 2015, 73, 332–340 Search PubMed
.
- J. Kim, C. Kim, S. Kim and J. Yoon, J. Ind. Eng. Chem., 2018, 66, 478–483 Search PubMed
.
- J. Huang, M. Hou, J. Wang, X. Teng, Y. Niu, M. Xu and Z. Chen, Electrochim. Acta, 2020, 339, 135878 Search PubMed
.
- V. Panić, A. Dekanski, S. K. Milonjić, R. Atanasoski and B. Ž. Nikolić, Colloids Surf., A, 1999, 157, 269–274 Search PubMed
.
- K. Xiong, L. Peng, Y. Wang, L. Liu, Z. Deng, L. Li and Z. Wei, J. Appl. Electrochem., 2016, 46, 841–849 Search PubMed
.
- C. Yang and Z. Y. Zhao, J. Am. Ceram. Soc., 2019, 102, 4976–4989 Search PubMed
.
-
H. B. Beer, US Pat., 1147442, 1965 Search PubMed
.
-
H. B. Beer, US Pat., 1195871, 1970 Search PubMed
.
- A. Kuhn and C. Mortimer, J. Electrochem. Soc., 1973, 120, 231 Search PubMed
.
- T. Arikawa, Y. Murakami and Y. Takasu, J. Appl. Electrochem., 1998, 28, 511–516 Search PubMed
.
- R. K. Karlsson, H. A. Hansen, T. Bligaard, A. Cornell and L. G. Pettersson, Electrochim. Acta, 2014, 146, 733–740 Search PubMed
.
- J. Gaudet, A. Tavares, a. S. Trasatti and D. Guay, Chem. Mater., 2005, 17, 1570–1579 Search PubMed
.
- Y. Zhang, P. He, L. Jia, T. Zhang, H. Liu, S. Wang, C. Li, F. Dong and S. Zhou, Chemosphere, 2019, 224, 707–715 Search PubMed
.
- S. Chen, L. Zhou, T. Yang, Q. He, P. Zhou, P. He, F. Dong, H. Zhang and B. Jia, Chemosphere, 2020, 261, 128201 Search PubMed
.
- B. Zhang, Y. Tian, J. Zhang and W. Cai, Mater. Lett., 2011, 65, 1204–1206 Search PubMed
.
- J. Santos-Pena, T. Brousse, L. Sanchez, J. Morales and D. Schleich, J. Power Sources, 2001, 97, 232–234 Search PubMed
.
- V. Petrykin, K. Macounová, M. Okube, S. Mukerjee and P. Krtil, Catal. Today, 2013, 202, 63–69 Search PubMed
.
- K. Macounová, M. Makarova, J. Franc, J. Jirkovský and P. Krtil, Electrochem. Solid-State Lett., 2008, 11, F27 Search PubMed
.
- S. Saha, K. Kishor and R. G. Pala, ECS Trans., 2018, 85, 201 Search PubMed
.
- D. F. Abbott, V. Petrykin, M. Okube, Z. Bastl, S. Mukerjee and P. Krtil, J. Electrochem. Soc., 2014, 162, H23 Search PubMed
.
- V. Petrykin, K. Macounova, M. Okube, J. Franc and P. Krtil, J. Phys., 2009, 190, 012166 Search PubMed
.
- Y. Yang, Y. Yang, Z. Pei, K.-H. Wu, C. Tan, H. Wang, L. Wei, A. Mahmood, C. Yan and J. Dong, Matter, 2020, 3, 1442–1476 Search PubMed
.
- S. Zhao, D. Zhang, S. Jiang, Y. Cui, H. Li, J. Dong, Z. Xie, D.-W. Wang, R. Amal and Z. Xia, Nano Res., 2021, 1–8 Search PubMed
.
- C. Hu, J. Qu, Y. Xiao, S. Zhao, H. Chen and L. Dai, ACS Cent. Sci., 2019, 5, 389–408 Search PubMed
.
- X. Yan, Y. Jia and X. Yao, Chem. Soc. Rev., 2018, 47, 7628–7658 Search PubMed
.
- M. Jiang, H. Wang, Y. Li, H. Zhang, G. Zhang, Z. Lu, X. Sun and L. Jiang, Small, 2017, 13, 1602240 Search PubMed
.
- S. Trasatti, Electrochim. Acta, 1991, 36, 225–241 Search PubMed
.
- N. Menzel, E. Ortel, K. Mette, R. Kraehnert and P. Strasser, ACS Catal., 2013, 3, 1324–1333 Search PubMed
.
- T. Zhang, Z. U. Rahman, N. Wei, Y. Liu, J. Liang and D. Wang, Nano Res., 2017, 10, 1021–1032 Search PubMed
.
- A. Wang, J. Li and T. Zhang, Nat. Rev. Chem., 2018, 2, 65–81 Search PubMed
.
- Z. Chen, D. Higgins, A. Yu, L. Zhang and J. Zhang, Energy Environ. Sci., 2011, 4, 3167–3192 Search PubMed
.
- M. M. Alavijeh, S. Habibzadeh, K. Roohi, F. Keivanimehr, L. Naji and M. R. Ganjali, Chem. Eng. J., 2020, 127785 Search PubMed
.
- S. Zhao, Y. Wang, J. Dong, C.-T. He, H. Yin, P. An, K. Zhao, X. Zhang, C. Gao and L. Zhang, Nat. Energy, 2016, 1, 16184 Search PubMed
.
- H. Yin, S. Zhao, K. Zhao, A. Muqsit, H. Tang, L. Chang, H. Zhao, Y. Gao and Z. Tang, Nat. Commun., 2015, 6, 6430 Search PubMed
.
- H. Jiang, J. Gu, X. Zheng, M. Liu, X. Qiu, L. Wang, W. Li, Z. Chen, X. Ji and J. Li, Energy Environ. Sci., 2019, 12, 322–333 Search PubMed
.
- K. Gong, F. Du, Z. Xia, M. Durstock and L. Dai, Science, 2009, 323, 760–764 Search PubMed
.
- L. Janssen and J. Hoogland, Electrochim. Acta, 1969, 14, 1097–1108 Search PubMed
.
- S. Ferro, A. De Battisti, I. Duo, C. Comninellis, W. Haenni and A. Perret, J. Electrochem. Soc., 2000, 147, 2614 Search PubMed
.
- T. Arikado, C. Iwakura and H. Tamura, Electrochim. Acta, 1978, 23, 9–15 Search PubMed
.
- D. Feng, T. Lei, M. R. Lukatskaya, J. Park, Z. Huang, M. Lee, L. Shaw, S. Chen, A. A. Yakovenko and A. Kulkarni, Nat. Energy, 2018, 3, 30–36 Search PubMed
.
- S. Zhao, C. Tan, C.-T. He, P. An, F. Xie, S. Jiang, Y. Zhu, K.-H. Wu, B. Zhang and H. Li, Nat. Energy, 2020, 5, 881–890 Search PubMed
.
- Y. Wang, F.-L. Hu, Y. Mi, C. Yan and S. Zhao, Chem. Eng. J., 2020, 127135 Search PubMed
.
- C. Xia, P. Zhu, Q. Jiang, Y. Pan, W. Liang, E. Stavitski, H. N. Alshareef and H. Wang, Nat. Energy, 2019, 4, 776–785 Search PubMed
.
- C. Xia, Y. Xia, P. Zhu, L. Fan and H. Wang, Science, 2019, 366, 226–231 Search PubMed
.
- M. Chung, K. Jin, J. S. Zeng and K. Manthiram, ACS Catal., 2020, 10, 14015–14023 Search PubMed
.
- W. R. Leow, Y. Lum, A. Ozden, Y. Wang, D.-H. Nam, B. Chen, J. Wicks, T.-T. Zhuang, F. Li and D. Sinton, Science, 2020, 368, 1228–1233 Search PubMed
.
- S. Garcia-Segura, M. Lanzarini-Lopes, K. Hristovski and P. Westerhoff, Appl. Catal., B, 2018, 236, 546–568 Search PubMed
.
- F. Zhang, L. Yu, L. Wu, D. Luo and Z. Ren, Trends Chem., 2021, 3(6), 485–498 Search PubMed
.
- K. Xiong, Z. Deng, L. Li, S. Chen, M. Xia, L. Zhang, X. Qi, W. Ding, S. Tan and Z. Wei, J. Appl. Electrochem., 2013, 43, 847–854 Search PubMed
.
- Y. Wang, Y. Xue and C. Zhang, Small, 2021, 17, 2006587 Search PubMed
.
- J. u, H. Xu, X. Feng, L. Lei, Y. He and X. Zhang, ChemElectroChem, 2021, 8, 1204 Search PubMed
.
Footnote |
| † These authors contributed equally. |
| This journal is © The Royal Society of Chemistry 2021 |


