 Open Access Article
Creative Commons Attribution 3.0 Unported Licence
Engineering aspects of FlowNMR spectroscopy setups for online analysis of solution-phase processes†
Asad
Saib
 ab,
Alejandro
Bara-Estaún
 ab,
Owen J.
Harper
 abc,
Daniel B. G.
Berry
 ab,
Isabel A.
Thomlinson
 abc,
Rachael
Broomfield-Tagg
 ab,
John P.
Lowe
 ab,
Catherine L.
Lyall
 ab and
Ulrich
Hintermair
 *abc
*abc
aDepartment of Chemistry, University of Bath, Claverton Down, BA2 7AY Bath, UK. E-mail: u.hintermair@bath.ac.uk
bDynamic Reaction Monitoring Facility, University of Bath, Claverton Down, BA2 7AY Bath, UK
cCentre for Sustainable & Circular Technologies, University of Bath, Bath BA2 7AY, UK
First published on 2nd August 2021
Abstract
Online analysis and monitoring of solution phase chemistry by way of nuclear magnetic resonance spectroscopy on a recirculating sample from an external reaction vessel (FlowNMR) has proven to be a valuable tool for understanding the dynamic behaviour of complex solution-phase systems in real time. A variety of flow cells and setups have been used at both low and high magnetic field strengths for various applications, and the choice of materials, dimensions and components can have a profound impact on the quality and relevance of the data obtained. Here we review some fundamental engineering aspects of FlowNMR setups to help avoid common pitfalls and work towards establishing good practice quality guidelines (GxP) for FlowNMR investigations in academia and industry.
Introduction
High-resolution NMR spectroscopy is a powerful analytical technique due to its high specificity, rich information content, and quantitative, non-invasive nature.1–3 These attributes make it particularly useful for the analysis of complex mixtures and dynamic molecular systems that are difficult to analyse by alternative methods.4,5 Applications include virtually all fields of solution phase chemistry such as molecular organic and inorganic synthesis, homogeneous catalysis,6 supramolecular7 and polymer chemistry,8 soft materials,9 medicinal10–12 and food chemistry13,14 as well as metabolomics15 and biochemistry.16,17 However, hardware restrictions imposed by the large magnets required to generate stable, homogeneous fields allowing NMR spectroscopy to be performed on carefully equilibrated aliquots of <1 mL make it difficult to use NMR more widely for analysing solution phase processes in their native environments. Mimicking reaction conditions in a sealed sample tube inside the NMR spectrometer can give some insight into the processes in question, but the inaccessibility of the sample and lack of control over heat- and mass-transport mean that the information obtained from isolated tube experiments may not be truly representative of the system under native conditions.18 These deviations are particularly relevant to kinetic investigations reliant on obtaining accurate concentration profiles, and may even lead to a different speciation of the system under the restrictions of small, static sample tubes.18–20 The recent development and commercialisation of benchtop NMR spectrometers based on stable (non-cryogenic) perma-magnets have made NMR spectroscopy more versatile for remote applications,21–24 but the aforementioned sampling restrictions apply all the same at lower field25 in addition to the inherent limitations of lower sensitivity and reduced spectral resolution compared to high-field instruments.FlowNMR spectroscopy (or online NMR spectroscopy as it sometimes referred to) is a simple adaption that alleviates the aforementioned sampling limitations by way of a flow system that continuously circulates an aliquot from an external reaction vessel to the active region of an NMR spectrometer.4 In this way any changes in sample composition occurring in the external vessel, either as a result of a chemical reaction, biological process or physical change triggered by purposely altered conditions, can be followed and analysed by NMR spectroscopy in real time. Note that the term ‘flow’ in FlowNMR refers to the sample transport, and either batch or continuous flow processes may be investigated with the technique. In this article we shall focus on closed-loop FlowNMR setups for investigating batch processes, but many of the considerations discussed will be relevant to continuous flow application as well.26,27
A number of flow devices have been developed that allow a continuous stream of sample solution to be pumped through the NMR active region of the spectrometer,28–36 developments that actually date back to early days of NMR spectroscopy in the 1950s.37 Recent examples include the use of FlowNMR coupled with oxygen probes in the elucidation of the mechanism of amination reactions,38 the development of low-volume flow system containing biological organisms within the flow tip for solution-state in vivo NMR,39 the use of ultra-fast single scan 2D NMR in flow40 and the real-time monitoring of oxidative wastewater treatment.41 Whatever the application, key to obtaining NMR data relevant to the process occurring within the external vessel is an appropriately designed flow system (Fig. 1) that fulfils the following criteria:
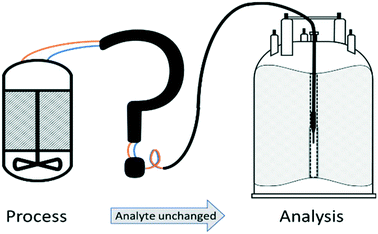 | ||
| Fig. 1 Schematic illustration of the engineering challenges associated with efficiently interfacing a reaction vessel with an NMR spectrometer. | ||
a) Full chemical compatibility – the system must not interact with the sample or disturb the system to be studied, and not cause any cross-contamination between different experiments. Conversely, the setup must withstand the conditions used and not be compromised by the application.
b) Provide reaction conditions with appropriate control over key process parameters – all physical parameters of importance to the system studied (light, temperature, pressure, atmosphere, etc.) must be sustained throughout the flow path to make the sample inside the NMR representative of the bulk.
c) Deliver a smooth, controlled sample flow throughout the system – minimise sample dispersion and risk of failures, and control any NMR flow effects42,43 that may influence signal quantification.
d) Safe to use – reliably safe to operate in a multi-user environment and without supervision with highly sensitive and expensive NMR equipment.
With these considerations belonging more to the realm of chemical reaction engineering,44 teams of molecular scientists and NMR spectroscopists seeking to use FlowNMR spectroscopy for a given application may lack the expertise and practical experience required for efficiently interfacing the reaction vessel with the spectrometer. Several groups have reported effective FlowNMR setups in the literature,4,23,41,45–52 but individual solutions differ depending on the specific requirements, and tribal knowledge is rarely shared with the wider community. A general difficulty is that the quality of the NMR spectra obtained are not always indicative of the effectiveness of the setup in fulfilling the above criteria (a–d). Most modern NMR spectrometers will produce high quality spectra even with an inappropriate flow setup that changes the sample on its way from the reaction vessel to the point of detection, so the key issue is how meaningful the data acquired is.
In this paper we highlight and discuss some fundamental engineering aspects of relevance to FlowNMR spectroscopy, evaluate some commonly used hardware solutions, and make recommendations based on our experience to help others to quickly identify appropriate components for safe and effective setups.
Please note that all devices and components used and discussed in this study are commercially available examples that do not necessarily represent the only possible solution or best choice for a given application. Any recommendations made are our personal opinion and do not guarantee safe operation or optimal performance. We invite interested readers to contact us with any questions, comments, or suggestions they may have.
Results & discussion
1. Selection of materials
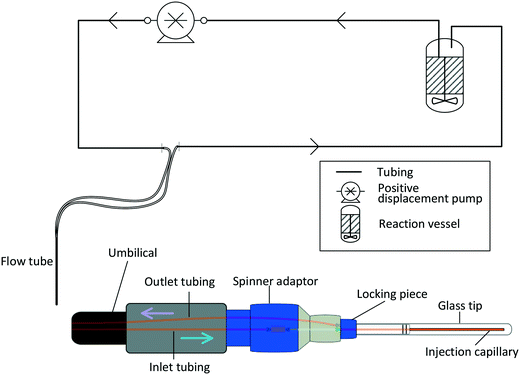
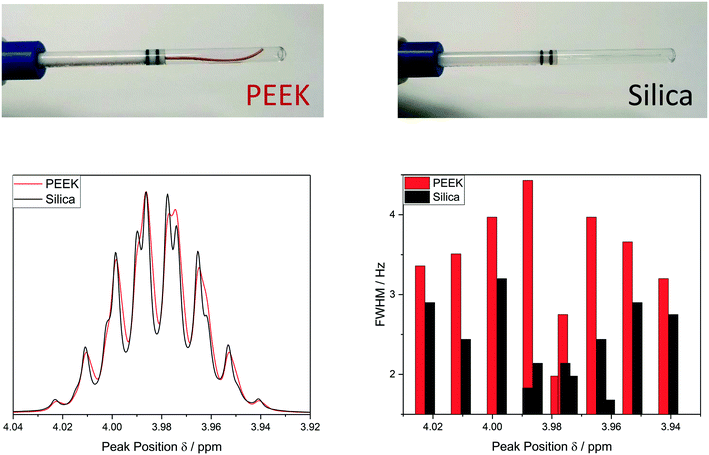
In its most basic form, a FlowNMR setup comprises a flow device to be used with the spectrometer, some small diameter tubing that creates a closed loop between the reactor and the flow device, and a pump that continuously circulates a portion of the analyte through the system. Fig. 2 illustrates an example using Bruker's InsightMR™ flow tube that may be inserted top-down into a standard NMR spectrometer with a 5 mm or 3 mm probe head. Its design is based on previously published in–out tube assemblies31,32,53,54 that inject the sample near the bottom of a cylindrical glass tube from where it flows upwards around the central injection capillary and out of the tube again. Alternative designs using flow-through cells and flow probes have been developed55–57 but few are currently commercially available.58–63 Characterisation of the sample flow within various flow cells has previously been investigated and will not be covered in this article focussing on the interface of flow device and sample vessel.64,65The tube head is made of PTFE (Teflon) and PEEK (polyether ether ketone) and connects to a flexible umbilical that houses the inlet and outlet sample lines within two larger, concentric Teflon tubings. A heat transfer fluid may be circulated through the latter, and an insulating foam outer layer minimises heat losses to the environment (see section 3) and allows safe handling of the heated flow tube.
The reaction vessel may be any container that suits the application, including simple glassware, multi-compartment cells, closed containers (e.g. Schlenk flasks), pressure reactors or even biological specimen. As the vessel is typically located beyond the stray field of the NMR magnet any ancillary kit required for process control such as overhead stirrers, heating elements, reflux condensers, dropping funnels, solid addition ports, membranes, electrodes, thermocouples, etc. may be used as usual. As long as appropriate mixing is provided to ensure that the sample withdrawn by the pump is representative of the mixture in the vessel at all times, the FlowNMR setup is also independent of scale and may be used with sample volumes from ∼5 mL (see section 2) up to multi-litre processes. The inlets and outlets of the sample transfer lines inside the vessel should be positioned and secured such that no short-cut of sample flow is possible (i.e. at maximum distance to each other, ideally with the mixing element in between), which depending on the application and reaction vessel type may be effected by different means such as clips, rubber seals, glass flanges and polymer or metal fittings.
| Material type | pH range | Temperature range/°C | Pressure rating with 1/16′′ OD and 0.5 mm ID/bar | Mechanical stability at 23 °C | Gas permeability at 25 °C/10−10 cm3 cm cm−2 s−1 cmHg −1 | ||||||
|---|---|---|---|---|---|---|---|---|---|---|---|
| Tensile strength/ksi | Elongation at break/% | Modulus of elasticity/ksi | Impact strength/ft-lb in−2 | CO2 | H2 | O2 | N2 | ||||
| PEEK74–76 | 0–14 | −51 to 100 | 345 | 14.00 | >50 | 594 | 1.57 | n.a. | 5.28 | 0.31 | 0.04 |
| PTFE77,78 | 0–14 | −40 to 150 | 48 | 4.00 | 300 | 58 | 3.00 | 6.8 | n.a. | n.a. | 1.0 |
| FEP71,76 | 0–14 | −51 to 50 | 138 | 2.90 | 250–330 | n.a. | No break | 5.9 | 1.3 | 14 | 2.0 |
| Vespel79 | 1–14 | ≤200 | 20 | 12.47 | 75 | 319 | 1.70 | 0.5 | 1 | 0.1 | 0.03 |
| Stainless steel (type 316)80–83 | 1–14 | −53 to 289 | 1089 | 97.61 | 35 | 24![[thin space (1/6-em)]](https://www.rsc.org/images/entities/char_2009.gif) 000 000 |
240 | — | — | — | — |
As can be seen from Table 1, most polymers have high pH tolerance but notably different pressure and temperature ratings. Their mechanical strengths and elasticities may be viewed as less important once a FlowNMR system is installed, but experience shows that rigid materials like PEEK are noticeably easier to handle and connect securely than the more ductile materials such as Teflon. If the assembly is to be frequently dismantled or reconfigured for different applications mechanical stability becomes relevant for ease of use and prolonging material lifetime.
An important consideration for applications with sensitive reagents and reactions under pressure is the gas permeability of the tubing material (see also section 3), combined with an appreciation that these values may increase when used at elevated temperatures when in contact with organic solvents that may swell the polymer.84 We also caution that the manufacturer values shown in Table 1 only apply to pristine materials at room temperature, and do not take into account any weakening due to bending, compression, accidental denting or scarring, and fatigue due to prolonged use. Virtually all polymers wear in flow applications and degrade to some degree over time due to a combination of chemical interactions and mechanical stress,68–70 especially when frequently taken to their limits of temperature, pressure or pH. Unexpected failures can have severe consequences for the user and the valuable equipment, so careful inspection and safety tests are recommended prior to every use, especially when involving harmful or toxic substances or when working with high pressures. Note that the values shown in Table 1 specifically refer to tubing examples with a wall thickness of 540 μm, and different limits apply to thinner or thicker variants.
As mentioned in the introduction, chemical compatibility is a key consideration for choosing the correct tubing material. Stainless steel for instance has a high risk of stress corrosion cracking where in contact with chlorinated solvents and will be attacked by most inorganic and organic acids.85,86 PEEK is prone to significant solvent uptake and swelling with methylene chloride, tetrahydrofuran and dimethyl sulfoxide,84 and Vespel is known to be incompatible with amines, dimethyl formamide and dimethyl sulfoxide.87–89 Many polymer compatibility tables can be found online (for an example see ESI† section 5.0), and in case of doubt confirmation should always be sought from the manufacturer. For studying photochemically active substances by FlowNMR it is important to note that while PTFE and FEP transmit visible light >340 nm90 Vespel, PEEK and stainless steel are non-transparent and protect the sample from UV-vis irradiation.
Another consideration for choosing an appropriate tubing material is the potential carry-over of compounds between different applications. For instance, we have found PEEK to be particularly prone to uptake of small amounts of polar substances such as water, short chain alcohols and acetone (as often used for cleaning) which may then leach back into subsequent applications. Finally, although rather rare, some tubing materials themselves can chemically alter the sample studied. Stainless steel for instance is known to be mildly oxidising and has been observed to trigger radical reactions with O2 and peroxides.86 Thorough control reactions checking the mutual compatibility of sample and flow system are thus recommended at the beginning of every FlowNMR investigation in order to generate meaningful data.
2. Volumes, internal diameters, and the importance of pressure drop
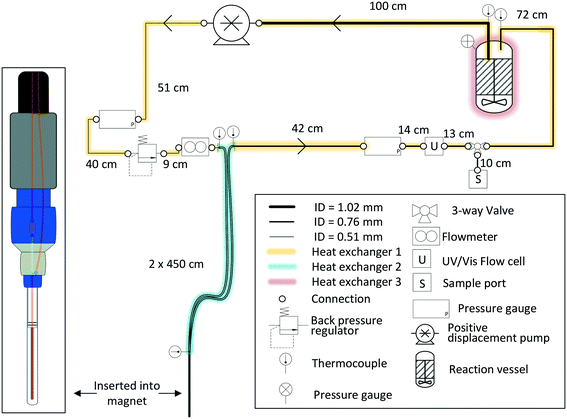
For most applications, the user will seek to minimise the amount of sample held inside the flow setup (i.e., the flow tube plus any ancillary tubing and pump) to have maximum control over the bulk of the sample inside the reaction vessel where conditions may be purposely altered or reagents added at a specific point in time. This is especially true for precious analytes and in cases where tight process control is required. As a rule of thumb, we usually scale reactions such that at least 2/3 of the sample reside inside the reactor at any time, which in most cases proves effective to make the reaction amenable to study by FlowNMR spectroscopy without affecting the kinetics or the speciation of the system in flow. Specific limits for acceptable volume ratios will depend on whether any analyte may respond to potentially different conditions inside the flow system as compared to the reactor (for example an overhead pressure of reaction gas versus dissolved gas in solution only) on the time-scale of its journey from the reactor and back, so absolute recommendations can unfortunately not be given. For fast reactions where delay and travel times may be critical, we recommend varying the flow rate during the experiment‡ to test if different species are observed as a function of the mean residence time of the sample in the flow system.Due to the size and geometry of high field NMR instruments (even those with shielded magnets) several metres of tubing are typically required for creating a closed loop FlowNMR setup connected to an external sample vessel. Length scales are thus dictated by local restrictions of how close to the magnet the setup may be placed and operated in a safe manner. Total path lengths of 8–14 m for the entire flow loop are common, but even setups with >20 m of tubing have been realised in laboratories where access to the NMR machine was more restricted. With a fume cupboard housing the reactor and pump about 1.5 m away from a shielded 500 MHz NMR magnet, our FlowNMR setup has a total path length of 12.4 m (Fig. 4).
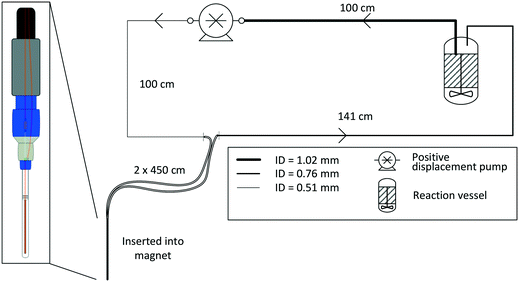 | ||
| Fig. 4 P&ID schematic of a closed-loop recirculating FlowNMR setup with exemplary length scales and tubing ID (indicated by line thickness). | ||
With the given internal volumes of the flow device§ and pump used (see also section 4), the main parameter to vary for reducing internal volumes is the tubing internal diameter. 1/16′′ and 1/32′′ OD HPLC tubing (the most common sizes used for small scale flow applications) are available with a range of internal diameters of 100–1000 μm.¶Table 2 compares some exemplary volumes, flow velocities, residence times and Reynolds numbers that these dimensions translate to for a tubing length of 10 m at a volumetric flow rate of 4 mL min−1.
| Tubing I.D./μm | Flow velocitya/m s−1 | Reynolds numberb | Internal volumec/mL | Residence timea,c,d/s |
|---|---|---|---|---|
| a For a volumetric flow rate of 4 mL min−1. b Range for common organic solvents at room temperature. c For a total tubing length of 10 m. d Theoretical values applying to the tubing only; see section 4 for residence time distribution analyses of complete FlowNMR setups. | ||||
| 100 | 8.5 | 600–2000 | 0.1 | 1.5 |
| 500 | 0.3 | 150–400 | 2.0 | 30 |
| 1000 | 0.09 | 50–250 | 7.9 | 119 |
Reynolds numbers for typical organic solvents are in the laminar flow regime for all dimensions shown in Table 2, and even low viscosity liquids like acetone would not flow turbulently at 4 mL min−1 through 100 μm ID tubing at room temperature (Re < 3000). It may thus seem that small tubing IDs would be best to minimise sample volumes and travel times. While this is true, we caution that the smaller the ID the higher the sensitivity of the setup to blockages from accumulation of solids which can cause loss of valuable experiment time (see also section 3.4). From our experience we recommend 500 μm as the minimum tubing ID that can be used efficiently with most liquids and commonly used pumps (see also section 4), but smaller IDs may be usable with appropriate precautions if required by the application. A practical limitation to minimising the tubing ID is the pressure drop (or flow resistance) generated by shear forces within the sample and with the tubing walls that need to be overcome by the pump. While such relatively low levels of hydrostatic pressure are unlikely to have a noticeable effect on sample composition or the NMR analysis, flow resistance places additional stress on the tubing, flow cell and all connections throughout the setup, in addition to contributing to pump wear.93–97 The Darcy–Weisbach equation allows calculating pressure drops of incompressible liquids flowing laminarly through a cylindrical pipe using empirically derived friction factors.98,99 For the conditions applying to the scales of FlowNMR setups (see Table 2), the equation can be rearranged to express the flow resistance (Δp) as a function of the flow rate (Q), the dynamic viscosity of the fluid (η), and the length (L) and internal diameter (DC) of the tubing (eqn (1), see ESI† section 7.0 for derivation).
 | (1) |
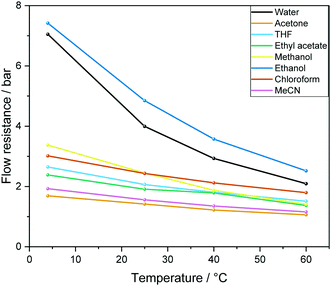 | ||
| Fig. 5 Calculated overall flow resistance (pressure drop) from 12.4 m PEEK tubing as detailed in Fig. 4 caused by a range of solvents at different temperatures at a flow rate of 4 mL min−1 according to eqn (1). | ||
We have found eqn (1) to be fairly accurate, and measuring the pressure drop of solvent flowing through the system thus serves as a reliable indicator for how healthy a FlowNMR setup is prior to use. Roughened internal surfaces from polymer degradation, kinks and bends in the flow path as well as ID restrictions from fitting compression all contribute to increased flow resistances. In our experience a FlowNMR setup functions well with up to 25% higher-than-ideal flow resistance values in practice, and monitoring the pressure drop of a setup over time serves as a useful indicator for developing blockages and progressive wear.
3. Devices and considerations for process control and safety
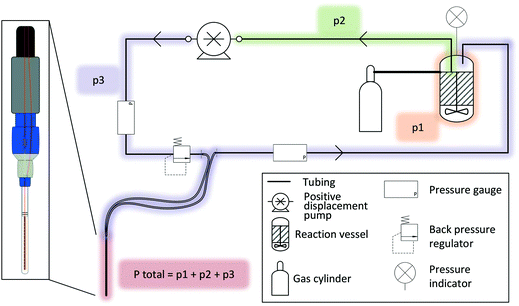
A FlowNMR setup bears many similarities to small-scale continuous flow synthesis setups for which similar engineering considerations apply.100,101 Indeed, many components useful for FlowNMR spectroscopy have become commercially available thanks to flow chemistry pushing the development and adaption of what used to be mere add-ons and consumables for high pressure liquid chromatography.When liquid phase reactions under a positive gas pressure are being investigated, an independent pressure sensor in the reactor headspace is recommended, as the total pressure in the setup will be the sum of any gas pressure applied to the reactor plus the pressure drop from the inherent flow resistance of the liquid travelling through the tubing (Fig. 6). It is important to know and monitor the highest pressure throughout the system in order not to exceed the safety limits of any components used. Compact digital pressure transmitters such as the A-10 model from WIKA (made of stainless steel and available with a range of seal materials for various pressure and temperature ranges) allow monitoring reactor headspace pressure at the point of use via a digital display while also logging the data on a computer (see section 5). A very useful safety feature that we warmly recommend for any FlowNMR setup is to add a back pressure regulator (BPR) to a T piece in the flow path directly before the most vulnerable section (in most cases the flow tube, whose glass tip typically has the lowest pressure rating of all components and would cause maximum damage in case of failure).102 A range of small-scale BPRs made of PEEK that connect to standard 1/16′′ fittings are available from various HPLC suppliers with a range of pressure ratings. Unlike bursting discs, spring-loaded BPRs close again after relieving any excess pressure without permitting air or moisture into the sample stream, so are an ideal choice for protecting both the valuable equipment and the sensitive sample during unsupervised long-term operation.
As mentioned in section 1, the various polymeric tubing materials used for FlowNMR setups have different gas permeabilities (see Table 1). This means that some degree of gas loss over time is to be expected from a pressurised FlowNMR setup via diffusion through the tubing wall. Fig. 7 exemplifies pressure loss with three different reaction gases as measured in the reactor headspace during an experiment that circulated toluene through the flow setup shown in Fig. 4 at room temperature.
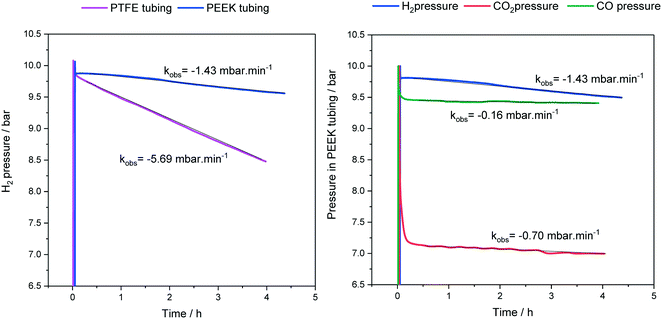 | ||
| Fig. 7 Headspace pressures and gas loss rates during continuous toluene circulation (15 mL) through the flow setup shown in Fig. 4 at 25 °C and 4 mL min−1. | ||
As can be seen from the results shown in Fig. 7, PTFE has a four times higher hydrogen permeability than PEEK, and H2 passes more easily through PEEK than CO and CO2 do. Note that the initial pressure drops in Fig. 7 reflect gas dissolution into the liquid phase and not diffusion through the tubing walls. The exact magnitudes of gas loss from a FlowNMR experiment will depend on the tubing wall thicknesses, solvent and temperature used, but the representative results in Fig. 7 show that noticeable pressure loss may occur during a FlowNMR experiment by way of diffusion even in the absence of any leaks. A 40% pressure loss may have significant effects on the kinetics of a hydrogenation reaction for example and potentially even change the speciation of the catalyst,46,103 so the choice of tubing material can be important in generating meaningful results from a FlowNMR investigation. As none of the polymer tubings we are aware of have negligible gas permeabilities like metal, headspace pressure drop curves measured during FlowNMR experiments do not necessarily correlate with the reaction progress seen in the liquid phase by NMR spectroscopy. Thus, reactions under gas pressure are best conducted with the reactor open to a gas cylinder or buffer vessel maintaining constant pressure throughout the experiment to simplify the kinetics. From a health and safety point of view, while most NMR laboratories are already equipped with oxygen depletion alarms for safeguarding against the risk of asphyxiation from He and N2 boil-off, the addition of portable sensors for hazardous gases is recommended for any FlowNMR applications using H2, CO and other toxic or flammable gases.
If the investment in a Coriolis flow meter cannot be justified, the maximum flow velocity of sample through a FlowNMR setup may alternatively be measured by one-dimensional velocity imaging experiments. Varying a deliberate diffusion delay imbalance (ΔΔ) during a pulsed field gradient experiment on a flowing solution of a paramagnetic relaxation agent such as [Cr(acac)3] allows quantification of sample flow in the z direction. Signals from species in solution acquire a phase shift proportional to their velocity and to ΔΔ, which gives rise to a loss of signal intensity for non-zero ΔΔ (Fig. 8, left). Fitting the integral data yields linear displacement velocities that may be used to correlate with the volumetric flow rate supplied by the pump (Fig. 8, right).104 Although not an absolute, independent measure of flow rate such as provided by a flow meter, these measurements may be used in conjunction with simple flow tests (using a graduated cylinder or analytical balance) to ensure pump linearity and flow rate consistency by NMR spectroscopy.
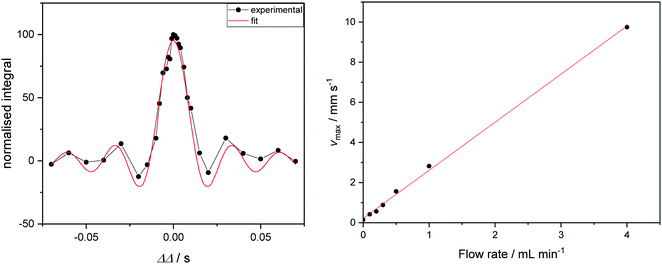 | ||
| Fig. 8 Left: Signal intensity as a function of ΔΔ for a flowrate of 1.0 mL min−1 (see ESI† for graphs of other flow rates). Curve fitting gives access to the maximum velocity. Right: Correlation of linear sample velocities derived from ΔΔ fitting with volumetric flow rates supplied by the peristaltic pump. | ||
Many FlowNMR setups include a bypass loop consisting of a short piece of tubing between the entrance and exit of the flow device that allows isolating the sample in the NMR spectrometer from the reactor for either more detailed analysis or safety reasons.42 While in principle a useful feature, we have found most multi-position valves used for manually selecting the sample flow path to have some slip (especially with heated samples under pressure) that increases with use over time, as the bypass offers the liquid a lower pressure drop pathway to being forced through the 9 m long flow tube. Having a part of the sample slipping through the bypass instead of flowing through the NMR is a potentially serious source of error that can be difficult to notice, and we thus we recommend either using high-grade pressure rated switching valves or simply omitting any bypass loops. In our experience, stopping the pump is just as easy and effective as switching the sample to flow through the bypass if needed.
 | (2) |
 | ||
Fig. 9 Cross-sectional diagrams of scenarios for no heat regulation (A), passive heat insulation (B), and active heat regulation (C). Models use 1/16′′ PEEK tubing, insulative foam and general-purpose silicone tubing filled with a 50![[thin space (1/6-em)]](https://www.rsc.org/images/entities/char_2009.gif) : :![[thin space (1/6-em)]](https://www.rsc.org/images/entities/char_2009.gif) 50 ethylene glycol/water mixture (see the ESI† section 9.0 for details). 50 ethylene glycol/water mixture (see the ESI† section 9.0 for details). | ||
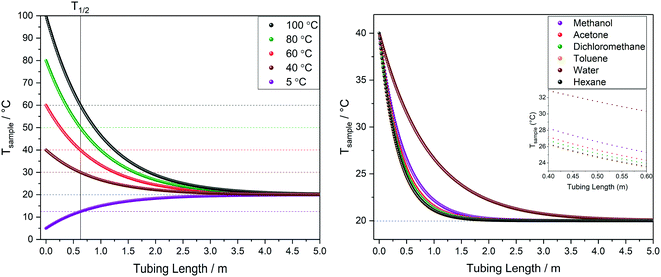 | ||
| Fig. 10 Left: Modelled temperature profile of water over tubing length at different starting temperatures. Right: Comparison of temperature profiles for different solvents starting at 40 °C. All at 4 mL min−1 flow rate through 1.6 mm OD/0.76 mm ID PEEK tubing in air at 20 °C (blue dotted line) corresponding to scenario A in Fig. 9. | ||
The calculated temperature profiles for uninsulated tubing in Fig. 10 show that most samples would experience complete heat loss to reach room temperature within 2–4 m of travel under these conditions (less than half the path length of a typical FlowNMR setup). Hence, if for example a sample aliquot left the reactor at 100 °C, with no insulation it will have cooled to room temperature before it reaches the NMR active region, causing significant convection and spectral distortion if the probe temperature is set to higher temperatures in anticipation of studying the reaction at 100 °C. Such temperature swings may also have negative effects on the sample itself, including a change of speciation, reaction rates or even homogeneity if any component is near their solubility limit under process conditions. As heat transfer between regions of different temperatures is a first-order process driven by ΔT, T1/2 values can be derived from the heat loss curves shown in Fig. 10 which may be useful metrics to remember: uninsulated 1/16′′ tubing will cause losing half the initial temperature difference within 30–60 cm for organic solvents or water flowing at 4 mL min−1.
The influences of tubing diameter, material type and wall thickness on heat transfer rates were found to be relatively small (Fig. S12†), but heat loss is directly proportional to the residence time of the sample as determined by the flow rate applied (Fig. 11, left). At 1 mL min−1 water will have lost half its initial temperature difference after 16 cm of travel and will have fully equilibrated with the environment after another meter (i.e. four times faster than at 4 mL min−1).
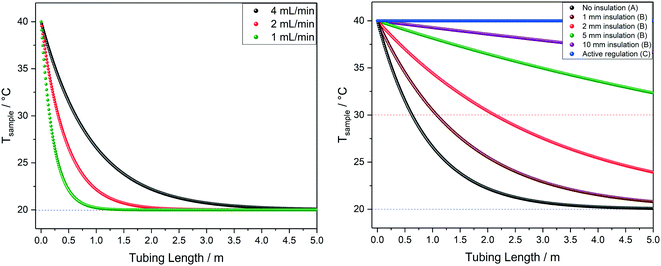 | ||
| Fig. 11 Left: Modelled temperature profiles of water at 40 °C flowing through 1.6 mm OD/0.76 mm ID PEEK tubing in air at 20 °C (blue dotted line) at various flow rates, corresponding to scenario A in Fig. 9. Right: Modelled temperature profiles of water at 40 °C flowing through 1.6 mm OD/0.76 mm ID PEEK tubing in air at 20 °C (blue dotted line) at 4 mL min−1 with different levels of insulation, comparing scenarios A, B and C from Fig. 9. | ||
Finally, Fig. 11 (right) shows the effect of adding various thicknesses of insulating foam around the sample tubing (passive insulation, scenario B in Fig. 9) compared to active heat regulation with a heat transfer fluid (C in Fig. 9). From the profiles shown it can be seen that 1 cm thick insulating foam can help to limit sample heat loss to the environment relatively well, but only active heat regulation provides steady and uniform sample temperatures throughout the flow path. As mentioned above in section 1, the InsightMR™ flow tube is set up for the use of a heat transfer fluid as depicted in Fig. 9 C, and we hope that the data shown here will convince users to make use of it and take appropriate heat management precautions for the rest of their FlowNMR setup as well. A large variety of recirculating heat exchangers with different bath volumes, pump capacities and temperature ranges are commercially available from suppliers such as Julabo, Huber, Lauda and Thermo Fisher. Simple water–ethylene glycol mixtures can be used from −50 to 100 °C,106 and synthetic oils based on polydimethylsiloxane offer wider temperature ranges of −100 to >250 °C if needed. Considering the relatively long tubing pathways of 10 m (or more) used in a typical FlowNMR setup, we recommend using several recirculating heat exchangers for different sections of the setup in order to minimise temperature gradients from heat loss of the thermofluid. Fig. 12 illustrates how we have used three independent circuits to regulate different sections of the setup: the sample vessel or reactor (red), the transfer tubing (yellow) and the flow tube (blue), in addition to the sample tip that is controlled by the NMR probe gas flow. Having independent temperature control over different sections of the flow setup also opens up possibilities for controlled temperature gradients that may be useful for resolving NMR spectral features that may be obscured by dynamic exchange phenomena at process temperature without causing spectral distortions by uncontrolled temperature gradients.107Fig. 13 illustrates the NMR spectral changes resulting from non-uniform sample heating throughout the flow path at 500 MHz.
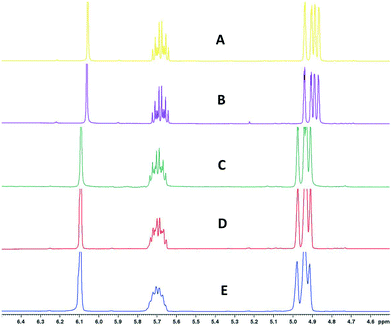 | ||
| Fig. 13 1H FlowNMR spectra of 1-hexene and 1,3,5-trimethoxybenzene at different heat regulation conditions. A) Entire FlowNMR setup at room temperature without heat regulation. B) Entire FlowNMR setup regulated to 25 °C with the three heat exchangers as shown in Fig. 12. C) Reactor (heat exchanger 3) at 50 °C, flow tube (heat exchanger 2) at 60 °C and sample tubing (heat exchanger 1) at 60 °C. D) Reactor (heat exchanger 3) at 50 °C, flow tube (heat exchanger 2) at 50 °C and sample tubing (heat exchanger 1) at 50 °C. E) Reactor (heat exchanger 3) at 50 °C, flow tube (heat exchanger 2) at 0 °C and sample tubing (heat exchanger 1) at 25 °C. | ||
Note that the perfect temperature stability of actively regulated sample tubing shown in Fig. 11 (right) is based on the assumption that any heat loss of the thermofluid to the environment is negligible during its residence time throughout the flow path. This is of course only true if the outer surface of the tubing is well insulated, and a sufficiently high flow rate of heat transfer fluid is applied to compensate for any loss. Quantitative heat transfer predictions become less accurate with increasing numbers of materials and interfaces, especially if some of the liquids flow in counter-current mode, so these scenarios become difficult to model accurately. However, due to the high mass ratio of heat exchange fluid versus sample used in the dimensions shown in Fig. 9 (C), the heat exchange fluid temperature becomes a valid approximation for the sample temperature in its core. Thus, monitoring the heat exchange fluid temperature throughout the flow path using a series of thermal sensors is a useful feature for ensuring appropriate process conditions. Metallic K-type thermocouples using a Ni–Cr/Ni–Al alloy combination that translate a thermal junction at their tip to an electrical voltage are a cost-effective and easy to use solution that provide sufficient precision for most FlowNMR applications (±1 °C after calibration). With their 1.5 mm OD and flexible nature they may be conveniently inserted into the thermofluid stream, sample flow and the reactor itself using 1/16′′ HPLC fittings. More precise resistive thermal detectors such as a Pt100 (with a precision of up to ±0.1 °C) may be used instead if needed, although they will require more careful fitting than thermocouples.
We have found that active heat regulation with three thermofluidic circuits along all sections of accessible tubing as shown in Fig. 12 combined with passive insulation using 1.5 cm thick foam on any exposed sections (such as connections to instruments or devices) works well to provide uniform sample temperatures with less than 10% variance throughout the fluid path. If available, thermal imaging with an infrared camera (nowadays available as add-ons for smartphones) is useful for locating any hot/cold spots, and help understanding any temperature changes the sample might experience on its journey through the setup for applications where accurate heat management may be important for reasons of reactivity, solubility or safety (see ESI† section 9.2 for examples). Absolute temperature differences between the values set on the heat exchangers and those within the circuit in the order of 5–20 °C may still prevail depending on how well insulated the heat transfer tubing is, but can easily be compensated for after verification of the sample temperature in the tip using the methanol or ethylene glycol NMR thermometer.108 Depending on whether high or low critical temperature limits apply to a given process (for reasons of exothermicity or solubility for example), heat regulation may be based on either the hottest or the coldest point of measurement throughout the flow path. From our experience, an absolute temperature accuracy of ±2 °C is achievable with the precautions described in this section.
4. Selection of pumps
A key component of an effective and reliable FlowNMR setup is a suitable liquid pump for circulating the sample through the system. Although perhaps deceptively simplistic to molecular scientists and spectroscopists, the correct selection, installation, use and maintenance of pumps is an area of reaction engineering of appreciable technical complexity. Due to the importance of pumps for industrial manufacturing109 a wealth of literature is available on applied aspects of large-scale pump installations,110–112 however, much less guidance is available for small scale specialist applications. The preceding sections have already touched on some considerations relevant to pump selection (flow rates, pressure drop, temperature and pressure), and a more detailed analysis and discussion will be provided in this section.Of the three major pump types centrifugal (CF), axial flow (AF) and positive displacement (PD) the latter is most suitable for controlled liquid delivery on small scale in accordance with the considerations (i–iv) above. Unfortunately, PD pumps are also the most diverse and complex class of pumps, and their performance heavily depends on their individual design and proper installation and use.114 In general, all PD pumps operate by repeatedly enclosing a small volume of liquid and moving it mechanically from the suction side (inlet) to the discharge side (outlet), intercepting the liquid stream temporarily with each cycle. This repeating motion can be provided by vanes, gears, diaphragms or pistons, and the fluid delivery is often assisted by one-way valves that ensure directionality of the flow against pressure differentials. The speed of the internal movement (stroke velocity) and the amount of liquid moved per cycle (displacement volume) determine the suction pressure on the sample at the inlet as well as the pulsation of liquid flow delivered through the outlet. With non-compressible liquids the flow is theoretically independent of pressure, as long as the pump drive is powerful enough to sustain the cycle. As the displacement volume is constant, the volumetric flow rate is independent of sample density and viscosity. Reciprocating PD pumps using diaphragms or pistons moving backwards and forwards tend to have larger displacement volumes and higher stroke velocities than rotary PD pumps using vanes or gears. Hence, the latter often have lower pulsation and suction pressure than the former but are more susceptible to wear and have a higher tendency of slippage.115
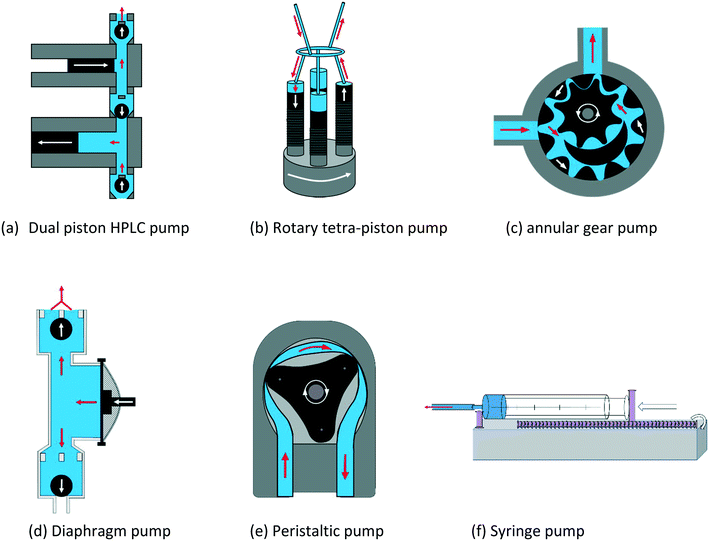
The PD pumps most commonly used for small scale laboratory applications include a) HPLC single or dual piston pumps, b) rotary multi-piston pumps, c) annular gear pumps, d) diaphragm pumps, and e) peristaltic tube pumps. Their principal components and functioning are illustrated schematically in Fig. 14. Note that linear PD pumps such as syringe pumps (f), which are ideal for metering applications and rapid injection devices as used in stopped-flow analyses, do not lend themselves for continuous sample recirculation in FlowNMR setups.116 However, as they deliver the smoothest flow of all PD pumps, a syringe pump is included in the following as a comparison.
As the individual advantages and limitations of these different PD pumps for use in FlowNMR applications are not immediately obvious, we compare some key characteristics using commercially available examples for each type in the following (Table 3).
| Pump type | Make & model | Flow range/mL min−1 | Temperature range/°C | Pressure limit/bar | Viscosity limit | Wetted materials |
|---|---|---|---|---|---|---|
| a Depending on syringe used. | ||||||
| HPLC (a) | Knauer Azura P 4.1S | 0.001–10 | −40–200 | 400 | 100 mPa | PTFE, titanium, sapphire, ceramic, FKM |
| Rotary multi-piston (b) | Vici M6 HP | 0.065–5 | 0–50 | 33 | 100 mPa | PTFE, PAEK, Valcon P, sapphire, Viton |
| Annular gear (c) | HNP-M mzr-6355 | 0.024–144 | −5–60 | 80 | 0.3–1000 mPa | Stainless steel, FFKM, FFPM, EPDM, SiC, Al2O3, ZrO2 ceramics |
| Annular mini gear (c) | HNP-M mzr-2921 | 0.03–18 | −20–60 | 3 | 0.3–100 mPa | Stainless steel, WC, Ni-based ceramics, epoxy resin |
| Diaphragm (d) | Tacmina QI-10-6T | 0.1–10 | 0–40 | 20 | 100 mPa | Stainless steel, PTFE, FFKM |
| Peristaltic (e) | VapourTec SF-10 V-3 | 0.02–10 | 0–60 | 10 | Solutions, suspensions, light slurries and gases | Red tube: FKM, ePTFEBlue tube: perfluororelastomer, ePTFE |
| Syringe (f) | Masterflex 74900-05 | 0.0001–4a | 5–40 | 1a | n.a. | PVCa |
Note that many of the models listed in Table 3 are available with different pump head materials that may be chosen to suit the chemical compatibility demands of the application. In some cases, these can easily be interchanged (like for the peristaltic pump (e)) whereas in most situations a separate pump head needs to be purchased. The larger annular gear pump (mzr-6355) is equipped with a powerful magnetically coupled drive to limit exposure of the internal mechanics to the sample, whereas the simpler model (mzr-2921) has a smaller direct drive. HPLC pumps naturally have the largest pressure range, followed by annular gear pumps and rotary piston pumps. Peristaltic pumps often have very low-pressure ratings due to their flexible tubing and plastic rollers but are least sensitive to solids and mixtures and offer minimal contact to wetted materials. Electrical heating mantles are available for both gear pumps (c), and a fluid heat exchanger module (allowing both heating and cooling) is available for pump (a). All other pumps operate at room temperature and may only be passively insulated with foam to minimise sample heat loss. In the following we will test and compare some key performance characteristics of (a)–(f) relevant to FlowNMR applications.
In addition to any height differences between the sample reservoir and the pump, the tubing between the two provides an intrinsic flow limitation that constitutes an important consideration during pump operation (i.e. even once fully primed). The pressure drop calculations from eqn (2) do not only apply to the discharge side as a flow resistance (section 2), but also to the suction side of the pump in the form of a suction resistance. The internal diameter and length of the suction path determine how much pull the pump exerts on the resting liquid at the flow rate applied. With the small internal dimensions, low sample viscosities and moderate flow rates typically used in FlowNMR setups it is not uncommon for this suction resistance to lead to outgassing of the liquid and even vaporisation of the solvent itself.** This process collectively known as cavitation (Fig. 14, left) means that some amount of vapour may enter the pump or form within it, leading to decreased flow rates and even pump wear.†† The net positive inlet pressure required (NPIP-R) is an important metric in pump engineering that defines the minimum fluid inlet pressure required to avoid cavitation.117 The NPIP-R of a PD pump setup is flow rate, temperature and solvent dependent, and suction-side pipework design must ensure a suitable safety margin referred to as net positive inlet pressure available (NPIP-A). NPIP-R thresholds can be calculated using eqn (2) if the limiting internal diameters and path lengths of the suction side are known, and comparing these to the vapour pressure lines of the lowest boiling component in the sample allows defining the NPIP-A under the conditions applied. Fig. 15 (right) contrasts two exemplary suction pressure curves for water and ethanol against their vapour pressure lines at various temperatures to illustrate NPIP-A and cavitation regimes, respectively. Note that the results shown assume stroke velocities no higher than the average flow rate selected and that there are no restrictions inside the pump smaller than the ID of the inlet tubing. Filters and check valves (as often used in HPLC and diaphragm pumps) may cause additional restrictions due to their small IDs and thus lead to higher NPIP-R thresholds. Similarly, if a PD pump has particularly high stroke velocities, the NPIP-R will inherently be higher.
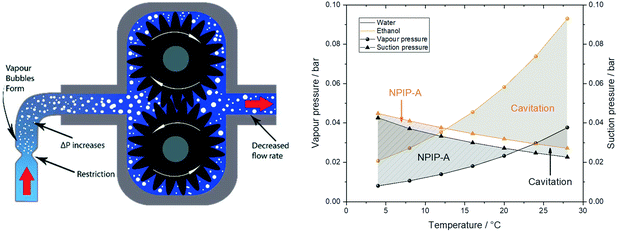 | ||
| Fig. 15 Left: Schematic illustration of a local suction resistance causing cavitation in a gear pump. Note that more extreme suction pressure differentials may cause complete sample evaporation that can lead to significant pump damage by imploding vapour bubbles and solids precipitating inside the pump. Right: Solvent suction resistance calculated for water and ethanol at ambient pressure and 4 mL min−1 through 1 m of 1 mm ID PEEK tubing using eqn (2)versus their vapour pressures at various temperatures.118,119 | ||
The values in Fig. 15 show that with the tubing IDs and flow rates typically used in FlowNMR setups one can easily get close to NPIP-R thresholds with moderately volatile solvents (with any pump). In order to limit the risk of cavitation and increase the NPIP-A margin for safe and effective pump operation during FlowNMR experiments requiring accurate and precise flow rates, several steps can be taken: i) minimise any undue restrictions in the suction side flow path, ii) use a maximum ID tubing of minimum length for the suction side, iii) operate pump below the fill level of the sample reservoir, iv) if using temperatures close to the boiling point apply an overpressure of inert gas on the sample reservoir. Our decision to use a 100 cm long inlet tubing of 1 mm ID on the suction side to our pumps (see Fig. 4 and 12) was motivated by such NPIP considerations and has greatly facilitated pump priming and use. We hope that this brief discussion of fluid pressure phenomena in PD pumps will be useful to other FlowNMR users and help avoid frustration over pumps not delivering any flow under conditions where it is physically impossible for them to work.
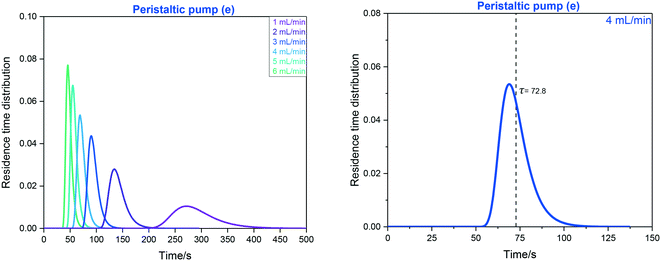 | ||
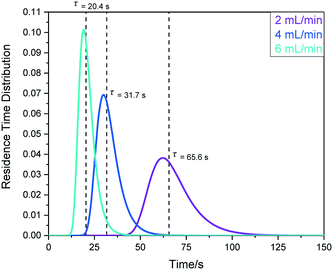
| Fig. 16 Left: RTD profiles of the FlowNMR apparatus shown in Fig. 12 with peristaltic pump (e) as derived from FlowUV-vis spectroscopy at 334 nm using 12 mM fluorescein in acetone as the marker in a step change displacement experiment. Right: Determination of mean residence time at 4 mL min−1. | ||
RTD profiles at higher flow rates are sharper and are shifted towards lower residence times than for lower flow rates, as expected for laminar plug flow (see Table 1). The mean hydrodynamic residence times τ derived from these measurements allow calculating the system total volumes via the volumetric flow rate applied. Using the syringe pump (f) attached to the entry of the system (without adding any internal pump volume) as a baseline result, the swept volumes of pumps (a–e) can be derived from their averaged τ values (Table 4).
| Pump | HPLC (a) | Rotary multi-piston (b) | Annular gear (c) | Annular gear (c) | Diaphragm (d) | Peristaltic (e) | Syringe (f) |
|---|---|---|---|---|---|---|---|
| Total internal volume of flow system | 4.78 mL ± 0.06 | 4.56 mL ± 0.03 | 6.80 mL ± 0.10 | 4.76 mL ± 0.06 | 6.10 mL ± 0.09 | 4.85 mL ± 0.03 | 4.41 mL ± 0.02 |
| Swept internal volume of pump | 0.37 mL | 0.15 mL | 2.40 mL | 0.36 mL | 1.70 mL | 0.44 mL | 0.00 mL |
As can be seen from the values in Table 4, our FlowNMR system including the InsightMR™ tube and all sensors and safety features as shown in Fig. 12 but without any pump has an internal volume of 4.4 mL. This is a typical value for FlowNMR setups, but systems with internal volumes of less than 2 mL have been realised for applications with precious samples using minimally short sections of small ID tubing and 3 mm glass tips.122 The additional internal volumes of the pumps (a–e) tested varied significantly, spanning the range from 150 μL to 2.4 mL, which is also reflected in the comparison shown in Fig. 17.
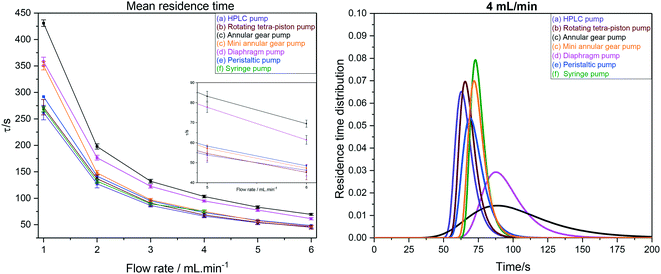 | ||
| Fig. 17 Left: Mean hydrodynamic residence times as derived from RTD measurements of the FlowNMR apparatus shown in Fig. 12 with pumps (a–f). Right: Comparison of RTD profiles of pumps (a–f) at 4 mL min−1. | ||
RTD peak shapes may be analysed for their degree of symmetrical broadening that are caused by shearing and diffusion by fitting a Gaussian to the curve.123 The fit peak width (= sample dwell time) is a measure for the degree of plug flow ideality, expressed by either the vessel number n of a theoretical cascade of infinitesimally small continuous stirred tank reactors (CSTRs) or the dimensionless Bodenstein number: the higher n or Bo, the more ideal the plug flow (for details see ESI† section 10.1 and 10.2). Fig. 18 (left) shows a comparison of vessel numbers for pumps (a–e) at various flow rates. It can be seen that all pumps struggled a bit at low flow rates but delivered relatively constant flow qualities above 2 mL min−1 (using acetone at room temperature), and that the HPLC pump (a), the rotary multi-piston pump (b) and the small gear pump (c) produced the most ideal plug flows (i.e. sharpest RTDs). Their vessel and Bodenstein numbers being close to those obtained with the syringe pump (f) show that (a–c) do not add significant amounts of RTD dispersion to the system, and that the values seen are the limitations of the tubing and flow tip used. Further improvements, if desired, would require streamlining the sample flow into and out of the tip of the flow tube42 which has previously been shown to cause dispersion as the sample expands from the narrow injection capillary into the 5 mm glass tube and then squeezes back through a small hole at the top leading into the outlet tubing. The peristaltic pump (e), the diaphragm pump (d) and the larger gear pump (c) added increasing amounts of back-mixing to the flow as shown by their significantly lower vessel and Bodenstein numbers. As a simple rule of thumb, the degree of sample back-mixing (or flow dispersion) induced by the various pumps broadly correlates with their swept internal volumes: the larger, the worse.
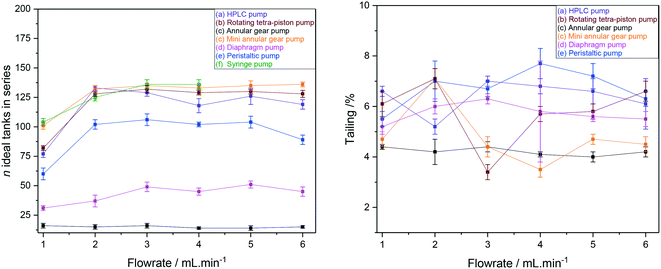 | ||
| Fig. 18 CSTR cascade vessel numbers for the FlowNMR setup shown in Fig. 12 with pumps (a–f) as derived from Gaussian fits of their RTD profiles (left) and sample tailing from surface area differences (right). | ||
The single RTD in Fig. 16 (right) shows some degree of unsymmetrical broadening towards longer residence times indicative of sample tailing (= longer dwell times), and the overlay of RTD curves from pumps (a–e) at 4 mL min−1 shown in Fig. 17 (right) suggests that the different pumps may induce various amounts of sample hold-up in addition to flow dispersion. Fig. 18 (right) however shows that the degrees of tailing relative to dispersion caused by the pump internal volumes are actually quite small and similar for all pumps investigated. Sample hold-up and tailing are thus not a major concern for selecting a suitable PD pump for FlowNMR systems under the conditions applied in this study.‡‡
For applications where compositional changes induced by deliberate changes to the sample in the reaction vessel (e.g. the addition of solid, liquid or gaseous reagents, application of an electrical current or irradiation with light) are to be followed by time-resolved FlowNMR spectroscopy, the transit time from the vessel to the tip of the flow tube is an important quantity to know. The same RTD measurements as carried out for the full system round-trip by UV-vis spectroscopy above can be performed by fast pulse NMR spectroscopy to gain sample RTD profiles from the reactor to the point of detection. Using a continuous series of single 30 degree pulses with minimal acquisition times allows measuring 1H NMR spectra of simple solvent mixtures every 400 ms, affording sufficient temporal resolution for RTD measurements (see ESI† section 10.1 for details). Fig. 19 shows some results obtained with the peristaltic pump (e) at various flow rates.
The mean hydrodynamic residence times show the internal volume of this section of the setup (in this case including pump (e)) to be in the order of 2.2 mL, giving a transit time (or sampling delay) of 32 seconds under typical flow conditions of 4 mL min−1. The observation that a similar amount of tailing was seen in this data as for the round-trip RTD results shown above (∼5%) confirms that most sample hold-up occurs within the flow tube tip itself.
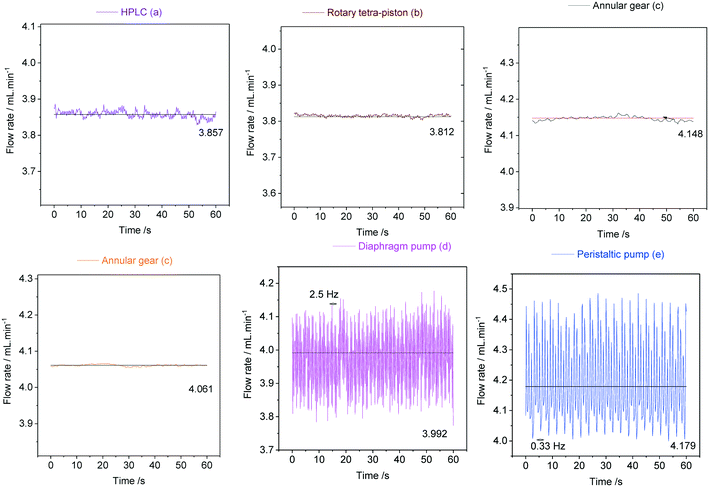
As can be seen from the data in Fig. 20, the peristaltic pump (e) produced the largest flow rate variations of ±14% with a steady frequency of 0.33 Hz at 4 mL min−1. This result was somewhat surprising given its circular motion and must be the result of the three heavy rollers ticking over during operation. The diaphragm pump (d) was less pulsed with flow rate variations in the range of ±9% at a higher frequency of 2.5 Hz, indicating a smoother but still noticeable heartbeat from the large Teflon membrane. The dual piston pump (a) afforded lower pulsations of ±0.6%, and the rotary tetra-piston pump (b) and the two annular gear pumps (c) produced the lowest flow rate variations of 0.3% at irregular (but insignificant) frequencies. These results were expected for (c) as discussed above, but (b) and (a) were also surprisingly good at limiting pulsation from their small, reciprocating pistons. Lower flow rates yield lower pulsation frequencies in all cases, and for some pumps even larger flow rate variations (see ESI† section 10.3 for details).
In order to demonstrate how such oscillations in sample flow may affect FlowNMR data, quantitative fast pulse 1H NMR measurements were carried out on neat solvent circulated with pumps (c), (d) and (e) at the same nominal flow rate. Absolute integral values as measured over time (uncorrected) are shown in Fig. 21.
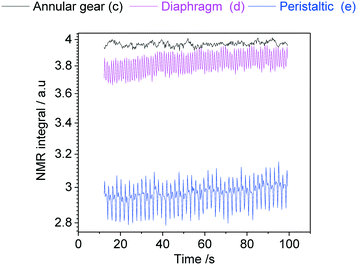 | ||
| Fig. 21 Absolute 1H NMR integral values of acetone flowing through the setup shown in Fig. 12 at a nominal flow rate of 2 mL min−1 at room temperature using different PD pumps. | ||
With an acquisition time of 0.25 seconds, the flow oscillations of the peristaltic pump (e) and the diaphragm pump (d) were clearly visible in the 1H FlowNMR integrals.40 Thus, if precise NMR data with a high acquisition rate is required, a high-precision pump with minimum pulsation must be used.
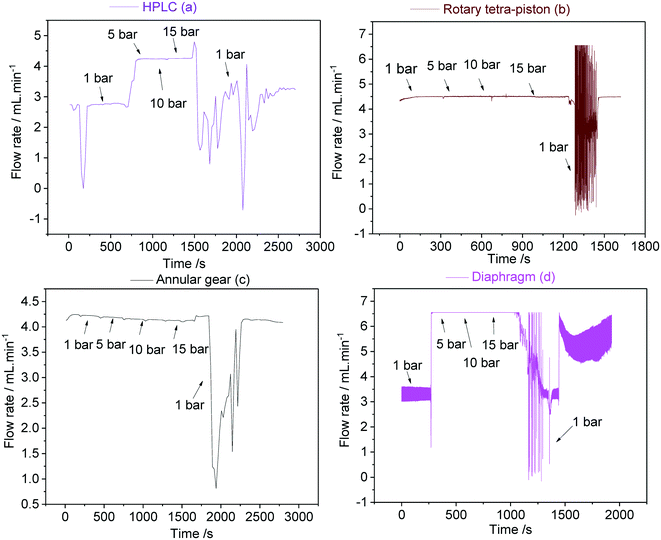
For most FlowNMR applications the pressure profile throughout the setup as a result of steady pump operation does not change significantly over time. However, in cases where a sample is to be analysed under variable pressure (e.g. from a reaction gas applied to the reactor headspace), the pump response to an increase or decrease of inlet pressure becomes an important factor.46,102,103Fig. 22 shows the variations in flow rates delivered by pumps (a–d) during pressure stepping between ambient and 15 bar as measured by a Coriolis flow meter.
Interestingly, both the double piston HPLC pump (a) and the diaphragm pump (d) showed a sharp increase in sample flow rates delivered when 5 bar of headspace pressure was applied, but no further changes when the pressure was raised further up to 15 bar. The initial increase was significant (54–66%) and probably reflected incomplete pump priming at the beginning of the experiment despite all best efforts to prevent this (see section 4.2). The sudden increase in inlet pressure expelled remaining gas pockets in the pump, leading to much higher-than-calibrated flow rates. These data show the difficulty of priming some reciprocating PD pumps with check valves and demonstrate what consequences this may have in FlowNMR applications under variable pressure: a sudden >50% increase in flow rate will lead to significant quantification errors due to changes in flow correction factors.42 Once fully primed both (a) and (d) did perform well under pressure though, so if this effect can be reliably excluded (either through pressurised priming procedures or an actively flow-regulated pump control loop) these pumps may be suitable for FlowNMR applications under variable pressure. The rotary piston pump (b) and the high pressure gear pump (c) did not show any sign of this behaviour (neither in the limited data shown here nor during any other applications for which we have used them), and delivered stable flow rates from ambient to 15 bar (Fig. 22). Thus, such pumps are both easier to use and more reliable for pressure applications. However, all pumps showed a large drop of liquid flow rate delivered upon depressurisation from 15 bar to ambient as the autoclave was slowly vented over the course of ∼60 seconds. Such pressure decreases lead to solvent outgassing throughout the system (sometimes bubbles be even observed in the tip of the flow tube) and cause cavitation inside the pump head that lead to significantly reduced and rather erratic flow rates until the pump has managed to expel all gas and reprimed itself. Care should thus be taken when decreasing gas pressures during a FlowNMR experiment with any PD pump, especially when using highly soluble gases such as CO2.
As a final remark on pump selection, we caution that depending on their design and wetted materials each pump requires specific operating and cleaning procedures. In addition to the general precautions against the build-up of solids suggested in section 3.4, we recommend adhering to the manufacturer's recommendations for regular pump maintenance and care (including periodic replacement of valves, seals, etc.).
5. Process automation and control
The focus of FlowNMR experiments naturally lies on the analytical data obtained from the spectroscopic measurement, and any accompanying process data may perhaps be regarded as less important. Although it is of course possible to assemble and use an effective FlowNMR setup with standalone components and passively operating devices only, the option of unifying instrument control and data logging via a computer system should be given due consideration.124 Although the more complex data streams coming from the NMR spectrometer can be difficult to integrate into a larger control software, the small instrumentation mentioned in this article all lend themselves to remote control and live read-out. Unifying instrument control electronically offers many advantages, including:- Retaining quantitative process information that may be relevant to the FlowNMR data (e.g., temperature and pressure profiles).
- Addition of meta-data to FlowNMR profiles (e.g., electronic timepoints marking the addition of reagents, stirrer or light source turned on, etc.).
- Higher degrees of process control via active self-regulation (e.g., use of a flow meter to control the pump, regulation of heat exchangers based on specific thermocouples, etc.).
- Automated alarm and safety mechanisms based on predefined process limits (T, p, even NMR results via live export of selected attributes).
- Remote monitoring and control of the system for unsupervised long-term operation.
A large (and increasing) number of interfaces and modules, as well as scripts and software packages are available either from the device manufacturers or from third party suppliers.125 Many small devices used for FlowNMR setups come with their own control software, although this is not the case universally. These software packages are typically simple to use, with the downside that the more pieces of equipment are integrated into the system, the more software packages need running, and the user needs to have a knowledge of all of these. We have thus found it useful to control, monitor and record within the same software package, and certainly from the same computer.
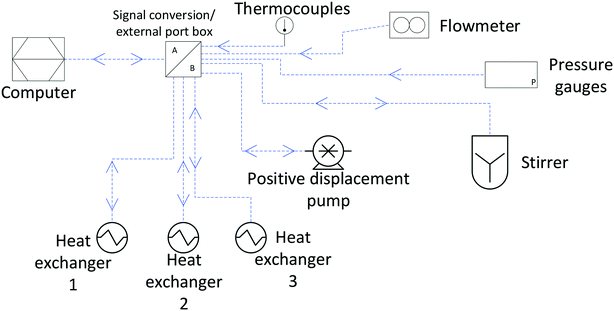
In our experience, National Instrument's LabVIEW presents an accessible graphical user interface (GUI) which is beneficial to general users once the program is established. For writing the so-called virtual interface (VI) there is a graphical coding mechanism that is relatively straightforward to use even for those researchers with a limited or non-existent coding background. We have also found that many vendors of small instrumentation have LabVIEW applications (sub-VIs) available for download, which can be integrated into a larger VI for unified instrument control and data logging, and manufacturers working to National Instruments suggested standards can provide certified drivers.126Fig. 23 illustrates the peripheral equipment in our system as connected to the main computer controlled via a single LabVIEW VI.
Alternative options include coding in the programmer's language of choice (e.g., Python), possibly incorporating single-board computers (a common example of which is the Raspberry Pi), or the use of MATLAB which is a common platform that many academic institutions will have licences for and experience using. Whatever software is being used, if the main computer is connected to a network we recommend turning off auto-updates from the operating system and minimise remote access permissions in order not to corrupt data collection and instrument control during an experiment.
It has been identified that accessibility of data, in terms of both standardisation and sharing, is important as we progress further into a digital world.127 Although many instruments will have different connections, communication frequencies and transmission standards, process and metadata collected through a unified control software such as LabVIEW allows exporting all relevant data in universal csv format at the desired temporal resolution. If tagged with an absolute time stamp from the operating system all profiles can easily be aligned for post-acquisition processing and analysis without compromising data storage and sharing.
The digitisation of chemical synthesis and particularly flow chemistry is well afoot,125 allowing researchers to study reactions in a more time-effective and data-dense manner. Automated laboratory equipment, self-optimisation tools128 and concepts such as cyber-physical twinning,129 are increasingly used to enable a variety of chemical research. It is useful to keep in mind other areas of areas of chemical digitisation which may be intertwined with FlowNMR analysis in order to facilitate progress. Self-regulating flow chemistry set-ups could be linked to FlowNMR where the spectral data generated could be used to dictate changes required to the system. An example of this possibility would be self-optimisation processes using PID controllers130 in a system where the required dosing of reagents is dependent on a certain chemical shift movement.
Conclusion
We hope that this review of some fundamental engineering aspects of small-scale flow setups and components of relevance to FlowNMR spectroscopy will be useful to other researchers for making informed choices on methods and materials to quickly assemble effective and safe setups that reliably generate meaningful data. Our own and others' experience have shown that there often is a certain learning curve when starting to use FlowNMR spectroscopy, but once overcome very insightful experiments and unique measurements become possible with this technique. In addition to obtaining valuable insights into the speciation of and interactions within complex, dynamic solution-phase systems in their native environments, a key advantage of a well-designed FlowNMR setup is the possibility of hyphenating the NMR analysis with other complementary online techniques using miniature flow cells and sampling ports for orthogonal analysis and comprehensive reaction monitoring that allows for signal verification and instrument cross-calibration. We believe there is much potential for such integrated setups in many areas of science and engineering, and many exciting applications await to be explored with advanced online analysis in real time.Conflicts of interest
The authors declare no conflicts of interest.Acknowledgements
This work was supported by the Royal Society (Fellowship UF160458), the EPSRC (Dynamic Reaction Monitoring Facility EP/P001475/1, Centre for Doctoral Training in Catalysis EP/L016443, Centre for Doctoral Training in Sustainable Chemical Technologies EP/L016354/1) and the University of Bath. We thank all of our industrial partners for their support (AstraZeneca, Bruker, CatSci, DSM, Johnson-Matthey, S-PACT and Syngenta) and particularly acknowledge the help of Anna Codina, Ian Clegg, Matteo Pennestri and Martin Hofmann (Bruker), Ted King (TgK Scientific) and Carsten Damerau (HNP Mikrosysteme). We also thank Pawel Plucinski and Jonathan Barnard for helpful discussions regarding heat transfer, and Vsevolod Zozin for assistance with data fitting and modelling. Our international colleagues David Foley (Pfizer, USA) and Michael Maiwald (BAM, Berlin) are acknowledged for many stimulating discussions and sharing of their FlowNMR experience.References
- T. D. W. Claridge, High-Resolution NMR Techniques in Organic Chemistry, Elsevier, Amsterdam, 3rd edn, 2016 Search PubMed.
- H. Günther, NMR Spectroscopy: Basic Principles, Concepts and Applications in Chemistry, Wiley-VCH, Weinheim, 3rd edn, 2013 Search PubMed.
- N. Saito, T. Komatsu, T. Suematsu, T. Miyamoto and T. Ihara, Anal. Chem., 2020, 92, 13652–13655 CrossRef CAS PubMed.
- D. A. Foley, E. Bez, A. Codina, K. L. Colson, M. Fey, R. Krull, D. Piroli, M. T. Zell and B. L. Marquez, Anal. Chem., 2014, 86, 12008–12013 CrossRef CAS PubMed.
- M. S. A. Tampieri, F. Medina and H. Gulyás, Phys. Sci. Rev., 2020, 6, 1–86 Search PubMed.
- E. M. Viviente, P. S. Pregosin and D. Schott, Mechanisms in Homogeneous Catalysis, ed. B. Heaton, Wiley, Weinheim, 1st edn, 2005, ch. 1, pp. 1–80 Search PubMed.
- A. Pastor and E. Martínez-Viviente, Coord. Chem. Rev., 2008, 252, 2314–2345 CrossRef CAS.
- J. U. Izunobi and C. L. Higginbotham, J. Chem. Educ., 2011, 88, 1098–1104 CrossRef CAS.
- V. Badilita, R. C. Meier, N. Spengler, U. Wallrabe, M. Utz and J. G. Korvink, Soft Matter, 2012, 8, 10583–10597 RSC.
- B. Ross, T. Tran, P. Bhattacharya, D. Martin Watterson and N. Sailasuta, Curr. Top. Med. Chem., 2011, 11, 93–114 CrossRef CAS PubMed.
- U. Holzgrabe, Prog. Nucl. Magn. Reson. Spectrosc., 2010, 57, 229–240 CrossRef CAS PubMed.
- A.-H. Emwas, K. Szczepski, B. G. Poulson, K. Chandra, R. T. McKay, M. Dhahri, F. Alahmari, L. Jaremko, J. I. Lachowicz and M. Jaremko, Molecules, 2020, 25, 1–63 CrossRef PubMed.
- L. A. Colnago, R. B. V. Azeredo, A. Marchi Netto, F. D. Andrade and T. Venâncio, Magn. Reson. Chem., 2011, 49, S113–S120 CrossRef CAS PubMed.
- E. Hatzakis, Compr. Rev. Food Sci. Food Saf., 2019, 18, 189–220 CrossRef PubMed.
- A.-H. Emwas, R. Roy, R. T. McKay, L. Tenori, E. Saccenti, G. A. N. Gowda, D. Raftery, F. Alahmari, L. Jaremko, M. Jaremko and D. S. Wishart, Metabolites, 2019, 9, 1–39 CrossRef PubMed.
- W. A. McGee and L. J. Parkhurst, Anal. Biochem., 1990, 189, 267–273 CrossRef CAS.
- N. A. J. Van Nuland, V. Forge, J. Balbach and C. M. Dobson, Acc. Chem. Res., 1998, 31, 773–780 CrossRef CAS.
- D. A. Foley, A. L. Dunn and M. T. Zell, Magn. Reson. Chem., 2016, 54, 451–456 CrossRef CAS PubMed.
- D. G. Blackmond, Angew. Chem., Int. Ed., 2005, 44, 4302–4320 CrossRef CAS PubMed.
- J. Burés, Angew. Chem., Int. Ed., 2016, 55, 16084–16087 CrossRef PubMed.
- M. V. Silva Elipe and R. R. Milburn, Magn. Reson. Chem., 2016, 54, 437–443 CrossRef CAS PubMed.
- W. G. Lee, M. T. Zell, T. Ouchi and M. J. Milton, Magn. Reson. Chem., 2020, 58, 1193–1202 CAS.
- A. Friebel, E. von Harbou, K. Münnemann and H. Hasse, Ind. Eng. Chem. Res., 2019, 58, 18125–18133 CrossRef CAS.
- D. Kreyenschulte, E. Paciok, L. Regestein, B. Blümich and J. Büchs, Biotechnol. Bioeng., 2015, 112, 1810–1821 CrossRef CAS PubMed.
- F. Dalitz, M. Cudaj, M. Maiwald and G. Guthausen, Prog. Nucl. Magn. Reson. Spectrosc., 2012, 60, 52–70 CrossRef CAS PubMed.
- J. H. Vrijsen, I. A. Thomlinson, M. E. Levere, C. L. Lyall, M. G. Davidson, U. Hintermair and T. Junkers, Polym. Chem., 2020, 11, 3546–3550 RSC.
- S. T. Knox, S. Parkinson, R. Stone and N. J. Warren, Polym. Chem., 2019, 10, 4774–4778 RSC.
- M. A. Bernstein, M. Štefinović and C. J. Sleigh, Magn. Reson. Chem., 2007, 45, 564–571 CrossRef CAS PubMed.
- A. Blanazs, T. W. T. Bristow, S. R. Coombes, T. Corry, M. Nunn and A. D. Ray, Magn. Reson. Chem., 2017, 55, 274–282 CrossRef CAS PubMed.
- D. A. Foley, C. W. Doecke, J. Y. Buser, J. M. Merritt, L. Murphy, M. Kissane, S. G. Collins, A. R. Maguire and A. Kaerner, J. Org. Chem., 2011, 76, 9630–9640 CrossRef CAS PubMed.
- C. A. Fyfe, M. Cocivera, S. W. H. Damji, T. A. Hostetter, D. Sproat and J. O'Brien, J. Magn. Reson., 1976, 23, 377–384 CAS.
- M. Khajeh, M. A. Bernstein and G. A. Morris, Magn. Reson. Chem., 2010, 48, 516–522 CrossRef CAS PubMed.
- M. Maiwald, H. H. Fischer, Y.-K. Kim, K. Albert and H. Hasse, J. Magn. Reson., 2004, 166, 135–146 CrossRef CAS PubMed.
- A. Scheithauer, A. Brächer, T. Grützner, D. Zollinger, W. R. Thiel, E. Von Harbou and H. Hasse, Ind. Eng. Chem. Res., 2014, 53, 17589–17596 CrossRef CAS.
- M. Bornemann, S. Kern, N. Jurtz, T. Thiede, M. Kraume and M. Maiwald, Ind. Eng. Chem. Res., 2019, 58, 19562–19570 CrossRef CAS.
- P. Giraudeau and F.-X. Felpin, React. Chem. Eng., 2018, 3, 399–413 RSC.
- G. Suryan, Proc. - Indian Acad. Sci., Sect. A, 1951, 33, 107–111 CrossRef.
- J. M. Merritt, J. Y. Buser, A. N. Campbell, J. W. Fennell, N. J. Kallman, T. M. Koenig, H. Moursy, M. A. Pietz, N. Scully and U. K. Singh, Org. Process Res. Dev., 2014, 18, 246–256 CrossRef CAS.
- M. Tabatabaei Anaraki, R. Dutta Majumdar, N. Wagner, R. Soong, V. Kovacevic, E. J. Reiner, S. P. Bhavsar, X. Ortiz Almirall, D. Lane, M. J. Simpson, H. Heumann, S. Schmidt and A. J. Simpson, Anal. Chem., 2018, 90, 7912–7921 CrossRef CAS PubMed.
- C. Jacquemmoz, F. Giraud and J.-N. Dumez, Analyst, 2020, 145, 478–485 RSC.
- B. Wu, R. D. Majumdar, D. H. Lysak, R. Ghosh Biswas, M. Tabatabaei-Anaraki, A. Jenne, X. You, R. Soong, D. Lane, P. A. Helm, A. Codina, V. Decker, M. J. Simpson and A. J. Simpson, Chem. Eng. Sci., 2021, 405, 1–11 Search PubMed.
- A. M. R. Hall, J. C. Chouler, A. Codina, P. T. Gierth, J. P. Lowe and U. Hintermair, Catal. Sci. Technol., 2016, 6, 8406–8417 RSC.
- A. Friebel, T. Specht, E. Von Harbou, K. Münnemann and H. Hasse, J. Magn. Reson., 2020, 312, 1–9 CrossRef PubMed.
- S. Simons, Concepts of Chemical Engineering for Chemists, Royal Society of Chemistry, Cambridge, 2nd edn, 2016 Search PubMed.
- A. M. R. Hall, R. Broomfield-Tagg, M. Camilleri, D. R. Carbery, A. Codina, D. T. E. Whittaker, S. Coombes, J. P. Lowe and U. Hintermair, Chem. Commun., 2018, 54, 30–33 RSC.
- J. Y. Buser and A. D. McFarland, Chem. Commun., 2014, 50, 4234–4237 RSC.
- P. A. Keifer, in Annual Reports on NMR Spectroscopy, ed. G. A. Webb, Academic Press, 2007, vol. 62, pp. 1–47 Search PubMed.
- M. V. Gomez and A. D. Hoz, Beilstein J. Org. Chem., 2017, 13, 285–300 CrossRef CAS PubMed.
- N. Zientek, K. Meyer, S. Kern and M. Maiwald, Chem. Ing. Tech., 2016, 88, 698–709 CrossRef CAS.
- J. Ollig and G. Hägele, Comput. Chem. Eng., 1995, 19, 287–294 CrossRef CAS.
- M. V. Silva Elipe, A. Cherney, R. Krull, N. Donovan, J. Tedrow, D. Pooke and K. L. Colson, Org. Process Res. Dev., 2020, 24, 1428–1434 CrossRef CAS.
- E. Luchinat, L. Barbieri, T. F. Campbell and L. Banci, Anal. Chem., 2020, 92, 9997–10006 CrossRef CAS PubMed.
- P. V. Yushmanov and I. Furó, J. Magn. Reson., 2005, 175, 264–270 CrossRef CAS PubMed.
- D. B. Green, J. Lane and R. M. Wing, Appl. Spectrosc., 1987, 41, 847–850 CrossRef CAS.
- J. Bart, A. J. Kolkman, A. J. Oosthoek-De Vries, K. Koch, P. J. Nieuwland, H. Janssen, J. Van Bentum, K. A. M. Ampt, F. P. J. T. Rutjes, S. S. Wijmenga, H. Gardeniers and A. P. M. Kentgens, J. Am. Chem. Soc., 2009, 131, 5014–5015 CrossRef CAS PubMed.
- A. Brächer, S. Hoch, K. Albert, H. J. Kost, B. Werner, E. von Harbou and H. Hasse, J. Magn. Reson., 2014, 242, 155–161 CrossRef PubMed.
- A. J. Oosthoek-De Vries, J. Bart, R. M. Tiggelaar, J. W. G. Janssen, P. J. M. Van Bentum, H. J. G. E. Gardeniers and A. P. M. Kentgens, Anal. Chem., 2017, 89, 2296–2303 CrossRef CAS PubMed.
- Flow NMR Probe, https://www.bruker.com/pl/products-and-solutions/mr/nmr/probes/Flow-NMR-Probe.html, (accessed 20/05/2021).
- FLOWTHRU CapNMR Probe, http://www.protasis.net/blog/?page_id=460, (accessed 20/05/2021).
- MICCS (MIcro Channeled Cell for Synthesis monitoring), https://www.jeol.co.jp/en/products/detail/MICCS.html, (accessed 20/05/2021).
- InsightMR, https://www.bruker.com/en/products-and-solutions/mr/nmr-pharma-solutions/InsightMR.html, (accessed 20/05/2021).
- NMReady-flow, https://www.nanalysis.com/nmready-flow, (accessed 20/05/2021).
- Reaction Monitoring, https://magritek.com/applications/reaction-monitoring/, (accessed 20/05/2021).
- F. Dalitz, M. Maiwald and G. Guthausen, Chem. Eng. Sci., 2012, 75, 318–326 CrossRef CAS.
- M. Kespe, E. Förster, H. Nirschl and G. Guthausen, Appl. Magn. Reson., 2018, 49, 687–705 CrossRef.
- V. Sans, L. Porwol, V. Dragone and L. Cronin, Chem, 2015, 6, 1258–1264 CAS.
- A. Friebel, E. von Harbou, K. Münnemann and H. Hasse, Chem. Eng. Sci., 2020, 219, 115561 CrossRef CAS.
- T. Moussa and C. Tiu, Chem. Eng. Sci., 1994, 49, 1681–1692 CrossRef CAS.
- M. J. Harding, S. Brady, H. O. Connor, R. Lopez-rodriguez, M. D. Edwards, S. Tracy, D. Dowling, G. Gibson, P. Girard and S. Ferguson, React. Chem. Eng., 2020, 5, 728–735 RSC.
- O. B. Searle and R. H. Pfeiffer, Polym. Eng. Sci., 1985, 25, 474–476 CrossRef CAS.
- Tubing Selection Guide, https://www.coleparmer.com/tech-article/tubing-selection-guide, (accessed 20/05/2021).
- I. T. Horvath and J. M. Millar, Chem. Rev., 1991, 91, 1339–1351 CrossRef CAS.
- N. J. Beach, S. M. M. Knapp and C. R. Landis, Rev. Sci. Instrum., 2015, 86, 104101 CrossRef CAS PubMed.
- PEEK Tubing, https://www.vici-jour.com/tubing/peek.php, (accessed 20/05/2021).
- L. Monson, S. I. Moon and C. W. Extrand, J. Appl. Polym. Sci., 2013, 127, 1637–1642 CrossRef CAS.
- Fluidic & optimcal products and information, https://www.idex-hs.com/wp-content/uploads/2018/07/Fluidics-and-Optics-Catalog.pdf, (accessed 20/05/2021).
- Choosing the Right Masterflex® Tubing Formulation, https://www.google.com/url?sa=t&rct=j&q=&esrc=s&source=web&cd=&ved=2ahUKEwiMkqeolbPxAhXDR0EAHZehD1UQFjALegQIEhAD&url=https%3A%2F%2Fpim-resources.coleparmer.com%2Fselection-guide%2F4248-mflex-tubing-selection-guide.pdf&usg=AOvVaw0EKiuZFOENzkxXIVrklqjm, (accessed 20/05/2021).
- Properties of PTFE and some other insulating materials, https://www.druflon.com/ptfeprop.html, (accessed 20/05/2021).
- Polyimide (PI) Material Information, http://www.goodfellow.com/E/Polyimide.html, (accessed 20/05/2021).
- All About 304 Steel (Properties, Strength, and Uses), https://www.thomasnet.com/articles/metals-metal-products/all-about-304-steel-properties-strength-and-uses/, (accessed 20/05/2021).
- Stainless Steel Seamless Tubing and Tube Support Systems, https://www.swagelok.com/downloads/webcatalogs/en/ms-01-181.pdf, (accessed 20/05/2021).
- K. A. Mohammad, E. S. Zainudin, S. Salit, N. I. Zahari and A. Ali, Adv. Mater. Res., 2013, 701, 77–81 Search PubMed.
- Stainless Steel: Tables of Technical Properties, https://www.worldstainless.org/Files/issf/non-image-files/PDF/Euro_Inox/Tables_TechnicalProperties_EN.pdf, (accessed 20/05/2021).
- Chemical Resistance of PEEK and Other Polymers, https://www.vici-jour.com/support/resistance.php#:~:text=PEEK%20is%20compatible%20with%20almost,may%20cause%20swelling%20in%20PEEK, (accessed 20/05/2021).
- S. M. Alves, F. K. Dutra-pereira and T. C. Bicudo, Fuel, 2019, 249, 73–79 CrossRef CAS.
- F. Loeker and W. Leitner, Chem. – Eur. J., 2000, 6, 2011–2015 CrossRef CAS.
- Chemical Compatibility Table, https://www.hoseflex.com/wp-content/uploads/2015/06/Chemical-Compatibility-Table.pdf, (accessed 20/05/2021).
- Chemical Resistance of Plastics, https://www.curbellplastics.com/Research-Solutions/Chemical-Resistance-of-Plastics, (accessed 20/05/2021).
- Chemical compatibility guide, http://www.hanwel.be/wp-content/uploads/2014/04/Chemical-Compatibility-Guide-090413-Deel-1.pdf, (accessed 20/05/2021).
- S. Tripathi, S. M. Haque, K. D. Rao, R. De, T. Shripathi, U. Deshpande, V. Ganesan and N. K. Sahoo, Appl. Surf. Sci., 2016, 385, 289–298 CrossRef CAS.
- S. X. Lu, P. Cebe and M. Capel, Polymer, 1996, 37, 2999–3009 CrossRef CAS.
- Periodic Table of The Analytical Fittings, https://www.idex-hs.com/wp-content/uploads/2019/09/IDX2904_PeriodicTable_Update_R2-FNL-LR.pdf, (accessed 20/05/2021).
- L. Tan, B. Zhu, S. Cao and Y. Wang, Sci. Bull., 2013, 58, 949–952 CrossRef.
- L. Friedel, J. Loss Prev. Process Ind., 1988, 1, 31–38 CrossRef.
- C. P. Holvey, D. M. Roberge, M. Gottsponer, N. Kockmann and A. Macchi, Chem. Eng. Process., 2011, 50, 1069–1075 CrossRef CAS.
- M. Ghobadi and Y. S. Muzychka, Exp. Therm. Fluid Sci., 2014, 57, 57–64 CrossRef.
- L. Brinkert, P. Paris, M. Renner, J. M. Espenan and P. Aptel, J. Membr. Sci., 1994, 92, 131–139 CrossRef CAS.
- F. P. Incropera and D. P. DeWitt, Fundamentals of Heat and Mass Transfer, Wiley, New Jersey, 5th edn, 2001 Search PubMed.
- G. O. Brown, Environmental and Water Resources History, ed. A. J. Fredrich and J. R. Rogers, American Society Civil Engineers, Washington, D.C., 2004, ch. 4, vol. 38, pp. 34–43 Search PubMed.
- M. B. Plutschack, K. Gilmore and P. H. Seeberger, Chem. Rev., 2017, 117, 11796–11893 CrossRef CAS PubMed.
- J. Britton and C. L. Raston, Chem. Soc. Rev., 2017, 46, 1250–1271 RSC.
- K. C. H. Tijssen, B. J. A. van Weerdenburg, H. Zhang, J. W. G. Janssen, M. C. Feiters, P. J. M. van Bentum and A. P. M. Kentgens, Anal. Chem., 2019, 91, 12636–12643 CrossRef CAS PubMed.
- A. Bara-Estaún, C. L. Lyall, J. P. Lowe, P. G. Pringle, P. C. J. Kamer, R. Franke and U. Hintermair, Faraday Discuss., 2021, 229, 422–442 RSC.
- I. Swan, M. Reid, P. W. A. Howe, M. A. Connell, M. Nilsson, M. A. Moore and G. A. Morris, J. Magn. Reson., 2015, 252, 120–129 CrossRef CAS PubMed.
- R. Wei, A. M. R. Hall, R. Behrens, M. S. Pritchard, E. J. King and G. C. Lloyd-Jones, Eur. J. Org. Chem., 2021, 2021, 2331–2342 CrossRef CAS.
- Ethylene Glycol Heat-Transfer Fluid, https://www.engineeringtoolbox.com/ethylene-glycol-d_146.html, (accessed 20/05/2021).
- D. B. G. Berry, A. Codina, I. Clegg, C. L. Lyall, J. P. Lowe and U. Hintermair, Faraday Discuss., 2019, 220, 45–57 RSC.
- D. S. Raiford, C. L. Fisk and E. D. Becker, Anal. Chem., 1979, 51(12), 2050–2051 CrossRef CAS.
- A. R. Bogdan and A. W. Dombrowski, J. Med. Chem., 2019, 62, 6422–6468 CrossRef CAS PubMed.
- P. S. M. E. Shashi Menon, Working Guide to Pumps and Pumping Stations, Elsevier, Amsterdam, 2010 Search PubMed.
- H. P. Bloch, in Pump Wisdom: Problem Solving for Operators and Specialists, Wiley, New Jersey, 2011, ch. 2, pp. 15–22 Search PubMed.
- M. Volk, Pump Characteristics and Applications, CRC Press, Boca Raton, 3rd edn, 2014 Search PubMed.
- E. W. Thorne and A. N. Neal, Proc. Inst. Mech. Eng., Part A, 2000, 214, 255–268 CrossRef.
- R. P. O'Connor, Positive Displacement Pumps: A Guide to Performance Evaluation, Wiley, New Jersey, 1st edn, 2007 Search PubMed.
- Pumps and systems: Gear Pumps: A Simple Solution for Metering Applications, https://www.michael-smith-engineers.co.uk/mse/uploads/resources/useful-info/Positive-Displacement-Pumping-Guides/Gear-Pumps-for-Metering-Applications.pdf, (accessed 20/05/2021).
- M. S. Cubberley and W. A. Hess, J. Chem. Educ., 2017, 94, 72–74 CrossRef CAS.
- Understanding Net Positive Suction Head, https://www.michael-smith-engineers.co.uk/mse/uploads/resources/useful-info/Positive-Displacement-Pumping-Guides/NPSHR-%26-it%27s-effect-on-Rotary-PD-Pumps.pdf, (accessed 25/05/2021).
- Liquid Dynamic Viscosity, http://ddbonline.ddbst.com/VogelCalculation/VogelCalculationCGI.exe, (accessed 27/05/2021).
- B. González, N. Calvar, E. Gómez and Á. Domínguez, J. Chem. Thermodyn., 2007, 39, 1578–1588 CrossRef.
- E. B. Nauman, Ind. Eng. Chem. Res., 2008, 47, 3752–3766 CrossRef CAS.
- O. Levenspiel, Chemical Reaction Engineering, Wiley, Danvers, 3rd edn, 1998 Search PubMed.
- R. Horst, K. A. Farley, B. L. Kormos and J. M. Withka, J. Biomol. NMR, 2020, 74, 509–519 CrossRef PubMed.
- H. S. Fogler, Elements of chemical reaction engineering, Prentice Hall, New Jersey, 3rd edn, 1999 Search PubMed.
- K. Meyer, S. Kern, N. Zientek, G. Guthausen and M. Maiwald, Anal. Chem., 2016, 83, 39–52 CAS.
- G. R. D. Prabhu and P. L. Urban, Chem. Rev., 2020, 120, 9482–9553 CrossRef CAS PubMed.
- Instrument Driver Guidelines, https://www.ni.com/devzone/idnet/library/instrument_driver_guidelines.htm.
- Digital Futures - A new frontier for science exploration and discovery, https://www.rsc.org/new-perspectives/discovery/digital-futures, (accessed 13/07/2021).
- A. D. Clayton, J. A. Manson, C. J. Taylor, T. W. Chamberlain, B. A. Taylor, G. Clemens and R. A. Bourne, React. Chem. Eng., 2019, 4, 1545–1554 RSC.
- C. Czwick and R. Anderl, Procedia CIRP, 2020, 90, 584–588 CrossRef.
- A. Kiam Heong, G. Chong and L. Yun, IEEE Trans. Control Syst. Technol., 2005, 13, 559–576 Search PubMed.
Footnotes |
| † Electronic supplementary information (ESI) available. See DOI: 10.1039/d1re00217a |
| ‡ Note that changing the flow rate may also affect flow correction factors required for accurate signal quantification. |
| § 3 mm glass tips can be fit to most flow tubes with a 0.8 mm O.D. injection capillary to reduce internal volumes but come at the expense of reduced NMR sensitivity when used with a standard 5 mm probe. |
| ¶ As pointed out in the discussion of Table 1, the individual temperature and pressure ratings for the respective tubing wall thicknesses should always be checked. |
| || Somewhat confusingly, in pump hydrodynamics and irrigation engineering the difference between the pump inlet level and the maximum height of water the pump can sustain in a vertical pipe at a given flow rate is historically referred to as the pump “head”. This practical measure is equivalent to the outlet pressure of the pump at that flow rate plus any positive inlet pressure from the fill level in the reservoir and is not to be confused with any mechanical parts of the pump. |
| ** Solvent degassing is thus a common procedure to limit this phenomenon in HPLC applications, but vaporisation cavitation cannot be prevented this way. |
| †† Gas entrainment into the suction side due to leaking seals or fittings is referred to as aspiration cavitation. |
| ‡‡ Note that these results have been obtained with an optimised flow setup and streamlined pump configurations that had all filters bypassed. Including these may yield significant dispersion and sample tailing that are not caused by the pump. |
| §§ Flow pulsation dampeners based on flexible diaphragms or bladders are available to smoothen out pump cycles, but due to their added internal volume and potential sample hold-up are not recommended for FlowNMR applications. |
| This journal is © The Royal Society of Chemistry 2021 |

